|
 |
North America Economic Research |
Will the US catch Dutch disease?
|
|
| |
| |
|
In economic parlance, Dutch disease isn't
something you catch in the streets of Amsterdam, but is rather an
economic malady whereby a country that has a natural resource boom
experiences weaker manufacturing activity. The causation runs
through the exchange rate: an increase in net exports due to
increased resource production should strengthen the value of the
country's currency. This, in turn, challenges the global cost
competitiveness of the country's factory sector, presenting a
structural headwind to industrial growth. The term got its name
from the experience of the Netherlands, which developed large
offshore oil and gas resources in the 1960s and 1970s, thereby
placing persistent upward pressure on the value of the guilder.
This currency strength was blamed for the slow decline of the Dutch
manufacturing sector.
The US is currently in the midst of its own
fossil fuel resource boom. Unlike the Netherlands, exports haven't
surged, however imports have declined, and so the directional
impetus to net exports is the same whether it's an increase in
exports or decrease in imports. Thus the currency implication
should be the same as the one diagnosed as Dutch disease. Of
course, the shale boom can impact domestic manufacturers in another
aspect as well: energy input costs should decline for US factories.
Qualitatively, the current energy production boom has two opposing
influences on the competitiveness of the American factory sector: a
stronger dollar should make US-made goods more expensive on global
markets, while lower energy costs should make American products
cheaper. Which of these two forces is more important is a
quantitative issue.
To address this we first need to develop an
estimate of the impact of the energy boom on the dollar.
Fortunately, our colleague in FX strategy John Normand has already
done that. In a recent piece ("American energy independence and the
dollar" 3/15/13) John notes a 1% reduction in the US current
account deficit lifts the trade-weighted dollar by 1.5%. In an
extreme scenario where domestic production soars enough to create
true energy independence, the support to the dollar would be about
3%. Full energy independence, however, is probably a best case
scenario. A more likely outcome in John's view is one which pushes
up the trade-weighted dollar by about 0.5%.
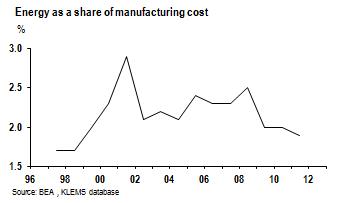
Energy accounts for 1.9% of total manufacturing
costs, according to the BEA's "KLEMS" data set. This means (by
applying a rule known as Shephard's lemma) that a 1% reduction in
energy costs should reduce total manufacturing costs by 0.019%. In
order for the decline in energy input costs to offset the loss in
competitiveness due to a 0.5% stronger dollar, total energy input
prices would have to decline by 26%. This might be a tall order:
over the past five years -- years in which energy production
increased significantly -- manufacturing energy input costs
increased by 2.5% annually. Even during the Great Recession, energy
prices for factories only fell by 16%. It would thus appear it's
possible the US could catch a very mild case of Dutch disease.
(While the net effect on output prices may be negative, both gross
effects are quite small). There are some potential mitigating
factors; for example, the KLEMS data does not consider
petrochemical feedstock as an energy input. However, the rough,
back-of-the-envelope calculations presented above indicate that
going from a partial equilibrium to a general equilibrium view of
the energy boom may alter the implications for US
manufacturing.
 |
|
(1-212)
834-5523
JPMorgan
Chase Bank NA
|
The research
analyst(s) denoted by an "AC" in this report individually
certifies, with respect to each security or issuer that the
research analyst covers in this research, that: (1) all of the
views expressed in this report accurately reflect his or her
personal views about any and all of the subject securities or
issuers; and (2) no part of any of the research analyst's
compensation was, is, or will be directly or indirectly related to
the specific recommendations or views expressed by the research
analyst(s) in this report.
Company-Specific
Disclosures: Important
disclosures, including price charts, are available for compendium
reports and all J.P. Morgan–covered companies by visiting https://mm.jpmorgan.com/disclosures/company,
calling 1-800-477-0406, or e-mailing research.disclosure.inquiries@jpmorgan.com
with your request. J.P. Morgan’s Strategy, Technical, and
Quantitative Research teams may screen companies not covered by
J.P. Morgan. For important disclosures for these companies, please
call 1-800-477-0406 or e-mail research.disclosure.inquiries@jpmorgan.com.
Confidentiality
and Security Notice: This transmission may contain information that
is privileged, confidential, legally privileged, and/or exempt from
disclosure under applicable law. If you are not the intended
recipient, you are hereby notified that any disclosure, copying,
distribution, or use of the information contained herein (including
any reliance thereon) is STRICTLY PROHIBITED. Although this
transmission and any attachments are believed to be free of any
virus or other defect that might affect any computer system into
which it is received and opened, it is the responsibility of the
recipient to ensure that it is virus free and no responsibility is
accepted by JPMorgan Chase & Co., its subsidiaries and
affiliates, as applicable, for any loss or damage arising in any
way from its use. If you received this transmission in error,
please immediately contact the sender and destroy the material in
its entirety, whether in electronic or hard copy format.
|
|