
Equity Strategy
USD, bond yields, oil and concentration all showing elevated risks remains a problematic backdrop
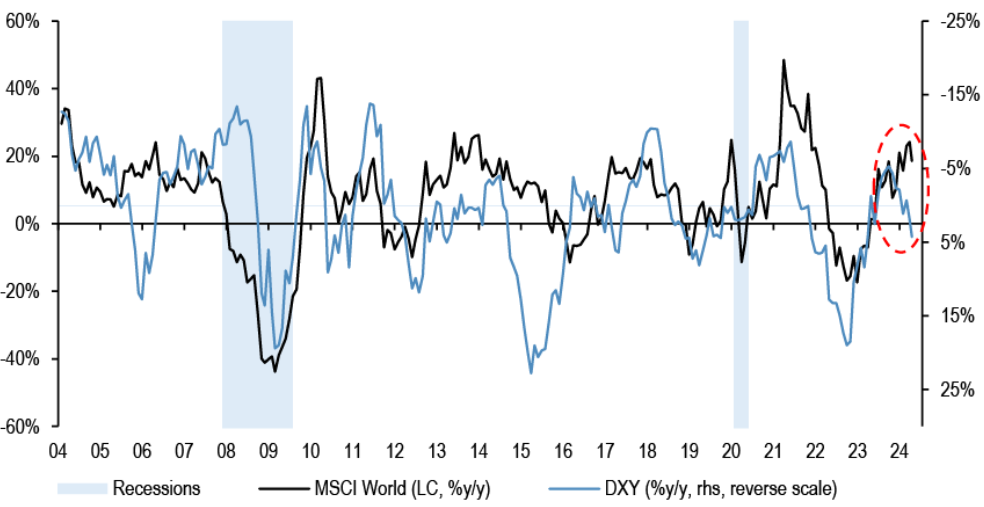
The ytd move higher in USD is consistent with weaker equity markets…
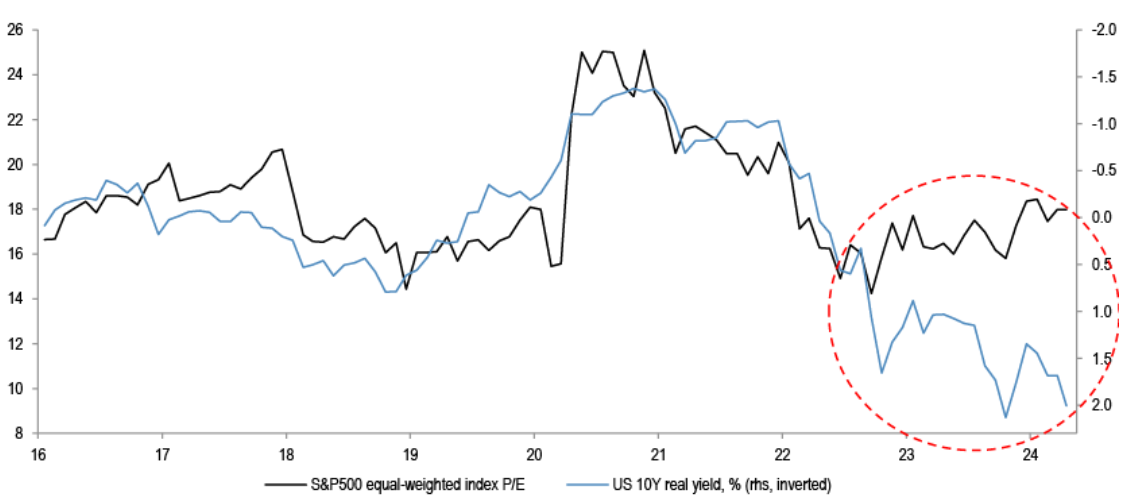
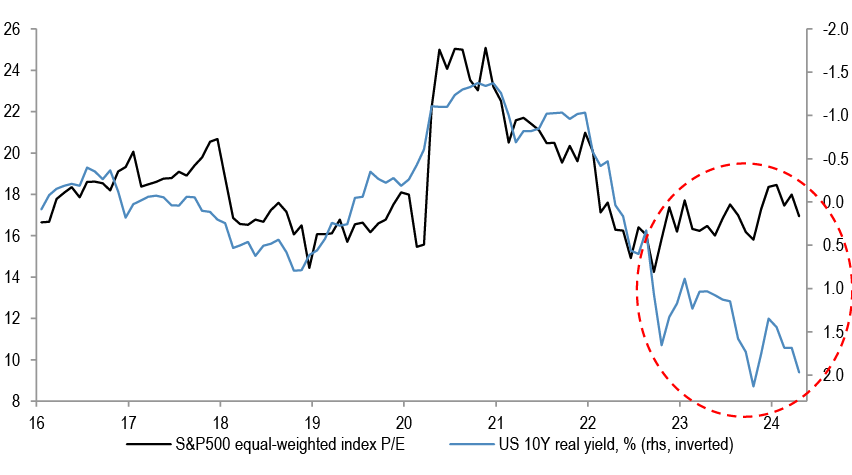
…bond yields rising from current levels should not be taken well by stocks… the P/Es vs real yields gap is already wide...
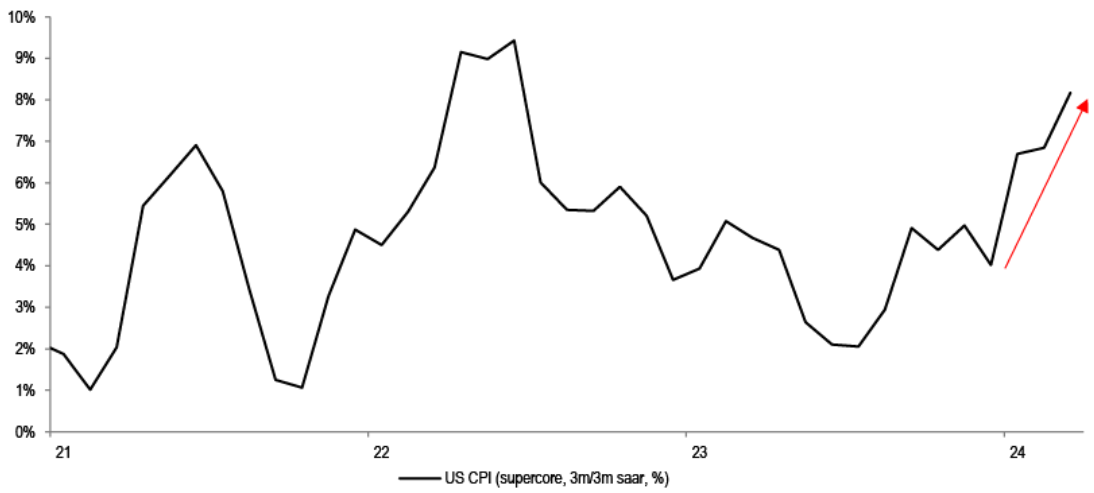
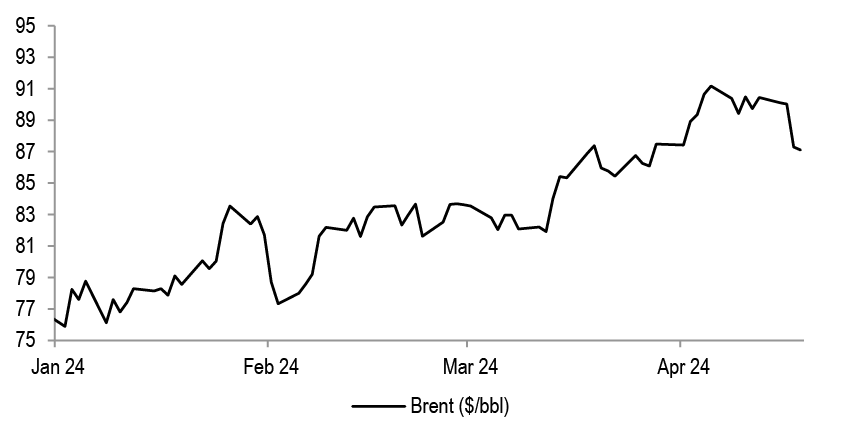
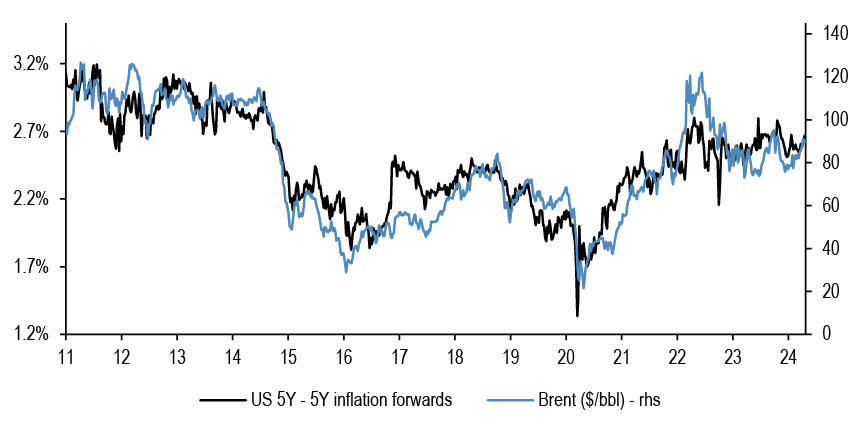
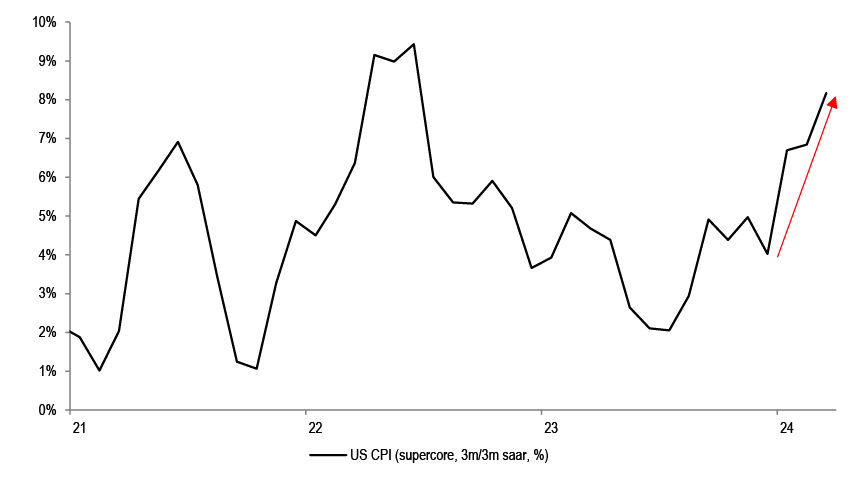
…oil price is up 15% ytd, and could pressure inflation expectations higher… US supercore CPI run rate is at 8%, approaching 2022 highs
Source: Datastream, Bloomberg Finance L.P.
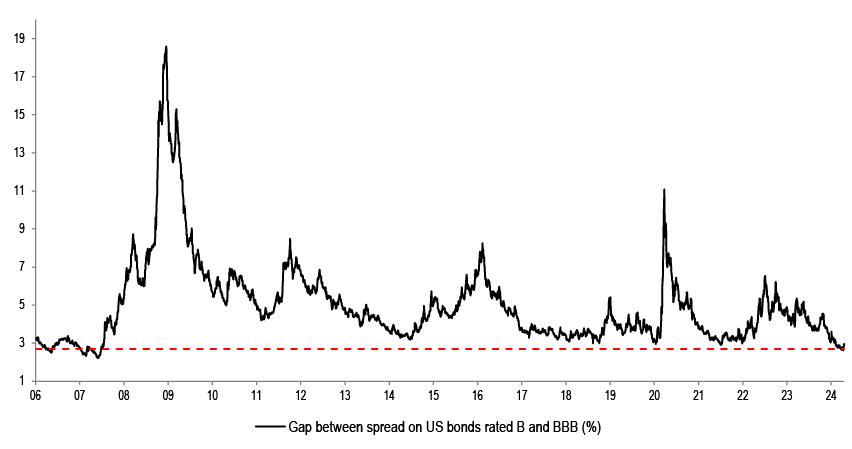
- The multiple expansion seen in past months, extremely low volatility metrics up to recently, tightest credit spreads since 2007, and the general inability by market participants earlier in the year to identify any potential negative catalysts for stocks are starting to shift.
- We remain concerned about continued complacency in equity valuations, inflation staying too hot, further Fed repricing, rates moving higher for the “wrong reasons”, about profit outlook where the implied acceleration this year might end up too optimistic, high market concentration, as well as about the potential further escalation in geopolitical uncertainty.
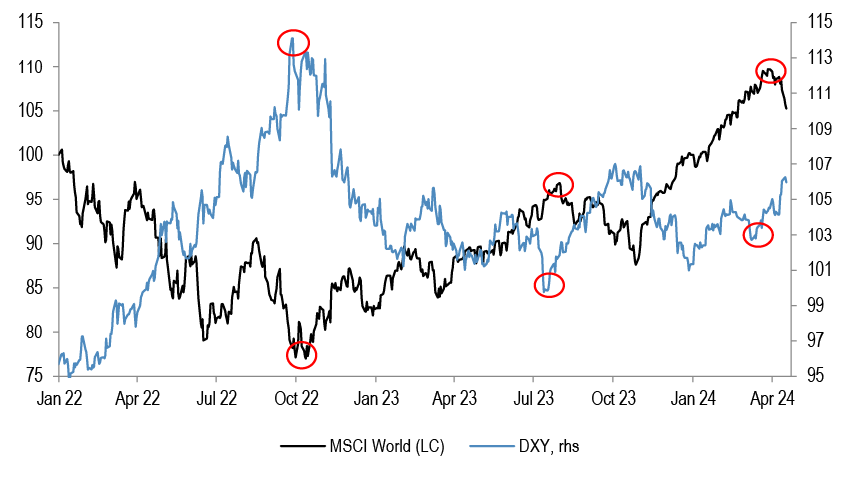
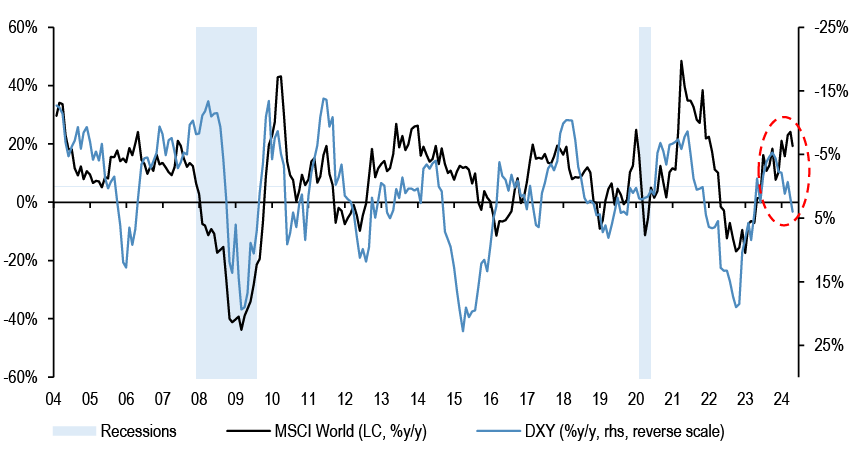
- USD advanced ytd, and that was historically a challenge for equities, with the two exhibiting a clear inverse correlation - see top chart. The gap that opened up so far this year, where equities rallied despite stronger USD, might end up closing.
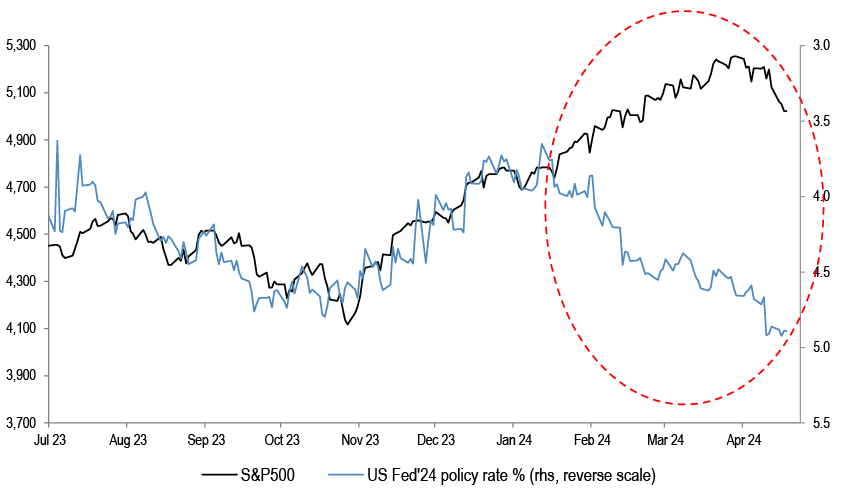
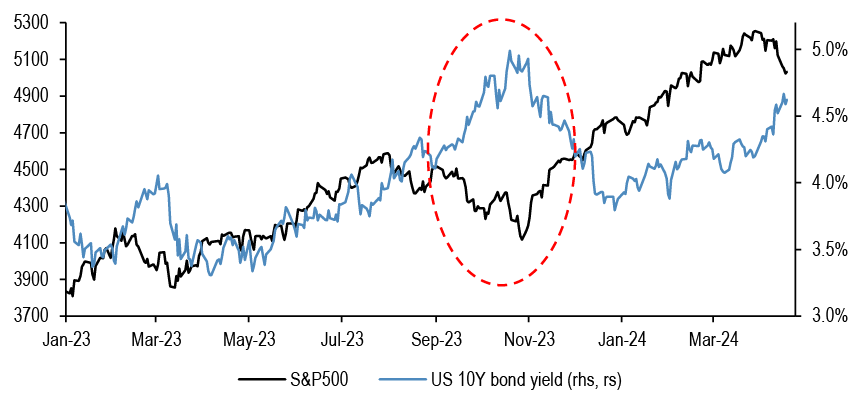
- This is in addition to Fed futures vs equities gap that we have been highlighting in past weeks. Last October, when S&P500 was at 4200, Fed was priced to cut rates 70-80bp this year. At the point of peak dovishness in January, this moved to as much as 180bp of cuts for 2024. Today’s market pricing of only 40bp of cuts is below the starting point of last October. Our view remains that bond yields going higher from current levels will not be taken well by the equity market, similar to what transpired last summer when S&P500 had a 10% drawdown. The P/Es vs real yields gap is already meaningful - middle chart.
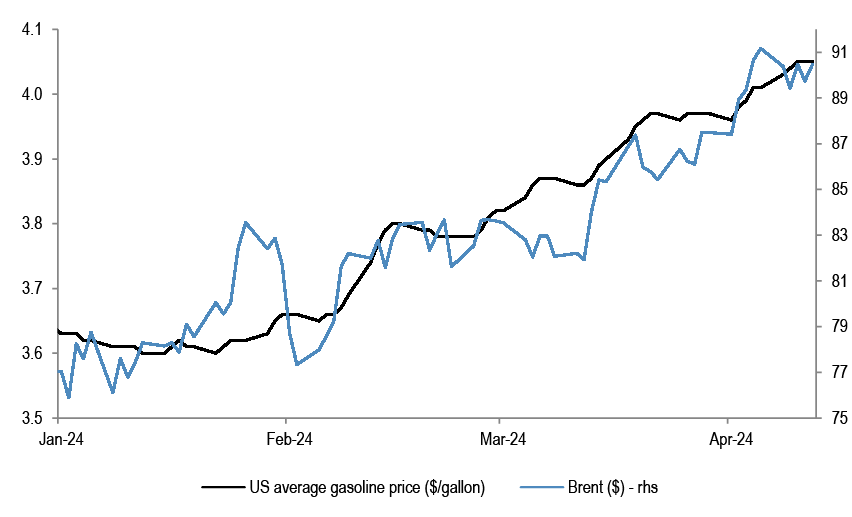
- Oil stabilized last week, but it is still up 15% ytd, and gasoline prices are increasing. While earlier in the year one could have ascribed energy appreciation to activity improvement, the most recent moves are mostly supply driven, and pricing in the increased geopolitical risk premia. This comes at a bad time, when the Fed’s declared victory over inflation, the call that Jan-Feb CPI move back up is transitory, could end up questioned. US Supercore CPI 3 month run rate is at 8%, nearing 2022 highs.
- Market concentration has been very high, and positioning extended, which are typically red flags, at risk of a reversal. Broadly, the combination of macro factors outlined above, any move higher in USD, yields or in Brent, together with continued elevated geopolitical uncertainty, increases the downside risks, and suggests that more Defensive trading should be appropriate.
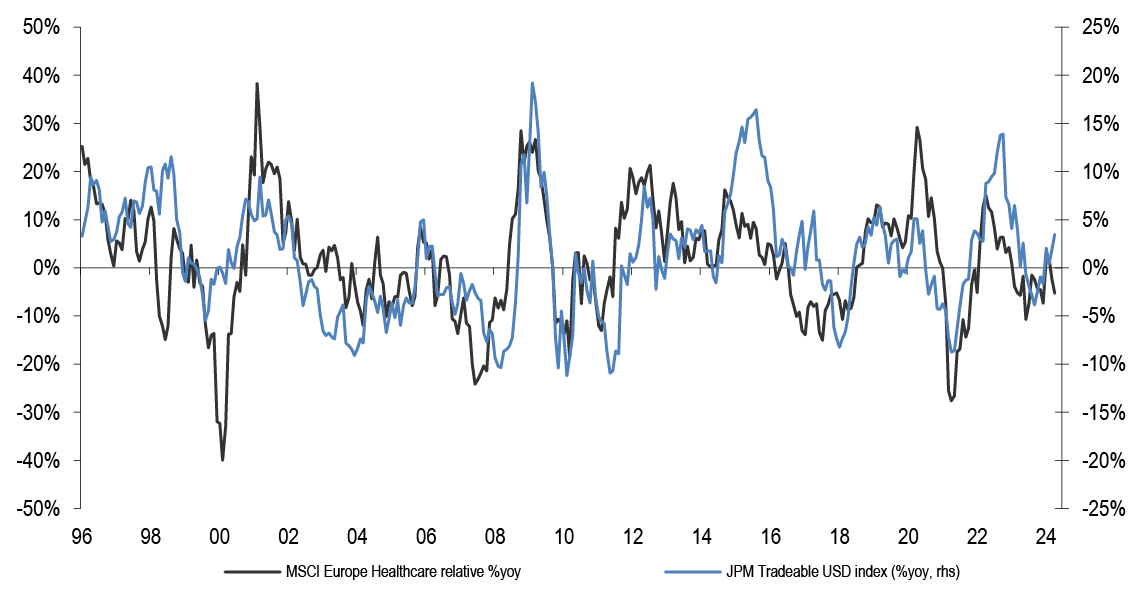
- We held a long-standing OW on Growth vs Value, OW Quality, and preference for Large Caps, alongside regional trades of OW US vs Europe and EM, even as we have this year tactically closed our bearish China call, and have in Q1 closed our US vs Eurozone preference. We stay with Quality, but Growth remains at risk of a reversal, and large caps are outperforming small everywhere again ytd. We argued recently that Defensives such as Utilities are likely to pick up even in the event of rising bond yields, as this might lead to lower beta trading. Healthcare tended to benefit from stronger USD. Some of the reduced beta has been in motion of late, alongside OW on Energy.
USD, bond yields and oil all moving higher remains a problematic combination
The Goldilocks narrative that the market embraced at the start of the year might get challenged...
Table 1: Key regions - Current vs Oct ’23 P/E and change in EPS
| Key regions | Current PE | Oct'23 PE | % change | % change in 12m Fwd EPS |
| Eurozone | 12.8 | 10.9 | 17% | 3% |
| US | 20.3 | 17.5 | 16% | 5% |
| World | 17.7 | 15.3 | 16% | 4% |
| Europe | 13.2 | 11.5 | 15% | 2% |
| UK | 11.2 | 9.9 | 14% | -5% |
| Japan | 15.1 | 13.9 | 9% | 10% |
| EM | 11.8 | 11.1 | 6% | 4% |
| China | 9.1 | 9.5 | -4% | 0% |
Source: IBES
Equities enjoyed a dramatic multiple expansion since October of last year, driven by pivot hopes.
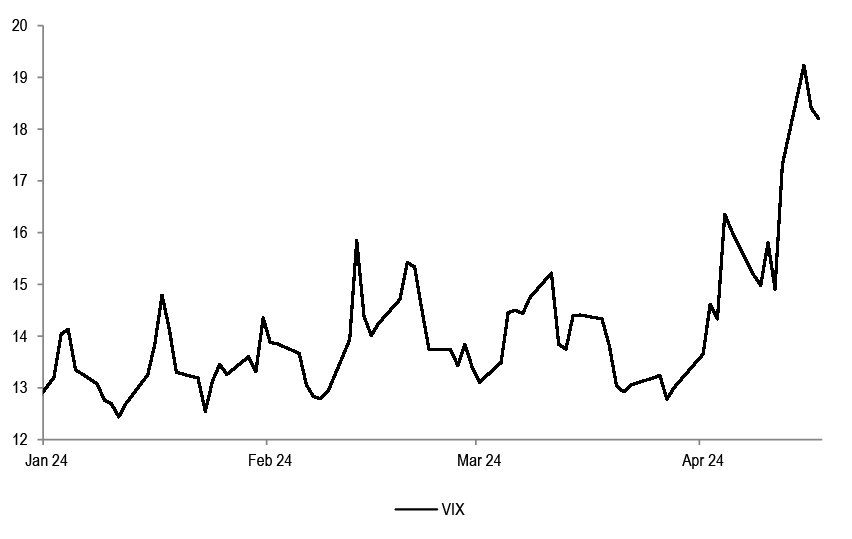
Figure 1: VIX
Source: Bloomberg Finance L.P.
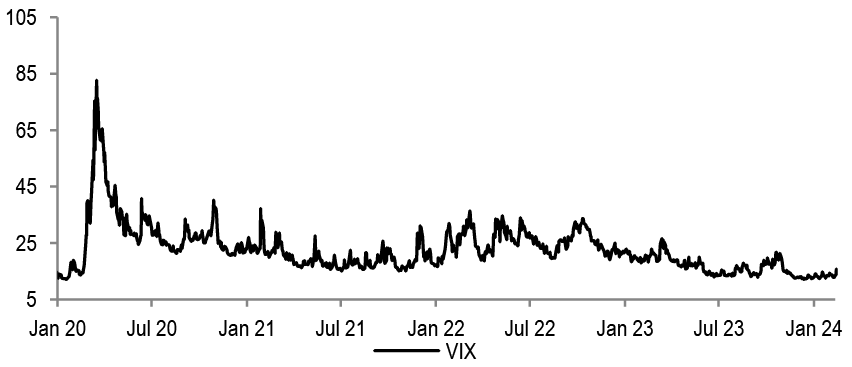
Until very recently, volatility was near record lows.
Figure 2: Gap between spread on US bonds rated B and BBB
Source: Bloomberg Finance L.P.
The spread between BBB and B bonds was close to the lowest levels since 2007, also indicating optimistic investor sentiment.
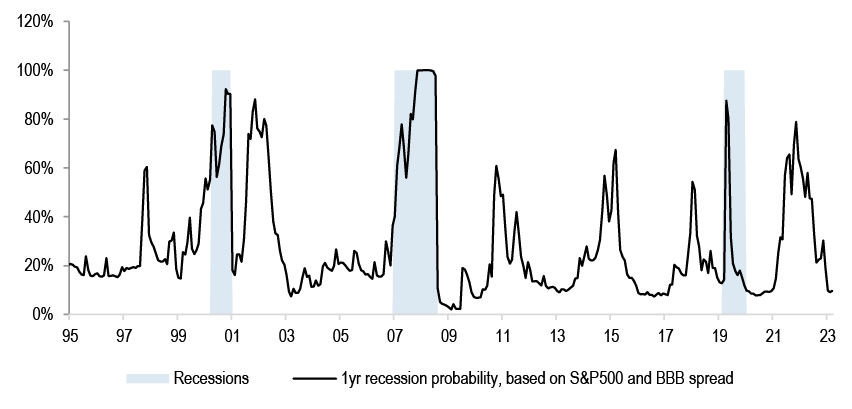
Figure 3: Recession probability indicator
Source: J.P. Morgan.
Similarly, our recession probability indicator showed that the market isn’t pricing in any meaningful risk of a downturn over the next year anymore.
...we worry about the complacency in equity markets
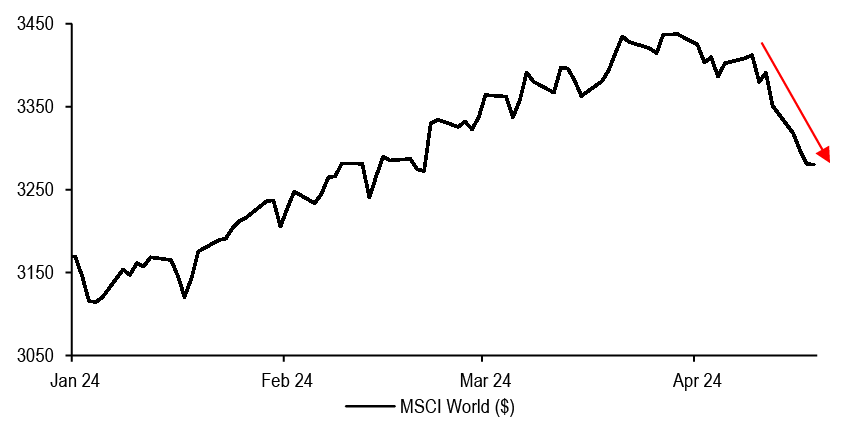
Figure 4: MSCI World ytd
Source: Bloomberg Finance L.P.
The positive market picture is starting to change. A combination of high inflation prints in the US and the rise in geopolitical tensions is contributing to this.
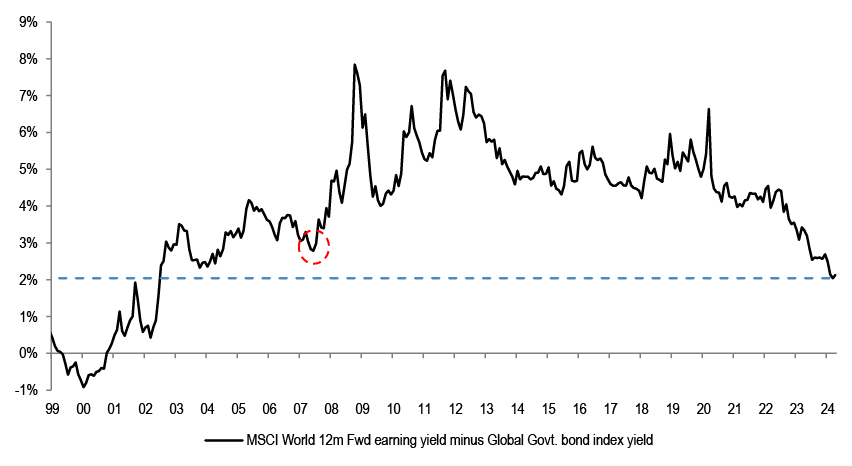
Figure 5: MSCI World 12m Fwd earnings yield minus Global Govt. bond index yield
Source: Datastream
Equities were stretched vs fixed income, with EY-BY gap the least attractive since 2007.
Figure 6: SPW 12m Fwd P/E and US 10Y real yield
Source: Bloomberg Finance L.P.
If bond yields move further up, that would not be positive for equities, especially given the already stretched valuation starting point.
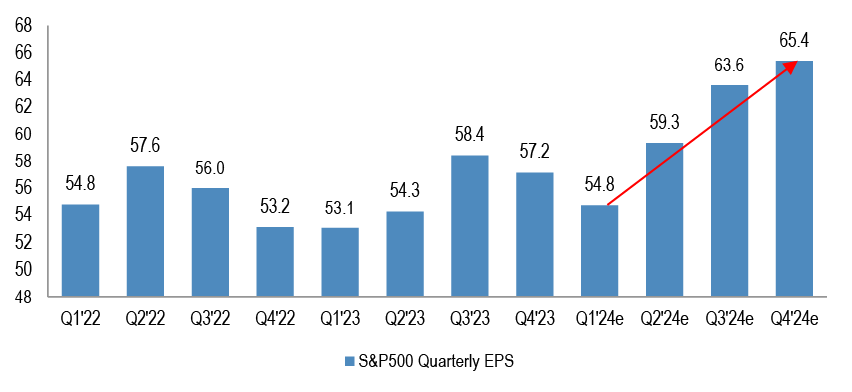
Figure 7: S&P500 Quarterly EPS expectations
Source: Thomson Reuters
We do not think that P/Es can drive further equity upside without the support of earnings upgrades. Investors are expecting S&P500 EPS to accelerate by almost 20% by Q4 compared to the projected Q1 ‘24 levels. That hurdle rate is too steep in our opinion.
A stronger dollar is usually a problem for equities
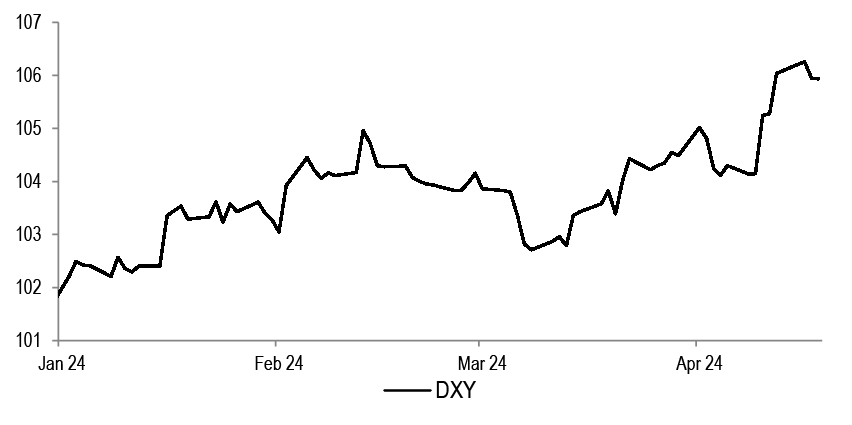
Figure 8: DXY
Source: Bloomberg Finance L.P.
USD had advanced so far ytd.
Figure 9: MSCI World and DXY since Jan’22
Source: Datastream, Bloomberg Finance L.P.
The peaks and troughs in the dollar have more or less coincided with the troughs and peaks in equities. Most recently, even though the dollar bottomed at the end of December, equities continued to rally.
Figure 10: MSCI World and DXY
Source: Bloomberg Finance L.P., Datastream
Historically, equities and the dollar exhibited a strong inverse correlation. In this context, the year-to-date divergence is quite notable. We believe that if the dollar continues to trend higher, equities will struggle.
Table 2: JPM DXY forecasts
| Forecast for end of | |||
| 18-Apr-24 | Jun 24 | Sep 24 | |
| DXY | 106.2 | 106.4 | 106.1 |
Source: J.P. Morgan.
JPM FX team is looking for stronger USD from here.
The gap between Fed futures and equities remains formidable
Figure 11: SPX and fed funds futures
Source: Bloomberg Finance L.P.
So far, the repricing in Fed expectations has been largely ignored by the market.
Table 3: Market expected Fed rate cut - Current vs Jan’24
| Meeting | 12th Jan'24 | Current |
| 01/31/2024 | 0 | - |
| 03/20/2024 | -21 | - |
| 05/01/2024 | -30 | -1 |
| 06/12/2024 | -32 | -4 |
| 07/31/2024 | -26 | -8 |
| 09/18/2024 | -25 | -11 |
| 11/07/2024 | -18 | -6 |
| 12/18/2024 | -17 | -12 |
| 2024 cumulative cuts | -169 | -42 |
Source: Bloomberg Finance L.P.
As of the 12th of January, the market was pricing in almost 170bp of cuts for this year. This dropped to just over 40bp at present.
Figure 12: SPX and US 10Y bond yield
Source: Bloomberg Finance L.P.
Our view is that a continued move higher in yields will be problematic for equities. Last year, when yields moved from 3.9% to 5%, S&P500 had a 10% drawdown.
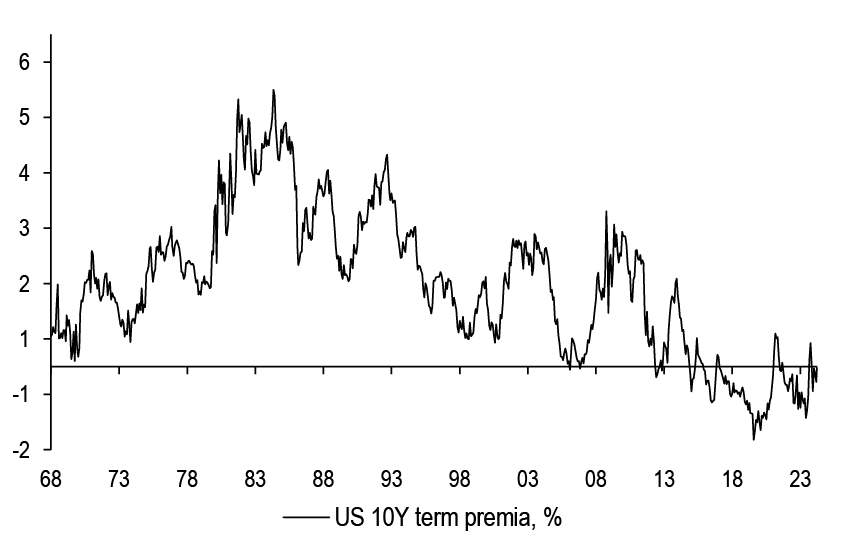
Figure 13: US 10Y Term Premia
Source: J.P. Morgan.
It is interesting to note that term premia is still negative, suggesting that most expect inflation to start moving lower once again. The risk of further disappointments remains high.
Higher oil prices could further delay the roll-back in inflation
Figure 14: Brent
Source: Bloomberg Finance L.P.
Oil prices are up almost 15% year to date. While earlier in the year oil prices moved up on account of more optimistic demand projections, the more recent rise is driven by supply considerations and rising geopolitical risk premia.
Figure 15: Brent and US Gasoline ytd
Source: Bloomberg Finance L.P.
US gasoline prices have broadly tracked the rise in oil prices.
Figure 16: Brent and US 5Y Inflation forwards
Source: Bloomberg Finance L.P.
Brent and inflation forwards exhibit a strong positive correlation. Inflation could remain sticky at or above current levels unless oil prices move lower.
Figure 17: US supercore CPI
Source: Bloomberg Finance L.P.
Indeed, super-core CPI in the US has gone up sharply year to date, approaching 2022 highs.
Narrow market breadth is likely to amplify any negative moves, together with elevated positioning
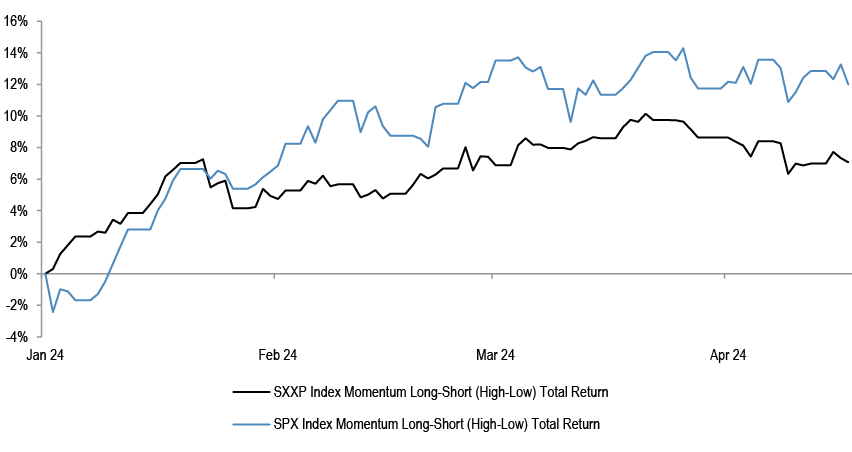
Figure 18: SPX and SXXP Momentum factor
Source: Bloomberg Finance L.P.
Momentum factor has been performing extremely well in both Europe and the US ytd.
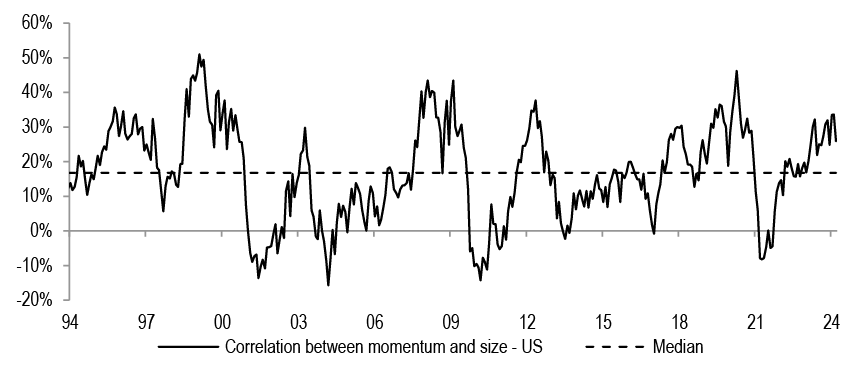
Figure 19: Correlation between momentum and size - US
Source: JPM US Equity Strategy
The correlation between momentum and size factors is at elevated levels, suggesting that stocks with bigger index weights are driving the momentum rally.
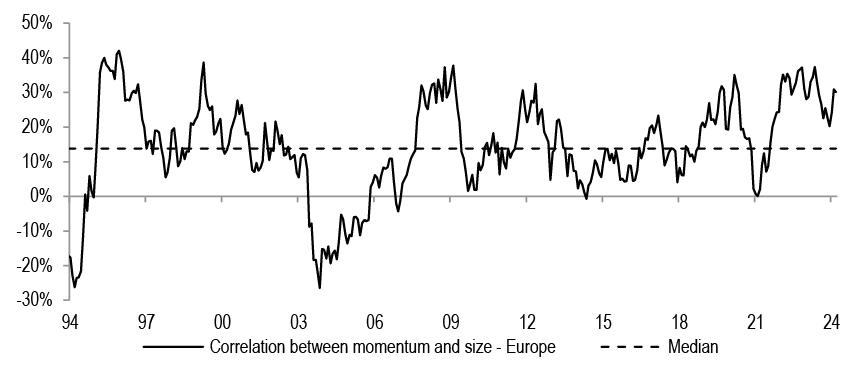
Figure 20: Correlation between momentum and size - Europe
Source: JPM US Equity Strategy
This is true for Europe as well, although not to the same extent.
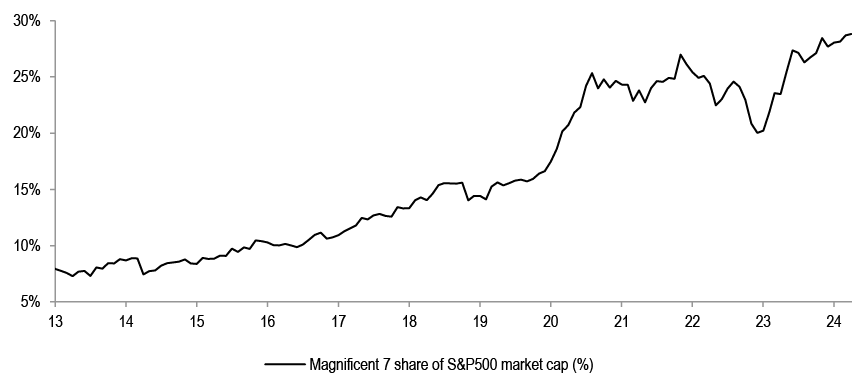
Figure 21: Magnificent 7 share of S&P500
Source: Datastream
Top 7 stocks in the US account for almost 30% of market cap currently. We believe this is relatively unhealthy setup for the market. If momentum factor starts unwinding, it is likely to drag the overall market lower given the weight of underlying stocks in that cohort.
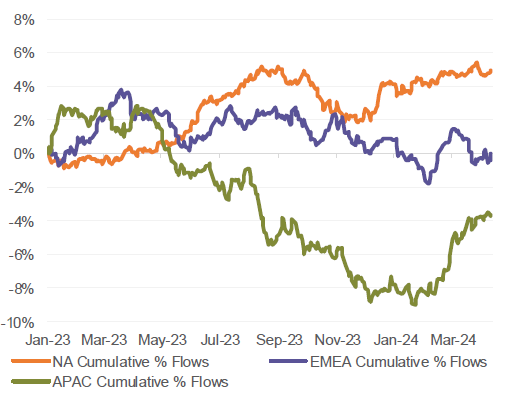
Figure 22: Regional Net Flows - Cumulative
Source: J.P.Morgan Positioning Intelligence
Equities have received strong inflows in last few months, particularly in the US.
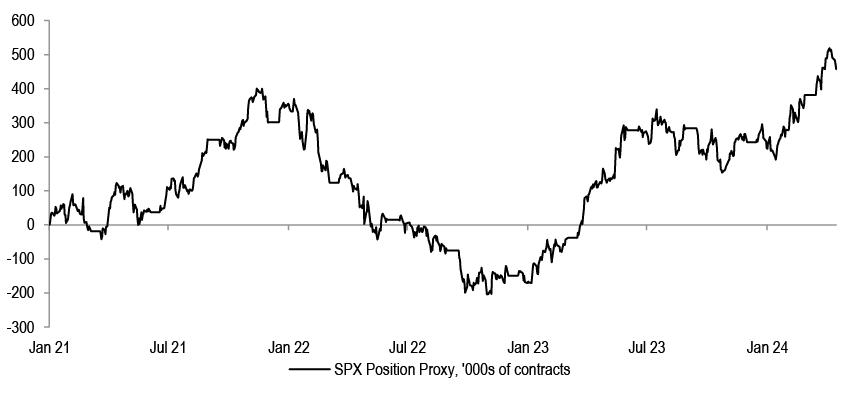
Figure 23: SPX mini futures positioning
Source: JPM Flows & Liquidity team
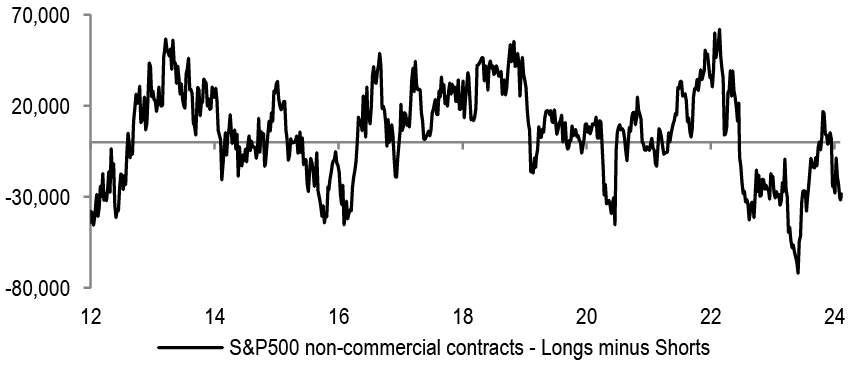
S&P500 positioning proxy based on cumulative daily changes in S&P500 mini futures open interest multiplied by the sign of the price change suggest that equity exposure, particularly among tactical investors i.e. hedge funds etc, is already quite elevated and even higher than what was observed at the end of 2021.
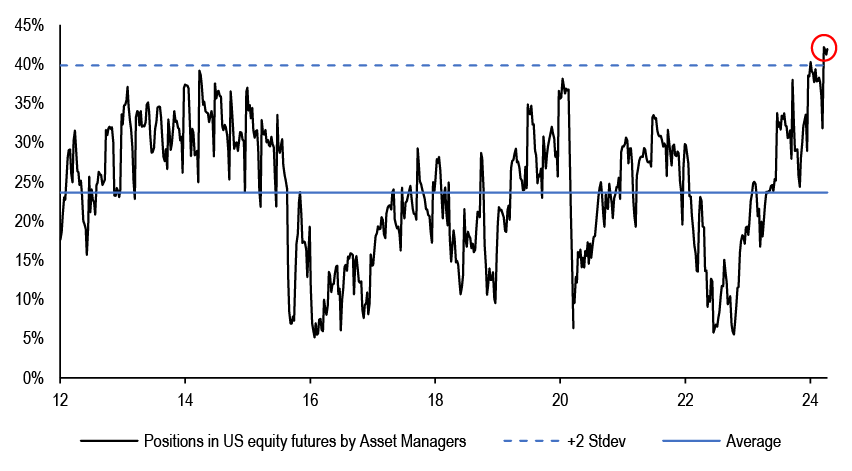
Figure 24: Positions in US equity futures by Asset Managers
Source: JPM Flows & Liquidity team
Another positioning measure devised by our Flows and Liquidity team tracking US equity futures position of US asset managers is also quite stretched.
We continue to prefer Growth style over Value, even as we accept the risk of a reversal is high...
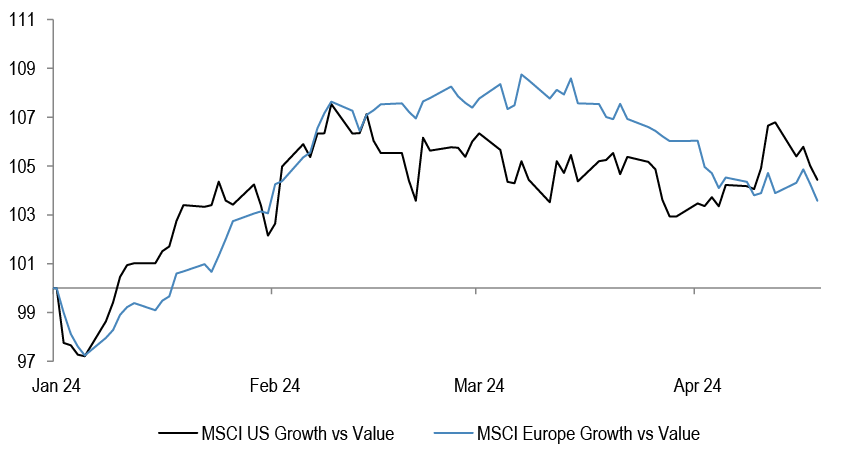
Figure 25: MSCI US and Europe Growth vs Value
Source: Datastream
In terms of our style preferences, we favoured Growth over Value style through last year, and again so far year to date.
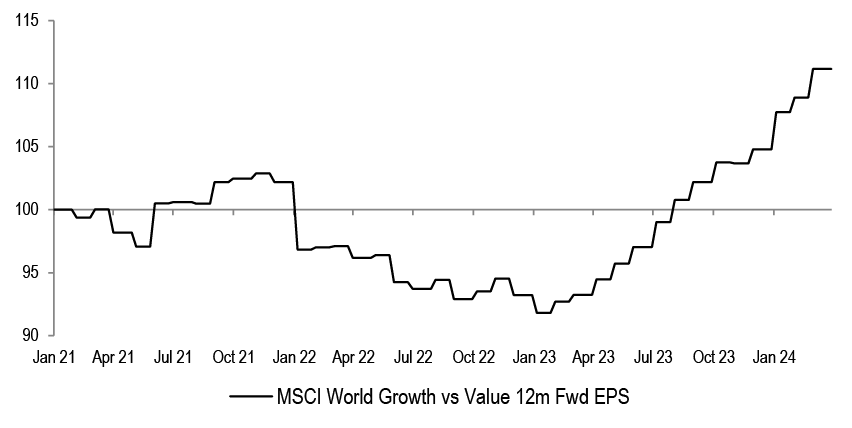
Figure 26: MSCI World Growth vs Value 12m Fwd EPS
Source: Datastream
Growth style is supported by the continued better earnings delivery vs Value.
...and large caps over small caps
Table 4: Large vs Small caps ytd performance for key regions
| % ytd perf | ||
| MSCI US | Small Cap | -3.2% |
| Large Cap | 4.8% | |
| MSCI UK | Small Cap | -1.2% |
| Large Cap | 1.8% | |
| MSCI Eurozone | Small Cap | 1.8% |
| Large Cap | 6.9% | |
| MSCI Japan | Small Cap | 9.2% |
| Large Cap | 14.0% |
Source: Datastream
We also held a preference for large caps over small caps. Small caps are trailing large caps in all key regions so far this year.
Defensive stocks are likely to trade better from here regardless of the direction of yields
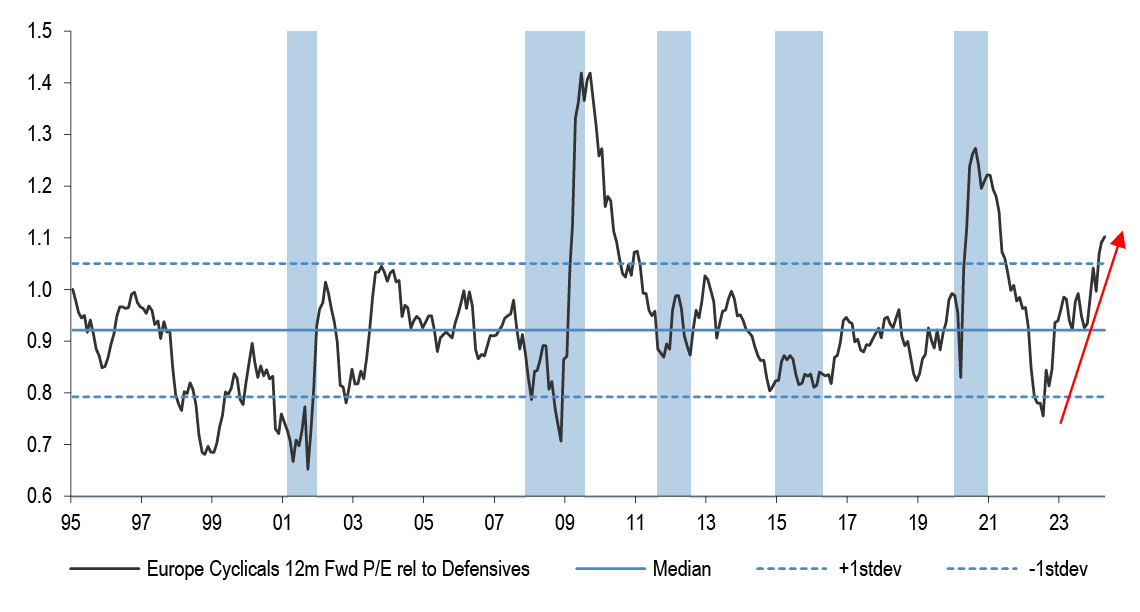
Figure 27: European Cyclicals vs Defensives 12m Fwd PE relative
Source: IBES
At sector level, Cyclicals have rerated to outright expensive vs Defensives. Even if bond yields go higher from here, we think that the equity market will not like it, leading to a potential low beta outperformance.
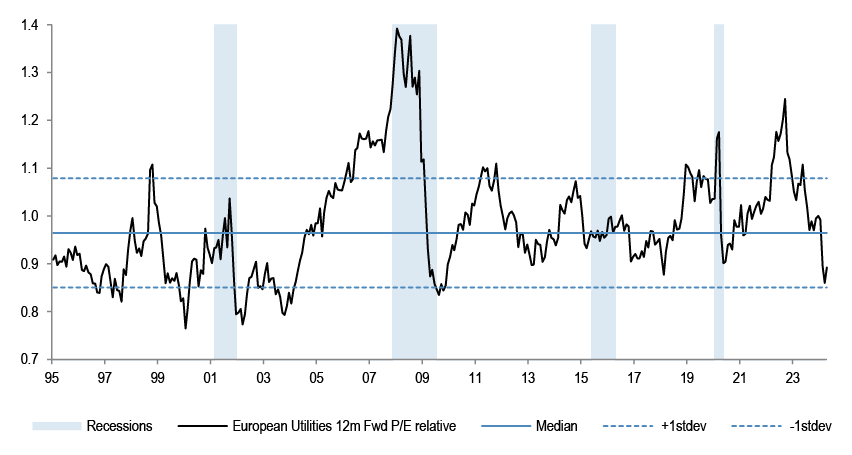
Figure 28: MSCI Europe Utilities 12m Fwd P/E relative
Source: IBES
Utilities in particular have de-rated to record cheap valuations.
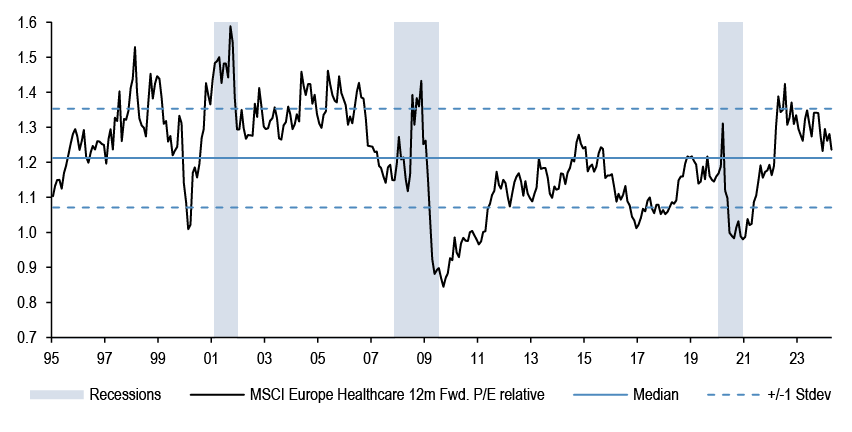
Figure 29: MSCI Europe Healthcare 12m Fwd P/E rel
Source: IBES
Healthcare is another sector which has de-rated significantly.
Figure 30: MSCI Europe Healthcare relative and JPM Tradeable USD
Source: Datastream
If the USD strengthens, Healthcare stands to benefit.
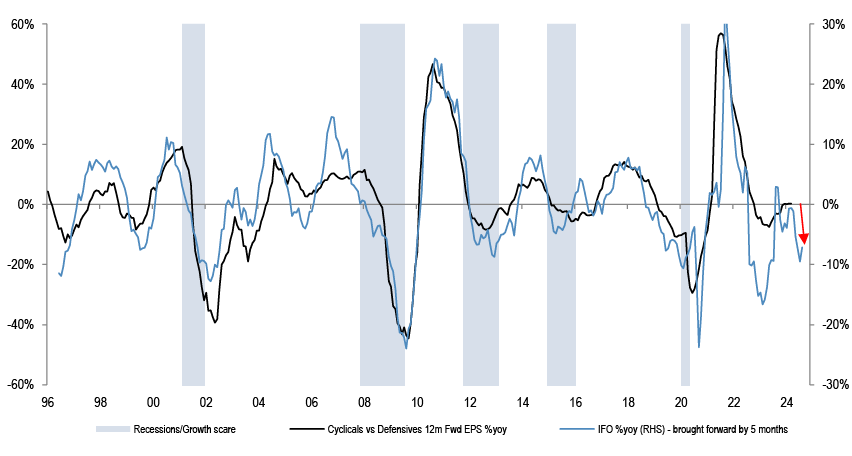
Figure 31: Cyclicals EPS relative to Defensives vs IFO
Source: IBES, Datastream
In general, Cyclical earnings could underwhelm versus Defensives, judging by IFO direction.
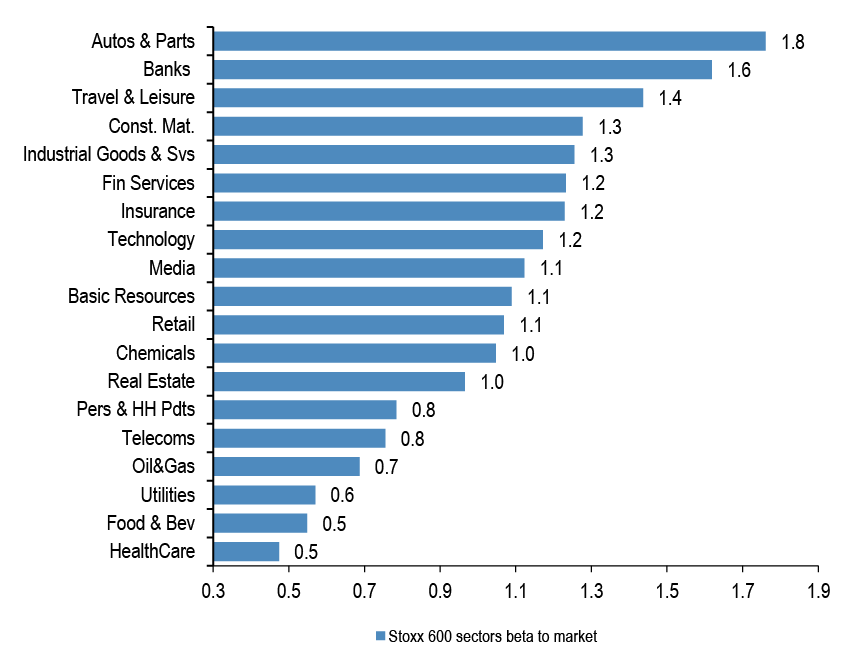
Figure 32: Stoxx 600 sectors beta to market
Source: Bloomberg Finance L.P.
If yields stay higher for longer on account of elevated inflationary pressures, then the low beta nature of Defensives would make them a good hedge against potential market downside.
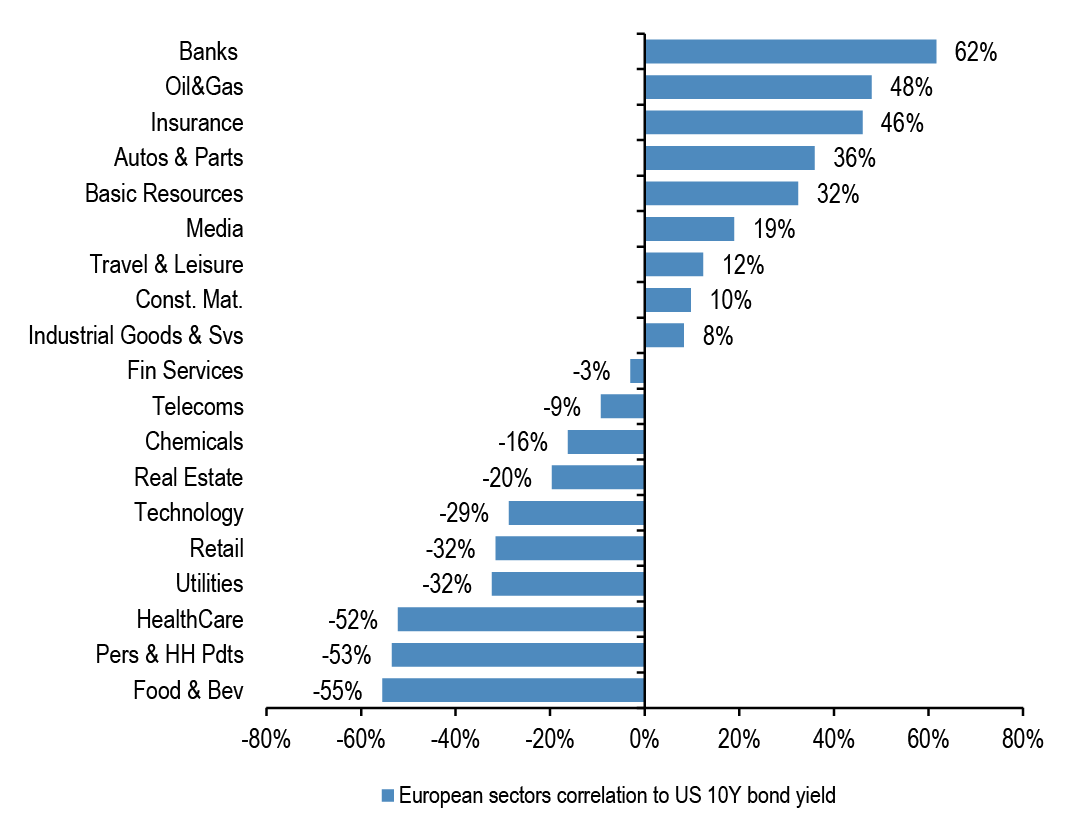
Figure 33: European sectors correlation to US 10Y bond yield
Source: Bloomberg Finance L.P.
On the other hand, it is the Defensive sectors that are best placed to benefit if yields move lower given the sharp inverse correlation.
Figure 34: European Energy 12m Fwd P/E relative
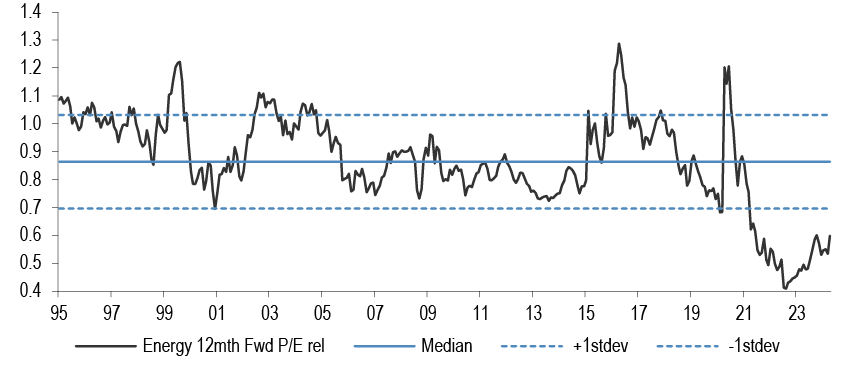
Source: IBES
We believe that Energy is also remaining attractive given strong FCF yield, very cheap valuations and the useful property of being a geopolitical hedge.
Regionally, we recently took profits on our preference for US equities over Eurozone, and on the China UW
Figure 35: YTD performance for key regions
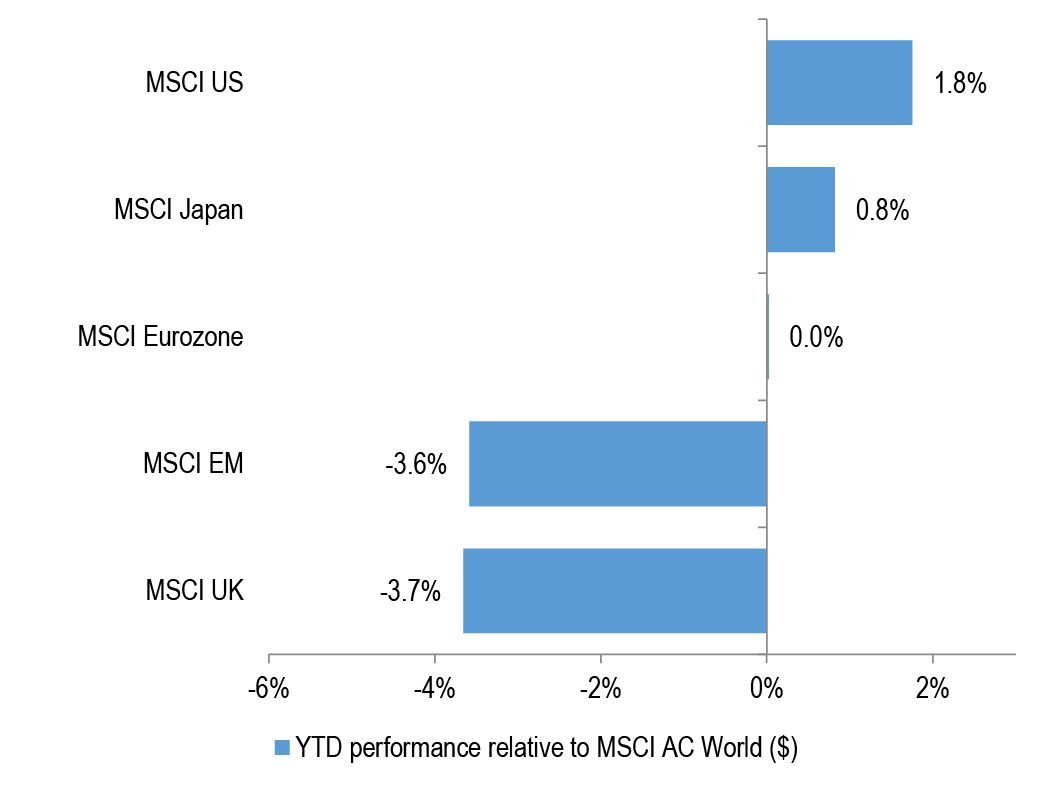
Source: Datastream
We favoured US over EM and Europe, but have recently adjusted some of the bets.
Figure 36: MSCI Eurozone vs US relative performance
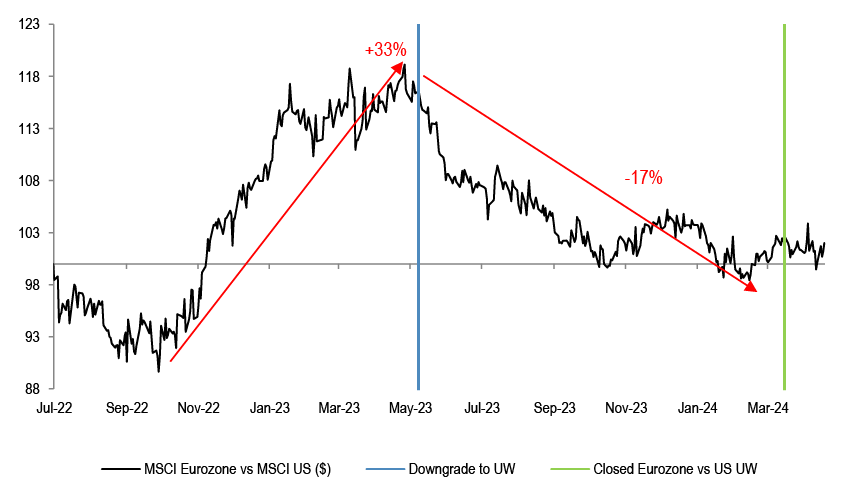
Source: Datastream
We held a preference for US stocks over Eurozone since May of last year. As Eurozone lagged since then, we decided to neutralize the trade.
Figure 37: MSCI Eurozone sector neutral P/E vs MSCI US
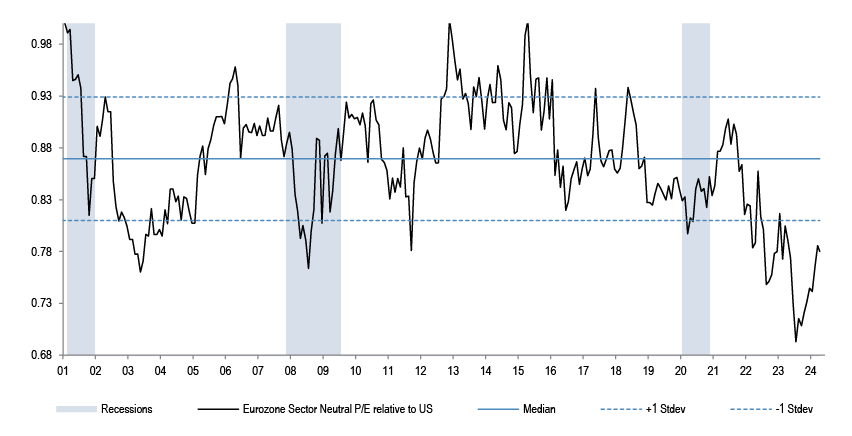
Source: IBES
Eurozone at 13x is cheap vs the US at 21x, and the ECB could start moving ahead of the Fed this time around.
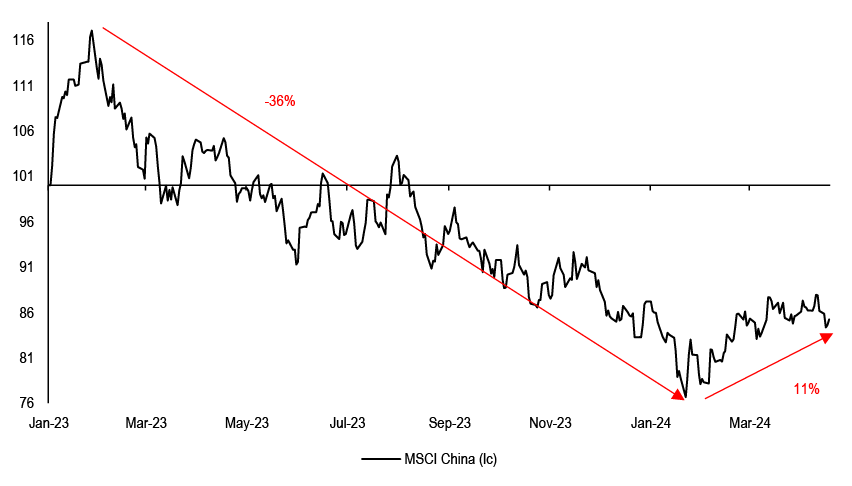
Figure 38: MSCI China
Source: Datastream
In Q1, we also closed our long-standing bearish China call, given the significant weakness already seen.
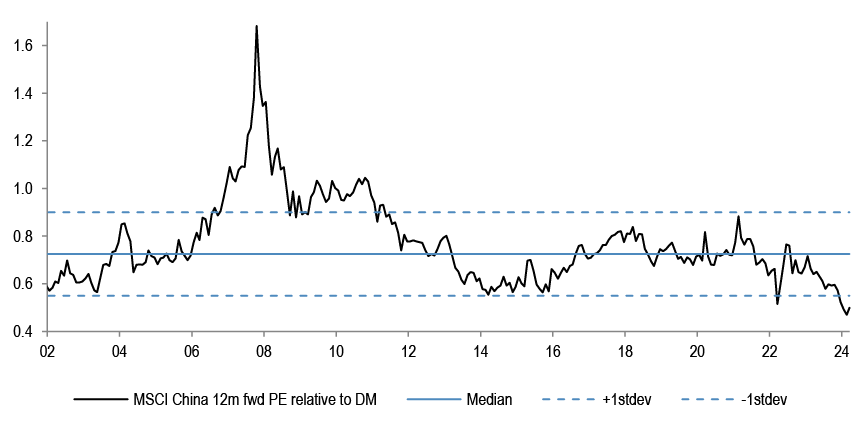
Figure 39: MSCI China 12m Fwd PE relative to MSCI World
Source: IBES
At 9x forward, Chinese equities are far from pricing in any optimism.
Equity Strategy Key Calls and Drivers
In terms of leadership, US and Japan are ahead of other markets ytd, Growth is outperforming Value and large caps are again beating small, in all key regions. We continue to believe that this style of leadership will broadly stay the case for a while longer, until there is a break, or a rest, in the cycle. For Value, low Quality, small caps or EM stocks to begin leading more sustainably one needs to see a reflationary backdrop, in our view, but we could see the opposite. Within this, we have recently taken profits on US vs Eurozone OW, as the Eurozone risk-reward has improved, in our view. Among other things?, Eurozone valuations appear very attractive, relative growth momentum could be bottoming out and ECB could start moving ahead of the Fed, which would be very atypical. We also have a tactical buy on China given extreme cheapness and UW positioning by most investors. Broadly, JPM Fixed Income’s call is that bond yields are fundamentally set to move lower in 2H, but we note a pickup in inflation swaps as well as the outright negative term premia for bonds again, which suggest that there is a lot of complacency in the bond market with respect to the inflation risk. Consequently, the gap that has opened up ytd between Fed futures and the equity market is getting wider. Equities rallied almost 30% from last October’s lows, driven in Nov-Dec by the expectation of a Fed pivot, but these projections have fully reversed back to October low levels. Equities are ignoring the most recent pivot of a pivot RIGHT WORD?, which might be a mistake. The assumption that the market is likely making here is one of growth acceleration coming to the rescue in 2H. In this regard, we note that earnings projections for 2024 are still not moving up. Regionally, Japan is staying our top pick, continuing our 2023 preference.
Table 5: J.P. Morgan Equity Strategy — Factors driving our medium-term views
| Driver | Impact | Our Core Working Assumptions | Recent Developments |
| Global Growth | Neutral | At risk of weakening as consumer strength wanes | Global composite PMI is at 52.3 |
| European Growth | Negative | Manufacturing and services are converging on the downside; industry data stays weak | |
| Monetary Policy | Neutral | Fed pivot could be accompanied by activity weakness | |
| Currency | Neutral | USD could strengthen again | |
| Earnings | Negative | Corporate pricing power is likely to weaken from here | 2024 EPS projections are continuing their downtrend |
| Valuations | Negative | At 21x, US forward P/E is still stretched, especially vs real yield | MSCI Europe on 13.2x Fwd P/E |
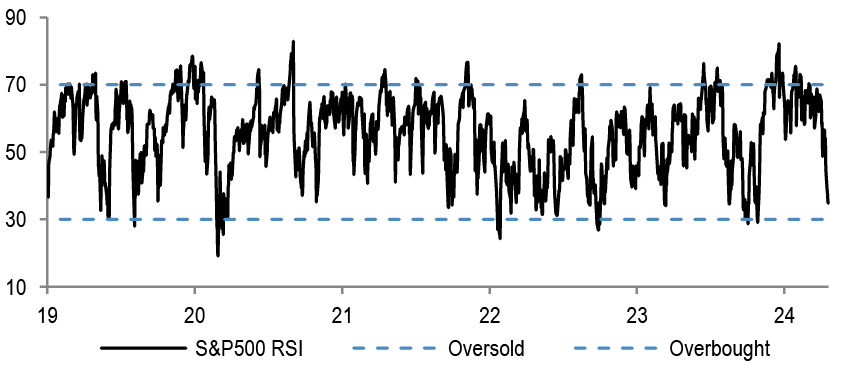
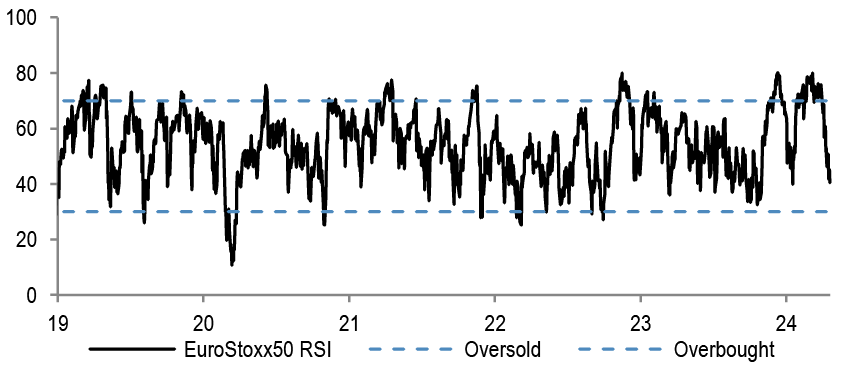
| Technicals | Negative | Sentiment and positioning are stretched post the Nov-Dec rally | RSIs are in overbought territory |
Source: J.P. Morgan estimates
Table 6: : Base Case and Risk
| Scenario | Assumption |
| Upside scenario | No further hawkish tilt by the Fed. No landing |
| Base-case scenario | Inflation to fall further, risk of downturn still elevated. Earnings downside from here |
| Downside scenario | Further Fed tightening and global recession to become a base case again |
Source: J.P. Morgan estimates.
Table 7: Index targets
| Dec '24 Target |
18-Apr-24 | % upside | |
| MSCI Eurozone | 256 | 291 | -12% |
| FTSE 100 | 7,700 | 7,877 | -2% |
| MSCI EUROPE | 1,850 | 2,012 | -8% |
| DJ EURO STOXX 50 | 4,250 | 4,937 | -14% |
| DJ STOXX 600 E | 460 | 500 | -8% |
Source: J.P. Morgan.
Table 8: Key Global sector calls
| Overweight | Neutral | Underweight |
| Healthcare | Technology | Capital Goods ex A&D |
| Telecoms | Discretionary | Food& Drug Retail |
| Food, Beverage & Tobacco | Mining | Autos |
| Real Estate | Transportation | Banks |
| Utilities |
Source: J.P. Morgan
Table 9: J.P. Morgan Equity Strategy — Key sector calls*
| Sector | Recommendations | Key Drivers |
| Healthcare | Overweight | Potential for lower yields and stronger dollar remain near term support, earnings are also holding up |
| Staples | Overweight | Sector is one of the best performers around the last Fed hike in the cycle, lower bond yields and better relative EPS momentum should further support |
| Banks | Underweight | Downgraded to UW in October after 3 years of strong performance. Bond yields and PMIs direction is the key for the potential P/E re-rating of the sector, we think both will move lower |
| Chemicals | Underweight | The sector trades at 70% premium to the market, well above historical norm. pricing continues to deteriorate, downside risks to current earnings and margin projections |
Source: J.P. Morgan estimates. * Please see the last page for the full list of our calls and sector allocation.
Table 10: J.P. Morgan Equity Strategy — Key regional calls
| Region | Recommendations | J.P. Morgan Views |
| EM | Neutral | China tactical chance for a bounce, but structural bearish call remains |
| DM | Neutral | |
| US | Neutral | Expensive, with earnings risk. Growth style at a risk of reversal |
| Japan | Overweight | Japan is attractively priced; diverging policy path and TSE reforms are tailwinds |
| Eurozone | Neutral | Eurozone trading at a record discount vs the US; Growth differential to improve |
| UK | Overweight | Valuations still look very attractive, low beta with the highest regional dividend yield |
Source: J.P. Morgan estimates.
Top Picks
Table 11: J.P. Morgan European Strategy: Top European picks
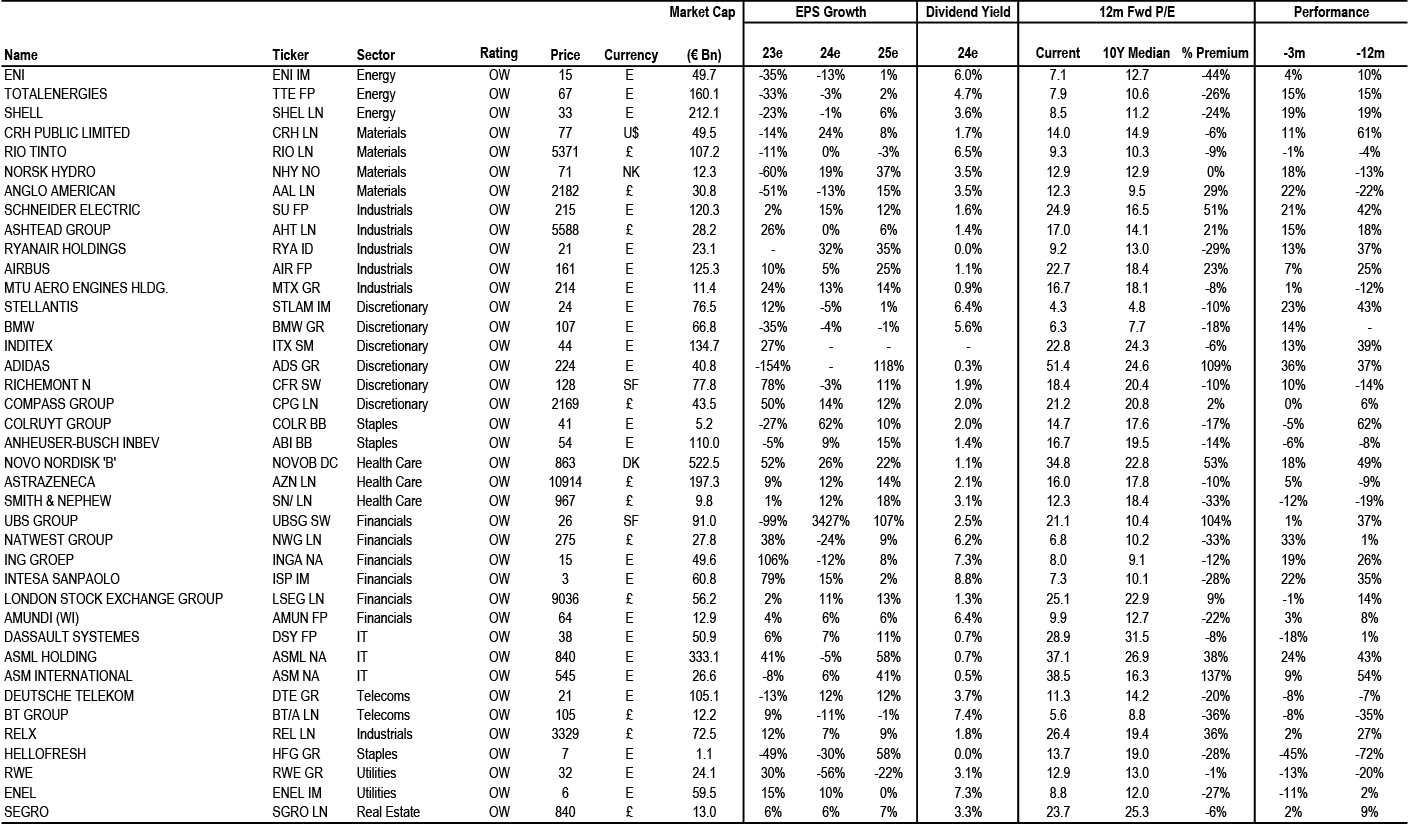
Source: Datastream, MSCI, IBES, J.P. Morgan, Prices and Valuations as of COB 18th Apr, 2024. Past performance is not indicative of future returns.
Please see the most recent company-specific research published by J.P. Morgan for an analysis of valuation methodology and risks on companies recommended in this report. Research is available at http://www.jpmorganmarkets.com, or you can contact the cover
Equity Flows Snapshot
Table 12: DM Equity Fund Flows Summary
| Regional equity fund flows | ||||||||||
| $mn | % AUM | |||||||||
| 1w | 1m | 3m | ytd | 12m | 1w | 1m | 3m | ytd | 12m | |
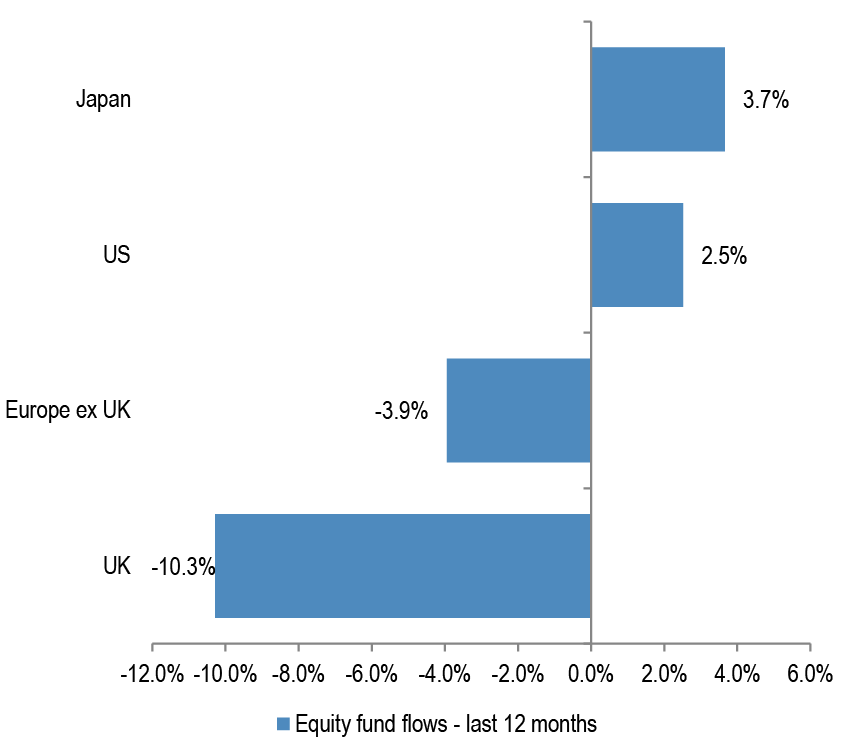
| Europe ex UK | -340 | 1 | -710 | -1,505 | -12,319 | -0.1% | 0.0% | -0.2% | -0.5% | -3.9% |
| UK | -547 | -1,397 | -6,593 | -7,319 | -28,699 | -0.2% | -0.5% | -2.5% | -2.7% | -10.3% |
| US | -4,056 | 3,017 | 70,428 | 61,223 | 205,722 | 0.0% | 0.0% | 0.7% | 0.6% | 2.5% |
| Japan | -641 | 2,390 | 10,081 | 11,564 | 24,599 | -0.1% | 0.3% | 1.3% | 1.5% | 3.7% |
Source: EPFR, as of 17th Apr, 2024
Figure 40: DM Equity Fund flows – last month
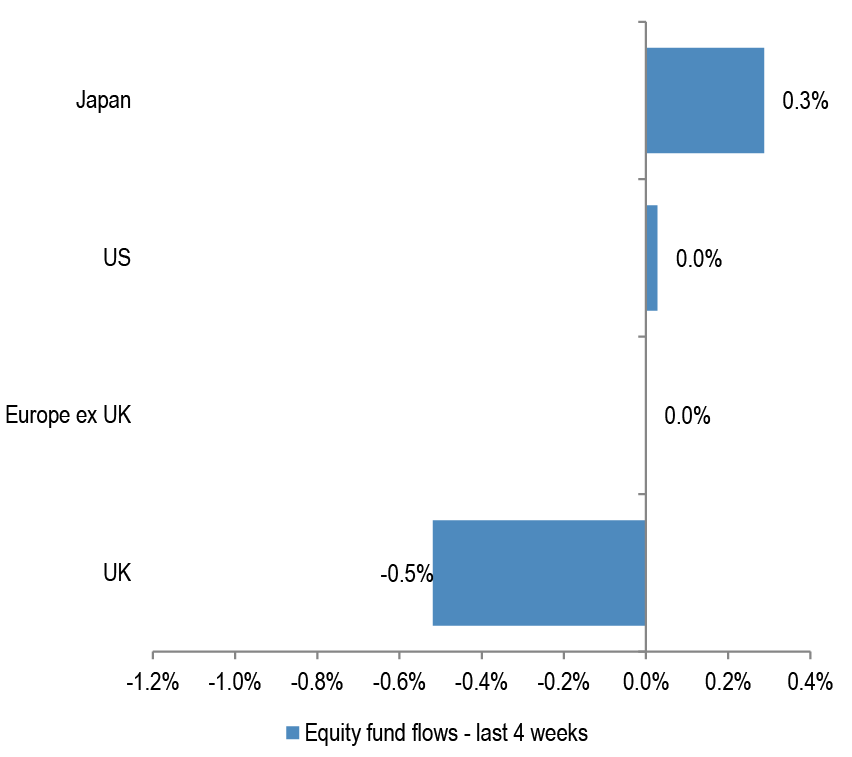
Source: EPFR, Japan includes BoJ purchases.
Figure 41: DM Equity Fund flows – last 12 months
Source: EPFR, Japan includes BoJ purchases.
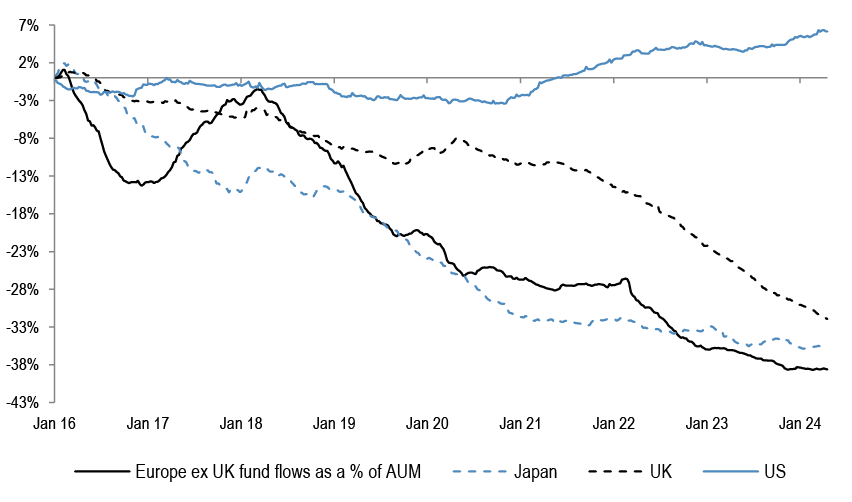
Figure 42: Cumulative fund flows into regional funds as a percentage of AUM
Source: EPFR, as of 17th Apr, 2024. Japan includes Non-ETF purchases only.
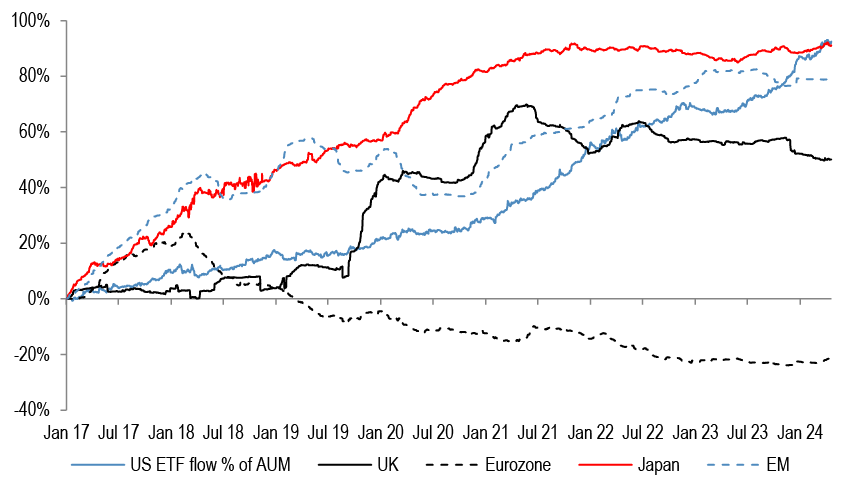
Figure 43: Cumulative fund flows into regional equity ETFs as a percentage of AUM
Source: Bloomberg Finance L.P. *Based on the 25 biggest ETF's with a mandate to invest in that particular region. Japan includes BoJ purchases.
Technical Indicators
Figure 44: S&P500 RSI
Source: Bloomberg Finance L.P.
Figure 45: EuroStoxx50 RSI
Source: Bloomberg Finance L.P.
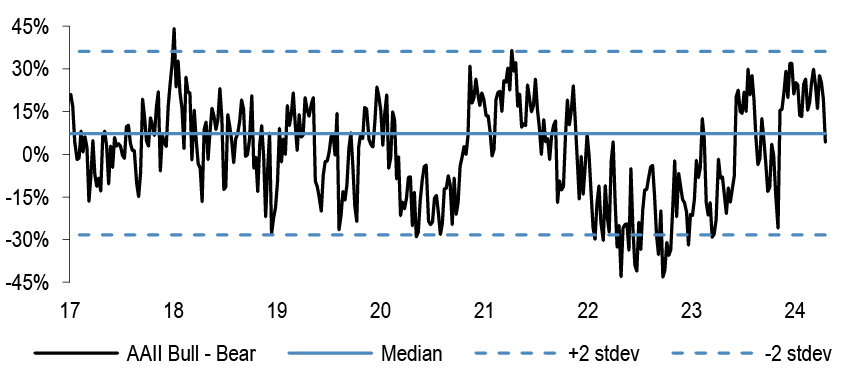
Figure 46: AAII Bull-Bear
Source: Bloomberg Finance L.P
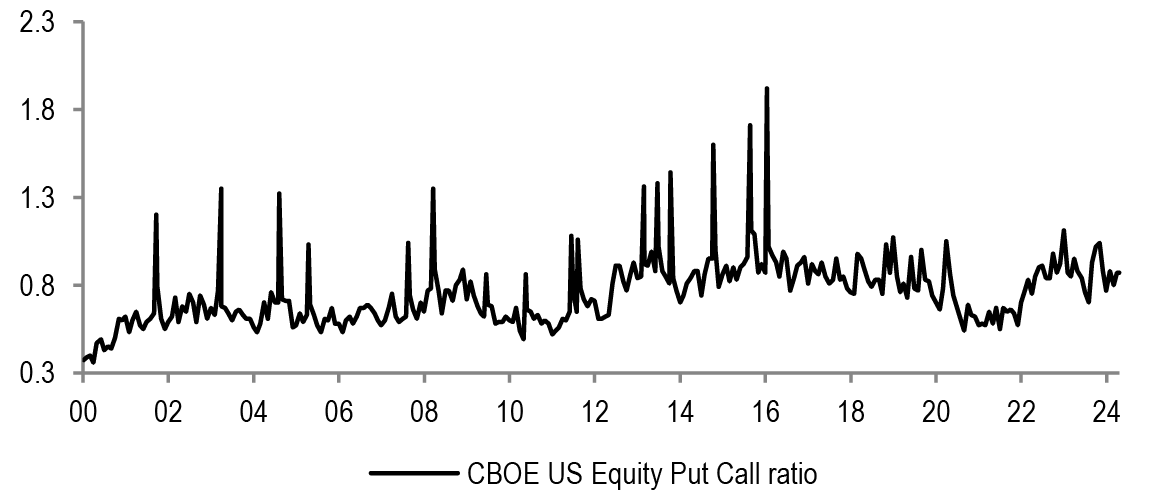
Figure 47: Put-call ratio
Source: Bloomberg Finance L.P.
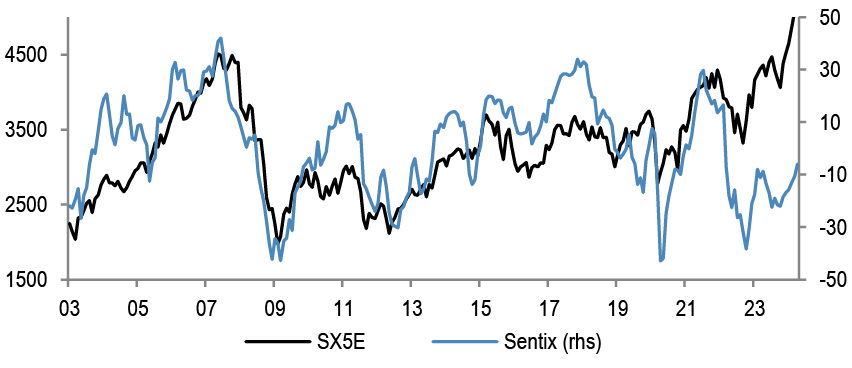
Figure 48: Sentix Sentiment Index vs SX5E
Source: Bloomberg Finance L.P.
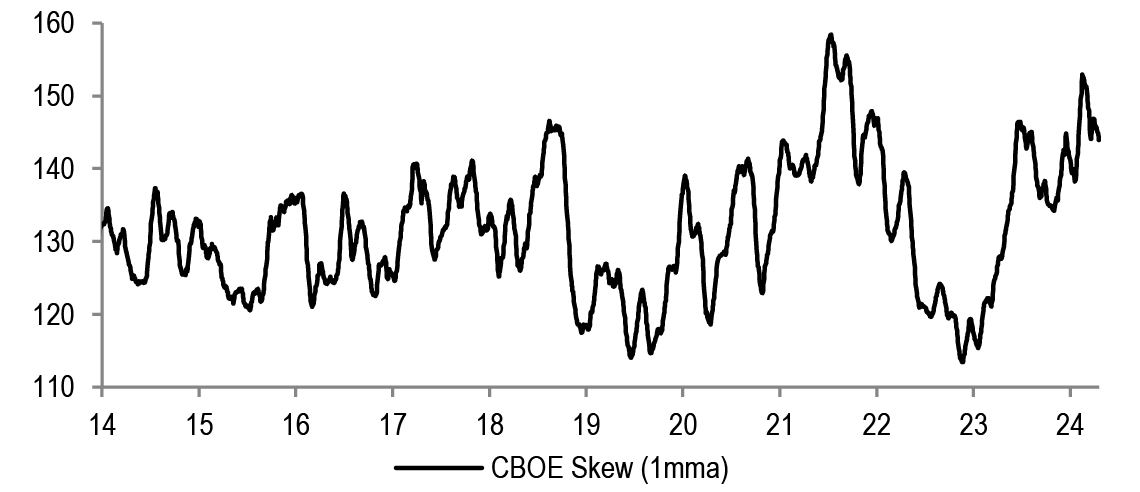
Figure 49: Equity Skew
Source: Bloomberg Finance L.P.
Figure 50: Speculative positions in S&P500 futures contracts
Source: Bloomberg Finance L.P.
Figure 51: VIX
Source: Bloomberg Finance L.P.
Performance
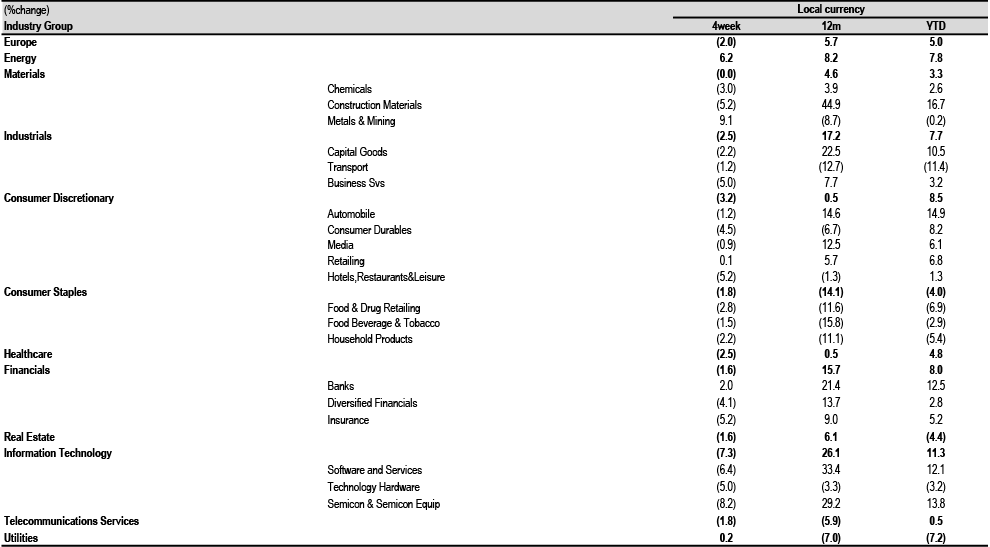
Table 13: Sector Index Performances — MSCI Europe
Source: MSCI, Datastream, as at COB 18th Apr, 2024.
Table 14: Country and Region Index Performances
| (%change) | Local Currency | US$ | |||||
| Country | Index | 4week | 12m | YTD | 4week | 12m | YTD |
| Austria | ATX | 1.6 | 8.0 | 3.0 | (0.3) | 5.0 | (0.6) |
| Belgium | BEL 20 | 1.0 | (0.1) | 3.2 | (0.9) | (2.9) | (0.4) |
| Denmark | KFX | (3.5) | 23.3 | 13.7 | (5.4) | 19.6 | 9.5 |
| Finland | HEX 20 | (0.9) | (9.9) | (3.3) | (2.8) | (12.4) | (6.7) |
| France | CAC 40 | (1.9) | 6.5 | 6.4 | (3.8) | 3.5 | 2.6 |
| Germany | DAX | (1.9) | 12.3 | 6.5 | (3.7) | 9.2 | 2.7 |
| Greece | ASE General | (3.4) | 23.3 | 6.8 | (5.3) | 19.8 | 3.0 |
| Ireland | ISEQ | 0.4 | 17.2 | 13.5 | (1.5) | 14.0 | 9.5 |
| Italy | FTSE MIB | (1.3) | 21.5 | 11.6 | (3.2) | 18.1 | 7.7 |
| Japan | Topix | (4.2) | 31.2 | 13.1 | (6.1) | 13.6 | 3.2 |
| Netherlands | AEX | (1.1) | 13.4 | 10.0 | (3.0) | 10.2 | 6.1 |
| Norway | OBX | 2.8 | 5.9 | 4.2 | (0.5) | 0.5 | (4.0) |
| Portugal | BVL GEN | 2.2 | (11.4) | (11.1) | 0.2 | (13.9) | (14.2) |
| Spain | IBEX 35 | (0.9) | 14.3 | 6.6 | (2.8) | 11.1 | 2.8 |
| Sweden | OMX | (1.3) | 11.6 | 5.1 | (5.6) | 5.2 | (3.2) |
| Switzerland | SMI | (4.0) | (1.1) | 0.8 | (5.4) | (2.7) | (7.0) |
| United States | S&P 500 | (4.4) | 20.6 | 5.1 | (4.4) | 20.6 | 5.1 |
| United States | NASDAQ | (4.9) | 28.4 | 3.9 | (4.9) | 28.4 | 3.9 |
| United Kingdom | FTSE 100 | (0.1) | (0.4) | 1.9 | (1.8) | (0.3) | (0.6) |
| EMU | MSCI EMU | (2.0) | 8.9 | 6.9 | (3.9) | 5.9 | 3.1 |
| Europe | MSCI Europe | (2.0) | 5.7 | 5.0 | (3.8) | 3.4 | 0.6 |
| Global | MSCI AC World | (4.0) | 17.4 | 5.1 | (4.5) | 15.7 | 3.5 |
Source: MSCI, Datastream, as at COB 18th Apr, 2024.
Earnings
Table 15: IBES Consensus EPS Sector Forecasts — MSCI Europe
| EPS Growth (%yoy) | |||||
| 2023 | 2024E | 2025E | 2026E | ||
| Europe | (3.6) | 3.5 | 10.2 | 9.1 | |
| Energy | (31.6) | (4.5) | 3.1 | 4.0 | |
| Materials | (38.8) | 5.8 | 12.5 | 7.1 | |
| Chemicals | (38.9) | 24.3 | 19.1 | 12.2 | |
| Construction Materials | 11.8 | 11.8 | 9.9 | 7.7 | |
| Metals & Mining | (46.2) | (6.5) | 5.6 | 2.0 | |
| Industrials | 0.9 | 7.4 | 13.7 | 11.9 | |
| Capital Goods | 22.2 | 11.7 | 13.6 | 11.7 | |
| Transport | (55.0) | (24.3) | 19.1 | 15.4 | |
| Business Svs | 3.2 | 8.8 | 11.0 | 10.9 | |
| Discretionary | 8.0 | 2.5 | 10.6 | 9.6 | |
| Automobile | 3.3 | (3.0) | 5.4 | 6.5 | |
| Consumer Durables | (5.8) | 4.7 | 15.1 | 13.3 | |
| Media | 1.2 | 7.4 | 10.2 | 10.7 | |
| Retailing | 52.6 | 13.4 | 17.2 | 8.4 | |
| Hotels,Restaurants&Leisure | 85.6 | 21.4 | 21.0 | 16.6 | |
| Staples | 2.5 | 2.6 | 8.9 | 8.0 | |
| Food & Drug Retailing | 4.7 | 4.8 | 11.8 | 8.6 | |
| Food Beverage & Tobacco | 2.1 | 1.4 | 8.9 | 8.1 | |
| Household Products | 2.9 | 5.0 | 7.7 | 7.5 | |
| Healthcare | 1.2 | 6.1 | 14.4 | 10.4 | |
| Financials | 15.5 | 5.7 | 8.0 | 10.0 | |
| Banks | 28.5 | 0.8 | 4.6 | 7.2 | |
| Diversified Financials | (20.0) | 16.4 | 22.6 | 24.5 | |
| Insurance | 11.7 | 12.6 | 8.3 | 8.1 | |
| Real Estate | 5.8 | 2.9 | 3.5 | 2.5 | |
| IT | 14.0 | (5.4) | 30.0 | 15.3 | |
| Software and Services | 18.5 | (0.1) | 20.7 | 14.0 | |
| Technology Hardware | (20.6) | 9.1 | 9.6 | 9.7 | |
| Semicon & Semicon Equip | 27.9 | (12.9) | 44.1 | 17.6 | |
| Telecoms | (8.9) | 10.5 | 10.8 | 8.8 | |
| Utilities | (0.2) | (0.2) | 1.1 | 2.2 | |
Source: IBES, MSCI, Datastream. As at COB 18th Apr, 2024.
Table 16: IBES Consensus EPS Country Forecasts
| EPS growth (%change) | |||||
| Country | Index | 2023 | 2024E | 2025E | 2026E |
| Austria | ATX | (20.6) | (0.7) | 5.1 | 4.6 |
| Belgium | BEL 20 | 13.3 | (6.3) | 12.2 | 13.3 |
| Denmark | Denmark KFX | (14.8) | 26.4 | 22.1 | 17.9 |
| Finland | MSCI Finland | (25.1) | 3.3 | 12.2 | 8.1 |
| France | CAC 40 | (2.4) | 2.5 | 8.8 | 8.2 |
| Germany | DAX | 0.2 | 1.8 | 12.1 | 10.9 |
| Greece | MSCI Greece | 4.2 | 3.6 | 2.4 | 16.6 |
| Ireland | MSCI Ireland | 32.5 | (1.8) | 3.1 | 6.2 |
| Italy | MSCI Italy | 8.6 | 2.0 | 2.8 | 4.0 |
| Netherlands | AEX | (1.6) | 0.9 | 12.9 | 8.8 |
| Norway | MSCI Norway | (40.4) | 3.0 | 6.1 | 2.2 |
| Portugal | MSCI Portugal | 16.9 | 14.2 | 4.8 | 5.3 |
| Spain | IBEX 35 | 8.2 | 2.4 | 4.1 | 6.4 |
| Sweden | OMX | 31.6 | 1.2 | 8.3 | 6.8 |
| Switzerland | SMI | (4.6) | 9.8 | 13.9 | 10.7 |
| United Kingdom | FTSE 100 | (10.7) | 0.9 | 8.1 | 8.4 |
| EMU | MSCI EMU | 3.5 | 3.1 | 10.2 | 9.0 |
| Europe ex UK | MSCI Europe ex UK | 0.4 | 4.4 | 11.1 | 9.4 |
| Europe | MSCI Europe | (3.6) | 3.5 | 10.2 | 9.1 |
| United States | S&P 500 | 2.3 | 9.3 | 14.4 | 11.7 |
| Japan | Topix | 2.8 | 15.4 | 9.8 | 9.3 |
| Emerging Market | MSCI EM | (7.5) | 19.8 | 15.4 | 11.1 |
| Global | MSCI AC World | (0.2) | 9.0 | 13.1 | 10.8 |
Source: IBES, MSCI, Datastream. As at COB 18th Apr, 2024** Japan refers to the period from March in the year stated to March in the following year – EPS post-goodwill
Valuations
Table 17: IBES Consensus European Sector Valuations
| P/E | Dividend Yield | EV/EBITDA | Price to Book | |||||||||
| 2024e | 2025e | 2026e | 2024e | 2025e | 2026e | 2024e | 2025e | 2026e | 2024e | 2025e | 2026e | |
| Europe | 13.7 | 12.4 | 11.4 | 3.4% | 3.6% | 3.9% | 8.1 | 7.5 | 7.0 | 1.9 | 1.8 | 1.6 |
| Energy | 8.0 | 7.8 | 7.5 | 5.3% | 5.2% | 5.5% | 3.4 | 3.4 | 3.3 | 1.2 | 1.1 | 1.1 |
| Materials | 15.8 | 14.1 | 13.2 | 3.1% | 3.4% | 3.6% | 7.7 | 6.9 | 6.7 | 1.7 | 1.6 | 1.5 |
| Chemicals | 23.4 | 19.7 | 17.5 | 2.7% | 2.9% | 3.0% | 11.5 | 10.4 | 9.6 | 2.4 | 2.3 | 2.1 |
| Construction Materials | 13.1 | 12.0 | 11.1 | 2.9% | 3.1% | 3.3% | 7.7 | 7.1 | 6.5 | 1.7 | 1.6 | 1.5 |
| Metals & Mining | 10.9 | 10.3 | 10.2 | 3.8% | 4.1% | 4.5% | 5.2 | 4.5 | 4.7 | 1.3 | 1.2 | 1.1 |
| Industrials | 19.1 | 16.8 | 15.0 | 2.4% | 2.6% | 2.9% | 10.3 | 9.2 | 8.3 | 3.2 | 3.0 | 2.7 |
| Capital Goods | 19.0 | 16.8 | 15.0 | 2.3% | 2.5% | 2.8% | 10.7 | 9.5 | 8.6 | 3.4 | 3.2 | 2.9 |
| Transport | 16.9 | 14.2 | 12.3 | 3.4% | 3.7% | 3.7% | 7.3 | 6.6 | 5.9 | 1.6 | 1.6 | 1.5 |
| Business Svs | 20.9 | 18.9 | 17.0 | 2.5% | 2.7% | 2.9% | 12.8 | 11.7 | 10.8 | 6.0 | 5.5 | 4.9 |
| Discretionary | 13.1 | 11.9 | 10.8 | 2.7% | 3.0% | 3.3% | 5.6 | 5.1 | 4.8 | 1.9 | 1.8 | 1.5 |
| Automobile | 6.3 | 6.0 | 5.6 | 4.9% | 5.2% | 5.5% | 2.0 | 1.8 | 1.7 | 0.8 | 0.7 | 0.6 |
| Consumer Durables | 23.5 | 20.5 | 18.1 | 1.8% | 2.0% | 2.3% | 14.5 | 12.9 | 11.5 | 4.3 | 3.8 | 3.5 |
| Media & Entertainment | 16.3 | 14.8 | 13.4 | 2.3% | 2.5% | 2.7% | 11.9 | 10.0 | 9.0 | 1.8 | 1.8 | 1.9 |
| Retailing | 15.1 | 12.9 | 11.9 | 2.4% | 2.6% | 2.9% | 10.5 | 9.6 | 9.0 | 2.9 | 2.8 | 2.2 |
| Hotels,Restaurants&Leisure | 22.1 | 18.2 | 15.6 | 2.2% | 2.6% | 3.0% | 12.4 | 10.4 | 9.5 | 4.2 | 3.8 | 3.5 |
| Staples | 16.2 | 14.9 | 13.8 | 3.2% | 3.4% | 3.7% | 10.6 | 9.9 | 9.1 | 2.8 | 2.6 | 2.5 |
| Food & Drug Retailing | 11.4 | 10.2 | 9.4 | 4.3% | 4.6% | 5.0% | 6.0 | 5.6 | 5.3 | 1.5 | 1.5 | 1.4 |
| Food Beverage & Tobacco | 16.0 | 14.7 | 13.6 | 3.5% | 3.8% | 4.0% | 10.5 | 9.8 | 9.0 | 2.5 | 2.4 | 2.3 |
| Household Products | 18.7 | 17.4 | 16.2 | 2.5% | 2.7% | 2.8% | 13.5 | 12.5 | 11.8 | 4.1 | 3.8 | 3.8 |
| Healthcare | 17.1 | 15.0 | 13.6 | 2.4% | 2.7% | 3.0% | 12.4 | 10.9 | 9.6 | 3.4 | 3.1 | 2.8 |
| Financials | 8.9 | 8.2 | 7.5 | 5.6% | 5.7% | 6.2% | - | - | - | 1.1 | 1.0 | 0.9 |
| Banks | 7.1 | 6.7 | 6.3 | 7.2% | 7.1% | 7.6% | - | - | - | 0.8 | 0.7 | 0.7 |
| Diversified Financials | 14.3 | 11.7 | 9.6 | 2.4% | 2.7% | 3.0% | - | - | - | 1.3 | 1.4 | 1.4 |
| Insurance | 10.2 | 9.4 | 8.7 | 5.7% | 6.1% | 6.6% | - | - | - | 1.6 | 1.5 | 1.5 |
| Real Estate | 13.4 | 13.0 | 12.6 | 4.3% | 4.5% | 4.8% | - | - | - | 0.8 | 0.8 | 0.8 |
| IT | 28.4 | 21.8 | 18.9 | 1.2% | 1.3% | 1.5% | 18.6 | 14.4 | 12.6 | 4.9 | 4.4 | 3.9 |
| Software and Services | 29.0 | 24.0 | 21.1 | 1.3% | 1.4% | 1.6% | 19.6 | 15.8 | 13.9 | 4.4 | 4.0 | 3.6 |
| Technology Hardware | 14.8 | 13.5 | 12.3 | 2.7% | 2.8% | 3.0% | 8.7 | 8.1 | 7.0 | 1.8 | 1.7 | 1.6 |
| Semicon & Semicon Equip | 33.0 | 22.9 | 19.5 | 0.9% | 1.0% | 1.2% | 22.5 | 15.6 | 13.5 | 8.1 | 6.7 | 5.6 |
| Communication Services | 13.6 | 12.3 | 11.3 | 4.4% | 4.5% | 4.8% | 6.7 | 6.2 | 5.8 | 1.4 | 1.3 | 1.3 |
| Utilities | 11.8 | 11.7 | 11.4 | 5.2% | 5.3% | 5.6% | 7.9 | 8.1 | 8.2 | 1.5 | 1.4 | 1.3 |
Source: IBES, MSCI, Datastream. As at COB 18th Apr, 2024.
Table 18: IBES Consensus P/E and 12-Month Forward Dividend Yields — Country Forecasts
| P/E | Dividend Yield | |||||
| Country | Index | 12mth Fwd | 2024E | 2025E | 2026E | 12mth Fwd |
| Austria | ATX | 7.8 | 7.9 | 7.5 | 7.0 | 5.9% |
| Belgium | BEL 20 | 15.1 | 15.7 | 14.0 | 12.3 | 3.0% |
| Denmark | Denmark KFX | 26.6 | 28.6 | 23.4 | 19.9 | 1.7% |
| Finland | MSCI Finland | 14.4 | 15.0 | 13.4 | 12.4 | 4.6% |
| France | CAC 40 | 13.2 | 13.6 | 12.5 | 11.5 | 3.3% |
| Germany | DAX | 12.0 | 12.5 | 11.1 | 10.0 | 3.3% |
| Greece | MSCI Greece | 29.9 | 30.1 | 29.4 | 24.3 | 1.8% |
| Ireland | MSCI Ireland | 11.1 | 11.2 | 10.9 | 10.2 | 3.5% |
| Italy | MSCI Italy | 9.0 | 9.1 | 8.9 | 8.5 | 5.5% |
| Netherlands | AEX | 15.3 | 15.8 | 14.0 | 13.2 | 2.5% |
| Norway | MSCI Norway | 10.8 | 11.0 | 10.4 | 10.2 | 6.2% |
| Portugal | MSCI Portugal | 13.9 | 14.1 | 13.4 | 12.8 | 4.2% |
| Spain | IBEX 35 | 10.8 | 11.0 | 10.5 | 9.9 | 4.8% |
| Sweden | OMX | 15.2 | 15.6 | 14.4 | 13.6 | 3.8% |
| Switzerland | SMI | 16.3 | 17.0 | 15.0 | 13.5 | 3.5% |
| United Kingdom | FTSE 100 | 11.1 | 11.4 | 10.5 | 9.7 | 4.1% |
| EMU | MSCI EMU | 13.1 | 13.5 | 12.3 | 11.3 | 3.4% |
| Europe ex UK | MSCI Europe ex UK | 14.1 | 14.6 | 13.1 | 12.0 | 3.4% |
| Europe | MSCI Europe | 13.2 | 13.7 | 12.4 | 11.4 | 3.6% |
| United States | S&P 500 | 20.0 | 21.2 | 18.5 | 16.6 | 1.5% |
| Japan | Topix | 14.6 | 16.2 | 14.7 | 13.5 | 2.3% |
| Emerging Market | MSCI EM | 12.2 | 12.8 | 10.7 | 9.9 | 3.1% |
| Global | MSCI AC World | 17.5 | 18.3 | 15.6 | 14.7 | 2.1% |
Source: IBES, MSCI, Datastream. As at COB 18th Apr, 2024; ** Japan refers to the period from March in the year stated to March in the following year – P/E post goodwill.
Economic, Interest Rate and Exchange Rate Outlook
Table 19: Economic Outlook in Summary
| Real GDP | Real GDP | Consumer prices | |||||||||||
| % oya | % over previous period, saar | % oya | |||||||||||
| 2023E | 2024E | 2025E | 3Q23 | 4Q23 | 1Q24E | 2Q24E | 3Q24E | 4Q24E | 4Q23 | 2Q24E | 4Q24E | 2Q25E | |
| United States | 2.5 | 2.4 | 1.7 | 4.9 | 3.4 | 2.3 | 1.5 | 1.0 | 1.0 | 3.2 | 3.5 | 3.3 | 2.4 |
| Eurozone | 0.5 | 0.4 | 1.0 | -0.2 | -0.2 | 0.5 | 0.7 | 0.7 | 0.7 | 2.7 | 2.6 | 2.2 | 1.7 |
| United Kingdom | 0.1 | 0.2 | 0.1 | -0.5 | -1.2 | 1.5 | 0.8 | 0.0 | -0.5 | 4.2 | 1.9 | 2.4 | 2.5 |
| Japan | 1.9 | 0.7 | 0.8 | -3.2 | 0.4 | 1.0 | 1.7 | 1.0 | 0.8 | 2.9 | 3.2 | 3.1 | 2.6 |
| Emerging markets | 4.2 | 4.1 | 3.6 | 5.8 | 3.9 | 5.5 | 3.4 | 3.6 | 3.6 | 3.7 | 4.1 | 3.5 | 3.3 |
| Global | 2.7 | 2.6 | 2.3 | 3.6 | 2.6 | 3.3 | 2.1 | 2.1 | 2.0 | 3.4 | 3.5 | 3.1 | 2.7 |
Source: J.P. Morgan economic research J.P. Morgan estimates, as of COB 11th Apr, 2024
Table 20: Official Rates Outlook
| Forecast for | ||||||||
| Official interest rate | Current | Last change (bp) | Forecast next change (bp) | Jun 24 | Sep 24 | Dec 24 | Mar 25 | |
| United States | Federal funds rate | 5.50 | 26 Jul 23 (+25bp) | Jun 24 (-25bp) | 5.25 | 5.00 | 4.75 | 4.50 |
| Eurozone | Depo rate | 4.00 | 14 Sep 23 (+25bp) | Jun 24 (-25bp) | 3.75 | 3.50 | 3.00 | 2.50 |
| United Kingdom | Bank Rate | 5.25 | 03 Aug 23 (+25bp) | Aug 24 (-25bp) | 5.25 | 5.00 | 4.50 | 4.00 |
| Japan | Pol rate IOER | 0.10 | 19 Mar 24 (+20bp) | 3Q24 (+15bp) | 0.10 | 0.25 | 0.50 | 0.50 |
Source: J.P. Morgan estimates, Datastream, as of COB 11th Apr, 2024
Table 21: 10-Year Government Bond Yield Forecasts
| 10 Yr Govt BY | Forecast for end of | ||||
| 19-Apr-24 | Jun 24 | Sep 24 | Dec 24 | Mar 25 | |
| US | 4.59 | 4.15 | 4.05 | 4.00 | 3.90 |
| Euro Area | 2.47 | 2.20 | 2.05 | 1.90 | 1.80 |
| United Kingdom | 4.25 | 4.05 | 3.95 | 3.80 | 3.65 |
| Japan | 0.85 | 0.85 | 1.05 | 1.30 | 1.30 |
Source: J.P. Morgan estimates, Datastream, forecasts as of COB 11th Apr, 2024
Table 22: Exchange Rate Forecasts vs. US Dollar
| Exchange rates vs US$ | Forecast for end of | ||||
| 18-Apr-24 | Jun 24 | Sep 24 | Dec 24 | Mar 25 | |
| EUR | 1.07 | 1.05 | 1.05 | 1.09 | 1.12 |
| GBP | 1.24 | 1.22 | 1.22 | 1.25 | 1.29 |
| CHF | 0.91 | 0.92 | 0.91 | 0.89 | 0.87 |
| JPY | 155 | 148 | 146 | 144 | 142 |
| DXY | 106.2 | 106.4 | 106.1 | 102.9 | 100.3 |
Source: J.P. Morgan estimates, Datastream, forecasts as of COB 11th Apr, 2024
Sector, Regional and Asset Class Allocations
Table 23: J.P. Morgan Equity Strategy — European Sector Allocation
| MSCI Europe Weights | Allocation | Deviation | Recommendation | ||
| Energy | 5.6% | 8.0% | 2.4% | OW | |
| Materials | 7.0% | 6.0% | -1.0% | N | |
| Chemicals | UW | ||||
| Construction Materials | N | ||||
| Metals & Mining | N | ||||
| Industrials | 15.8% | 14.0% | -1.8% | N | |
| Capital Goods ex Aerospace & Defence | UW | ||||
| Aerospace & Defence | OW | ||||
| Transport | N | ||||
| Business Services | N | ||||
| Consumer Discretionary | 9.1% | 7.0% | -2.1% | UW | |
| Automobile | UW | ||||
| Consumer Durables | N | ||||
| Consumer Srvcs | UW | ||||
| Speciality Retail | UW | ||||
| Internet Retail | UW | ||||
| Consumer Staples | 11.7% | 13.0% | 1.3% | OW | |
| Food & Drug Retailing | UW | ||||
| Beverages | OW | ||||
| Food & Tobacco | OW | ||||
| Household Products | OW | ||||
| Healthcare | 16.0% | 18.0% | 2.0% | OW | |
| Financials | 18.1% | 14.0% | -4.1% | UW | |
| Banks | UW | ||||
| Insurance | N | ||||
| Real Estate | 0.9% | 2.0% | 1.1% | OW | |
| Information Technology | 7.1% | 7.0% | -0.1% | N | |
| Software and Services | N | ||||
| Technology Hardware | N | ||||
| Semicon & Semicon Equip | UW | ||||
| Communication Services | 4.5% | 5.0% | 0.5% | OW | |
| Telecommunication Services | OW | ||||
| Media | N | ||||
| Utilities | 4.4% | 6.0% | 1.6% | OW | |
| 100.0% | 100.0% | 0.0% | Balanced |
Source: MSCI, Datastream, J.P. Morgan.
Table 24: J.P. Morgan Equity Strategy — Global Regional Allocation
| MSCI Weight | Allocation | Deviation | Recommendation | |
| EM | 10.0% | 10.0% | 0.0% | Neutral |
| DM | 90.0% | 90.0% | 0.0% | Neutral |
| US | 70.9% | 68.0% | -2.9% | Neutral |
| Japan | 6.2% | 8.0% | 1.8% | Overweight |
| Eurozone | 8.6% | 8.0% | -0.6% | Neutral |
| UK | 3.8% | 6.0% | 2.2% | Overweight |
| Others* | 10.5% | 10.0% | -0.5% | Neutral |
| 100.0% | 100.0% | 0.0% | Balanced |
Source: MSCI, J.P. Morgan *Other includes Denmark, Switzerland, Australia, Canada, Hong Kong SAR, Sweden, Singapore, New Zealand, Israel and Norway
Table 25: J.P. Morgan Equity Strategy — European Regional Allocation
| MSCI Weight | Allocation | Deviation | Recommendation | |
| Eurozone | 51.0% | 48.0% | -3.0% | Neutral |
| United Kingdom | 22.6% | 25.0% | 2.4% | Overweight |
| Others** | 26.5% | 27.0% | 0.5% | Overweight |
| 100.0% | 100.0% | Balanced |
Source: MSCI, J.P. Morgan **Other includes Denmark, Switzerland, Sweden and Norway
Table 26: J.P. Morgan Equity Strategy — Asset Class Allocation
| Benchmark weighting | Allocation | Deviation | Recommendation | |
| Equities | 60% | 55% | -5% | Underweight |
| Bonds | 30% | 35% | 5% | Overweight |
| Cash | 10% | 10% | 0% | Neutral |
| 100% | 100% | 0% | Balanced |
Source: MSCI, J.P. Morgan
Anamil Kochar (anamil.kochar@jpmchase.com) of J.P. Morgan India Private Limited is a co-author of this report.
Parts of this report use data drawn from SmartBuzz which is available on Morgan Markets. SmartBuzz is an NLP processing framework that tracks market themes using a taxonomy curated to capture market relevant topics with the help of JPM’s experts and AI. We combine sentiment analysis with the theme exposure of stocks which can be rolled up to sectors and countries. The news feed is curated from LexisNexis and we use Earnings Call Transcripts from S&P/CapIQ. Please contact us for more information.