
Treasuries
Whiplash
- Treasury yields retraced to their lowest levels since March, supported by benign inflation data, renewed political risk in Europe, and a dovish BoJ
- We think Treasury yields are likely to remain rangebound through the summer. On one hand, this week’s data should allay fears that inflation is reaccelerating, and leaves the door firmly open to lower rates later this year. However, the Fed is in no rush to ease, and if the first cut is indeed months away, it will be challenging for yields to decline further over the near term
- Though the environment supports carry trading, risk adjusted-carry is pretty low and the 5-year sector is trading near the richest levels on the fly YTD: take profits on 3s/5s/7s belly-richening butterflies
- With yields at multi-month lows, OAT/bund spreads priced for a more negative outcome, and next week’s retail sales likely to show a healthy bounce, we turn tactically bearish in the 5-year sector
- Add 100:98 weighted 4.75% Feb 37s / 4.5% Aug 39s steepeners for relative value
- We expand our analysis of CFTC data and consider the evolution of open interest concentration as a metric for measuring crowding in futures positions...
- ...We find the top 4 investors share of FV and UXY contracts offers a meaningful and consistent near term contrarian signal, where yields usually rise following periods of larger-than-usual concentration
Market views
Treasury yields plunged 17-24bp over the last week, more than reversing last week’s move, supported by a round of benign May inflation data, a splash of risk aversion, and dovish developments from the BoJ. The big shock came from CPI, as the core index rose 0.16% in May (consensus: 0.3%), the softest reading since August 2021, taking the oya series down from 3.6% to 3.4%. Within the details, the supercore series was flat on the month, driven by weakness in auto insurance and airfares (see May CPI to put a spring in Powell’s step, Michael Feroli, 6/12/24). Alongside the benign PPI reading and declining ex-fuel import prices in May, and we think core PCE rose 0.14% in May, the weakest monthly reading since October 2023, taking the series to 2.6% oya (see US: May import prices surprised lower, 6/14/24). Meanwhile, initial claims surprised to the upside, rising 13k to 242k for the week ending June 8 (consensus: 225k), the highest level since August 2023, but our economists caution this could reflect residual noise following the Memorial Day holiday (see US: Jobless claims jump 13,000 post Memorial Day, Murat Tasci, 6/13/24).
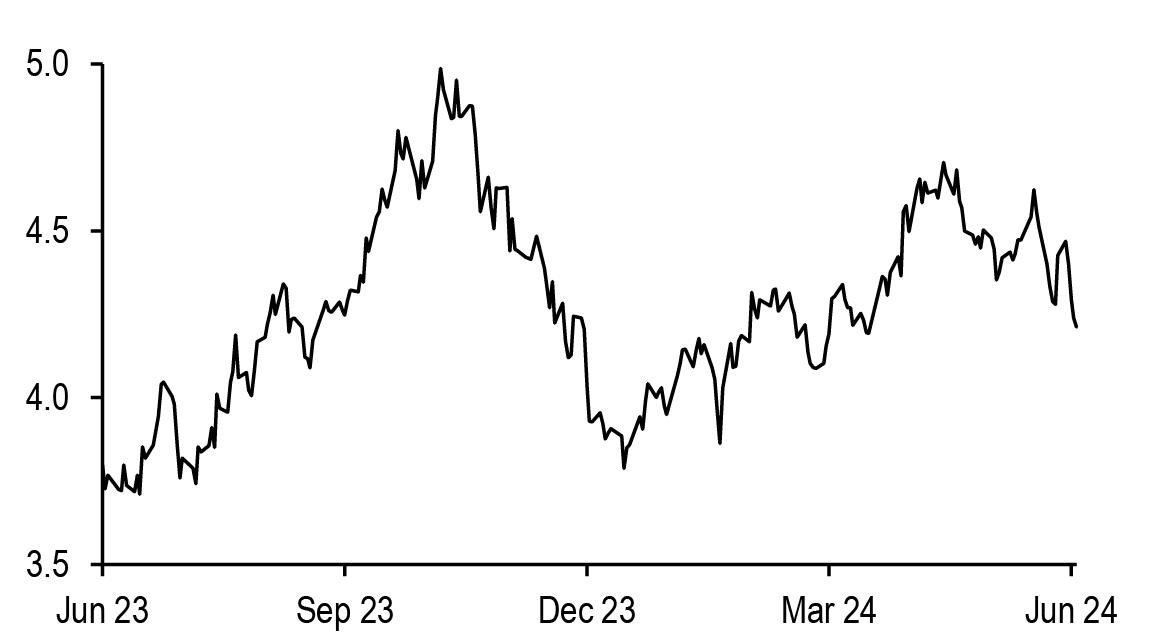
Internationally, political uncertainty was on the rise in Europe after Le Pen’s National Rally (RN) scored strong results in the European parliamentary elections and President Macron called a lower house election for later this month. This decision was a surprise and OAT/bund spreads moved to their widest levels since 2017 following the results, as investors de-risked over concerns on what a move to the right could mean for the fiscal picture in France. Meanwhile, the BoJ surprised to the dovish side: it announced a policy of reducing its balance sheet, but postponed the decision on the details of the QT process until the July meeting. We now see rising risks for the BoJ to delay rate hikes until September unless additional weakness of the yen puts more pressure on the BoJ (see BoJ set QT, but postponed a decision on the details, Ayako Fujita, 6/14/24). Against this backdrop, this week’s Treasury auctions were met with a strong reception: the longer duration auctions both stopped rich relative to pre-auction levels, with strong increases in end-user demand as well ( Figure 1). Given these developments, intermediate Treasury yields have now declined to their lowest levels since the beginning of April ( Figure 2).
Figure 1: This week’s long-duration auctions stopped rich relative to pre-auction levels, supported by strong end-user demand...
Statistics for this week’s Treasury auctions; units as indicated
| 3s | 10s | 30s | ||
| Jun | 1.2 | -1.8 | -1.4 | |
| Auction tail (bp) | May | 0.0 | 1.1 | -0.6 |
| Prev 3M avg | 0.3 | 1.7 | -0.6 | |
| Jun | 80.0 | 88.4 | 86.3 | |
| End-user (%) | May | 85.1 | 84.3 | 84.6 |
| Prev 3M avg | 83.8 | 81.1 | 84.5 | |
| Jun | 2.43 | 2.67 | 2.49 | |
| Bid-to-cover | May | 2.63 | 2.49 | 2.41 |
| Prev 3M avg | 2.58 | 2.45 | 2.42 |
Source: J.P. Morgan
Figure 2: ...and alongside benign inflation data, helped Treasury yields fall to their lowest levels since early-April
10-year Treasury yields; %
Source: J.P. Morgan
As we look ahead, we think Treasury yields are likely to remain rangebound through the summer. On one hand, this week’s data should allay fears that inflation is reaccelerating, and leaves the door firmly open to lower rates later this year. To the extent that yields tend to decline and the curve tends to steepen, even in shallower easing cycles, this should support room for bullish steepening in 2H24. However, the message from the FOMC indicated that it’s in no rush to ease: the median 2024 dot showed one cut, from three in March, and 15 of 19 participants now see one or two cuts this year. This was partially offset by projections for the out years, which project another four cuts in both 2025 and 2026, both up from three in March (see FOMC guesses at fewer cuts in ‘24, Michael Feroli, 6/12/24). Furthermore, Chair Powell’s Q&A was not nearly as dovish as we’ve seen in other recent press conferences, remarking a number of times he needs greater confidence before lowering rates. Thus, if form holds, consistent with other more shallow easing cycles, we may not get satisfaction from more structurally bullish trades until later this summer (see Treasuries, US Fixed Income Markets Weekly, 6/7/24).
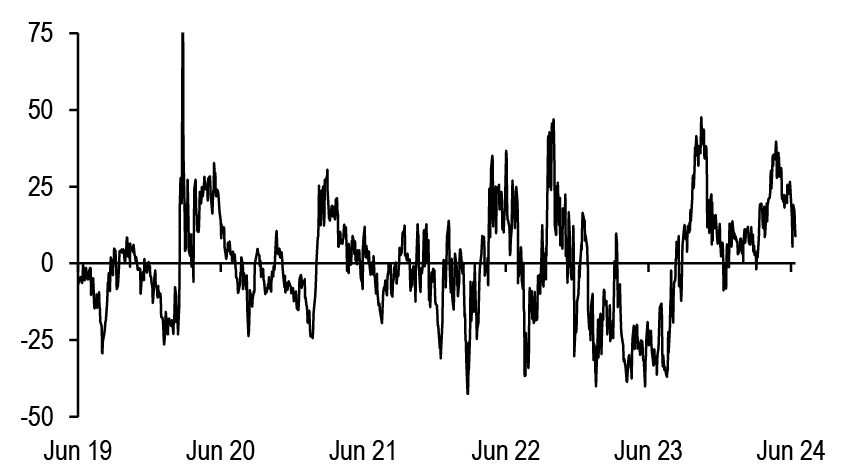
This should prevent yields from moving materially lower over the near term, especially as OIS forwards are now pricing in 50bp of cuts this year ( Figure 3). Moreover, longer out the curve, valuations no longer appear cheap: 10-year Treasuries appear fairly valued after adjusting for market-based Fed policy, inflation, and growth expectations for the first time in 3 months ( Figure 4). Certainly, Treasuries can trade rich relative to their fundamental drivers, though it’s notable that they have not traded rich on this basis since the regional banking crisis last year. This should put a floor on yields at levels higher than we observed late last year when the “immaculate disinflation” narrative drove markets to price upwards of 150bp of easing over a 12 month period. This month’s inflation data are certainly a positive development, but as we noted earlier this week, airfares and motor vehicle insurance alone accounted for more than half of the step down in supercore CPI between April and May, and we would be careful to extrapolate too much of the weakness in the May print (see US Treasury Market Daily, 6/12/14).
Figure 3: Money markets are pricing in 50bp of easing over 2H24...
Cumulative easing priced by FOMC meeting as priced by OIS forward rates; bp

Source: J.P. Morgan
Figure 4: ..and Treasuries appear fairly valued for the first time in 3 months
Residual of J.P. Morgan 10-year Treasury fair value model*; bp
Source: J.P. Morgan, Federal Reserve, US Treasury
** Regression of 10-year Treasury yields on 5Yx5Y seasonally-adjusted TIPS breakevens (%), 3m3m OIS rates (%), Fed policy guidance (months), J.P. Morgan US Forecast Revision Index (%), and SOMA share of outstanding marketable US Treasury debt, excluding T-bills (%). Regression over the last 5-years. R-squared = 98.3%, SE = 17.1bp
Rangebound, lower volatility markets make the case for carry trading, but as we’ve highlighted recently, risk-adjusted carry has declined sharply in recent months, and means investors need confidence volatility has significant room to decline to support these trades. The 20-year sector is emblematic of this dynamic, as much of its outperformance through the spring was supported by declining volatility (see Treasuries, US Fixed Income Markets Weekly, 5/31/24). We also observe this dynamic in a range of butterflies. As a reminder, 3-months ago, we recommended 3s/5s/7s belly richening butterflies for carry, with a relative value overlay (see Treasuries, US Fixed Income Markets Weekly, 3/15/24). These butterflies have outperformed in recent months, and the 5-year sector is now trading near the richest levels on the fly year-to-date, limiting the room for further belly outperformance ( Figure 5). Against this backdrop, we recommend taking profits on 3s/5s/7s belly-richening butterflies (see Trade recommendations).
Figure 5: Low-risk, positive carry butterflies have outperformed in recent months and are now closer to fairly valued
50:50 weighted Treasury butterflies over the last 3 months, with statistics from 3-month regression on level and curve, and 3-month carry and roll;
| Butterfly | Level | R^2 | Beta to t5 | Residual | Z-score | 3m C+R |
| 2s/3s/5s | -3.2 | 37.3% | 0.04 | -0.5 | -0.6 | -0.1 |
| 2s/3s/7s | -2.2 | 53.8% | 0.06 | -0.2 | -0.3 | -1.4 |
| 2s/5s/10s | -22.3 | 91.7% | 0.14 | -0.1 | -0.1 | 4.1 |
| 2s/5s/30s | -29.2 | 86.7% | 0.21 | 0.3 | 0.2 | 2.9 |
| 2s/10s/30s | -30.5 | 87.0% | 0.12 | 0.7 | 0.7 | 7.5 |
| 3s/5s/10s | -9.2 | 79.8% | 0.07 | 0.3 | 0.5 | 0.9 |
| 3s/5s/7s | -8.9 | 69.1% | 0.05 | 0.7 | 1.4 | 2.0 |
| 3s/10s/30s | -17.4 | 72.9% | 0.05 | 0.8 | 1.1 | 4.4 |
| 3s/5s/30s | -16.1 | 88.1% | 0.14 | 0.6 | 0.8 | -0.3 |
| 5s/7s/10s | -1.2 | 20.6% | 0.01 | -0.9 | -1.5 | 0.3 |
| 5s/10s/30s | -7.5 | 32.0% | 0.02 | 0.5 | 1.0 | 1.1 |
| 10s/20s/30s | 18.5 | 14.0% | -0.01 | 2.0 | 1.9 | 1.3 |
Source: J.P. Morgan
Over the near term, we think the risks to the Treasury market are actually skewed bearishly. Internationally, our colleagues in European rates strategy think the the French story is more idiosyncratic than systemic in nature for the time being, with limited region-wide macro implications. They think the sharp widening in OAT/bund spreads is only justified if RN wins and takes a confrontational fiscal approach: this is less plausible in their minds and they believe this week’s widening was excessive (see Euro Cash, Global Fixed Income Markets Weekly, 6/14/24). Returning close to home, we forecast retail sales rose 0.4% in May (consensus: 0.3%) with the important control series rising 0.5% over the month (consensus: 0.3%, see Economics). This forecast appears to be supported by strength in our Chase consumer card data, which point to a 0.7% rise in the control measure on the month (see Daily consumer spending tracker, Dan Weitzenfeld, 6/12/24). Combined, with yields sitting at the lowest levels in nearly 3 months, the data developments looking more positive next week, and the French political uncertainty unlikely to have broader macro implications, we recommend turning tactically bearish on Treasuries. Along the curve, the 5-year sector is trading near the richest levels on the fly YTD (Figure 5). Accordingly, we recommend tactical shorts in 5-year Treasuries, and will keep a close eye on developments in Europe (see Trade recommendations).
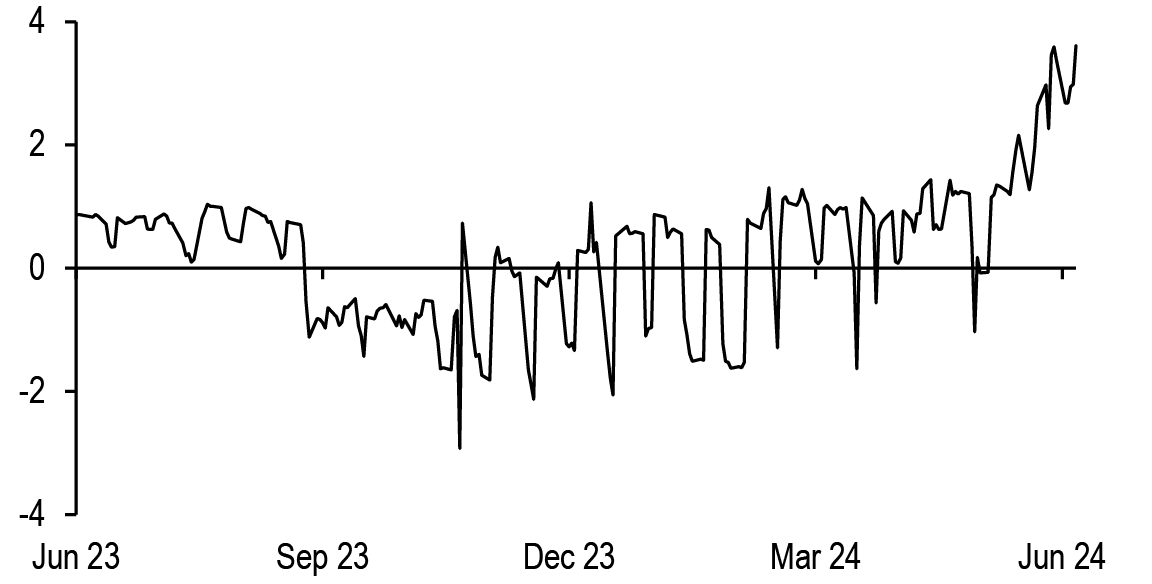
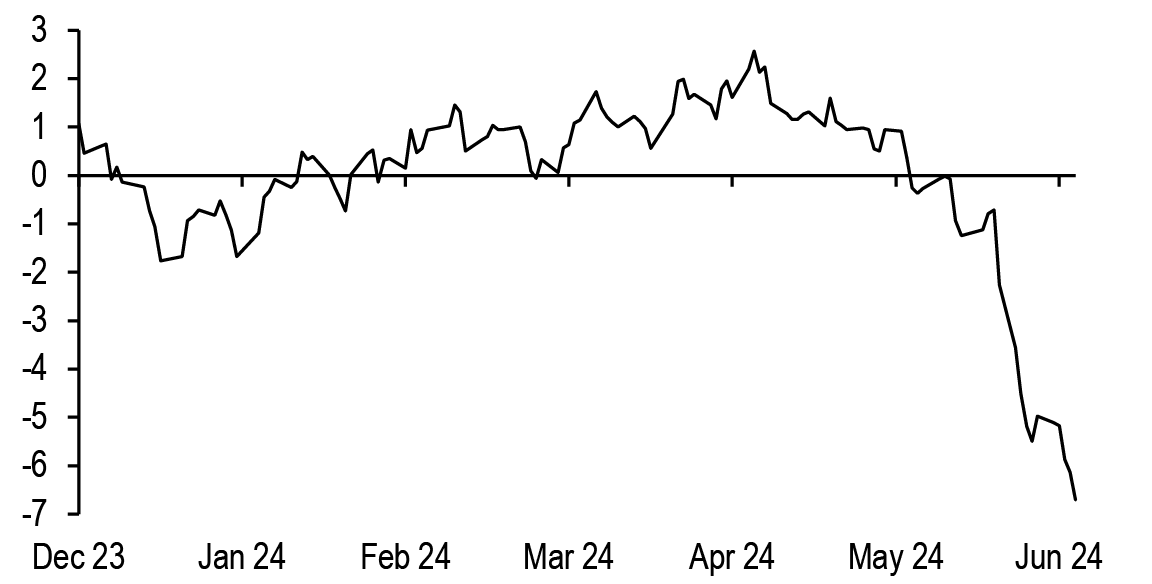
Turning to relative value, we see opportunities in the 2036-38 sector, as these securities have underperformed significantly relative to our par curve over the last 4 weeks. In particular, we like to fade the cheapening in 4.75% Feb-37s ( Figure 6). Separately, we note that 4.5% Aug-39s, the CTD into USM4, have outperformed recently, but this security will drop out of the US deliverable basket next week, and likely has room to cheapen. Further, as Figure 7 shows, the Feb-37/ Aug-39 appear 6.9bp too flat relative to the shape of 10s/20s. Against this backdrop, we recommend 100:98 weighted 4.75% Feb 37s / 4.5% Aug 39s steepeners (see Trade recommendations).
Figure 6: 4.75% Feb 37s have underperformed significantly in recent weeks
1-year z-score of 4.75% Feb-37 yield error;
Source: J.P. Morgan
Figure 7: Feb-37s / Aug-39s appear too flat relative to the shape of the 10s/20s Treasury curve
Residual of 4.75% Feb 37s / 4.5% Aug 39s curve regressed on 10s/20s Treasury curve; bp
Source: J.P. Morgan
R-squared: 34.9%; S.E. 1.8bp
Can open interest concentration in futures contracts indicate crowded positioning?
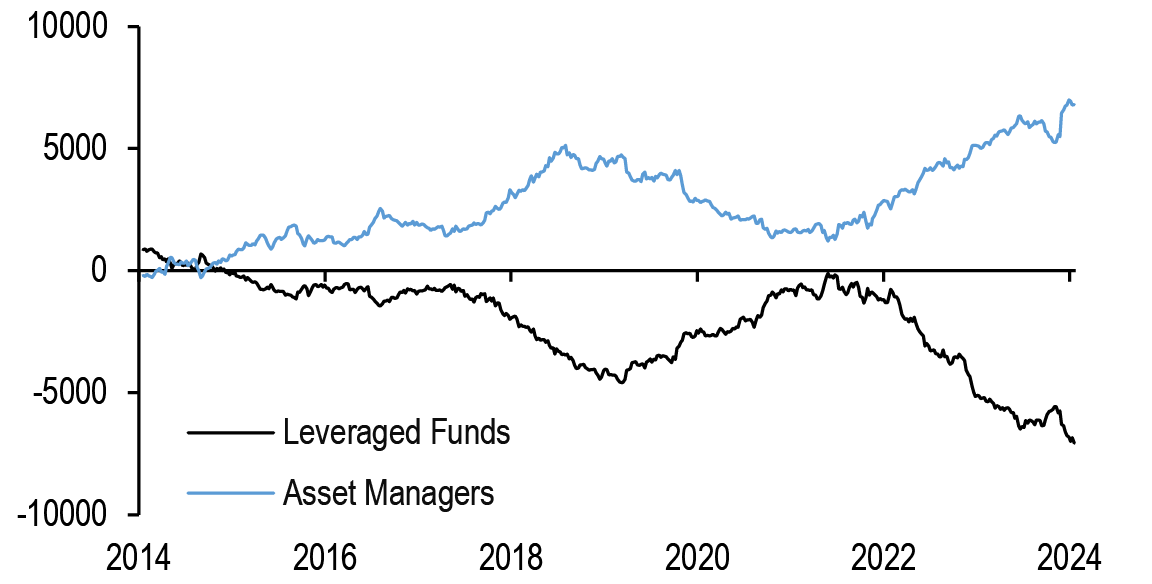
The CFTC’s weekly Commitment of Traders release remains one of our preferred measures of investor positioning, alongside our weekly Treasury Client Survey, as well as empirical measures of positioning across actively-managed bond funds, macro hedge funds, and CTAs (see Appendix). Historically, we have used the sum of speculative positioning across the Treasury futures complex to discern shifts in speculative positioning in rates over time, but this series has shown a net short for the better part of the last decade, and has only grown over the last year even after the Fed has gone on hold, indicating this structural short. The growth of levered shorts is largely equal to the opposite of the growth in net longs in futures contracts from the asset manager community ( Figure 8).
This is well known by market participants, but work done by the TBAC earlier this year showed the structural asset allocation preference of active fixed-income managers and associated demand for Treasury futures likely richens valuations compared to underlying cash Treasuries. The richness of futures creates a premium that can be captured in long Treasury cash/futures basis trades, by hedge funds. Accordingly, we can conclude that much of the buildup of speculative short positioning in Treasury futures in recent years can be more attributed to basis positioning than duration positioning. Fortunately, CFTC also offers other data on the concentration of open interest, which we can use to divine the concentration of positioning in Treasury futures at any given time, and give us potential insight into the direction of travel in Treasury yields over multiweek horizons.
Figure 8: Speculative positioning in rates is structurally short and can be attributed to basis trades, rather than duration positioning
Net longs across Treasury futures*; thousands of contracts
Source: CFTC
*across TU, FV, TY, UXY, US, and WN
Figure 9: The 4 largest traders represent a disproportionately large share of UXY longs and WN shorts
Net open interest of top 4 and top 8 firms as a share of total net interest (%) and 1- year z-scores, as of 6/4/2024;
| Longs | Shorts | |||||||
| Contract | Top 4 net | Top 8 net | Top 4 net | Top 8 net | ||||
| TU | 17% | -1.8 | 24% | -1.8 | 25% | -1.7 | 36% | -1.8 |
| FV | 20% | -0.8 | 28% | -0.8 | 21% | -1.9 | 34% | -0.8 |
| TY | 20% | -0.8 | 27% | -1.1 | 20% | 0.8 | 28% | -0.4 |
| UXY | 26% | -1.8 | 37% | -1.8 | 18% | -1.8 | 27% | -1.4 |
| US | 22% | -0.3 | 37% | 0.6 | 25% | 1.7 | 35% | 1.7 |
| WN | 21% | 0.3 | 33% | -0.4 | 32% | -0.5 | 42% | -0.7 |
Source: CFTC
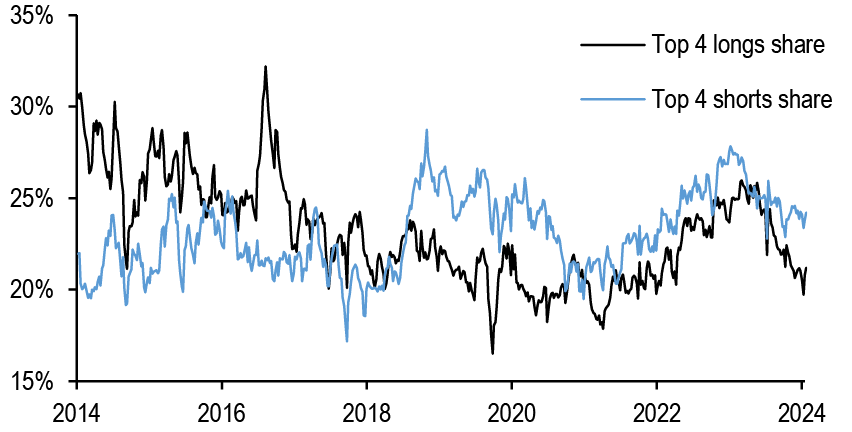
Hence, we expand our analysis of CFTC data and consider the evolution of open interest concentration as a metric for measuring crowding in futures positions: Figure 9 presents the top 4 and top 8 investor shares of net longs and shorts across Treasury future contracts, alongside their respective 1-year z-scores. It’s important to make a few observations as it relates to utilizing this data in order to predict near-term rates moves. First, as discussed above, asset managers show a net long bias in futures over time and are more likely to use futures to express duration views. The opposite is true for leveraged funds, which are persistently net short futures, likely reflecting Treasury basis positions. Hence, the concentration of net longs offers a more relevant contrarian trading signal than that of net shorts. Relatedly, we note that the top 4 share of net longs has generally been more volatile and less concentrated than that of net shorts ( Figure 10).
Second, intuitively, this concentration measure offers an asymmetric trading signal. Indeed, net longs that are highly concentrated amongst just a few investors might suggest a higher risk that a shift in those positions could support a near-term move to higher yields. On the other hand, when concentration drops below historical averages, that’s consistent with more breadth in positioning, that is less at risk of a near-term unwind. Accordingly, we focus on large deviations to the upside on the share of net longs held by the largest traders.
Third, the four largest investors typically account for disproportionately larger shares of FV and UXY contracts on the long side, and WN contracts on the short side. Currently, as Figure 9 also shows, the top 4 net long shares of UXY and WN open interest remain larger those of other contracts, while the top 4 net longs share FV OI is more in line with other contracts. More broadly, at this point, the concentration of net longs does not appear elevated in any of the contracts in the Treasury futures complex, so therefore we wouldn’t expect significant moves in yields over the near term based off concentrated futures positioning.
More broadly, we don’t see significant net short position concentration across futures contracts, with the exception of the US contract, which suggests basis positioning may be significantly larger than at any point over the last year. Further, while the US contract shows greater concentration of OI relative to 1-year averages, it’s notable that WN concentration remains significantly higher.
Figure 10: Over the last 5 years, we have tended to notice greater concentration in shorts in futures contracts than longs
Top 4 net long and short shares* of total open interest across all Treasury future contracts; %
Source: CFTC *
Average across TU, FV, TY, UXY, US, and WN contracts in TY equivalents
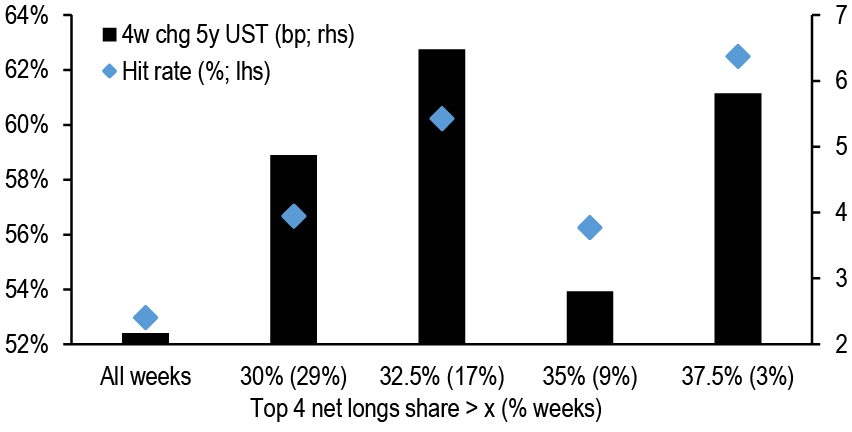
Figure 11: Large concentrations of FV longs usually precede moves to higher yields...
Hit rate* (%; lhs) and average change in 5-year Treasury yields in the following 4- week period (bp; rhs) by top 4 net longs share of FV OI over the past 10 years
Source: CFTC, J.P. Morgan
*Hit rate defined as % of instances when 5-year Treasury yields rose in the 4 weeks following a given top 4 net longs share of FV OI
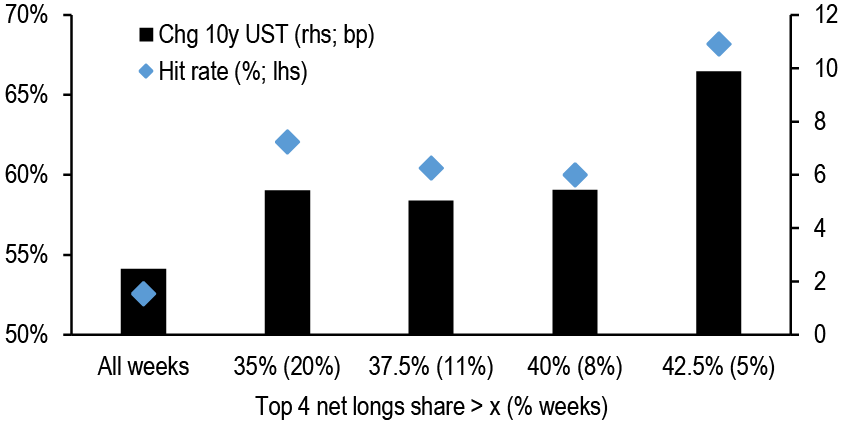
Interestingly, we find that when open interest on the long side is disproportionately concentrated amongst a small group of investors, this can offer a signal on the near-term direction of yields. Starting with FVs, on average over the last decade, when the share of open interest held by the 4 largest investors rises above 30% (29% of observations), 5-year Treasury yields proceed to rise 4.9bp in the following 4-weeks ( Figure 11). This result compares with an average 2.2bp rise over rolling 4-week periods over the last decade. As the figure also shows, these results are somewhat consistent, with hit rates between 56% and 63% depending on the concentration threshold, versus 53% for all observations over the last decade. Interestingly, these results are even more robust over the last five years. During this shorter period, the top 4 net longs share rose above 30% in only 15% of instances, with a 56% hit rate; more interestingly, in the 6% of instances when the top 4 share rose above 32.5%, 5-year interest rates always proceeded to move higher in the near term. Turning to UXYs, we find similar results, with larger concentrations of open interest also preceding upward moves in 10-year yields in the following 4 weeks ( Figure 12). On average, 10-year yields rose by 5.4bp in the 4-week period following a greater than 35% concentration of open interest in the 4 largest investors (20% of all observations over the last decade), with hit rates between 60% and 68% for the different thresholds presented. This result compares with an average 2.5bp rise, and a 53% hit rate for all observations since the launch of the contract in 2016. Further, we’d also note these results remain relevant if we instead focus on the share of open interest held by the top 8 net longs.
Away from FVs and UXYs, we do not find consistent results across other Treasury futures contracts: Figure 13 summarizes the hit rates, or percentages of instances when Treasury yields rose over subsequent 4-week periods, for each bucket of top 4 net longs share of open interest. In particular, TY and both long-end contracts (US and WN) show counterintuitive results, as hit rates drop for higher top 4 net long shares of OI. In the case of TYs, we think this result is explained by a structurally lower concentration since the introduction of the UXY contract in 2016, suggesting some larger end users have shifted their duration position out the curve over the period. Turning to US and WN, the top 4 net long shares of OI in these contracts are both less volatile and structurally lower over time, so we’re not surprised they don’t offer a good near-term trading signals. Overall, we find meaningful and consistent results for FVs and UXYs, but not in the other Treasury futures contracts. We think investors should consider key concentration thresholds of the top 4 investors, such as 30% of open interest in the case of FV and 35% in the case of UXY as near term trading signals for considering setting Treasury shorts.
Figure 12: …We find similar results for large concentrations of UXY OI
Hit rate* (%; lhs) and average change in 10-year Treasury yields in the following 4- week period (bp; rhs) by top 4 net longs share of UXY OI since March 2016
Source: : CFTC, J.P. Morgan
*Hit rate defined as % of instances when 10-year Treasury yields rose in the 4 weeks following a given top 4 net longs share of UXY
Figure 13: The concentration of net longs does not provide a useful signal in other contracts
Hit rates* for different Treasury contracts and top 4 net longs share of OI over the last 10-years; %
| TU | Share > (% time) | All weeks | 22.5% (34%) | 25% (19%) | 27.5% (8%) | 30% (3%) |
| Hit rate | 61% | 60% | 66% | 64% | 53% | |
| FV | Share > (% time) | All weeks | 30% (29%) | 32.5% (17%) | 35% (9%) | 37.5% (3%) |
| Hit rate | 53% | 57% | 60% | 56% | 63% | |
| TY | Share > (% time) | All weeks | 27.5% (26%) | 30% (17%) | 32.5% (12%) | 35% (6%) |
| Hit rate | 50% | 45% | 43% | 38% | 33% | |
| UXY** | Share > (% time) | All weeks | 35% (20%) | 37.5% (11%) | 40% (8%) | 42.5% (5%) |
| Hit rate | 53% | 62% | 60% | 60% | 68% | |
| US | Share > (% time) | All weeks | 20% (61%) | 22.5% (29%) | 25% (15%) | 27.5% (6%) |
| Hit rate | 62% | 45% | 50% | 46% | 54% | |
| WN | Share > (% time) | All weeks | 20% (64%) | 21.5% (42%) | 23% (20%) | 24.5% (7%) |
| Hit rate | 62% | 45% | 42% | 39% | 31% |
Source: CFTC, J.P. Morgan
*Hit rates defined as % of instances when Treasury yields rose in the 4-weeks following a given top 4 net longs share of OI (TU and 2-year Treasury yields, FV and 5-year Treasury yields, TY and 7-year Treasury yields, UXY and 10-year Treasury yields, US and 20-year Treasury yields, WN and 30-year Treasury yields) **since March 2016
Trade recommendations
- Initiate 5-year duration shorts
- Sell 100% risk, or $50mn notional of T 4.5% May-29s (yield: 4.227%; bpv: $446/mn)
- Yield is 4.227%. One-month weighted carry is 2.1bp and roll is 0bp
- Initiate 100:98 weighted 4.75% Feb 37s / 4.5% Aug 39s steepeners
- Buy 100% risk, or $25mn notional of T 4.75% Feb-37s (yield: 4.165%; bpv: $1010/mn)
- Sell 98% risk, or $22mn notional of T 4.5% Aug-39s (yield: 4.272%; bpv: $1125/mn)
- Weighted spread is -2.1bp. One-month weighted carry is -0.2bp and roll is 0bp
- Unwind 50:50 weighted 3s/5s/7s belly-richening buterflies
- Unwind short 50% risk, or $45mn notional of T 4.25% Mar-27s
- Unwind long 100% risk, or $56.3mn notional of T 4.25% Feb-29s
- Unwind short 50% risk, or $20.9mn notional of T 4.25% Feb-31s
-(US Fixed Income Markets Weekly, 3/15/24: P/L since inception: 2.1bp)
- Maintain 5s/30s steepeners
- Stay long 100% risk, or $112mn notional of T 4.875% Oct-28s
- 100% risk, or $29.9mn notional of T 4.75% Nov-53s
- (US Treasury Market Daily, 11/22/23: P/L since inception: -15.1bp)
- Maintain 75%/6% weighted 5s/10s/30s belly-cheapening butterflies
- Stay long 75% risk, or $43mn notional of T 4.625% Sep-28s
- Stay short 100% risk, or $33.3mn notional of T 3.875% Aug-33s
- Stay long 6% risk, or $1mn notional of T 4.125% Aug-53s
- (US Fixed Income Markets Weekly, 9/29/23: P/L since inception: -10.1bp)
Figure 14: Closed trades in last 12 months
P/L reported in bp of yield unless otherwise indicated
| TRADE | ENTRY | EXIT | P/L |
| Duration | |||
| 5-year duration longs | 05/19/23 | 06/29/23 | -45.8 |
| 5-year duration longs | 08/04/23 | 09/08/23 | -27.6 |
| 5-year duration longs | 10/03/23 | 11/02/23 | 14.9 |
| 7-year duration shorts | 11/03/23 | 11/22/23 | -7.9 |
| 30-year duration shorts | 12/15/23 | 01/04/24 | 10.9 |
| 5-year duration longs | 01/19/24 | 02/01/24 | 25.3 |
| 5-year duration longs | 02/09/24 | 03/07/24 | 3.3 |
| Equi-notional 2s/5s flatteners | 05/31/24 | 06/06/24 | 16.0 |
| Curve | |||
| 10s/30s steepener | 12/16/22 | 09/29/23 | 3.0 |
| 10s/30s steepener | 11/03/23 | 11/22/23 | -7.3 |
| 2s/5s flatteners | 12/08/24 | 05/17/24 | 6.0 |
| Relative value | |||
| 100:95 weighted Nov-43s/May-48s flatteners | 04/28/23 | 06/15/23 | 3.8 |
| 52:59 10s/20s/30s belly-cheapening butterflies | 07/07/23 | 07/14/23 | 4.0 |
| 97:100 weighted Aug-32s/Aug-33s steepeners | 06/09/23 | 08/03/23 | 1.6 |
| 100:96 weighted 3.5% Feb-39 / 3.75% Nov-43 flatteners | 07/28/23 | 08/16/23 | 3.2 |
| 2.75% Aug-32/ 3.5% Feb-39 steepeners | 01/10/24 | 01/26/24 | 5.2 |
| 20s/ old 30s flatteners | 02/15/24 | 05/10/24 | -2.6 |
| 100:97 weighted 3.75% Apr-26/ 4.625% Sep-26 flatteners | 04/12/24 | 05/17/24 | 2.2 |
| 100:95 weighted 4% Feb-28 / 4% Feb-30 steepeners | 02/23/24 | 05/31/24 | -6.6 |
| 50:50 weighted 3s/5s/7s belly-richening buterflies | 03/15/24 | 06/14/24 | 2.1 |
| Number of positive trades | 14 | ||
| Number of negative trades | 6 | ||
| Hit rate | 70% | ||
| Aggregate P/L | 3.7 |
Source: J.P. Morgan