This document is being provided for the exclusive use of energynews@bloomberg.net.
02 August 2024
Global Commodities
Northern summer energy demand drives down global commodity availability - in fundamental contrast to the BCOM crunch
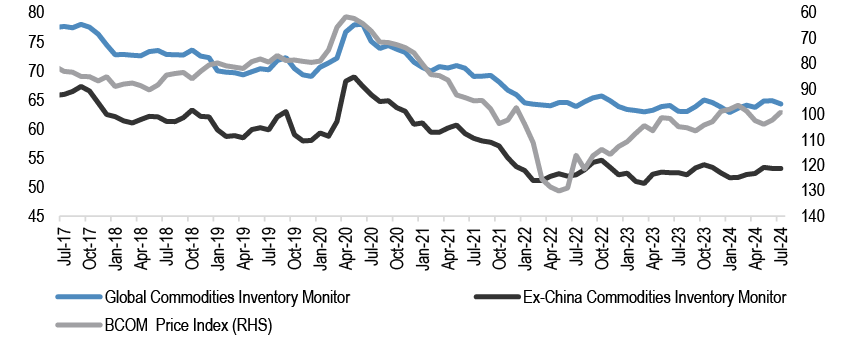
Global commodity inventory availability declined by -0.9% MOM through July to a three-month low of 64.3 days-of-use, from 64.9 days-of-use in June, as rising energy demand through the Northern summer and declining crude & product inventories weighed on availability. On an Ex-China basis (Ex-China CIM), the monitor, which is a proxy for globally tradeable inventories, was stable on the month at 53.2 days-of-use - albeit susceptible to a decline off these levels in future updates according to our Oil Demand and Inventory Tracker.
The BCOM Index suffered a largely non-fundamental decline of -4.5% MOM in July - the largest monthly drop since May 2023. Investor length has been unwound across the complex, amid US election uncertainty, disappointing policy meetings in China, and a moderation in 2H24 global growth (listen to our thoughts here). After the weak July US employment report, our US economist now sees the FOMC cutting by 50bp at both the September and November meetings, followed by 25bp cuts at every meeting thereafter (Weak jobs to prompt strong Fed action, Feroli, 2 August).
Energy demand picked up in July in the GCIM through the Northern summer, and crude and product inventories continued to draw, intensifying the decline in the availability. In the Ex-China CIM the July data suggests a slight moderation in demand on the month, however this series was revised higher last month and our high frequency indicators suggest that an upward revision for July is also likely. US natural gas availability declined for a consecutive month, as demand growth outstripped the inventory build. Base metals markets have been under pressure amid positioning unwinds, however availability declined modestly in the GCIM. Base metals availability increased in the Ex-China CIM however, following an increase in nickel deliveries on the LME amid boosted Chinese exports. Agri availability declined through July across all markets except for soybeans in the GCIM, while availability declined across all agri markets in the Ex-China CIM.
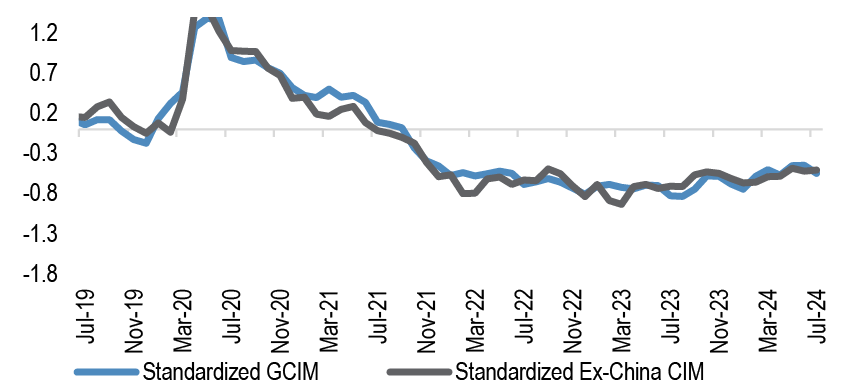
On a standardised basis, the July GCIM z-score declined to -0.55 SD, from -0.45 SD in June, while the tradeable commodity inventories z-score increased to -0.51 SD, from -0.52 SD in June.
On a seasonal basis, July monthly inventory availability at the world level typically declines by the most all year at a 5-year average of -1.8% MOM, while the Ex-China CIM typically declines by some -0.6% MOM. The July 2024 GCIM declined at a much slower pace of -0.9% MOM, similarly the Ex-China CIM stability was also contrary to the seasonal norm.
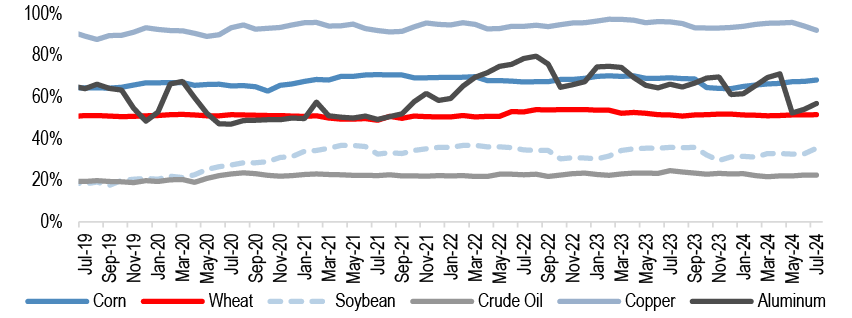
Tradeable commodity stocks remain critically low, and the abundance of available inventories in leading commodity consumer and importer China remains sizeable. Inclusive of exchange, visible commercial inventories, and strategic stockpiles, China currently holds an estimated 92% of global visible copper inventories (-2.1%-pt MOM), 57% of global visible aluminum (2.9%-pt MOM), 68.2% of corn (+0.7%-pt MOM), 51.5% of wheat, 35.4% of soybeans (+2.6%-pt MOM), and 22.5% of crude oil (+0.1%-pt MOM), according to our sources. Chinese SRB holdings alone account for 80% of global copper inventories (-2.1%-pt MOM) and 22% of global aluminium inventories (+0.3%-pt MOM).
All data are available on J.P. Morgan DataQuery, and the series of underlying commodity days of use have been added. API capabilities are also available.
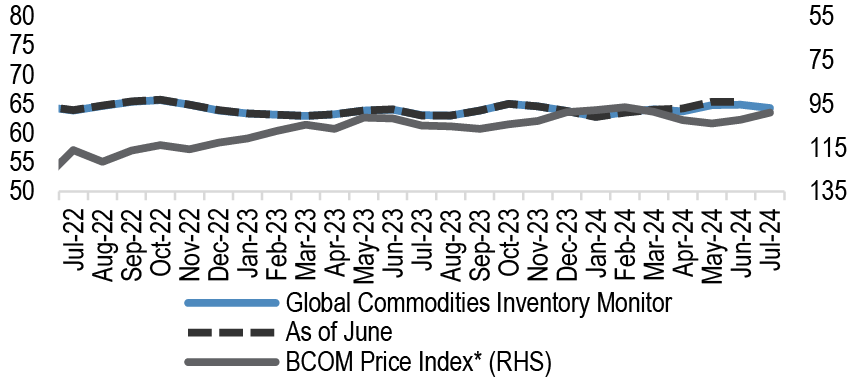
Figure 1: Global commodity inventory availability declined by -0.9% MOM in July while the Ex-China CIM was flat on the month
LHS: Inventories in days of use; RHS: BCOM Price index (inverted)
Underlying commodity inventories have been converted to days of use and the relevant annual BCOM weighting factor applied to each underlying. BCOM weights recalculated after excluding: Silver, Gold, Live Cattle, Lean Hogs.
Source: Bloomberg Finance L.P., S&P Global Platts, IEA, EIA, USDA, various exchanges, J.P. Morgan Commodities Research BCOM Price Index = Quarterly average for historicals and spot for current month
Global Commodities Inventory Monitor
The Global Commodities Inventory Monitor provides an indication of available inventories across the vast global commodities complex based on underlying demand ( Figure 1). It is a useful tool when assessing the availability of commodities in aggregate and is derived from 17 underlying energy, metals, and agricultural products (see Methodology and Data input and sources). The GCIM is reported on both a Global and Ex-China basis in days of use ( Figure 2), standardised z-score ( Figure 4), and by subsector ( Figure 5, Figure 6). The annual Bloomberg Commodities Index Target Weights are applied to underlying products to arrive at an aggregated indicator representative of the relative importance of the commodities to the global economy.
Global commodity inventory availability declined by -0.9% MOM through July to a three-month low of 64.3 days-of-use, from 64.9 days-of-use in June, as rising energy demand through the Northern summer and declining crude product inventories weighed on availability. On an Ex-China basis (Ex-China CIM), the monitor, which is a proxy for globally tradeable inventories, was stable on the month at 53.2 days-of-use - albeit susceptible to a decline off these levels according to our Oil Demand and Inventory Tracker.
The BCOM Index suffered a largely non-fundamental decline of -4.5% MOM in July - the largest monthly drop since May 2023. Investor length has been unwound across the complex, amid US election uncertainty, disappointing policy meetings in China, and a moderation in 2H24 global growth (listen to our thoughts here). After the weak July US employment report, our US economist now sees the FOMC cutting by 50bp at both the September and November meetings, followed by 25bp cuts at every meeting thereafter (Weak jobs to prompt strong Fed action, Feroli, 2 August).
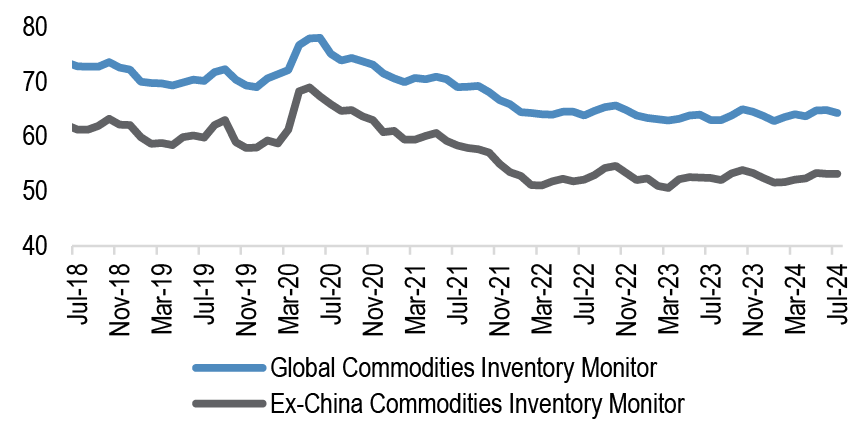
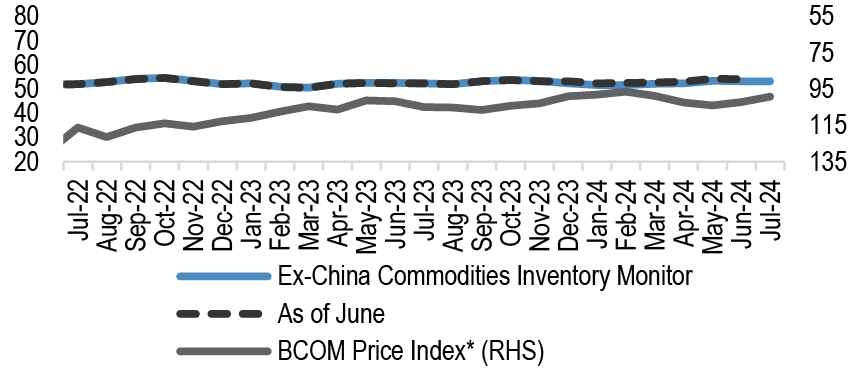
Figure 2: The Global Commodities Inventory Monitor is reported on both a global and ex-China basis, showing apparent inventories on a days of use basis
Days of use underlying commodity inventories have been converted to days of use and the relevant monthly BCOM weighting factor applied to each underlying. BCOM weights recalculated after excluding: Silver, Gold, Live Cattle, Lean Hogs.
Source: S&P Global Platts, IEA, EIA, USDA, various exchanges, J.P. Morgan Commodities Research
The GCIM provides an indication of total global commodity inventories on a demand basis, while the Ex-China CIM provides a guide to inventories available for global trade, stripping out the influence of China’s extensive commodity inventories. Inclusive of exchange, visible commercial inventories, and strategic stockpiles, China currently holds an estimated 92% of global visible copper inventories (-2.1%-pt MOM), 57% of global visible aluminum (2.9%-pt MOM), 68.2% of corn (+0.7%-pt MOM), 51.5% of wheat, 35.4% of soybeans (+2.6%-pt MOM), and 22.5% of crude oil (+0.1%-pt MOM), according to our sources. Chinese SRB holdings alone account for 80% of global copper inventories (-2.1%-pt MOM) and 22% of global aluminium inventories (+0.3%-pt MOM). As China’s inventories are not typically available for world market trade, the Ex-China monitor is a useful proxy for the relative availability of tradeable commodities for the world market. The GCIM and Ex-China CIM have broad applications but are most useful when assessing sector-wide inventories, which can help to inform views and trading decisions, amid heightened volatility and geopolitical risks.
Figure 3: China’s share of world commodity inventories
%
Source: Bloomberg Finance L.P. Finance, Kpler, CRU, USDA, various exchanges, J.P. Morgan Commodities Research
The standardised GCIM and sectoral breakdowns of commodity inventories
Displaying the GCIM based on days of use provides an easy-to-interpret indicator ( Figure 1). However, it is also slightly ambiguous, as observations among the 17 underlying commodities are sourced from different data populations. Our preferred method of displaying the GCIM is a z-score ( Figure 4). This method standardises the days of use of each underlying commodity, essentially making the data comparable, before applying the BCOM target weighting factor. At the time of publishing, on a standardised basis, the July GCIM z-score declined to -0.55 SD, from -0.45 SD in June, while the tradeable commodity inventories z-score increased to -0.51 SD, from -0.52 SD in June.
Figure 4: The Global and Ex-China Commodities Inventory Monitor reported in standardised form
Z-scores of global commodities inventories as days of use
Source: S&P Global Platts, IEA, EIA, USDA, various exchanges, J.P. Morgan
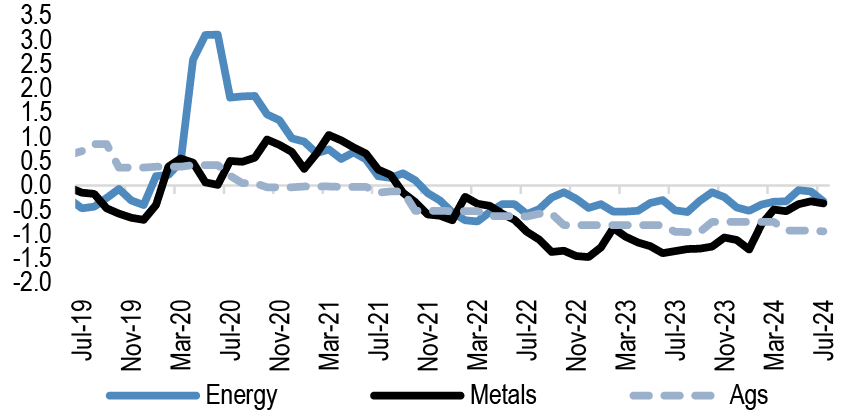
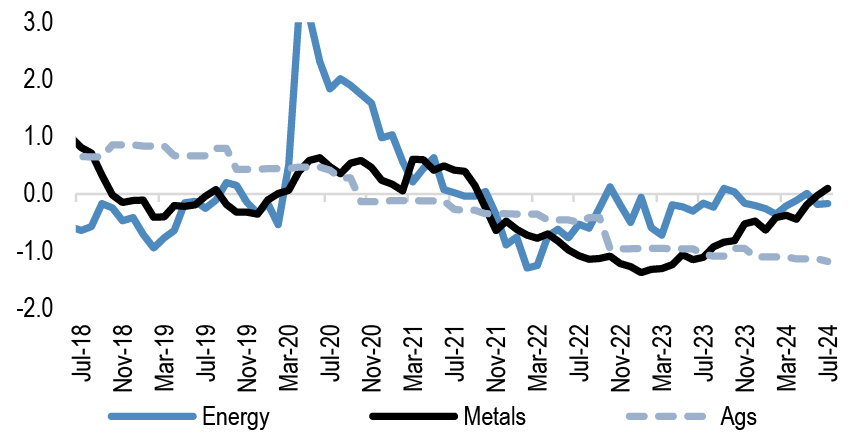
Energy demand picked up in July in the GCIM through the northern summer, and crude and product inventories continued to draw, intensifying the decline in the availability. In the Ex-China CIM the July data suggests a slight moderation in demand on the month, however this series was revised higher last month and our high frequency indicators suggest that an upward revision for July is also likely. US natural gas availability declined for a consecutive month, as demand growth outstripped the inventory build. Base metals markets have been under pressure amid positioning unwinds, however availability declined modestly in the GCIM. Base metals availability increased in the Ex-China CIM however, following an increase in nickel deliveries on the LME amid boosted Chinese exports. Agri availability declined through July across all markets except for soybeans in the GCIM, while availability declined across all agri markets in the Ex-China CIM.
Figure 5: Sectoral Global Commodities Inventory Monitors
Z-scores of global commodities inventories as days of use
Source: S&P Global Platts, IEA, EIA, USDA, various exchanges, J.P. Morgan Commodities Research NB-incorporates historical revisions to standardised metals inventories
Z-scores of global commodities inventories as days of use
Source: S&P Global Platts, IEA, EIA, USDA, various exchanges, J.P. Morgan Commodities Research NB-incorporates historical revisions to standardized metals inventories
Seasonality of commodity inventories
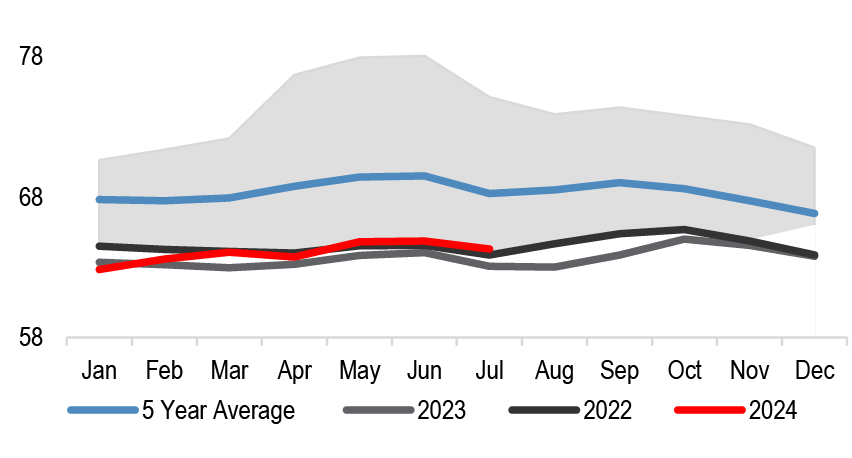
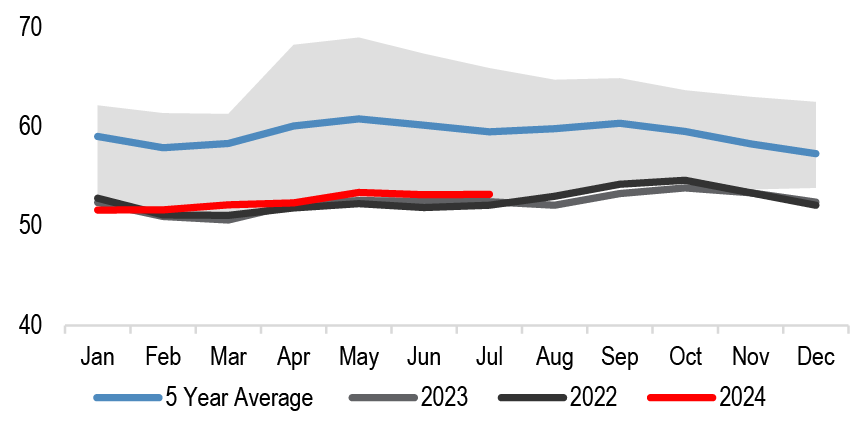
Commodity inventories are inherently seasonal in nature. On a seasonal basis, July monthly inventory availability at the world level typically declines by the most all year (5-year average decline of -1.8% MOM), while the Ex-China CIM typically declines by some -0.6% MOM. The July 2024 GCIM declined at a much slower pace of -0.9% MOM, similarly the Ex-China CIM stability was also contrary to the seasonal norm ( Figure 7, Figure 8).
Figure 7: Global commodities inventory seasonality
Inventories as days of use
Source: S&P Global Platts, IEA, EIA, USDA, various exchanges, J.P. Morgan Commodities Research
Z-scores of global commodities inventories as days of use
Source: S&P Global Platts, IEA, EIA, USDA, various exchanges, J.P. Morgan Commodities Research
Data Revisions
In the commodities space, historical data revisions are commonly made and these can alter the index. Historical data revisions were negligible in June ( Figure 9, Figure 10). Ex-China oil & product demand was revised higher on the month, reducing the June Ex-China CIM reading slightly.
Figure 9: The Global Commodities Inventory Monitor monthly update
LHS: Inventories in days of use; RHS: BCOM Price index (inverted)
Source: Bloomberg Finance L.P. Finance, S&P Global Platts, IEA, EIA, USDA, various exchanges, J.P. Morgan Commodities Research
Figure 10: The Ex-China Commodities Inventory Monitor monthly update
LHS: Inventories in days of use; RHS: BCOM Price index (inverted)
Source: Bloomberg Finance L.P., S&P Global Platts, IEA, EIA, USDA, various exchanges, J.P. Morgan Commodities Research
The GCIM has been compiled based on available inventory data across 17 underlying commodities based on the days of use (2017-present). The annual BCOM Target Weight is then applied to each underlying commodity (BCOM weights recalculated after excluding Silver, Gold, Live Cattle, Lean Hogs) to arrive at a representative cross-commodity index of inventories in days of use. We monitor inventories on both a Global and an Ex-China basis to account for inventories that may be locked out of the world market. See Global Commodities Inventory Monitor – data inputs and sources, Allen et al., 25 February 2022, for further details including data sources and relevant tickers.
Data inputs
Energy inventories comprise oil, products, and natural gas
Oil and products: Global oil inventories reflect the sum of crude, gasoline, and diesel (Americas, APAC, Europe, FSU, Middle East, and Africa), Strategic Petroleum Reserves, in-transit, and floating vessels from S&P Global Platts. Demand is Total IEA reflecting available data, with J.P. Morgan estimates thereafter.
Ex-China inventories reflect OECD industrial inventories from IEA reflecting available data, with J.P. Morgan estimates thereafter. Demand is OECD IEA reflecting available data, with J.P. Morgan estimates thereafter.
Inventories are measured in million barrels and demand in million barrels per day, both inventories and demand data are monthly series, and the days of use ratio is calculated as inventory(t)/demand(t).
Natural Gas: Inventories data represent U.S. working natural gas in underground storage from the U.S. Department of Energy’s Energy Information Administration and European storage from S&P Global Platts. Working gas is defined as gas available for withdrawal above the level of base gas that is needed to maintain adequate pressure and deliverability rates. The series is estimated weekly from the source while we use these data with a monthly granularity. US demand data are sourced from natural gas consumption from the US Energy Information Administration (EIA). Both inventories and demand are measured in billion cubic feet, the days-of-use ratio is calculated as inventory(t)/demand(t), for which the demand is divided by the number of days in a month.
As only US data are used for natural gas, the methodology and inputs are consistent across both the Global and Ex-China monitors.
Agriculture: Global inventories reflect the USDA’s global inventory and domestic consumption estimates for corn, wheat, soybeans, soybeans oil, soybeans meal, cotton, and coffee while Green Pool’s global inventory and domestic consumption estimates are used for sugar. Respective marketing year-level estimates are divided to obtain daily use, and a days-of-use ratio is calculated as inventory(t)/daily use(t). Days of use are replicated across each month for respective international marketing years. Please note that figures for the sugar market for the 2023/24 MY are J.P. Morgan forecasts, i.e., inventory/consumption data starting Apr 2022.
The Ex-China inventory methodology takes the same approach as above, but uses the USDA’s world minus China inventory and consumption data for corn, wheat, soybeans, soybeans oil, soybeans meal, cotton, and coffee. We continue to use global data for sugar.
Metals: Metals inventories reflect visible inventories that are tracked via exchange or surveyed in China and that are not necessarily a representation of a full universe; however, they provide a useful proxy.
Global inventories include copper inventories from SHFE, COMEX, LME, SRB, and China Bonded; aluminium inventories from SHFE, COMEX, LME, SRB, and China Regional; nickel inventories from SHFE, LME, Bonded; zinc inventories from SHFE, COMEX, LME, Bonded, and Nanchu; lead inventories from SHFE, LME, and China Regional. Demand for all metals is global, demand’s source for metals ex-lead is CRU until 2014 and J.P. Morgan from 2015-YTD. Lead demand is from Wood Mackenzie.
Ex-China inventories include copper inventories from COMEX and LME; aluminium inventories from COMEX and LME; nickel inventories from LME; zinc inventories from COMEX and LME; lead inventories from LME. Demand for all metals is Ex-China, demand source for metals ex-lead is CRU until 2014, and J.P. Morgan over 2015-YTD. Lead demand is from Wood Mackenzie.
Inventories and demand are measured in 1,000 metric tonnes. The days-of-use ratio is calculated as inventory(t)/demand(t), for which the demand is divided by the number of days in a year as demand granularity is annual.
BCOM weighting: Underlying commodity inventory days of use are weighted based on the relevant annual BCOM Target Weight. BCOM weights are recalculated after excluding Silver, Gold, Live Cattle, Lean Hogs. The BCOM weighting is applied to arrive at a representative cross-commodity index of inventories in days of use. The BCOM uses both liquidity data and US dollar–weighted production data in determining the relative quantities of included commodities within the index, to produce representative index of the importance of underlying commodities in the global economy.