The J.P. Morgan View : Unwinding carry trades
June 20, 2024
The J.P. Morgan View : Unwinding carry trades
20 June 2024

Update (first published 17 June 2024) (See disclosures for details)

This material is neither intended to be distributed to Mainland China investors nor to provide securities investment consultancy services within the territory of Mainland China. This material or any portion hereof may not be reprinted, sold or redistributed without the written consent of J.P. Morgan.

The J.P. Morgan View

Unwinding carry trades

J.P. Morgan does and seeks to do business with companies covered in its research reports. As a result, investors should be aware that the firm may have a conflict of interest that could affect the objectivity of this report. Investors should consider this report as only a single factor in making their investment decision.

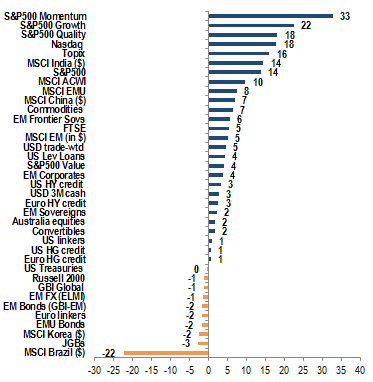
YTD returns by asset

Source: J.P. Morgan.

Cross-Asset Strategy: Bonds rallied amid softer US inflation data and flight-to-quality flows after the snap decision by French President Macron to call a Parliamentary election. Despite softer inflation data, Chair Powell struck a less dovish tone and the median dots suggested just one cut this year. With markets pricing in two cuts and yields at the lower end of their ranges, we turn tactically bearish 5Y USTs. While French spreads have started to price in a higher probability of tail risk scenarios, there are fiscal constraints to an NR government; we are neutral Euro duration and hold 5s/10s Germany. We see no change in BoE policy or guidance at this week’s MPC meeting, and remove our bullish duration bias on the rally in rates. The macro backdrop is supportive for US HG, but lower yields may be a near-term headwind to already tight spreads. US HY credit metrics show broad-based deterioration but remain historically strong. In FX, a rotation away from carry to other drivers of returns has been a key theme for us given expectations of yield compression that would make FX carry vulnerable to vol shocks. Brazil equities are cheap, but face headwinds from persistent outflows and high domestic opportunity cost from double-digit policy rates.

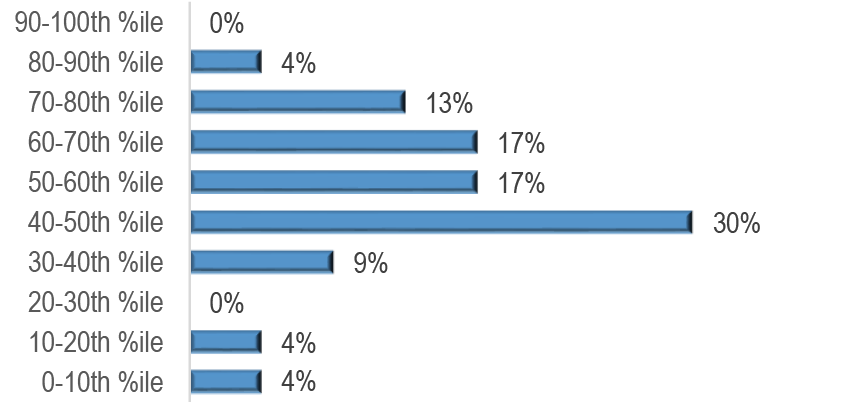
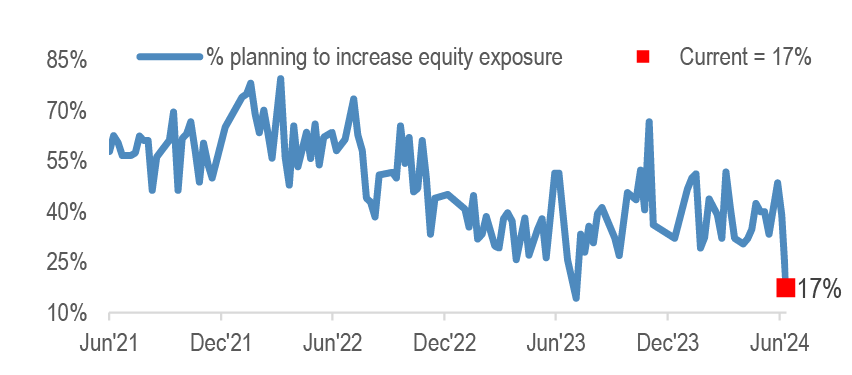
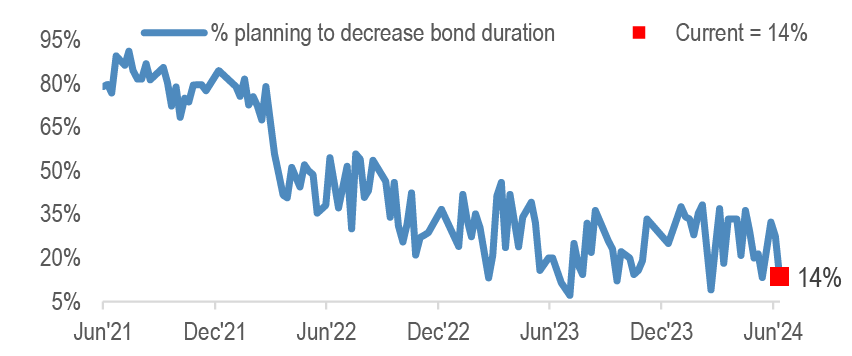
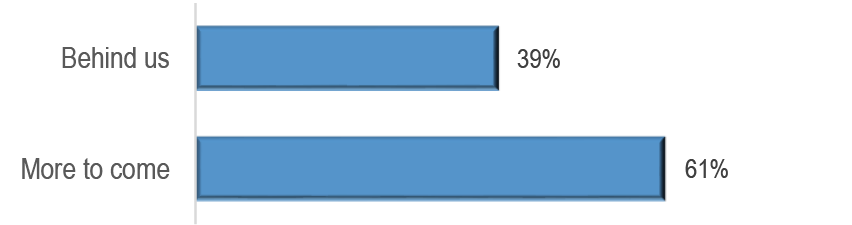
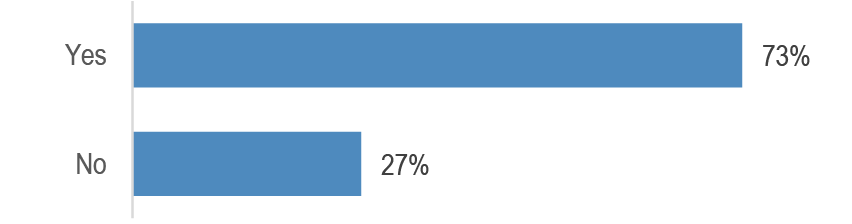
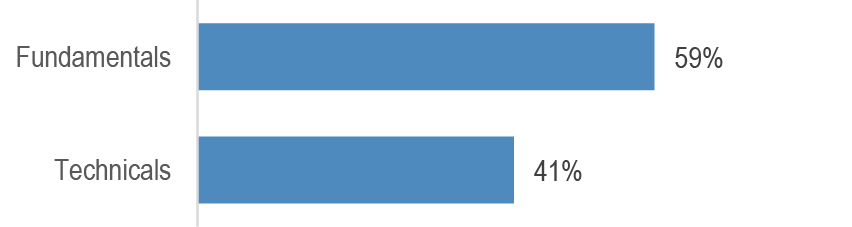
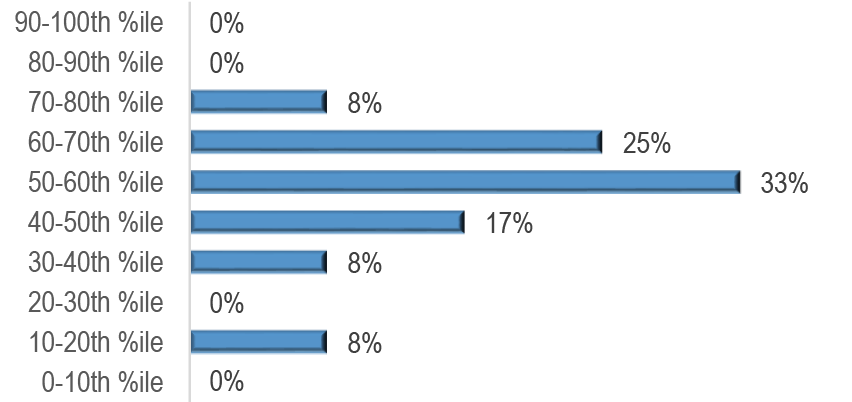
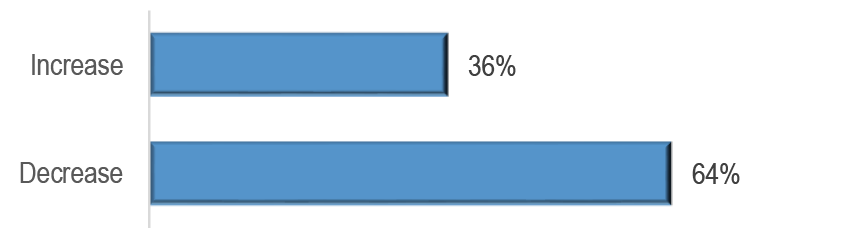
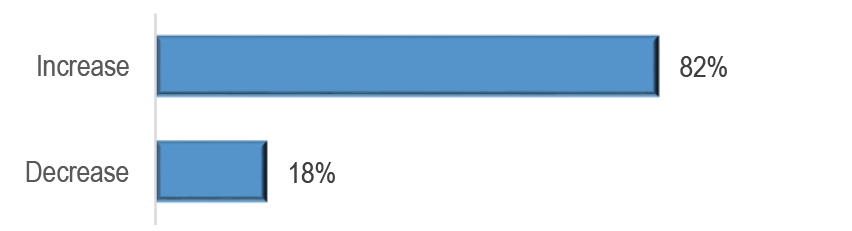
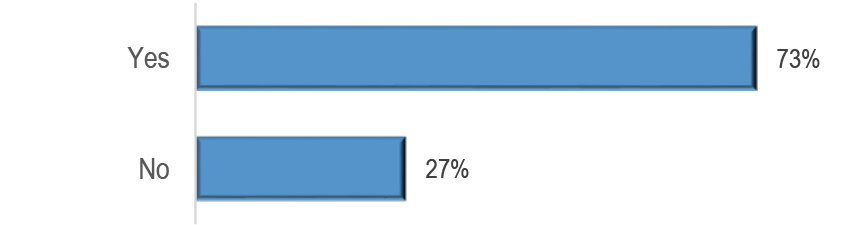
JPM Clients’ View: Click here to take this week’s survey . This week we poll investors on European elections, the Fed and CPI, in addition to our running sentiment questions. Our last survey results indicated: (1) average equity exposure/sentiment is ~52nd percentile; (2) 17% planned to increase equity exposure, and 86% to increase bond duration near term; (3) 61% believe markets haven't fully priced in recent EM elections and 73% believe they are underpricing risks around remaining elections this year; (4) 59% believe the recent decline in oil was primarily due to fundamentals; (5) respondents saw the June ECB meeting as modestly more hawkish than expected.

Long carry/short volatility trades are being unwound: Election surprises sparked an unwind of carry trades including the French-German yield spread, peripheral euro area sovereign spreads, and MXN. Political and liquidity risks continue to pose downside to crowded long carry/short vol trades, including US equities, which are at risk if political headwinds intensify into the US election. While the benign US CPI and PPI reports provide some relief, our bias is to view these inflation surprises as one-offs. The narrow path for a soft landing and very little recession risk priced into risky assets also pose downside risk if cycle worries were to return.

New trades:US / Euro credit trades for 2H (Doctor / Lamy); Euro Banks option trades (Silvestrini); Schatz call spreads (Gupta).

Cross-Asset Strategy

Economics

Inflation drop trumps Fed caution in market pricing of Fed. Chair Powell linked the change in this year’s dot plot to a lack of progress on lowering inflation this year. By contrast, US rates rallied last week and price a lower year-end policy rate than the latest Fed dot plot. The main catalyst for this move was a surprisingly low set of May inflation readings. The Fed has signalled it will remain patient in the face of modest inflation disappointment, but the market also recognizes that it will likely move toward easing relatively quickly if the May reports are followed by a string of moderate inflation readings.

France snap election and excessive deficit procedure is not a good mix. President Macron called snap lower house elections due to the rise in far-right support. Developments so far have been unfavorable for Macron as the Left formed an alliance, significantly raising the risk that Le Pen’s NR wins a majority in the lower house. There are signs that the NR has moderated some of its positions over time, but concerns around their stance on fiscal matters remain, particularly given France is about to enter an Excessive Deficit Procedure. An NR-led government could test the new EU fiscal framework, which could have far-reaching implications, a concern reflected in the OAT-Bund spread spiking to above 70bps.

South Africa GNU points to centrist rule; Mexico reforms a concern. After the recent EM elections, political and policy risks are shifting. Post-election uncertainty had appeared highest in S.Africa, but the GNU deal clears the way for Cyril Ramaphosa to be re-elected. In contrast, policy risk in Mexico has risen after Morena’s constitutional majority was confirmed. Of particular concern is the planned overhaul of the judiciary system, which would weaken the Supreme Court and eliminate the Injunction Law. A silver lining is the government’s ability to approve fiscal plans, but we expect only a watered-down, 2-step fiscal plan to be implemented over 2Y.

Equities

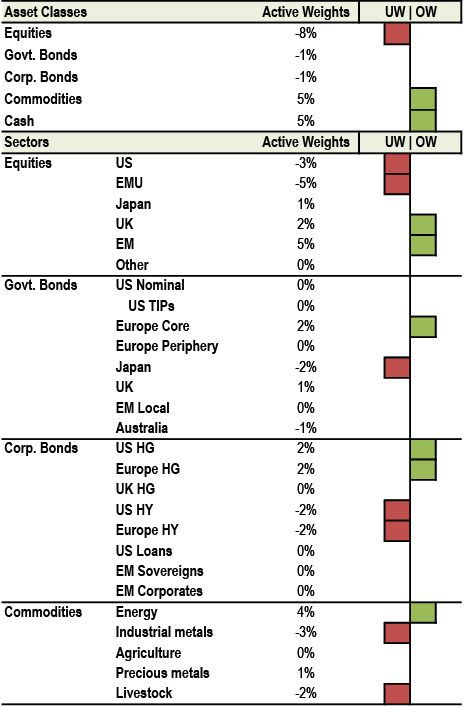
QTD Defensive sectors are trading in-line in Europe, a change from Q1 where they underperformed. We believe this shift will last, on further repricing of a range of tail risks, and reiterate our barbell of OW Defensives and Commodities. This is in contrast to the frequent feedback from investors that one should be buying Cyclicals now that PMIs are picking up. US growth momentum is slowing into year end, and bond yields are likely to be flat or move lower into year end, which should support bond proxies (Equity Strategy, Jun 16th).

Our cautious stance has been based on our view that there is no re-rating upside, and that any upside had to therefore come from earnings growth, which we see being insufficient to take on equity risk even under best case scenario assumptions. For equities to avoid a 20%+ correction, you have to believe that tech will become a much more meaningful driver of growth for the broad economy in short order. While we believe tech will continue to be the key driver of economic growth for years to come, we don’t think its impact on corporate P&Ls across the board will be that profound so suddenly, and so we remain cautious here, expecting economic growth to weaken, equities to correct, and investors to find a better entry point (The SMid View, Jun 11th).

June BoJ monetary policy meeting and implications for stock market. Following the dovish decision, the market could push out its outlook for the pace of interest rate growth, but we also see potential for a gradual easing of yen depreciation pressure, which has weighed on Japanese stocks. The BoJ plans to present a policy for starting JGB reductions on a “substantial scale” at the July MPM. We remain OW on financial and consumer spending-related stocks (Japan Equity Strategy, Jun 14th).

Brazil equities are cheap, with many quality stocks trading below 10x forward P/E and +10% EPS growth. Brazil is exposed to the global story: Fed easing, China stronger equity performance, stronger global PMIs are all potential positive catalysts. Yet, two main domestic obstacles remain to allow value perception to come to higher price reality: (1) persistent domestic outflows; and (2) high domestic opportunity cost from double-digit policy rates (EM Lighthouse, Jun 17th).

Bonds

Bonds rallied sharply amid softer US inflation data and flight-to-quality flows after the snap decision by French President Macron to call a Parliamentary election. Despite softer inflation data, Chair Powell struck a less dovish tone than in recent FOMC press conferences and the median dots suggested just one cut this year. With markets pricing in two cuts vs. one cut in our forecast, yields at the lower end of their ranges, last week’s moves amplified by flight-to-quality flows, and this week’s activity data expected to turn more positive, we turn tactically bearish 5Y USTs and keep 5s/30s steepeners.

In the Euro area, a flight-to-quality rally along with the softer US inflation data supported Germany. While French spreads have started to price in a higher probability of disruptive tail risk scenarios, there are fiscal constraints to a National Rally government. We are neutral duration and pare back on bullish exposure by taking profit on 1Y/1Yx1Y €STR curve flatteners. We hold 5s/10s Germany and 2Yx2Y/ 10Yx10Y EUR swaps steepeners. In the UK, we see no change in BoE policy or guidance at the MPC meeting. The rally in rates means we remove our bullish duration bias, and close 1Y/1Yx1Y SONIA curve flatteners.

In EM, a combination of local concerns over judicial independence in Mexico and fiscal policy in Brazil, as well as upcoming US elections that shorten the runway for tactical opportunities, we pare back on risk by turning neutral Brazil and Colombia local duration (Latam Local Markets, June 13th). We are neutral local duration overall, with OWs Poland, Türkiye and Uruguay offset by a short duration overlay and an UW in Thailand (EMOS, Jun 6th).

Credit

The macro backdrop is supportive, but lower yields may be a near-term headwind to already tight spreads. Key positives for US HG credit spreads include the strong equity markets rally, reasonable dealer positions, and a slowdown in supply. However, valuations are tight leaving limited room for further tightening, and the recent decline in yields poses a challenge. It remains uncertain whether it will cause some investors to step back. While the move down in yields last week is due to benign inflation data, which is a favorable driver, historically spreads struggle to tighten when yields are declining, until they stabilize again (CMOS, Jun 14th).

US HY credit metrics show broad-based deterioration but remain historically strong. A review of 1Q24 credit metrics unveiled erosion in credit metrics given 1) a q/q increase in leverage (though leverage remains comfortably below the long-term average), 2) EBITDA declining on a y/y basis for only the second time since 2020, 3) profit margins deteriorating to a 3Y low, and 4) interest coverage ratios dipping below 5x for the first time since 4Q21 following double-digit increases in LTM interest expense for four consecutive quarters (1Q24 High Yield Credit Fundamentals, Jun 12th).

At such rich valuations, the investment case for Euro credit rests on this ‘not too hot - not too cold’ environment holding while the disinflation process plays out. In our view, investors have become largely de-sensitized to headline noise after 4Y of history defining events, which means that volatility is likely to remain low provided that the economy remains broadly healthy. Technicals could strengthen further over 2H24 on slower supply, as there is only a short window for primary due to the sports and political calendar. European growth is recovering, supporting credit fundamentals and suppressing default rates. We revise our Euro IG spread forecast down slightly to 120bp, essentially flat to current levels, and look for a more moderate 55bp widening in Euro HY to 375bp (European Credit Mid-Year Outlook, Jun 12th). In our view, the French elections pose a tactical buying opportunity. However, we would focus on segments that have only been indirectly affected, such as Italian bank AT1, short-call corporate hybrids, or subordinated insurance. Following the outlook, we have added OW LL vs HY and OW B vs BB to our top trade portfolio (European Credit Weekly, Jun 14th).

Currencies

When yield compression and volatility collide. A rotation away from carry to other drivers of returns has been a key theme for us. The view was motivated by expectations of yield compression which would make FX carry vulnerable to any vol shocks. This staple source of currency returns for two years finally met its reckoning as a series of VaR shocks eliminated most of carry YTD returns. While certain high-yielders could recover depending on idiosyncratic developments, global FX carry remains vulnerable given lower yields; by contrast G10 carry is likely to be more resilient given sticky inflation. The sum total of US developments is that yields have peaked for now and by extension, that USD upside from higher yields is dissipating for now. The dollar is overshooting US yields, so can weaken in the near-term if vol subsides. But US elections will ultimately limit USD weakness.

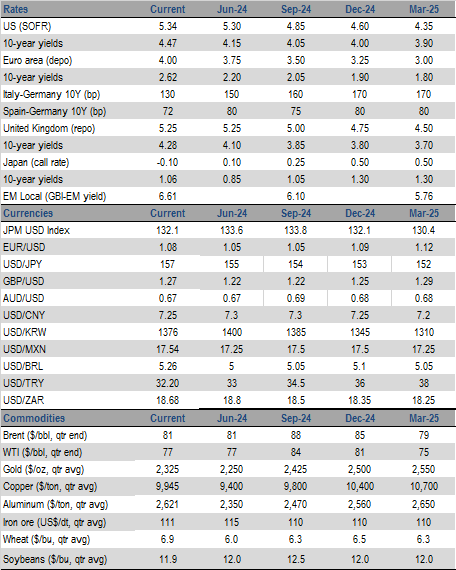
G10 forecasts: EUR/USD 3Q 1.05 unched. Yen downgraded on BoJ; USD/JPY 4Q 156 (153). GBP upgraded on growth; EUR/GBP 0.83 (0.87). EM: CNY downgraded on Fed. USD/CNY 7.30 (7.25). USD/INR 83.80 (83.90). HUF, CZK upgraded. EUR/HUF 390 (400). EUR/CZK 25.75 (26.00). ZAR unchanged; shift to constructive bias. Latam downgraded. USD/MXN 17.75 (17.50). USD/BRL 5.20 (5.10) (KCV, Jun 14th).

Commodities

Acknowledging the notable slowdown in drilling activity, we reduce our 2024 US crude oil output estimates. While oil recovered per foot drilled in the US shale basins fell 12% since its peak in 2021, operational efficiencies, which began being implemented more widely last year, are more than offsetting declining productivity and relatively low rig count. On an annualized basis, we project another 400 kbd growth in US NGLs supply in 2024 and an additional 350 kbd in 2025 (Oil Markets Weekly, Jun 13th).

Major exporter grain stocks decline to critical lows in the otherwise benign June WASDE. Markets had arguably digested much of the fundamental adjustments embedded in the June report during 2H May; however, associated risk premiums have also since eroded across the wheat complex. We stay long the agri complex via an index as our price forecasts sit above futures curves, and markets are discounting supply-side and geopolitical risks – which remain heightened, in our view. Our highest-conviction long underlyings are ICE #11 Sugar, CBOT Wheat and CBOT Corn (Agricultural Markets Weekly, Jun 13th).

JPM Clients’ View

Click here to take this week’s survey

This week, we poll investors on European elections, the Fed and CPI, in addition to our running survey questions on equity positioning/sentiment, and intentions for near-term changes to equity allocation and bond duration. The results from the last survey are shown below.1

Figure 1: What is your current equity positioning or sentiment in historical terms, expressed from most bearish (0th percentile) to most bullish (100th percentile)?

Source: J.P.Morgan

Figure 2: Are you more likely to increase or decrease equity exposure over the coming days/weeks?

Source: J.P. Morgan.

Figure 3: Are you more likely to increase or decrease bond portfolio duration over the coming days/weeks?

Source: J.P. Morgan.

Figure 4: Do you think the market reaction to recent elections in EM (Mexico, India, South Africa) is behind us, or is there more to come?

Source: J.P. Morgan.

Figure 5: Do you believe markets are underpricing the risks around remaining elections this year (e.g., US, UK, France)?

Source: J.P. Morgan.

Figure 6: Do you think the recent decline in oil was driven primarily due to a reassessment of fundamentals, or technical flows?

Source: J.P. Morgan.

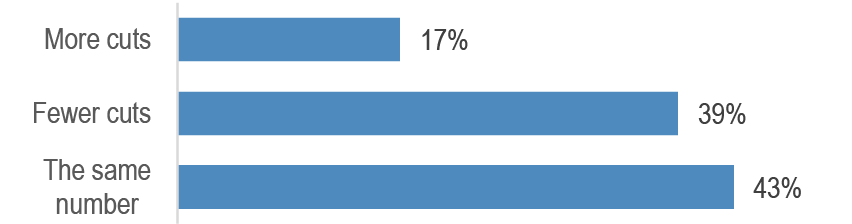
Figure 7: Do you expect more or fewer ECB cuts this year following the June ECB meeting, compared to your expectations prior to the meeting?

Source: J.P. Morgan.

JPM Clients’ View - This Week’s Interim Survey Results

The charts below show interim results from this week’s survey, collected over the first ~24 hours it was live. The survey remains open here, and we will show updated results in the next J.P. Morgan View publication

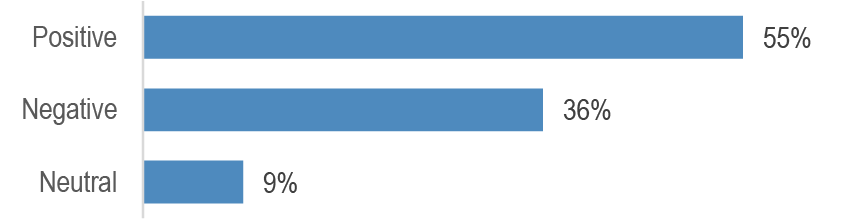
Figure 8: What is your current equity positioning or sentiment in historical terms, expressed from most bearish (0th percentile) to most bullish (100th percentile)?

Source: J.P.Morgan

Figure 9: Are you more likely to increase or decrease equity exposure over the coming days/weeks?

Source: J.P. Morgan.

Figure 10: Are you more likely to increase or decrease bond portfolio duration over the coming days/weeks?

Source: J.P. Morgan.

Figure 11: Do the French elections have systemic implications for the broader Eurozone?

Source: J.P. Morgan.

Figure 12: Would a large majority win in the UK elections be positive or negative for UK assets?

Source: J.P. Morgan.

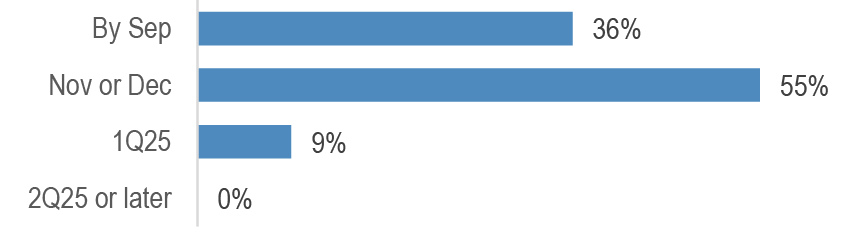
Figure 13: Following last week’s CPI data and FOMC, what’s your current expectation for when the Fed will first cut rates?

Source: J.P. Morgan.

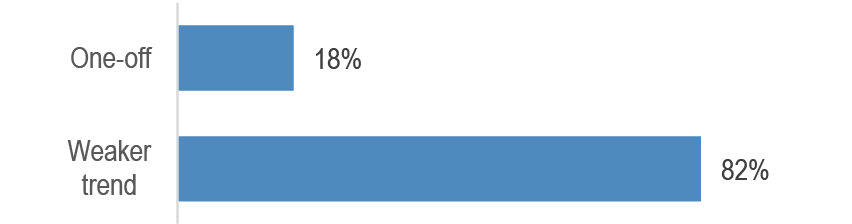
Figure 14: Do you believe the weakness in US May CPI and PPI was a one-off or the start of a weaker trend?

Source: J.P. Morgan.

Long carry/short volatility trades are being unwound

While global equity markets continued to drift higher over the past week, there have been divergences and the macro picture has become rather confusing due to conflicting indicators.

Both US CPI and PPI inflation posted significant negative surprises bolstering hopes of Fed rate cuts and thus a soft landing. It is difficult to tell at this point whether these negative inflation surprises were one-offs or the beginning of a new trend of benign US inflation prints. Given the May US CPI/PPI surprises were largely driven by a few components such as air fares and car insurance, our bias is to view these inflation surprises as one-offs.

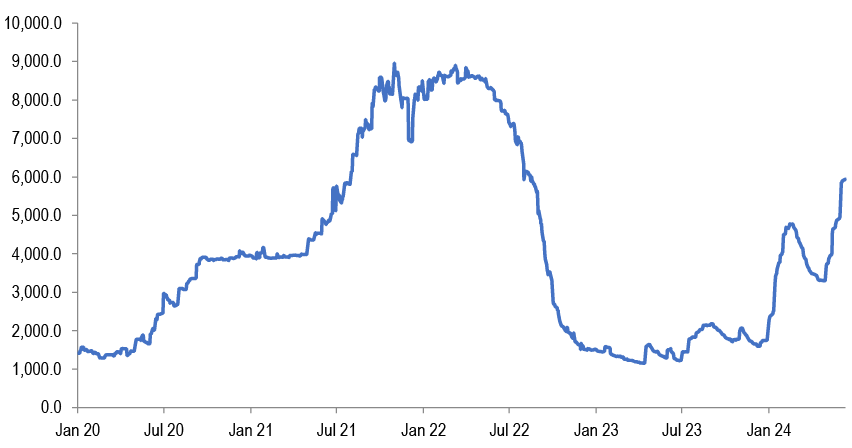
Outside these components, US services inflation remains elevated and in goods space the continued rise in global shipping costs is likely to put upward pressure over the coming months. Figure 15 shows that global shipping costs continue to rise, surpassing the previous highs from January.

On the growth front, while the picture outside the US remains solid, the latest US labor market indicators send conflicting messages. While the US payroll survey was strong, the US household survey and weekly initial jobless claims are conveying a more negative picture. While our bias is to put more weight on the US payroll survey, the recent rise in weekly jobless claims is concerning to us and their trajectory needs to be watched closely over the coming weeks. If the US weekly initial jobless claims fail to go back down below the 230k mark and instead they continue to drift upwards, then US recession fears will likely re-emerge unsettling risk markets.

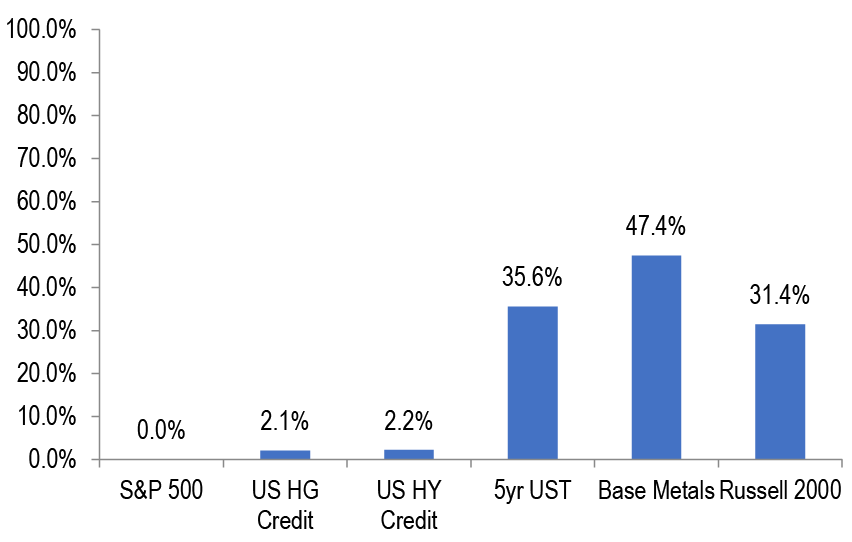
This shows how narrow the soft landing scenario is. While last week’s benign US inflation prints reinforce the soft landing scenario, if a significant softening of US labor markets is taking place at the same time, the combination could quickly see market participants becoming concerned about a near term US recession. And as we argued previously in our publication, very little US recession risk is currently priced in across risk assets. To gauge US recession risk our approach has been to compare the current cycle peak to trough declines of equity indices to those seen during previous recessions. Given the higher cyclicality and interest rate sensitivity of small caps due to their greater reliance on floating rate debt, that makes them a more suitable place to gauge cyclical risks. The average peak to trough decline for US small caps has been around 33%, over the previous twelve US recessions, only modestly worse than the 29% seen for the S&P 500. Since its January 2022 peak the Russell 2000 small cap index has declined by around 10%, mechanically implying 10%/33%=31% probability of US recession ( Figure 16). In other words, our simple framework implies that small caps price in rather modest probability of US recession. And most other asset classes including the S&P 500, price in even lower probability of US recession.

Another headwind for markets is the emergence of political risk. After Brazilian, Mexican, Indian, South African political/policy risks, French political risk has emerged as a headwind for not only French assets but also euro assets more broadly. While polls hint at a possible Le Pen victory in the coming French lower house election, the outcome of the French election remains uncertain with alliances currently being built in both the right and the left. A new program was released yesterday from Le Pen National Rally party and there were some significant shifts. On the fiscal side, the party wants to reduce electricity prices and lower the VAT rate on gas and fuel prices, while the party originally wanted a lower VAT rate for a much larger set of items. Separately, party leader Bardella argued that the retirement age would not be lowered. These shifts suggest that the risk of a very large fiscal slippage is likely less significant than first anticipated. On the negative side the program is short and lacks many details to make a proper assessment (see latest note by our colleague Raphael Brun-Aguerre, June 14th). More importantly, a dysfunctional cohabitation between the President and a Le Pen government could result to new lower house election within a year, prolonging political uncertainty.

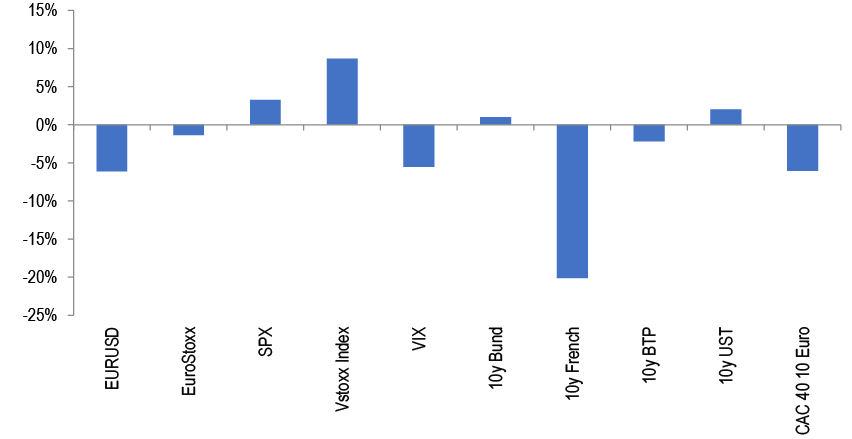
The market reaction has so far been focused on French assets. As shown in Figure 17 the largest position reductions have been in French government bond futures followed by CAC40 futures. There has been a more modest de-risking in other futures contracts, thus suggesting that so far investors see the coming French election more as a local problem rather than a systemic problem for the eurozone. That could change however if the rhetoric from Le Pen’s party starts becoming more anti-EU, for example in a scenario where a Le Pen led administration challenges the EU framework.

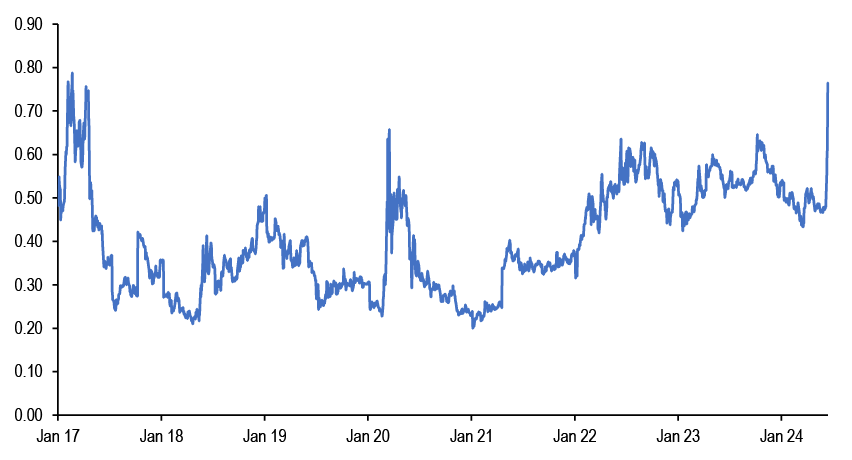
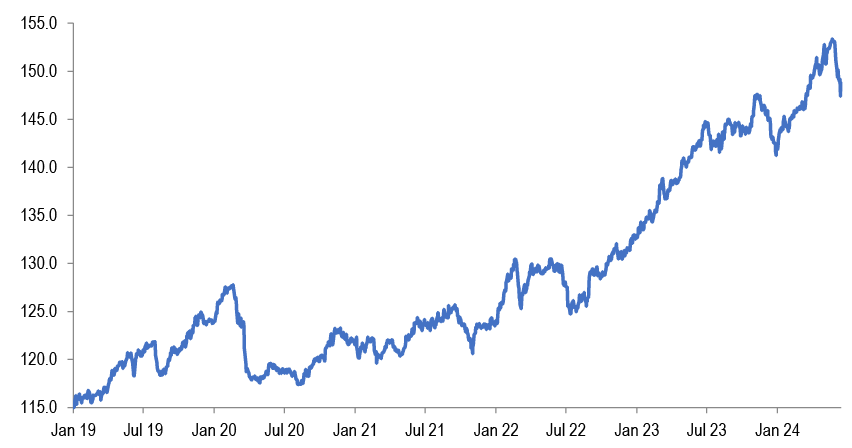
The widening of the French-German 10y government bond yield spread to the highest level since the French presidential election of 2017 ( Figure 18) looks set to continue for at least a few more weeks until the coming French election at the beginning of July. In our opinion this widening of the French-German government bond yield spread is not an isolated phenomenon, but part of a broader trend of unwinding of certain long carry /short vol trades due to political risks. This includes the widening of peripheral euro area sovereign spreads as well as the weakness in crowded EM carry trades such as previous long positions in Mexican peso. The recent weakness in Mexican peso is an example of the unwinding of a sizeable FX carry trade that was previously building up for two years, from mid 2022 to end-May 2024 ( Figure 19). Ultra low equity vol is another manifestation of the crowdedness of the carry trade in equity space in particular in the US ( Figure 20), which is at risk of being unwound if political/policy headwinds intensify into this year’s US presidential election. While we see little implication for UK assets from the coming UK general election, the balance of risks is skewed to the downside in a scenario where a Labour government raises more taxes than those outlined in its manifesto, in particular capital gains taxes.

An additional headwind for markets stems from liquidity as central banks shrink their balance sheets. While the BoJ delayed details of its QT process to July meeting, it appears to be looking to shrink its JGB holdings at a much faster pace than the current market expectation of a bit over JPY10 trillion per year. And this adds to the liquidity reduction from other major central banks. Even as the Fed is reducing its QT pace, the ECB looks set to offset some of that decline by shifting to partial reinvestment of its PEPP portfolio in 2H24 and ending reinvestments at the turn of the year. While we had previously noted that net sales by G4 central banks look set to continue at a monthly pace of around $100bn for the remainder of the year, the BoJ’s QT could lift this pace to $110bn-$120bn per month pace.

Liquidity looks also weak in EM. In China in particular, M2 money supply growth moderated further to 7.0%oya in May, translating to a modest sequential increase of 0.3% m/m sa vs. contraction in April, which was the first monthly sequential contraction in around ten years. M1 growth was weaker, turning negative in April and further decelerating to a new record low of -4.2%oya in May. The gap between M1 and M2 growth, a usual leading indicator for the business cycle, fell to -11.2%-pts. While technical factors such as the crackdown on interest rate arbitrage and the absence of households’ demand deposit from China’s M1 statistics might be partly responsible, the collapse in M1 growth could be an indicator of weak sentiment in the corporate sector (amid lack of investment opportunities, corporates will keep deposits more in time deposits than in demand deposits), thus posing downside risk to Chinese equities.

In all, we maintain a defensive stance. While the benign US CPI and PPI reports provide some relief, they were largely driven by a few components such as air fares and car insurance and our bias is to view these inflation surprises as one-offs. Political and liquidity risks pose downside to crowded long carry/short vol trades including the US equity trade, which is at risk of being unwound if political/policy headwinds intensify into this year’s US presidential election.

Figure 15: Shipping Index by Compass (XSI-C) - Far East to US West Coast

Source: Bloomberg Finance L.P., J.P. Morgan.

Figure 16: Probability of a recession as it was priced on June 13th 2024 across US equity, credit and rate markets

In %.

Source: Bloomberg Finance L.P., J.P. Morgan.

Figure 17: Implied position changes based on the proportional change in open interest over June 10th - 13th across various futures contracts.

% of open interest as of June 7th. See text for details about the constructions of this metric.

Source: Bloomberg Finance L.P., J.P. Morgan.

Figure 18: France-Germany 10y government bond yield spread

Source: Bloomberg Finance L.P., J.P. Morgan.

Figure 19: JP Morgan FX Carry 5% volatility target index

Source: Bloomberg Finance L.P., J.P. Morgan.

Figure 20: CBOE NDX Volatility Index

Source: Bloomberg Finance L.P., J.P. Morgan.

Global Research Digest

Macro & Cross-Asset Views

Geopolitical Perspectives: Critical minerals: The next battleground for US-China strategic competition?, Amy Ho

The latest tariffs announcement by the Biden administration confirms the increased use of industrial policy, and in our view, any prolonged export restriction on critical minerals will accelerate the rise of alternatives to China. There are three reasons for the US to remain optimistic. First, more opportunities exist to diversify critical mineral suppliers than it is for oil. Second, strengthening strategic stockpiling by the US government and corporates can act as a buffer against sudden supply chain disruptions in the near term. Third, technological innovation and recycling has the potential to relieve pressure on primary supply over the long term.

Viewpoints from Germany: Global economic optimism meets rising local anxiety, Joyce Chang

Investors remain sanguine on the outlook for the global economy and markets. More than 70% of investors expected a soft landing. Stretched valuations and risks of a market sell-off are seen as greater risks than longer-term debt sustainability or geopolitical risks from the China and the upcoming US elections. The European elections will have little impact over the near term. Europe needs to address structural weaknesses to boost competitiveness and there has been too much focus on cyclical factors. Trump 2.0 could be worse than Trump 1.0 for Germany as Chancellor Scholz has made a point of closely aligning himself with Biden, and it’s too early to call the outcome of the US presidential elections.

Equity Strategy: UK elections - we favour FTSE250 over FTSE100, also homebuilders and domestic plays, Mislav Matejka, CFA

We believe a potential Labour victory in the upcoming elections is likely to be net positive for the market. Labour agenda is modestly pro-growth, but crucially with a likely cautious fiscal approach. Labour have also sought to reassure businesses by ruling out corporation tax increases. At sector level, we see a Labour win as a positive outcome for Banks, Homebuilders and Food Retail, while Energy and Transportation are likely to trade negatively as a result of Labour’s policies. Overall, UK equity market (OW) is trading cheap, it is a low beta play, has China exposure, and the highest dividend yield out of all large DM markets.

Flows & Liquidity: How much de-risking across euro assets over the previous two days?, Nikolaos Panigirtzoglou

Across asset classes, we find evidence of large position reduction in French government bond futures followed by CAC40 futures. There has been a more modest de-risking in other futures contracts thus suggesting that so far investors see the coming French election more as a local problem rather than a systemic problem for the eurozone. Spec investors including momentum-based investors played a significant role in the recent retracement in Chinese equities, particularly in the offshore HSCEI contract.

Global Economics

FOMC guesses at fewer cuts in ‘24, Michael Feroli

Besides cutting out the May statement’s discussion of changes in the balance sheet reduction plan, there was only one other change in the post-meeting statement. While the May statement referred to “a lack of progress” toward two percent inflation in recent months, FOMC’s post-meeting statement describes “modest progress.” The median dot did not surprise hawkishly for the out years, projecting another four cuts next year (up from three in March) and four in ’26 (also up from three in March). We continue to look for a first ease in November, and perhaps see risks tilted a little more toward September than December.

The French election, the ECB and the EU institutional setup, Greg Fuzesi

The extent to which a possible Le Pen led administration would challenge the EU framework, as opposed to working within it, is hence still a key call and also still unclear. The EU and more specifically Euro area institutions have travelled a long way since the regional debt crises. There is now a deeper set of tools to address funding challenges and more shared understanding between North and South of the right balance between constraints on policy versus supports for countries in distress. At the same time, political parties on the right who had previously been fiercely critical of the EU and its institutions have toned that criticism down.

BoJ set QT, but postponed a decision on the details, Ayako Fujita

With the BoJ’s signal for a “substantial” reduction in its JGB purchases, we believe that the BoJ raised the bar for a July rate hike. Governor Ueda didn’t rule out the possibility of a rate hike in July, stating that the BoJ would decide based on the economic and inflation developments up to that point. As the BoJ is pursuing gradual policy adjustments, it likely will prefer to avoid causing large shocks to the market by making a simultaneous decision of a rate hike and a “substantial” QT. We now see the rising risks for the BoJ to delay rate hikes until September unless an additional weakness of the yen puts more pressure on the BoJ.

Global Market Implications

Spread Strategy Spotlight: The song remains the same, Stephen Dulake

Spreads are a bit wider here and a bit tighter there but, overall, the nuances and narratives remain little changed across the global credit complex. Optically, spreads are thin, though maybe not quite as thin as they first appear adjusted for quality and ongoing benign default risk. What keeps the show on the road, of course, is that all-in yields remain in place, which continues to garner the support of the institutional investor base, making lower yields a bigger market risk than higher yields.

French elections and European FX: A lower intensity but new source of risk, Meera Chandan

President Macron’s decision to call for lower house elections has surprised markets, as is evident in the reaction from rates. The key issue for markets is idiosyncratic fiscal slippage in a Le Pen majority rather than an existential one such as Frexit. The FX market reaction should thus be lower intensity than in 2016-17. It also helps that, unlike then, rate differentials are not moving substantially against the euro. Local markets rather than FX should be more vulnerable, but the euro will still be sensitive to any further escalation. The rule of thumb is that EUR/USD weakens by ~0.5% weakening for every 10bp of widening in the periphery.

US Treasury Market Daily: And I’m in no hurry…I know where to go, Jay Barry

We continue to embrace a range-trading mentality and do not feel compelled to chase the move to lower yields for now. Given the implications for PCE, we think it’s less likely yields can revisit their late-May highs, and the bar for adding duration is likely lower than it was even a day ago. However, with yields at the bottom end of well-established ranges and valuations no longer cheap in our fair value framework, we prefer to be patient before turning tactically long. If the front-end of the inflation curve continues to cheapen, we would look for opportunities to add long exposure, particularly in a carry-efficient form.

India Local Markets Guide, J.P. Morgan Emerging Markets Strategy, Economics, and Index Research

India local markets will provide investors with a very compelling opportunity, having the second largest local debt stock amongst all index members, the highest index duration, and an above average nominal yield (against one of the lowest levels of bond volatility across all of EM). In this extensive local market guide, we provide investors with a detailed analysis of the inner workings of the local FX and bond markets, take a deep dive into the intricacies of monetary policy and central bank liquidity management, as well as lay out a framework for thinking about how the domestic economy will evolve on a forward-looking basis.

Sector Level Views

Retail vs. AMZN: Episode 12 – AMZN & WMT: 2 Behemoths Collide, Christopher Horvers, CFA

In our 12th annual Retail vs. AMZN deep dive, team Retail and Internet both expect e-commerce penetration to rise with ~8% sales growth in 2024 (favoring WMT and AMZN) and medium-term e-commerce expanding ~2x that of core retail sales. Two factors that favor e-commerce growth this year: a gen merch sales rebound as share of wallet headwinds fade and consumption trends approach wage growth plus a consumer that is value seeking vs. “browse shopping.”

EU Spotlight: French Elections 2024, Sophie L Warrick

Our sector teams assess their coverage exposure to France, FX sensitivity to the EUR and detail the potential single stock implications. The results of the EU Parliamentary Elections saw a significant increase in the number of seats of the far right. This was particularly the case for France. Our Economics team also highlighted the risk that a majority emerges outside of Macron’s party, which would mean Macron would need to nominate a prime minister corresponding to the new majority.

What's (not) in a name? The end of 'ESG'? How the new ESMA guidelines and exclusions impact Asia, Hannah L Lee

Using the new exclusion criteria, we find 90 stocks in MSCI Asia ex-Japan will no longer be eligible for ownership by European ‘ESG’ investors. Looking forward, it is likely a portion of funds opt to remove the ‘ESG’ moniker rather than comply with the strictest exclusions. Instead, we expect a degree of re-labelling with greater emphasis on terms such as ‘transition’ which is subject to less onerous exclusion criteria and more aligned with the approach we see European ESG investors already take in Asia.

Strategy & Forecasts

GAA Long-Only Model Portfolio

Equity sector recommendations and YTD returns

Source: J. P. Morgan, Bloomberg Finance L.P.

JPM Forecasts

Source: J.P. Morgan, Bloomberg Finance L.P., Datastream.

  1. 1 Results are based on 23 responses received from clients in our survey conducted Jun 10-17th

Risks of Common Option Strategies

Risks to Strategies: Not all option strategies are suitable for investors; certain strategies may expose investors to significant potential losses. We have summarized the risks of selected derivative strategies. For additional risk information, please call your sales representative for a copy of “Characteristics and Risks of Standardized Options.” We advise investors to consult their tax advisors and legal counsel about the tax implications of these strategies. Please also refer to option risk disclosure documents.

Put Sale: Investors who sell put options will own the underlying asset if the asset’s price falls below the strike price of the put option. Investors, therefore, will be exposed to any decline in the underlying asset’s price below the strike potentially to zero, and they will not participate in any price appreciation in the underlying asset if the option expires unexercised.

Call Sale: Investors who sell uncovered call options have exposure on the upside that is theoretically unlimited.

Call Overwrite or Buywrite: Investors who sell call options against a long position in the underlying asset give up any appreciation in the underlying asset’s price above the strike price of the call option, and they remain exposed to the downside of the underlying asset in the return for the receipt of the option premium.

Booster : In a sell-off, the maximum realized downside potential of a double-up booster is the net premium paid. In a rally, option losses are potentially unlimited as the investor is net short a call. When overlaid onto a long position in the underlying asset, upside losses are capped (as for a covered call), but downside losses are not.

Collar: Locks in the amount that can be realized at maturity to a range defined by the put and call strike. If the collar is not costless, investors risk losing 100% of the premium paid. Since investors are selling a call option, they give up any price appreciation in the underlying asset above the strike price of the call option.

Call Purchase: Options are a decaying asset, and investors risk losing 100% of the premium paid if the underlying asset’s price is below the strike price of the call option.

Put Purchase: Options are a decaying asset, and investors risk losing 100% of the premium paid if the underlying asset’s price is above the strike price of the put option.

Straddle or Strangle: The seller of a straddle or strangle is exposed to increases in the underlying asset’s price above the call strike and declines in the underlying asset’s price below the put strike. Since exposure on the upside is theoretically unlimited, investors who also own the underlying asset would have limited losses should the underlying asset rally. Covered writers are exposed to declines in the underlying asset position as well as any additional exposure should the underlying asset decline below the strike price of the put option. Having sold a covered call option, the investor gives up all appreciation in the underlying asset above the strike price of the call option.

Put Spread: The buyer of a put spread risks losing 100% of the premium paid. The buyer of higher-ratio put spread has unlimited downside below the lower strike (down to zero), dependent on the number of lower-struck puts sold. The maximum gain is limited to the spread between the two put strikes, when the underlying is at the lower strike. Investors who own the underlying asset will have downside protection between the higher-strike put and the lower-strike put. However, should the underlying asset’s price fall below the strike price of the lower-strike put, investors regain exposure to the underlying asset, and this exposure is multiplied by the number of puts sold.

Call Spread: The buyer risks losing 100% of the premium paid. The gain is limited to the spread between the two strike prices. The seller of a call spread risks losing an amount equal to the spread between the two call strikes less the net premium received. By selling a covered call spread, the investor remains exposed to the downside of the underlying asset and gives up the spread between the two call strikes should the underlying asset rally.

Butterfly Spread: A butterfly spread consists of two spreads established simultaneously – one a bull spread and the other a bear spread. The resulting position is neutral, that is, the investor will profit if the underlying is stable. Butterfly spreads are established at a net debit. The maximum profit will occur at the middle strike price; the maximum loss is the net debit.

Pricing Is Illustrative Only: Prices quoted in the above trade ideas are our estimate of current market levels, and are not indicative trading levels.

Correction: Update: Survey results added on page 5.

Disclosures

Analyst Certification: The Research Analyst(s) denoted by an “AC” on the cover of this report certifies (or, where multiple Research Analysts are primarily responsible for this report, the Research Analyst denoted by an “AC” on the cover or within the document individually certifies, with respect to each security or issuer that the Research Analyst covers in this research) that: (1) all of the views expressed in this report accurately reflect the Research Analyst’s personal views about any and all of the subject securities or issuers; and (2) no part of any of the Research Analyst's compensation was, is, or will be directly or indirectly related to the specific recommendations or views expressed by the Research Analyst(s) in this report. For all Korea-based Research Analysts listed on the front cover, if applicable, they also certify, as per KOFIA requirements, that the Research Analyst’s analysis was made in good faith and that the views reflect the Research Analyst’s own opinion, without undue influence or intervention.

All authors named within this report are Research Analysts who produce independent research unless otherwise specified. In Europe, Sector Specialists (Sales and Trading) may be shown on this report as contacts but are not authors of the report or part of the Research Department.

Research excerpts: This material may include excerpts from previously published reports. For access to the full reports, including analyst certification and important disclosures, please contact your sales representative or the covering analyst’s team, or visit https://www.jpmorganmarkets.com.

Other Disclosure : A contributor to this report has a household member who is a senior portfolio manager of and investor in certain emerging markets mutual funds, which may invest in instruments discussed in this report.

Important Disclosures

An analyst listed on the front cover has personal holdings in digital or crypto assets.

Company-Specific Disclosures: Important disclosures, including price charts and credit opinion history tables, are available for compendium reports and all J.P. Morgan–covered companies, and certain non-covered companies, by visiting https://www.jpmm.com/research/disclosures, calling 1-800-477-0406, or e-mailing research.disclosure.inquiries@jpmorgan.com with your request.

Explanation of Equity Research Ratings, Designations and Analyst(s) Coverage Universe: J.P. Morgan uses the following rating system: Overweight (over the duration of the price target indicated in this report, we expect this stock will outperform the average total return of the stocks in the Research Analyst’s, or the Research Analyst’s team’s, coverage universe); Neutral (over the duration of the price target indicated in this report, we expect this stock will perform in line with the average total return of the stocks in the Research Analyst’s, or the Research Analyst’s team’s, coverage universe); and Underweight (over the duration of the price target indicated in this report, we expect this stock will underperform the average total return of the stocks in the Research Analyst’s, or the Research Analyst’s team’s, coverage universe. NR is Not Rated. In this case, J.P. Morgan has removed the rating and, if applicable, the price target, for this stock because of either a lack of a sufficient fundamental basis or for legal, regulatory or policy reasons. The previous rating and, if applicable, the price target, no longer should be relied upon. An NR designation is not a recommendation or a rating. In our Asia (ex-Australia and ex-India) and U.K. small- and mid-cap Equity Research, each stock’s expected total return is compared to the expected total return of a benchmark country market index, not to those Research Analysts’ coverage universe. If it does not appear in the Important Disclosures section of this report, the certifying Research Analyst’s coverage universe can be found on J.P. Morgan’s Research website, https://www.jpmorganmarkets.com.

J.P. Morgan Equity Research Ratings Distribution, as of April 06, 2024

Overweight(buy) Neutral(hold) Underweight(sell)
J.P. Morgan Global Equity Research Coverage* 48% 39% 14%
    IB clients** 49% 45% 35%
JPMS Equity Research Coverage* 46% 42% 12%
    IB clients** 70% 66% 52%

*Please note that the percentages may not add to 100% because of rounding.**Percentage of subject companies within each of the "buy," "hold" and "sell" categories for which J.P. Morgan has provided investment banking services within the previous 12 months. For purposes of FINRA ratings distribution rules only, our Overweight rating falls into a buy rating category; our Neutral rating falls into a hold rating category; and our Underweight rating falls into a sell rating category. Please note that stocks with an NR designation are not included in the table above. This information is current as of the end of the most recent calendar quarter.

Equity Valuation and Risks: For valuation methodology and risks associated with covered companies or price targets for covered companies, please see the most recent company-specific research report at http://www.jpmorganmarkets.com, contact the primary analyst or your J.P. Morgan representative, or email research.disclosure.inquiries@jpmorgan.com. For material information about the proprietary models used, please see the Summary of Financials in company-specific research reports and the Company Tearsheets, which are available to download on the company pages of our client website, http://www.jpmorganmarkets.com. This report also sets out within it the material underlying assumptions used.

A history of J.P. Morgan investment recommendations disseminated during the preceding 12 months can be accessed on the Research & Commentary page of http://www.jpmorganmarkets.com where you can also search by analyst name, sector or financial instrument.

Explanation of Credit Research Valuation Methodology, Ratings and Risk to Ratings: J.P. Morgan uses a bond-level rating system that incorporates valuations (relative value) and our fundamental view on the security. Our fundamental credit view of an issuer is based on the company's underlying credit trends, overall creditworthiness and our opinion on whether the issuer will be able to service its debt obligations when they become due and payable. We analyze, among other things, the company's cash flow capacity and trends and standard credit ratios, such as gross and net leverage, interest coverage and liquidity ratios. We also analyze profitability, capitalization and asset quality, among other variables, when assessing financials. Analysts also rate the issuer, based on the rating of the benchmark or representative security. Unless we specify a different recommendation for the company’s individual securities, an issuer recommendation applies to all of the bonds at the same level of the issuer’s capital structure. We may also rate certain loans and preferred securities, as applicable. This report also sets out within it the material underlying assumptions used. We use the following ratings for bonds (issues), issuers, loans, and preferred securities: Overweight (over the next three months, the recommended risk position is expected to outperform the relevant index, sector, or benchmark); Neutral (over the next three months, the recommended risk position is expected to perform in line with the relevant index, sector, or benchmark); and Underweight (over the next three months, the recommended risk position is expected to underperform the relevant index, sector, or benchmark). J.P. Morgan Emerging Markets Sovereign Research uses Marketweight, which is equivalent to Neutral. NR is Not Rated. In this case, J.P. Morgan has removed the rating for this particular security or issuer because of either a lack of a sufficient fundamental basis or for legal, regulatory or policy reasons. The previous rating no longer should be relied upon. An NR designation is not a recommendation or a rating. NC is Not Covered. An NC designation is not a rating or a recommendation. For CDS, we use the following rating system: Long Risk (over the next three months, the credit return on the recommended position is expected to exceed the relevant index, sector or benchmark); Neutral (over the next three months, the credit return on the recommended position is expected to match the relevant index, sector or benchmark); and Short Risk (over the next three months, the credit return on the recommended position is expected to underperform the relevant index, sector or benchmark).

J.P. Morgan Credit Research Ratings Distribution, as of April 06, 2024

Overweight(buy) Neutral(hold) Underweight(sell)
Global Credit Research Universe* 27% 56% 17%
    IB clients** 65% 59% 63%

*Please note that the percentages may not add to 100% because of rounding.**Percentage of subject companies within each of the "Overweight," "Neutral" and "Underweight" categories for which J.P. Morgan has provided investment banking services within the previous 12 months.For purposes of FINRA ratings distribution rules only, our Overweight rating falls into a buy rating category; our Neutral rating falls into a hold rating category; and our Underweight rating falls into a sell rating category. The Credit Research Rating Distribution is at the issuer level. Issuers with an NR or an NC designation are not included in the table above. This information is current as of the end of the most recent calendar quarter.

Analysts' Compensation: The research analysts responsible for the preparation of this report receive compensation based upon various factors, including the quality and accuracy of research, client feedback, competitive factors, and overall firm revenues.

Registration of non-US Analysts: Unless otherwise noted, the non-US analysts listed on the front of this report are employees of non-US affiliates of J.P. Morgan Securities LLC, may not be registered as research analysts under FINRA rules, may not be associated persons of J.P. Morgan Securities LLC, and may not be subject to FINRA Rule 2241 or 2242 restrictions on communications with covered companies, public appearances, and trading securities held by a research analyst account.

Other Disclosures

J.P. Morgan is a marketing name for investment banking businesses of JPMorgan Chase & Co. and its subsidiaries and affiliates worldwide.

UK MIFID FICC research unbundling exemption: UK clients should refer to UK MIFID Research Unbundling exemption for details of J.P. Morgan’s implementation of the FICC research exemption and guidance on relevant FICC research categorisation.

QIB Only

All research material made available to clients are simultaneously available on our client website, J.P. Morgan Markets, unless specifically permitted by relevant laws. Not all research content is redistributed, e-mailed or made available to third-party aggregators. For all research material available on a particular stock, please contact your sales representative.

Any long form nomenclature for references to China; Hong Kong; Taiwan; and Macau within this research material are Mainland China; Hong Kong SAR (China); Taiwan (China); and Macau SAR (China).

J.P. Morgan Research may, from time to time, write on issuers or securities targeted by economic or financial sanctions imposed or administered by the governmental authorities of the U.S., EU, UK or other relevant jurisdictions (Sanctioned Securities). Nothing in this report is intended to be read or construed as encouraging, facilitating, promoting or otherwise approving investment or dealing in such Sanctioned Securities. Clients should be aware of their own legal and compliance obligations when making investment decisions.

Any digital or crypto assets discussed in this research report are subject to a rapidly changing regulatory landscape. For relevant regulatory advisories on crypto assets, including bitcoin and ether, please see https://www.jpmorgan.com/disclosures/cryptoasset-disclosure.

The author(s) of this research report may not be licensed to carry on regulated activities in your jurisdiction and, if not licensed, do not hold themselves out as being able to do so.

Exchange-Traded Funds (ETFs): J.P. Morgan Securities LLC (“JPMS”) acts as authorized participant for substantially all U.S.-listed ETFs. To the extent that any ETFs are mentioned in this report, JPMS may earn commissions and transaction-based compensation in connection with the distribution of those ETF shares and may earn fees for performing other trade-related services, such as securities lending to short sellers of the ETF shares. JPMS may also perform services for the ETFs themselves, including acting as a broker or dealer to the ETFs. In addition, affiliates of JPMS may perform services for the ETFs, including trust, custodial, administration, lending, index calculation and/or maintenance and other services.

Options and Futures related research: If the information contained herein regards options- or futures-related research, such information is available only to persons who have received the proper options or futures risk disclosure documents. Please contact your J.P. Morgan Representative or visit https://www.theocc.com/components/docs/riskstoc.pdf for a copy of the Option Clearing Corporation's Characteristics and Risks of Standardized Options or http://www.finra.org/sites/default/files/Security_Futures_Risk_Disclosure_Statement_2018.pdf for a copy of the Security Futures Risk Disclosure Statement.

Changes to Interbank Offered Rates (IBORs) and other benchmark rates: Certain interest rate benchmarks are, or may in the future become, subject to ongoing international, national and other regulatory guidance, reform and proposals for reform. For more information, please consult: https://www.jpmorgan.com/global/disclosures/interbank_offered_rates

Private Bank Clients: Where you are receiving research as a client of the private banking businesses offered by JPMorgan Chase & Co. and its subsidiaries (“J.P. Morgan Private Bank”), research is provided to you by J.P. Morgan Private Bank and not by any other division of J.P. Morgan, including, but not limited to, the J.P. Morgan Corporate and Investment Bank and its Global Research division.

Legal entity responsible for the production and distribution of research: The legal entity identified below the name of the Reg AC Research Analyst who authored this material is the legal entity responsible for the production of this research. Where multiple Reg AC Research Analysts authored this material with different legal entities identified below their names, these legal entities are jointly responsible for the production of this research. Research Analysts from various J.P. Morgan affiliates may have contributed to the production of this material but may not be licensed to carry out regulated activities in your jurisdiction (and do not hold themselves out as being able to do so). Unless otherwise stated below, this material has been distributed by the legal entity responsible for production. If you have any queries, please contact the relevant Research Analyst in your jurisdiction or the entity in your jurisdiction that has distributed this research material.

Legal Entities Disclosures and Country-/Region-Specific Disclosures: Argentina: JPMorgan Chase Bank N.A Sucursal Buenos Aires is regulated by Banco Central de la República Argentina (“BCRA”- Central Bank of Argentina) and Comisión Nacional de Valores (“CNV”- Argentinian Securities Commission - ALYC y AN Integral N°51). Australia: J.P. Morgan Securities Australia Limited (“JPMSAL”) (ABN 61 003 245 234/AFS Licence No: 238066) is regulated by the Australian Securities and Investments Commission and is a Market Participant of ASX Limited, a Clearing and Settlement Participant of ASX Clear Pty Limited and a Clearing Participant of ASX Clear (Futures) Pty Limited. This material is issued and distributed in Australia by or on behalf of JPMSAL only to "wholesale clients" (as defined in section 761G of the Corporations Act 2001). A list of all financial products covered can be found by visiting https://www.jpmm.com/research/disclosures. J.P. Morgan seeks to cover companies of relevance to the domestic and international investor base across all Global Industry Classification Standard (GICS) sectors, as well as across a range of market capitalisation sizes. If applicable, in the course of conducting public side due diligence on the subject company(ies), the Research Analyst team may at times perform such diligence through corporate engagements such as site visits, discussions with company representatives, management presentations, etc. Research issued by JPMSAL has been prepared in accordance with J.P. Morgan Australia’s Research Independence Policy which can be found at the following link: J.P. Morgan Australia - Research Independence Policy. Brazil : Banco J.P. Morgan S.A. is regulated by the Comissao de Valores Mobiliarios (CVM) and by the Central Bank of Brazil. Ombudsman J.P. Morgan: 0800-7700847 / 0800-7700810 (For Hearing Impaired) / ouvidoria.jp.morgan@jpmorgan.com. Canada : J.P. Morgan Securities Canada Inc. is a registered investment dealer, regulated by the Canadian Investment Regulatory Organization and the Ontario Securities Commission and is the participating member on Canadian exchanges. This material is distributed in Canada by or on behalf of J.P.Morgan Securities Canada Inc. Chile: Inversiones J.P. Morgan Limitada is an unregulated entity incorporated in Chile. China: J.P. Morgan Securities (China) Company Limited has been approved by CSRC to conduct the securities investment consultancy business. Dubai International Financial Centre (DIFC) : JPMorgan Chase Bank, N.A., Dubai Branch is regulated by the Dubai Financial Services Authority (DFSA) and its registered address is Dubai International Financial Centre - The Gate, West Wing, Level 3 and 9 PO Box 506551, Dubai, UAE. This material has been distributed by JP Morgan Chase Bank, N.A., Dubai Branch to persons regarded as professional clients or market counterparties as defined under the DFSA rules. European Economic Area (EEA): Unless specified to the contrary, research is distributed in the EEA by J.P. Morgan SE (“JPM SE”), which is authorised as a credit institution by the Federal Financial Supervisory Authority (Bundesanstalt für Finanzdienstleistungsaufsicht, BaFin) and jointly supervised by the BaFin, the German Central Bank (Deutsche Bundesbank) and the European Central Bank (ECB). JPM SE is a company headquartered in Frankfurt with registered address at TaunusTurm, Taunustor 1, Frankfurt am Main, 60310, Germany. The material has been distributed in the EEA to persons regarded as professional investors (or equivalent) pursuant to Art. 4 para. 1 no. 10 and Annex II of MiFID II and its respective implementation in their home jurisdictions (“EEA professional investors”). This material must not be acted on or relied on by persons who are not EEA professional investors. Any investment or investment activity to which this material relates is only available to EEA relevant persons and will be engaged in only with EEA relevant persons. Hong Kong : J.P. Morgan Securities (Asia Pacific) Limited (CE number AAJ321) is regulated by the Hong Kong Monetary Authority and the Securities and Futures Commission in Hong Kong, and J.P. Morgan Broking (Hong Kong) Limited (CE number AAB027) is regulated by the Securities and Futures Commission in Hong Kong. JP Morgan Chase Bank, N.A., Hong Kong Branch (CE Number AAL996) is regulated by the Hong Kong Monetary Authority and the Securities and Futures Commission, is organized under the laws of the United States with limited liability. Where the distribution of this material is a regulated activity in Hong Kong, the material is distributed in Hong Kong by or through J.P. Morgan Securities (Asia Pacific) Limited and/or J.P. Morgan Broking (Hong Kong) Limited. India : J.P. Morgan India Private Limited (Corporate Identity Number - U67120MH1992FTC068724), having its registered office at J.P. Morgan Tower, Off. C.S.T. Road, Kalina, Santacruz - East, Mumbai – 400098, is registered with the Securities and Exchange Board of India (SEBI) as a ‘Research Analyst’ having registration number INH000001873. J.P. Morgan India Private Limited is also registered with SEBI as a member of the National Stock Exchange of India Limited and the Bombay Stock Exchange Limited (SEBI Registration Number – INZ000239730) and as a Merchant Banker (SEBI Registration Number - MB/INM000002970). Telephone: 91-22-6157 3000, Facsimile: 91-22-6157 3990 and Website: http://www.jpmipl.com. JPMorgan Chase Bank, N.A. - Mumbai Branch is licensed by the Reserve Bank of India (RBI) (Licence No. 53/ Licence No. BY.4/94; SEBI - IN/CUS/014/ CDSL : IN-DP-CDSL-444-2008/ IN-DP-NSDL-285-2008/ INBI00000984/ INE231311239) as a Scheduled Commercial Bank in India, which is its primary license allowing it to carry on Banking business in India and other activities, which a Bank branch in India are permitted to undertake. For non-local research material, this material is not distributed in India by J.P. Morgan India Private Limited. Compliance Officer: Spurthi Gadamsetty; spurthi.gadamsetty@jpmchase.com; +912261573225. Grievance Officer: Ramprasadh K, jpmipl.research.feedback@jpmorgan.com; +912261573000.

Investment in securities market are subject to market risks. Read all the related documents carefully before investing. Registration granted by SEBI and certification from NISM in no way guarantee performance of the intermediary or provide any assurance of returns to investors.

Indonesia : PT J.P. Morgan Sekuritas Indonesia is a member of the Indonesia Stock Exchange and is registered and supervised by the Otoritas Jasa Keuangan (OJK). Korea : J.P. Morgan Securities (Far East) Limited, Seoul Branch, is a member of the Korea Exchange (KRX). JPMorgan Chase Bank, N.A., Seoul Branch, is licensed as a branch office of foreign bank (JPMorgan Chase Bank, N.A.) in Korea. Both entities are regulated by the Financial Services Commission (FSC) and the Financial Supervisory Service (FSS). For non-macro research material, the material is distributed in Korea by or through J.P. Morgan Securities (Far East) Limited, Seoul Branch. Japan : JPMorgan Securities Japan Co., Ltd. and JPMorgan Chase Bank, N.A., Tokyo Branch are regulated by the Financial Services Agency in Japan. Malaysia : This material is issued and distributed in Malaysia by JPMorgan Securities (Malaysia) Sdn Bhd (18146-X), which is a Participating Organization of Bursa Malaysia Berhad and holds a Capital Markets Services License issued by the Securities Commission in Malaysia. Mexico : J.P. Morgan Casa de Bolsa, S.A. de C.V. and J.P. Morgan Grupo Financiero are members of the Mexican Stock Exchange and are authorized to act as a broker dealer by the National Banking and Securities Exchange Commission. New Zealand : This material is issued and distributed by JPMSAL in New Zealand only to "wholesale clients" (as defined in the Financial Markets Conduct Act 2013). JPMSAL is registered as a Financial Service Provider under the Financial Service providers (Registration and Dispute Resolution) Act of 2008. Philippines : J.P. Morgan Securities Philippines Inc. is a Trading Participant of the Philippine Stock Exchange and a member of the Securities Clearing Corporation of the Philippines and the Securities Investor Protection Fund. It is regulated by the Securities and Exchange Commission. Singapore : This material is issued and distributed in Singapore by or through J.P. Morgan Securities Singapore Private Limited (JPMSS) [MCI (P) 030/08/2023 and Co. Reg. No.: 199405335R], which is a member of the Singapore Exchange Securities Trading Limited, and/or JPMorgan Chase Bank, N.A., Singapore branch (JPMCB Singapore), both of which are regulated by the Monetary Authority of Singapore. This material is issued and distributed in Singapore only to accredited investors, expert investors and institutional investors, as defined in Section 4A of the Securities and Futures Act, Cap. 289 (SFA). This material is not intended to be issued or distributed to any retail investors or any other investors that do not fall into the classes of “accredited investors,” “expert investors” or “institutional investors,” as defined under Section 4A of the SFA. Recipients of this material in Singapore are to contact JPMSS or JPMCB Singapore in respect of any matters arising from, or in connection with, the material. South Africa : J.P. Morgan Equities South Africa Proprietary Limited and JPMorgan Chase Bank, N.A., Johannesburg Branch are members of the Johannesburg Securities Exchange and are regulated by the Financial Services Conduct Authority (FSCA). Taiwan : J.P. Morgan Securities (Taiwan) Limited is a participant of the Taiwan Stock Exchange (company-type) and regulated by the Taiwan Securities and Futures Bureau. Material relating to equity securities is issued and distributed in Taiwan by J.P. Morgan Securities (Taiwan) Limited, subject to the license scope and the applicable laws and the regulations in Taiwan. According to Paragraph 2, Article 7-1 of Operational Regulations Governing Securities Firms Recommending Trades in Securities to Customers (as amended or supplemented) and/or other applicable laws or regulations, please note that the recipient of this material is not permitted to engage in any activities in connection with the material that may give rise to conflicts of interests, unless otherwise disclosed in the “Important Disclosures” in this material. Thailand : This material is issued and distributed in Thailand by JPMorgan Securities (Thailand) Ltd., which is a member of the Stock Exchange of Thailand and is regulated by the Ministry of Finance and the Securities and Exchange Commission, and its registered address is 3rd Floor, 20 North Sathorn Road, Silom, Bangrak, Bangkok 10500. UK: Unless specified to the contrary, research is distributed in the UK by J.P. Morgan Securities plc (“JPMS plc”) which is a member of the London Stock Exchange and is authorised by the Prudential Regulation Authority and regulated by the Financial Conduct Authority and the Prudential Regulation Authority. JPMS plc is registered in England & Wales No. 2711006, Registered Office 25 Bank Street, London, E14 5JP. This material is directed in the UK only to: (a) persons having professional experience in matters relating to investments falling within article 19(5) of the Financial Services and Markets Act 2000 (Financial Promotion) (Order) 2005 (“the FPO”); (b) persons outlined in article 49 of the FPO (high net worth companies, unincorporated associations or partnerships, the trustees of high value trusts, etc.); or (c) any persons to whom this communication may otherwise lawfully be made; all such persons being referred to as "UK relevant persons". This material must not be acted on or relied on by persons who are not UK relevant persons. Any investment or investment activity to which this material relates is only available to UK relevant persons and will be engaged in only with UK relevant persons. Research issued by JPMS plc has been prepared in accordance with JPMS plc's policy for prevention and avoidance of conflicts of interest related to the production of Research which can be found at the following link: J.P. Morgan EMEA - Research Independence Policy. U.S .: J.P. Morgan Securities LLC (“JPMS”) is a member of the NYSE, FINRA, SIPC, and the NFA. JPMorgan Chase Bank, N.A. is a member of the FDIC. Material published by non-U.S. affiliates is distributed in the U.S. by JPMS who accepts responsibility for its content.

General: Additional information is available upon request. The information in this material has been obtained from sources believed to be reliable. While all reasonable care has been taken to ensure that the facts stated in this material are accurate and that the forecasts, opinions and expectations contained herein are fair and reasonable, JPMorgan Chase & Co. or its affiliates and/or subsidiaries (collectively J.P. Morgan) make no representations or warranties whatsoever to the completeness or accuracy of the material provided, except with respect to any disclosures relative to J.P. Morgan and the Research Analyst's involvement with the issuer that is the subject of the material. Accordingly, no reliance should be placed on the accuracy, fairness or completeness of the information contained in this material. There may be certain discrepancies with data and/or limited content in this material as a result of calculations, adjustments, translations to different languages, and/or local regulatory restrictions, as applicable. These discrepancies should not impact the overall investment analysis, views and/or recommendations of the subject company(ies) that may be discussed in the material. J.P. Morgan accepts no liability whatsoever for any loss arising from any use of this material or its contents, and neither J.P. Morgan nor any of its respective directors, officers or employees, shall be in any way responsible for the contents hereof, apart from the liabilities and responsibilities that may be imposed on them by the relevant regulatory authority in the jurisdiction in question, or the regulatory regime thereunder. Opinions, forecasts or projections contained in this material represent J.P. Morgan's current opinions or judgment as of the date of the material only and are therefore subject to change without notice. Periodic updates may be provided on companies/industries based on company-specific developments or announcements, market conditions or any other publicly available information. There can be no assurance that future results or events will be consistent with any such opinions, forecasts or projections, which represent only one possible outcome. Furthermore, such opinions, forecasts or projections are subject to certain risks, uncertainties and assumptions that have not been verified, and future actual results or events could differ materially. The value of, or income from, any investments referred to in this material may fluctuate and/or be affected by changes in exchange rates. All pricing is indicative as of the close of market for the securities discussed, unless otherwise stated. Past performance is not indicative of future results. Accordingly, investors may receive back less than originally invested. This material is not intended as an offer or solicitation for the purchase or sale of any financial instrument. The opinions and recommendations herein do not take into account individual client circumstances, objectives, or needs and are not intended as recommendations of particular securities, financial instruments or strategies to particular clients. This material may include views on structured securities, options, futures and other derivatives. These are complex instruments, may involve a high degree of risk and may be appropriate investments only for sophisticated investors who are capable of understanding and assuming the risks involved. The recipients of this material must make their own independent decisions regarding any securities or financial instruments mentioned herein and should seek advice from such independent financial, legal, tax or other adviser as they deem necessary. J.P. Morgan may trade as a principal on the basis of the Research Analysts’ views and research, and it may also engage in transactions for its own account or for its clients’ accounts in a manner inconsistent with the views taken in this material, and J.P. Morgan is under no obligation to ensure that such other communication is brought to the attention of any recipient of this material. Others within J.P. Morgan, including Strategists, Sales staff and other Research Analysts, may take views that are inconsistent with those taken in this material. Employees of J.P. Morgan not involved in the preparation of this material may have investments in the securities (or derivatives of such securities) mentioned in this material and may trade them in ways different from those discussed in this material. This material is not an advertisement for or marketing of any issuer, its products or services, or its securities in any jurisdiction.

Confidentiality and Security Notice : This transmission may contain information that is privileged, confidential, legally privileged, and/or exempt from disclosure under applicable law. If you are not the intended recipient, you are hereby notified that any disclosure, copying, distribution, or use of the information contained herein (including any reliance thereon) is STRICTLY PROHIBITED. Although this transmission and any attachments are believed to be free of any virus or other defect that might affect any computer system into which it is received and opened, it is the responsibility of the recipient to ensure that it is virus free and no responsibility is accepted by JPMorgan Chase & Co., its subsidiaries and affiliates, as applicable, for any loss or damage arising in any way from its use. If you received this transmission in error, please immediately contact the sender and destroy the material in its entirety, whether in electronic or hard copy format. This message is subject to electronic monitoring: https://www.jpmorgan.com/disclosures/email

MSCI: Certain information herein (“Information”) is reproduced by permission of MSCI Inc., its affiliates and information providers (“MSCI”) ©2024. No reproduction or dissemination of the Information is permitted without an appropriate license. MSCI MAKES NO EXPRESS OR IMPLIED WARRANTIES (INCLUDING MERCHANTABILITY OR FITNESS) AS TO THE INFORMATION AND DISCLAIMS ALL LIABILITY TO THE EXTENT PERMITTED BY LAW. No Information constitutes investment advice, except for any applicable Information from MSCI ESG Research. Subject also to msci.com/disclaimer

Sustainalytics: Certain information, data, analyses and opinions contained herein are reproduced by permission of Sustainalytics and: (1) includes the proprietary information of Sustainalytics; (2) may not be copied or redistributed except as specifically authorized; (3) do not constitute investment advice nor an endorsement of any product or project; (4) are provided solely for informational purposes; and (5) are not warranted to be complete, accurate or timely. Sustainalytics is not responsible for any trading decisions, damages or other losses related to it or its use. The use of the data is subject to conditions available at https://www.sustainalytics.com/legal-disclaimers. ©2024 Sustainalytics. All Rights Reserved.

"Other Disclosures" last revised April 06, 2024.

Copyright 2024 JPMorgan Chase & Co. All rights reserved. This material or any portion hereof may not be reprinted, sold or redistributed without the written consent of J.P. Morgan. It is strictly prohibited to use or share without prior written consent from J.P. Morgan any research material received from J.P. Morgan or an authorized third-party (“J.P. Morgan Data”) in any third-party artificial intelligence (“AI”) systems or models when such J.P. Morgan Data is accessible by a third-party. It is permissible to use J.P. Morgan Data for internal business purposes only in an AI system or model that protects the confidentiality of J.P. Morgan Data so as to prevent any and all access to or use of such J.P. Morgan Data by any third-party. #$J&098$#*P

Completed 17 Jun 2024 01:24 PM EDTDisseminated 17 Jun 2024 01:27 PM EDT