Quantitative & Derivatives Strategy
The J.P. Morgan View : Market prematurely settling back into soft landing narrative
May 15, 2024
The J.P. Morgan View : Market prematurely settling back into soft landing narrative
This document is being provided for the exclusive use of blake@sandboxfp.com.
15 May 2024

Update (first published 13 May 2024) (See disclosures for details)

The J.P. Morgan View

Market prematurely settling back into soft landing narrative

J.P. Morgan does and seeks to do business with companies covered in its research reports. As a result, investors should be aware that the firm may have a conflict of interest that could affect the objectivity of this report. Investors should consider this report as only a single factor in making their investment decision.

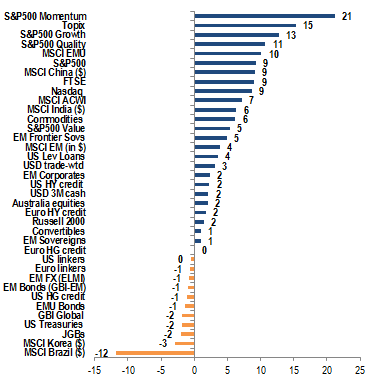
YTD returns by asset

Source: J.P. Morgan.

Cross-Asset Strategy: The 2024 global election cycle is just warming up, with elections still remaining across key geographies including the US, UK, India, Mexico and South Africa. In the US, a loss for the incumbent could drive substantial changes in trade policy, foreign policy, regulation, and fiscal/tax policy. In equities we constructed thematic equity baskets to hedge various policy outcomes, and in commodities we note a change in the administration could mean a lighter regulatory burden on oil and gas companies, and bearish risk for base metals prices and agri commodity exports due to the potential for a re-escalating tariff war and stronger USD. Last week was relatively light on major data releases, with stronger than expected longer-term inflation expectations in the US, and the ECB April meeting minutes reinforcing the sense that the ECB is set for a June cut. We stay neutral duration outright in the US and Eurozone ahead of inflation data this week but keep on steepeners. In the UK, the BoE provided a dovish tilt despite stronger data; we keep SONIA curve flatteners as a positive carry bullish proxy. While cautious EM policy rate cuts continue, the scope for cuts in 2H24 has diminished, particularly in Asia, so we stay neutral local duration. US HG bond spreads rallied despite a surge in issuance given strong demand, indicating robust technicals. In Euro credit, we expect to continue to trade rangebound over the near term as we are currently in a ‘bad news is good news’ trading environment. In FX, the medium-term view is still bullish USD on high yields, growth cushion and other supports, but tactical concerns stem from nascent signs of fading US growth exceptionalism and saturated investor longs.

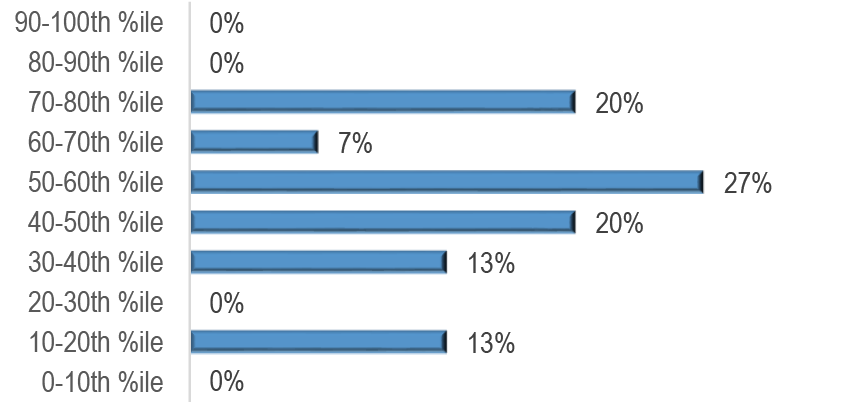
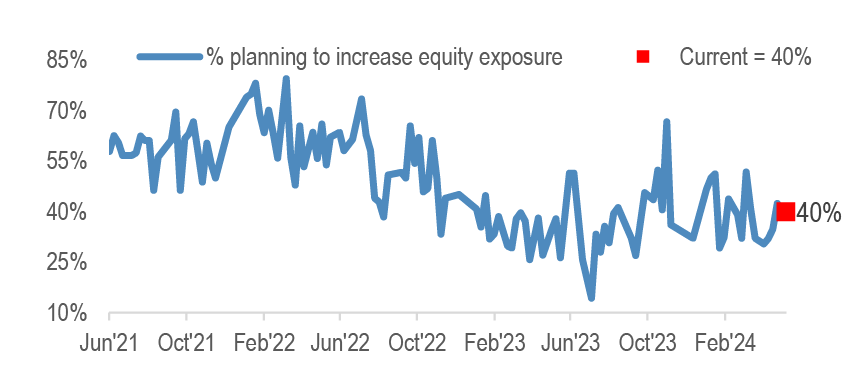
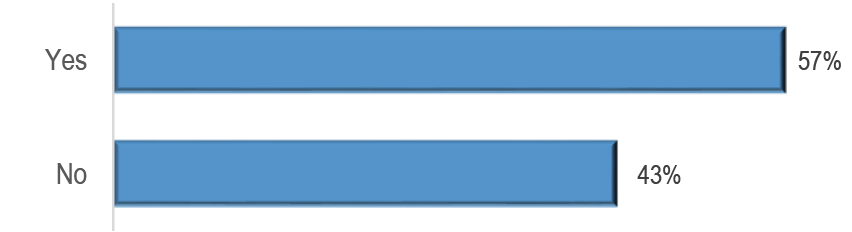
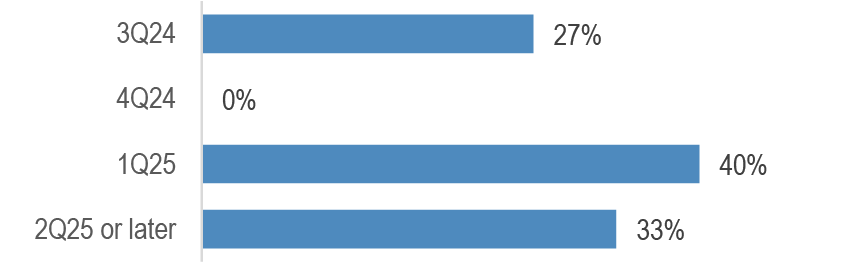
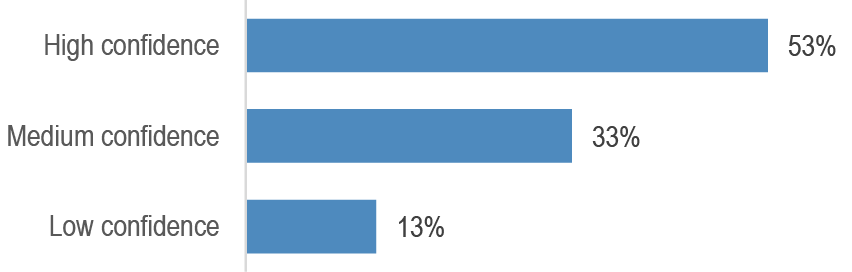
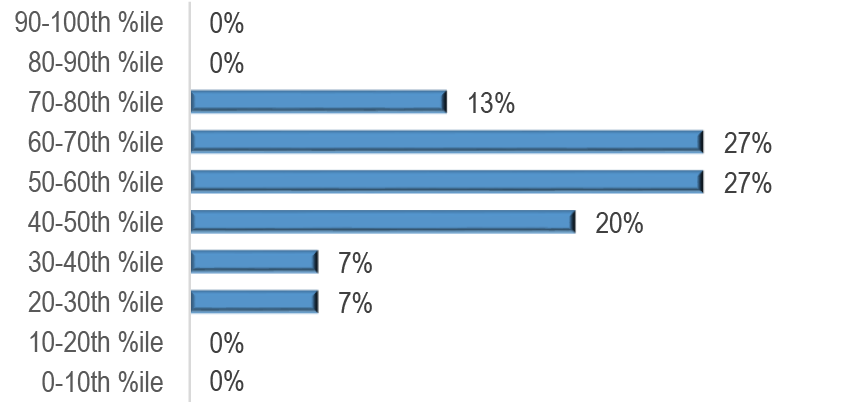
JPM Clients’ View: Click here to take this week’s survey. This week we poll investors on China equities, jobless claims, DM CBs and USTs, in addition to our running sentiment questions. Our last survey results indicated: (1) equity exposure/sentiment among respondents is ~50th percentile on average; (2) 40% planned to increase equity exposure, and 79% to increase bond duration near term; (3) 57% believe the 160 level on JPY is a line in the sand for the Japanese MoF; (4) the median expects Fed QT to end in 1Q25; (5) most respondents (53%) have high confidence the ECB will cut in June.

The market is settling back into the soft landing narrative after softer US jobs data and dovish guidance from the Fed, ECB and BoE. However, the macro outlook is uncertain and for equities we are entering into a seasonally tricky time of the year, with a challenging combination of inflation at risk of staying too high, profit margin pressures, and elevated positioning.

New Trades: Initiate TIPS breakeven wideners (White), long HYG volatility (Wu).

Upcoming Catalysts: Fed speak (all-wk); Japan PPI (5/13); US PPI, German ZEW (5/14); US CPI & retail sales, Eurozone GDP (5/15); US jobless, housing starts & IP (5/16); US leading index, China IP & retail sales, Eurozone CPI (5/17).

Cross-Asset Strategy

Economics

Expecting moderation in growth and inflation this quarter to levels consistent with resilience and persistence. We are anticipating a modest rebound in US GDP growth to a 2.5%ar this quarter even as soft April business surveys and signs of moderating labor demand have increased downside risks. Outside the US the growth remains imbalanced as the recent consumer spending lift has been driven entirely by the EM. With spending stalled in W.Europe and Japan and consumer confidence readings still depressed across the DM, sustaining this pickup is by no means assured. On inflation, a 1Q24 acceleration in core CPI gains to a 3.5%ar aligns with our view that the global disinflation process is now stalling. Sustained strong service-sector demand and elevated labor costs looks likely to limit any fall in service price inflation. We also see core goods inflation moving modestly higher. In all, we project global core CPI to rise 3.2%ar in 2Q24. The limited April releases so far are broadly consistent with this view.

A shallow Western European easing has begun. Following the SNB cut, the Riksbank lowered its policy rate last week. The ECB April meeting minutes confirmed that a June cut is on track while the BoE’s dovish hold last week opened the door to a possible June ease. While European easing is getting underway, the latest signs show a pickup in growth and sticky inflation for the ECB and BoE. For the Riksbank the case for a substantial easing is stronger, but external pressure on the currency may also slow its path (GDW, May 10th).

Equities

Better China trading could have some more to go. While we do not believe that the longer-term structural concerns are finished, the more positive China trading could last through summer on increasing market hopes that the worst of housing weakness may be behind us, and until the US elections heat up. EM investors remain UW China and valuations have another 10-15% upside before closing the discount to historical. Mining and Energy remain interesting as a way to position for more positive China trading. Metal prices are likely to be supported by low inventories and better demand, and commodity equities offer a high FCF yield and attractive valuations (Equity Strategy, May 12th). Chinese equities’ rally continued last week on more favorable policy actions, that are in the general direction of raising demand, curbing supply and raising prices over certain utility-type services, plus solid trade data (China Equity Data Tracker, May 10th).

Equity implications of upcoming global elections. The global election cycle is just warming up, with 60 of 77 elections still remaining across key geographies including the US, UK, India, Mexico and South Africa. Macro themes remain dominant, while focus is beginning to center on the US Presidential and Congressional elections given the policy differences between the leading candidates, the size of the US equity market, and the potential knock-on effects to other geographies, particularly in EM. In the US, a loss for the incumbent could drive substantial changes in areas such as trade policy (e.g. US-China), foreign policy (e.g., Middle East/Israel, Russia/Ukraine, etc.), regulation (e.g. environment/energy, anti-trust) and fiscal/tax policy (e.g. TCJA sunset on 12/31/25). We constructed thematic equity baskets to hedge or position for various policy outcomes (Global Thematic Strategy, May 7th).

Entering into seasonally tricky time of the year, on top of a challenging combination of inflation at risk of staying too high and profit margin pressures. The Goldilocks view that market embraced in Q1 of inflation/rates moving lower but at the same time of earnings acceleration and economy having no landing remains an inconsistent one. We look for more of a consolidation in equity markets over the next months. We believe that the gap that has opened up YTD between Fed and the equity market needs to close (Equity Strategy, May 7th).

Japanese equities’ downward pressure due to the yen’s rapid depreciation has eased for now. Earnings results featured many companies announcing increased shareholder returns and RoE targets. One-year on from TSE-led reform demands have led to rise in weighting of companies with PBRs above 1.0x from 50% to 60% and improvement in RoE of low-RoE names (Japan Equity Strategy, May 7th).

In SMids, we adhere to our cautious view since: 1) historically interest rates have not moved lower in short order; 2) growth may not save the day because it appears weaker this time around; 3) we don’t see enough of a return to warrant taking on equity risk at this juncture. SMid-Caps (and Large-Caps for that matter), in most regions of the world seem unlikely to beat the return of 20-yr US Treasuries from here to the next recession. Japan is the only SMid mkt that seems to offer a rerating story at present (SMid Alpha, May 7th).

US election’s qualitative debate with EM investors is bear-biased on the re-edition of “America First”, the risk of higher tariffs, and the collateral damage of those policies on the inflation outlook. The US election could become an obstacle that conflicts with the view that the US will slow and cut rates into year-end, favoring EM equities (EM Lighthouse, May 8th). 1Q24 EM results overall have been positive. For next quarter, we think the 4 broad macro variables are positively biased: increasing operating leverage, rising commodities, declining 10Y UST, and the consolidating USD bull run (EM Lighthouse,May 6th).

Bonds

Bonds saw a modest bear flattening over the past week. In the US, the week was light on major data releases, with stronger than expected longer-term inflation expectations in the Michigan survey rising close to its recent highs at 3.1%. While valuations look cheap, in the near-term yields are likely somewhat sticky as it will take moderating inflation data to validate dovish Fed expectations. We stay neutral duration ahead of inflation data and look to add bullish front-end exposure on further yield rises, and keep 5s/30s steepeners to position for eventual easing and higher term premia.

In the Euro area, the minutes of the April meeting reinforced the sense that the ECB is set for a June cut. Over the medium term, we retain a bullish stance given an approaching start to a cutting cycle and gradual easing thereafter, but the lack of near-term catalysts keep us neutral for now. We keep steepeners via 10s/15s Germany and 2Yx2Y/10Yx10Y EUR swaps. In the UK, the BoE provided a modestly dovish tilt despite stronger data; we keep fronts/reds SONIA curve flatteners as a positive carry bullish proxy.

In EM, near-term growth prospects remain solid, but the disinflation process has slowed and become more varied across regions. While cautious EM policy rate cuts continue, the scope for cuts in 2H24 have diminished, particularly in Asia. We stay neutral local duration and hold selective OWs in Brazil, Colombia, Uruguay, Czechia and Poland, offset by a short duration overlay and an UW in Thailand (EMOS, May 8th).

Credit

US HG bond spreads have been trading in a steady range of 100-107bps for the past 2M, recently closing at the tighter end of this range, while HG bond yields drifted lower. Spreads rallied last week despite a surge in issuance, with the largest weekly supply tally since mid-Feb’24. This indicates the robust technicals in the US HG bond market, with demand remaining strong even in the face of increased supply (CMOS, May 10th). The FOMC meeting outcome is a clear negative for most foreign buyers, as long-end USD yields fell significantly while hedging costs rose slightly with the prospect of less or delayed convergence between the Fed and other central banks. As a result, the JPM Foreign Attractiveness of USD IG Bonds index fell sharply to ~3M lows.

Our new monthly Spread Strategy Spotlight publication looks at credit and broader spread markets from the top-down. The first edition comes against the backdrop of the April US payroll and employment reports. Judged from the perspective of not-being-too-hot-nor-being-too-cold, the data could not have been better for spread and broader risk markets. We are not complacent but do not feel overly bearish with all-in yields remaining a powerful offset to optically thin spreads (Spread Strategy Spotlight, May 6th).

We expect euro IG to continue to trade range bound over the near-term. In our view, we are currently in a ‘bad news is good news’ trading environment, with the recent modest softening in the US data reducing the risk of a renewed policy hiking cycle (European Credit Weekly, May 10th).

Currencies

High-for-long would trump fading US exceptionalism. The medium-term view is still bullish USD on high yields, growth cushion and other supports, but tactical concerns stem from nascent signs of fading US growth exceptionalism and saturated investor longs. Inflation divergences will be key as central banks are inflation- rather than growth-focused. The upcoming US CPI will set the tone for FX as Fed pricing has been the single biggest driver of the dollar. Implications from a soft/firm US inflation print are obvious for the direction of Fed pricing, but more nuanced for USD. DXY has been more sensitive to inflation misses.

FX forecasts mostly unchanged: G10 unchanged ex-Scandis: EUR/SEK 1Q25 10.9 (10.3). EM: USD/ZAR 2Q 18.8 (19.0) upgraded on reduced election tail risks, EUR/CZK 3Q 25.75 (26.0) upgraded on hawkish CNB (KCV, May 10th).

Commodities

US Election Implications for Commodities. There could be little difference in overall macro direction between the candidates as extreme proposals are unlikely to materialize given the high probability of a split Congress. However, a change in the administration would mean 1) A possible major realignment of federal energy policy, which would likely not result in higher US oil and gas output but would lighten the regulatory burden on oil and gas companies. 2) US foreign policy could also see significant changes. 3) The potential for a re-escalating tariff war, particularly between China and the US, which is a major bearish risk for base metals via resulting FX and growth consequences. 4) For agri markets the prospect of a firmer dollar and potential trade tensions comes at an inconvenient time when the US is well stocked with a large export surplus of grain and oilseeds (Global Commodities, May 7th).

Turkey is playing a growing role in the European Natural Gas market. We expect Turkish domestic production to increase, theoretically freeing up LNG supply for delivery to Europe and Asia after the Ukraine/Russia transit deal ends. With ample import capacity and potential enhancements in export capacities, Turkey could export/transit up to 40 Bcm/year of natural gas to Europe by 2030 – a 60% increase from 2023 levels (European Natural Gas, May 8th).

JPM Clients’ View

Click here to take this week’s survey

This week, we poll investors on China equities, jobless claims, DM CBs and USTs, in addition to our running survey questions on equity positioning/sentiment, and intentions for near-term changes to equity allocation and bond duration. The results from the last survey are shown below.1

Figure 1: What is your current equity positioning or sentiment in historical terms, expressed from most bearish (0th percentile) to most bullish (100th percentile)?

Source: J.P.Morgan

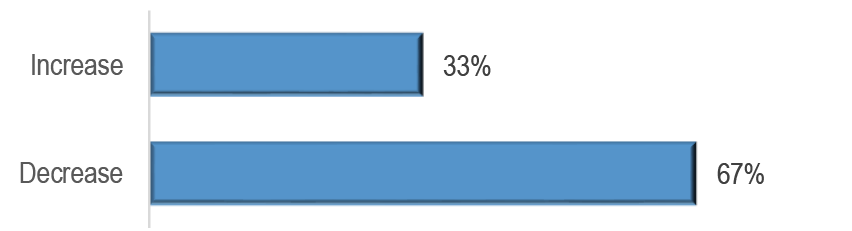
Figure 2: Are you more likely to increase or decrease equity exposure over the coming days/weeks?

Source: J.P. Morgan.

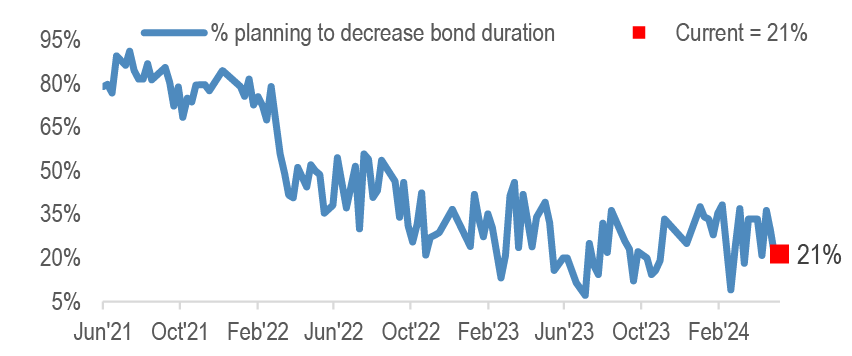
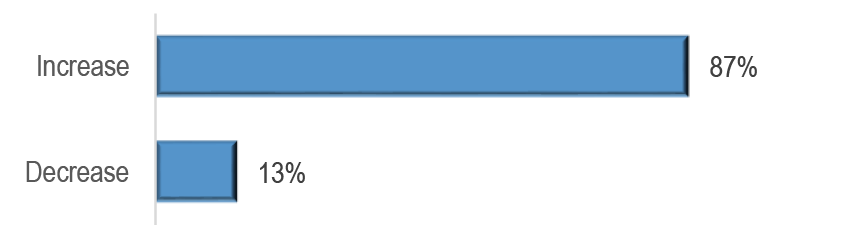
Figure 3: Are you more likely to increase or decrease bond portfolio duration over the coming days/weeks?

Source: J.P. Morgan.

Figure 4: Is the 160 level on JPY a “line in the sand” for the Japanese Ministry of Finance?

Source: J.P. Morgan.

Figure 5: When will Fed QT end?

Source: J.P. Morgan.

Figure 6: How confident are you that the ECB will cut rates in June?

Source: J.P. Morgan.

JPM Clients’ View - This Week’s Interim Survey Results

The charts below show interim results from this week’s survey, collected over the first ~24 hours it was live. The survey remains open here, and we will show updated results in the next J.P. Morgan View publication

Figure 7: What is your current equity positioning or sentiment in historical terms, expressed from most bearish (0th percentile) to most bullish (100th percentile)?

Source: J.P.Morgan

Figure 8: Are you more likely to increase or decrease equity exposure over the coming days/weeks?

Source: J.P. Morgan.

Figure 9: Are you more likely to increase or decrease bond portfolio duration over the coming days/weeks?

Source: J.P. Morgan.

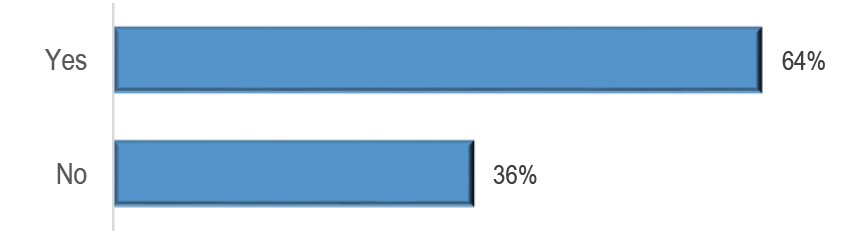
Figure 10: Is the rally in Chinese equities over the past 3M likely to continue?

Source: J.P. Morgan.

Figure 11: Do you find the recent softness in US jobs data (miss on NFP, jump in jobless claims last week) to be concerning?

Source: J.P. Morgan.

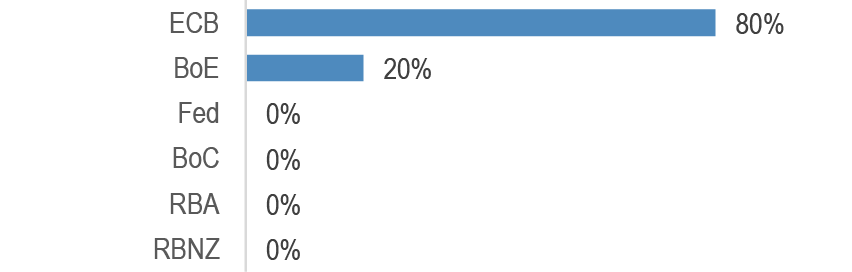
Figure 12: After the Riskbank and SNB, which DM central bank do you think will be the next to cut rates?

Source: J.P. Morgan.

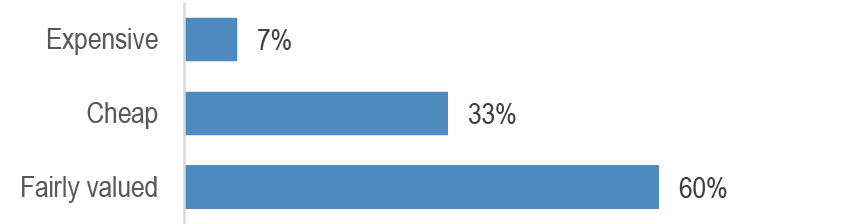
Figure 13: Are US Treasuries expensive or cheap at the moment, in your view?

Source: J.P. Morgan.

Market settling back into soft landing narrative

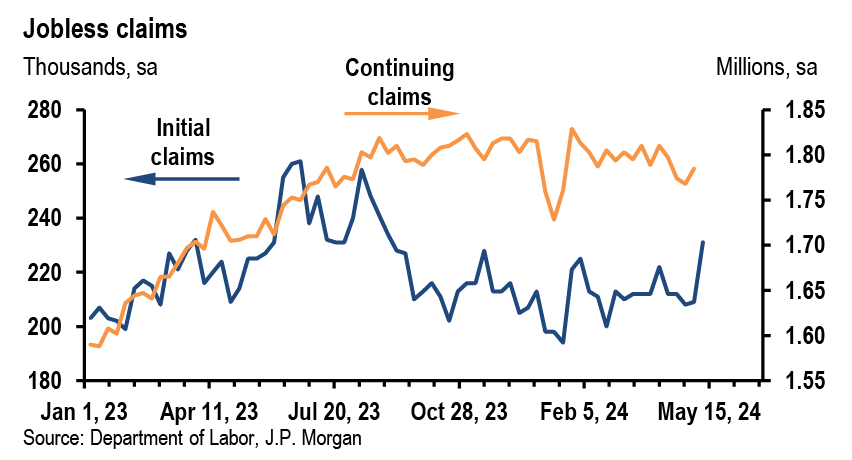
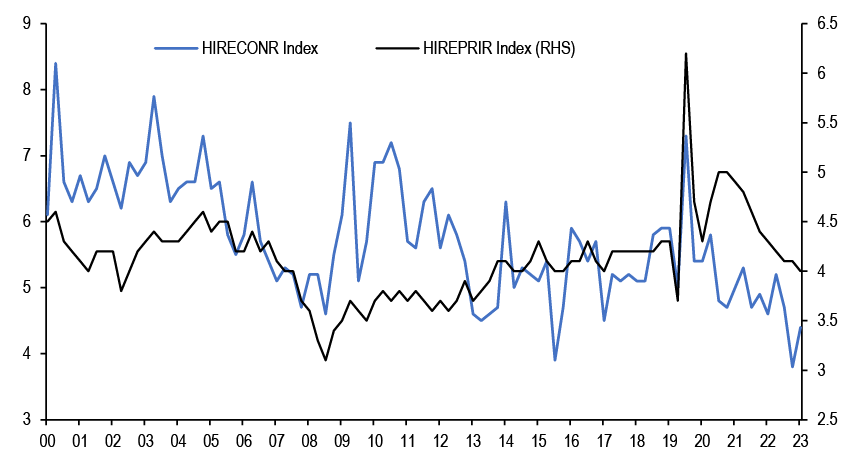
Initial claims jumped from 209,000 to 231,000 during the week ending May 4, a disappointing print that showed the highest weekly level for claims filings since last August. We are keenly focused on signs of labor market weakness but in this case, it is likely attributable to school spring break effects. The April jobs print at 175k has reassured the market that we are no longer in high for long, putting us squarely in soft landing. Meanwhile deterioration from NFIB Hiring Plans, JOLTS Private Hires and Construction series, would be worrisome if one extrapolates the downtrend, but this was countered by muted results from the JOLTS layoffs numbers.

Bonds seem have settled back in to the soft landing narrative after the scare from the March CPI print has finally been assuaged by less hawkish guidance from the Fed (effectively taking hikes off the table) and softer-than-expected US labor market, not to mentioned the dovish hold from the BoE. While we expected a synchronized cutting cycle earlier in the year, the high for long theme on the back of hot inflation prints produced a decoupling that pushed market’s expectation for the Fed’s first cut out to December and BoE out to September. This is now being dialed back as OIS market pricing points to first cuts in November for the Fed and August in BoE. Meanwhile, ECB probability of first cut in June has only increased from 85% to 91%. Despite our baseline view, we acknowledge the macro outlook is uncertain and the data, such as next week’s CPI and HICP, can evolve toward alternative scenarios. DM central banks contemplate a baseline scenario of soft landing where inflation converges to target allowing a gradual removal of restrictive policy stance, which would make carry trades attractive, such as long spread products and short vol, with a broad bullish stance. Alternatively, a hard landing scenario would produce a faster convergence to the neutral policy rate, arguing for outright long duration and steepeners, on the assumption of a bull steepening move. Finally, high for long can also come back into the picture if inflation proves to be stickier, and the suggested positioning would need to be short duration, with bear flattening and underperformance from the intermediate sector. Additionally, for equities we are entering into a seasonally tricky time of the year, with a challenging combination of inflation at risk of staying too high, profit margin pressures, and elevated positioning.

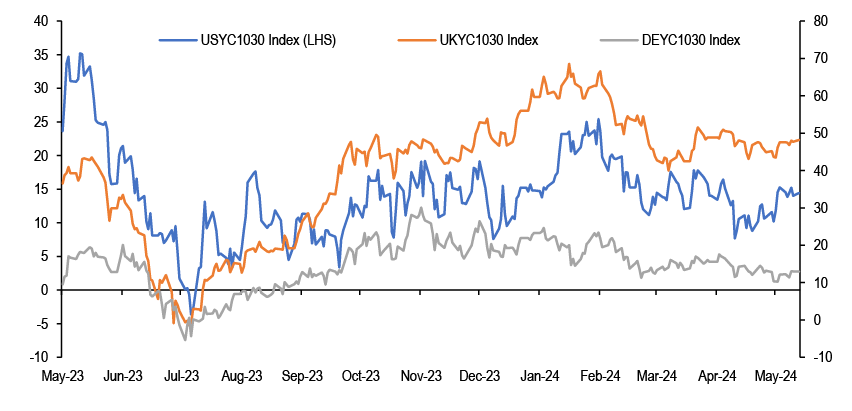
BoE left rates unchanged in a closer 7-2 vote as expected, but dovish language was added to the statement (“risks from inflation persistence are receding”) that more clearly opens the door to a June cut. We continue to assume an August start to cutting, as a lot of data are still to come, but the odds vs. June look more evenly balanced and the onus is now more on the data to talk them out of easing. In terms of positioning, we hold fronts/reds SONIA curve flatteners as a positive carry bullish proxy on 1Yx1Y SONIA, but conviction is lower given the 30bp rally in 1Yx1Y SONIA over the past two weeks and current valuations. We think both UK data (labor market 14 May, UK inflation data 22 May) and US data (i.e. April US CPI) will need to surprise to the downside to drive a further rally over the coming weeks. We continue to hold 10s/30s gilt curve steepeners with the curve a few bp too flat on a short-term regression basis vs. 1Yx1Y SONIA. There is no more 30Y conventional gilt supply scheduled for the rest of this quarter following the 2053 green gilt auction this week with 20Y and 40Y gilt supply remaining between now and the end of June, but given the recent rally in yields we are less sure of the strength of any outright duration demand in the 30Y sector. As discussed in our podcast, steepener trades should work a few months before and after rate cutting begins. Steepener trades in the UK, US, and Europe did well in the 2nd half of 2023, but gave back some p&l in 2024, shaking investors’ confidence. We believe these trades should once again do well on the assumption that the disinflation reasserts itself, clearing the path for rate cuts.

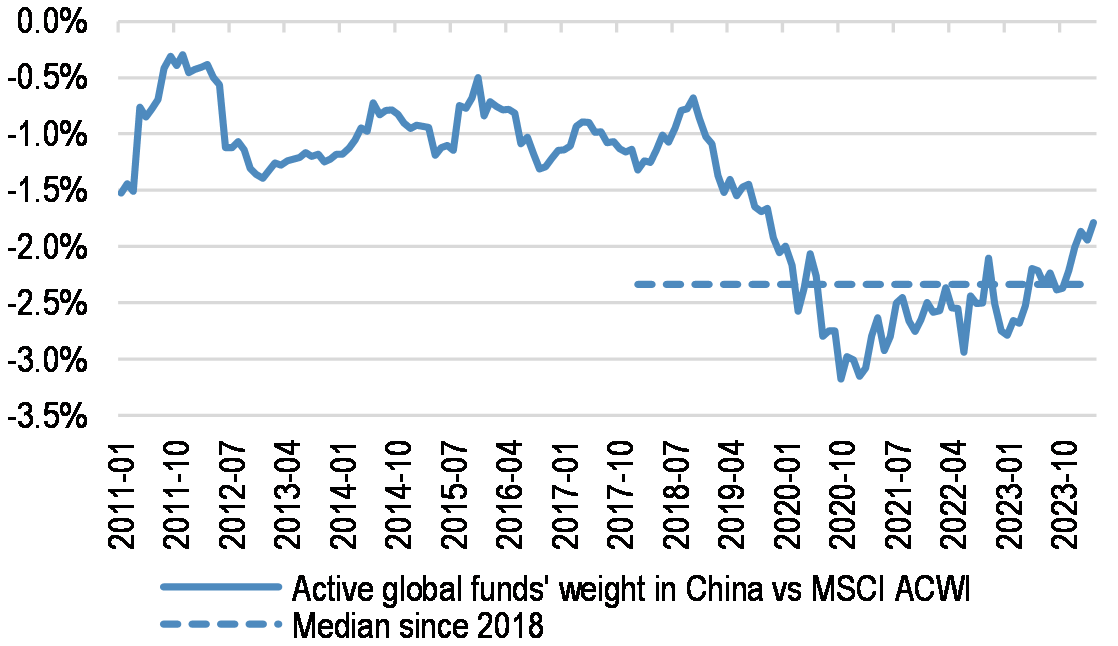
We continue to be tactically bullish on China, despite many caveats. In terms of the reason to be long, our Equities team continues to flag the cheapness, as China trades at 10.2x (-0.6SD below 10-yr average) and HK at 12.6x (-1.5SD below 10-yr average), so still cheap even after the recent rally since late-January 2024. In addition, the recent rally has still left China under-owned by institutional investors, and sentiment from clients has been broadly bearish. The UW positioning of managers is most obvious for global equity funds tracking ACWI and Asia Ex-Japan, not so for EM broadly, and the recent rally has prompted a partial catchup towards pre-GFC levels. It’s worth mentioning that improvements from China were a key input in reducing our UW to Eurozone Equities.

As to why the China equities view needs to be more tactical, we question the durability of the stimulus, as we expect the uplift to fade after the first quarter’s 7.4% q/q saar (moderating to 4% in 2Q24), and growth for the FY2024 settling to 5.2%. The overhang of housing is only partially mitigated by the easing of home purchase restrictions, where we would have preferred to see nationwide housing stimulus or some other form of help for consumers. Also, the technical analysis lens offers mixed messages, with RSIs in MXCN at ~80 a few days ago, indicating overbought conditions, but other measures of a stretched rally such as ‘current price as percent of the 200d moving average’ suggest there is further room to run. Meanwhile, the moves since mid-April have brought us to a place where we are well above moving averages, so no imminent worries of technical selling from going through key levels. One final consideration is the US election, which again argues for a tactical trade, as Chinese stocks can come under pressure once tariffs are back in focus.

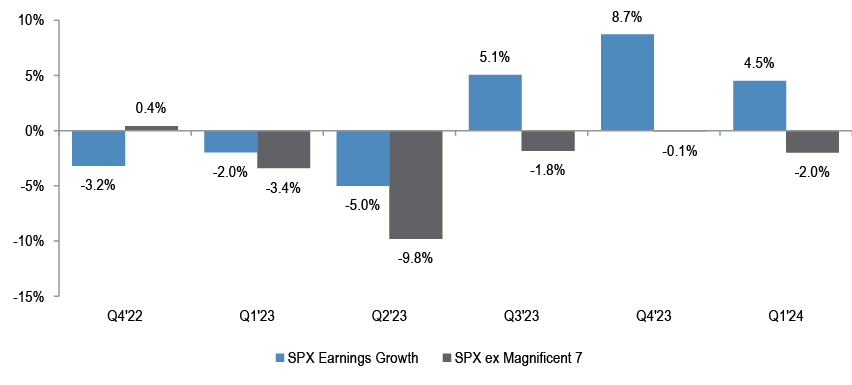
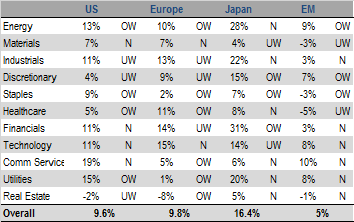
The earnings season is just about done, with 80-90% of companies having reported in US & Europe. Earnings growth came in better than consensus expected, at +5% y/y in the US, and -8% y/y in Europe. As we highlighted in previous weeks, the reward for beats has been subdued, while misses have continued to be severely punished. At a sector level, Discretionary, Communication Services and Tech continue to be the biggest drivers of overall earnings growth in the US. In fact, excluding Mag-7, S&P 500 EPS growth is -2% y/y, the 5th consecutive quarter of negative growth for the ex Mag-7 group. Meanwhile, the percent of companies guiding higher rose vs last quarter, and those guiding lower dropped dramatically. We don’t take comfort on the improved guidance, as the optimism on earnings has gotten ahead of the economic momentum.

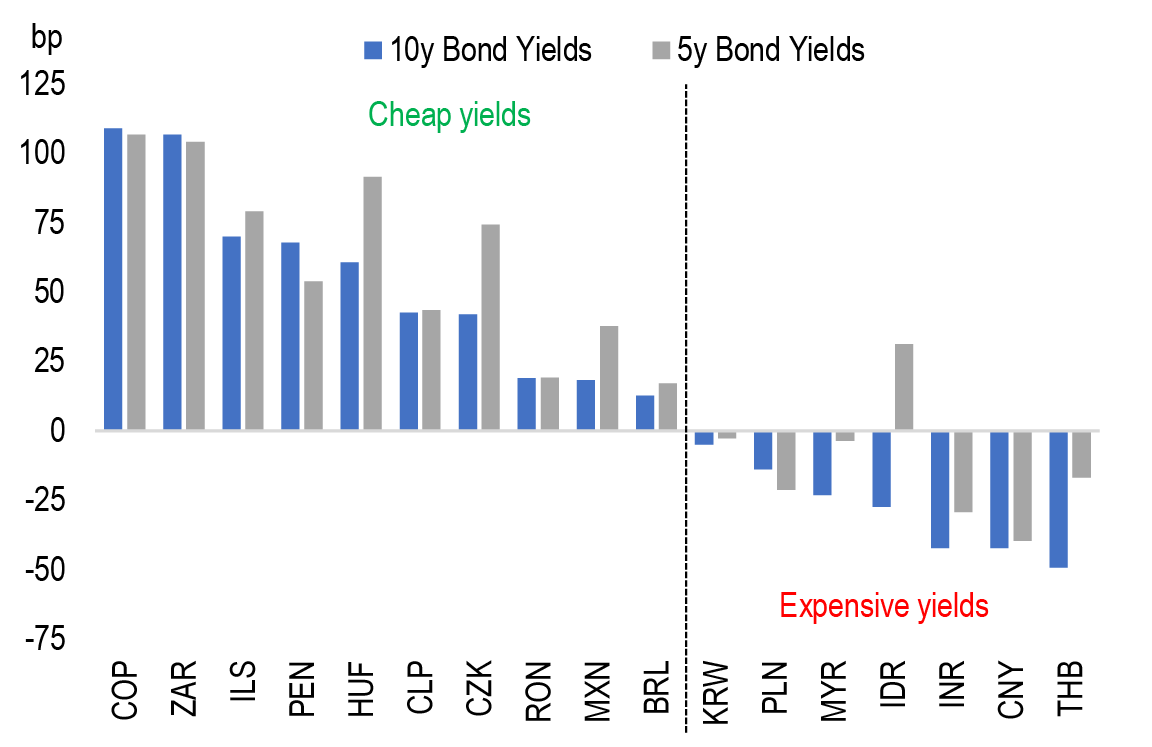
In Emerging Markets, we are in a holding pattern, being neutral on EM local rates, EM FX, EM Sovereign and Corporate Credit. EM growth is solid assuming a bounce in 2Q DM growth and reduced downside risk from China. Rate-sensitive markets have underperformed over the past month, and for both EM local and EM FX we did not manage to get oversold enough for a clear buy signal. As for the disinflation process, core inflation is already below targets in EM Asia, but has more to go in LatAm and EMEA, where core inflation will remain above targets through end-2024. The up-move in US rates has pressured EM currencies and challenged rate cut expectations, with EM Asia facing the most pressure, given rate differentials vs Fed at record lows. After the sell-off in EM Fixed income following the March 12th US inflation print, we see EMEA EM and LatAm local bond yields are above fair value, while Asia are generally below. So despite remaining MW on EM Local as a whole, we are OW EMEA EM and LatAm and UW in Asia.

Figure 14: Uptick in Jobless claims accounted for by school spring break

Figure 15: JOLTS Hires Rate, Private and Construction

Source: J.P. Morgan., Bloomberg Finance L.P.

Figure 16: Steepener trades did well 2H23, but 2024 has been a tough year to go long outright duration or steepeners

Source: J.P. Morgan., Bloomberg Finance L.P.

Figure 17: Active global equity funds’ position in China relative to MSCI ACWI

Source: EPFR, MSCI, J.P. Morgan estimates.

Figure 18: S&P500 vs S&P500 ex Magnificent 7 earnings growth

Source: J.P. Morgan Equity Research, Bloomberg Finance L.P.

Figure 19: Valuations of EM local currency bonds are attractive outside of Asia

Vertical axis (bp): Deviation from fair value yields. See our EM Local Currency Bonds Fair Value Monitor.

Source: J.P. Morgan Emerging Markets Research, Bloomberg Finance L.P., Haver Analytics

Global Research Digest

Macro & Cross-Asset Views

Global Thematic Strategy: Key Upcoming Elections, Equity Implications, Policy-Linked Stock Ideas, Dubravko Lakos-Bujas

With the global election cycle just warming up, we preview key upcoming elections and their implications across DM and EM. While macro themes remain dominant, focus is beginning to center on the US Presidential and Congressional elections given the policy differences between the leading candidates, the size of the US equity market, and the potential knock-on effects to other geographies, particularly in EM. In this report, we explore various election scenarios and provide 11 key thematic stock baskets, 11 stock screens and sector/style recommendations that align with major policy proposals across geographies. J.P. Morgan Research does not provide research coverage of baskets and investors should not expect continuous analysis or additional reports relating to them.

The Great Transformation: Moving from a unipolar to multipolar world, Joyce Chang

Conventional wisdom that geopolitical risks generate more noise than trend could be challenged by the ongoing shift to a multipolar world. The world is undergoing a large pivot in globalization compared to the prior 30-40 years with the pendulum shifting back to big and active government, protectionism, and income redistribution. Irrespective of the outcome of the US elections, US-China tensions are likely to escalate, but the tech competition between the US and China is at the epicenter of the rise in industrial policy along with the emerging doctrine on economic statecraft. “Mini fires” are often overlooked but have longer-term consequences to energy security, climate policy and immigration, particularly in the aid dependent zone around the Horn of Africa.

The Long-term Strategist: KISS investing, Jan Loeys

We conclude there is a lot of benefit to the ultimate buyers of financial services and products to keep things simple. One should not buy assets that are too complex to be easily understood as the risk is then that the asset will not be appropriate for one’s financial objectives. Second, the fewer the assets one has in one’s portfolio, the easier it is to judge risk on them, the easier it is to gauge one’s exposure, the easier it is to manage one’s portfolio and the less time it takes. And probably the greatest benefit of simpler products is that they are cheaper, in terms of management fees and the costs of buying and selling them.

 Flows & Liquidity: Financial conditions impulse remains positive, Nikolaos Panigirtzoglou

Financial conditions steadily improved from their peak tightening in 2H22 to a net loosening by 4Q23. Moreover, this has been a broad-based improvement as the effect of past yield rises has faded, equity returns turned from a headwind to a tailwind and lending surveys have eased back significantly from their previous peaks. Based on quarter-to-date data for 2Q24 on 12-month changes to rates, spreads, returns as well as the 2Q24 lending surveys, this positive impulse from financial conditions appears to have continued. In all, the above suggests the financial conditions impulse remains positive, posing some upside risks for growth and inflation.

Global Economics

ECB challenged by inflation data, less so by the Fed, Greg Fuzesi

The ECB is likely to be agnostic and adjust its policy plans only if it sees evidence of significant market moves. At the same time, the domestic data are providing the main challenge at present: growth is improving without clear signs of improving productivity growth and services inflation is remaining sticky. We still see Euro area inflation eventually falling to 2% without the labor market having to weaken, but the path remains uncertain. To better balance risks, we take out an October cut from our forecast, taking this year's easing to 75bp and also modestly slow next year’s cuts, but without currently changing the endpoint of a 2% policy rate.

BoE: A dovish turn amid stronger data., Allan Monks

We stick with our call in August cut for now, but the odds vs. June look more evenly balanced and the onus is now more on the data to talk them out of easing. Given issues with the labour market and pay data at the moment, there is a greater focus on the services CPI in particular. This metric surprised the BoE by a significant +0.2%-pts in March. We also expect growth and activity to come in firmer than the MPC are projecting. A growth recovery appears to be underway, and this should be acting to reduce the urgency to cut rates.

Japan: BoJ to choose the lesser of two evils, Ayako Fujita

The MoF continues to control the pace of yen depreciation through FX intervention, but it is becoming apparent that it can only slow yen declines temporarily. The weaker yen certainly brought benefits to the economy, but this has not yet led to a rise in overall domestic demand due to the clogging of the corporate-to-household income channel. Rapid weakening of the yen could potentially undermine confidence in the yen at home, which in itself may raise the risk of further weakening of the yen through a rise in capital outflows. We expect the BoJ to raise policy rates at a faster pace than hinted, to 50bp by end-2024.

Hong Kong’s prospects as a financial center, Ji Yan

In our view, it is in HK SAR’s interest to further deepen its financial linkages with the Mainland. Both cyclical and structural forces are at work. Current high interest rates are the major cyclical factor, which may last longer than previously expected. The structural challenges include China’s deflation pressure on corporate earnings, slowing potential growth in China, and geopolitical tensions. These may have prolonged effects.

Global Market Implications

Spread Strategy Spotlight: A new member of the Spotlight family, Stephen Dulake

Our broader Credit, Securitized Products and Public Finance Research teams collaborated and published their first edition of the new Spread Strategy Spotlight. These are either product- or regionally-focused, are published weekly and are focused on what our analysts judge to be the topical single-name stories of the day. By contrast, the Spread Strategy Spotlight will come at credit and broader spread markets from the top-down and be published monthly, initially at least. We are not complacent but do not feel overly bearish with all-in yields remaining a powerful offset to optically thin spreads.

Global Commodities: 2024 US Election Watch—Implications for Commodities, JPM Commodities Research

We conclude that ultimately there could be little difference in overall macro direction between Trump and Biden and that most extreme proposals are unlikely to materialize given the high probability of a split Congress. A change in the adminstration would mean a possible major realignment of federal energy policy, which would likely not result in higher US oil and gas output but would lighten the regulatory burden on oil and gas companies. An escalating global tariff war could drag significantly on metals demand growth via slower GDP growth. Potential impacts of a change in US presidency in 2024 from a policy perspective appear the least severe for the agricultural sector.

Cross currency basis 2Q24 Outlook: Tug of war between Fed QT tapering and relative monetary policy vs. crowding out from higher T-bill issuance, Fabio Bassi

Macro drivers such as policy rate differential and relative balance sheet dynamic are expected to be key drivers of the cross currency basis market, with limited beta to risk-off concerns and flight to quality dynamic. Widening on risk aversion and flight to quality expected to be temporary as occurring in a broad context of limited USD scarcity. Narrowing bias across cross currency basis from more than priced Fed easing and slower QT pace partly counterbalanced by risk of crowding out effect from increases in T-bill issuance, itself triggering some local USD scarcity, leaving broadly a neutral outlook.

Sector Level Views

Broadlines & Hardlines Retailing: Setup & Expectations: WMT, TGT, HD, LOW, Christopher Horvers, CFA

We preview WMT, TGT, HD, and LOW’s 1Q earnings. WMT is trading at 25x our 2024 EPS forecast and 22x 2025E, suggesting its next move needs to be revision-driven, with at best one additional P/E turn on 2025E on a 4%+ comp. We are tweaking up TGT 1Q comp forecast to -3.6% (from -4.0%), and tweaking down HD 1Q24 comp forecast to -2.0% from -1.5%. We are also tweaking down LOW 1Q SSS forecast to -5.5% and don’t expect LOW to change the guidance outside of the potential impact from the pending late fee decision.

European Airlines: Updated estimates for slower summer pricing comments - remain OW Ryanair and easyJet, Harry J Gowers

Although we recognise sentiment may be negative on the LCCs until we get some clarity, on balance we would buy Ryanair/easyJet on the share price weakness. Our actual estimate changes for Ryanair are minimal, and with our modelled fares up <1% for Mar-25E, there could be room for earnings upgrades as the year develops, and with an unchanged structural growth story and potential share buyback to be announced this year. Our ratings are unchanged; OW Ryanair, OW easyJet, N Wizz.

ChatESG: Why is AI so thirsty? Water use by data centers 101, Hannah Lee

While data centers have been scrutinized for heavy electricity use, the water intensive nature of their operations has been comparatively overlooked. Building on our work on water as a sustainable investment theme, we deep dive into data centers, providing a comprehensive 101 on where, why, and how water is consumed. We also provide an overview of low water use heat rejection technology, and efficiency options, that can alleviate the water burden that AI likely brings.

Strategy & Forecasts

GAA Long-Only Model Portfolio

Equity sector recommendations and YTD returns

Source: J. P. Morgan, Bloomberg Finance L.P.

JPM Forecasts

Source: J.P. Morgan, Bloomberg Finance L.P., Datastream.

  1. 1 Results are based on 15 responses received from clients in our survey conducted May 6-13th

Risks of Common Option Strategies

Risks to Strategies: Not all option strategies are suitable for investors; certain strategies may expose investors to significant potential losses. We have summarized the risks of selected derivative strategies. For additional risk information, please call your sales representative for a copy of “Characteristics and Risks of Standardized Options.” We advise investors to consult their tax advisors and legal counsel about the tax implications of these strategies. Please also refer to option risk disclosure documents.

Put Sale: Investors who sell put options will own the underlying asset if the asset’s price falls below the strike price of the put option. Investors, therefore, will be exposed to any decline in the underlying asset’s price below the strike potentially to zero, and they will not participate in any price appreciation in the underlying asset if the option expires unexercised.

Call Sale: Investors who sell uncovered call options have exposure on the upside that is theoretically unlimited.

Call Overwrite or Buywrite: Investors who sell call options against a long position in the underlying asset give up any appreciation in the underlying asset’s price above the strike price of the call option, and they remain exposed to the downside of the underlying asset in the return for the receipt of the option premium.

Booster : In a sell-off, the maximum realized downside potential of a double-up booster is the net premium paid. In a rally, option losses are potentially unlimited as the investor is net short a call. When overlaid onto a long position in the underlying asset, upside losses are capped (as for a covered call), but downside losses are not.

Collar: Locks in the amount that can be realized at maturity to a range defined by the put and call strike. If the collar is not costless, investors risk losing 100% of the premium paid. Since investors are selling a call option, they give up any price appreciation in the underlying asset above the strike price of the call option.

Call Purchase: Options are a decaying asset, and investors risk losing 100% of the premium paid if the underlying asset’s price is below the strike price of the call option.

Put Purchase: Options are a decaying asset, and investors risk losing 100% of the premium paid if the underlying asset’s price is above the strike price of the put option.

Straddle or Strangle: The seller of a straddle or strangle is exposed to increases in the underlying asset’s price above the call strike and declines in the underlying asset’s price below the put strike. Since exposure on the upside is theoretically unlimited, investors who also own the underlying asset would have limited losses should the underlying asset rally. Covered writers are exposed to declines in the underlying asset position as well as any additional exposure should the underlying asset decline below the strike price of the put option. Having sold a covered call option, the investor gives up all appreciation in the underlying asset above the strike price of the call option.

Put Spread: The buyer of a put spread risks losing 100% of the premium paid. The buyer of higher-ratio put spread has unlimited downside below the lower strike (down to zero), dependent on the number of lower-struck puts sold. The maximum gain is limited to the spread between the two put strikes, when the underlying is at the lower strike. Investors who own the underlying asset will have downside protection between the higher-strike put and the lower-strike put. However, should the underlying asset’s price fall below the strike price of the lower-strike put, investors regain exposure to the underlying asset, and this exposure is multiplied by the number of puts sold.

Call Spread: The buyer risks losing 100% of the premium paid. The gain is limited to the spread between the two strike prices. The seller of a call spread risks losing an amount equal to the spread between the two call strikes less the net premium received. By selling a covered call spread, the investor remains exposed to the downside of the underlying asset and gives up the spread between the two call strikes should the underlying asset rally.

Butterfly Spread: A butterfly spread consists of two spreads established simultaneously – one a bull spread and the other a bear spread. The resulting position is neutral, that is, the investor will profit if the underlying is stable. Butterfly spreads are established at a net debit. The maximum profit will occur at the middle strike price; the maximum loss is the net debit.

Pricing Is Illustrative Only: Prices quoted in the above trade ideas are our estimate of current market levels, and are not indicative trading levels.

Correction: Survey results added on page 5.

Companies Discussed in This Report (all prices in this report as of market close on 14 May 2024, unless otherwise indicated)Ryanair(RYA.I/€18.78/OW), easyJet(EZJ.L/525p/OW)

Disclosures

Analyst Certification: The Research Analyst(s) denoted by an “AC” on the cover of this report certifies (or, where multiple Research Analysts are primarily responsible for this report, the Research Analyst denoted by an “AC” on the cover or within the document individually certifies, with respect to each security or issuer that the Research Analyst covers in this research) that: (1) all of the views expressed in this report accurately reflect the Research Analyst’s personal views about any and all of the subject securities or issuers; and (2) no part of any of the Research Analyst's compensation was, is, or will be directly or indirectly related to the specific recommendations or views expressed by the Research Analyst(s) in this report. For all Korea-based Research Analysts listed on the front cover, if applicable, they also certify, as per KOFIA requirements, that the Research Analyst’s analysis was made in good faith and that the views reflect the Research Analyst’s own opinion, without undue influence or intervention.

All authors named within this report are Research Analysts who produce independent research unless otherwise specified. In Europe, Sector Specialists (Sales and Trading) may be shown on this report as contacts but are not authors of the report or part of the Research Department.

Other Disclosure : A contributor to this report has a household member who is a senior portfolio manager of and investor in certain emerging markets mutual funds, which may invest in instruments discussed in this report.

Important Disclosures

  • Market Maker/ Liquidity Provider: J.P. Morgan is a market maker and/or liquidity provider in the financial instruments of/related to easyJet, Ryanair.
  • Beneficial Ownership (1% or more): J.P. Morgan beneficially owns 1% or more of a class of common equity securities of Ryanair.
  • Client: J.P. Morgan currently has, or had within the past 12 months, the following entity(ies) as clients: easyJet, Ryanair.
  • Client/Non-Investment Banking, Securities-Related: J.P. Morgan currently has, or had within the past 12 months, the following entity(ies) as clients, and the services provided were non-investment-banking, securities-related: easyJet, Ryanair.
  • Client/Non-Securities-Related: J.P. Morgan currently has, or had within the past 12 months, the following entity(ies) as clients, and the services provided were non-securities-related: Ryanair.
  • Non-Investment Banking Compensation Received: J.P. Morgan has received compensation in the past 12 months for products or services other than investment banking from easyJet, Ryanair.
  • Debt Position: J.P. Morgan may hold a position in the debt securities of easyJet, Ryanair, if any.

Company-Specific Disclosures: Important disclosures, including price charts and credit opinion history tables, are available for compendium reports and all J.P. Morgan–covered companies, and certain non-covered companies, by visiting https://www.jpmm.com/research/disclosures, calling 1-800-477-0406, or e-mailing research.disclosure.inquiries@jpmorgan.com with your request.

Date Rating Price (p) Price Target (p)
21-Jul-21 N 654 741
14-Sep-21 N 590 595
22-Oct-21 N 600 535
20-Jan-22 N 625 620
28-Apr-22 N 556 600
26-May-22 N 508 625
15-Jul-22 UW 364 310
10-Oct-22 UW 294 270
19-Oct-22 UW 326 260
15-Dec-22 UW 363 320
16-Jan-23 UW 431 310
02-Feb-23 UW 483 370
27-Apr-23 N 488 530
16-Jun-23 N 492 550
03-Jul-23 N 483 570
02-Oct-23 N 427 540
27-Oct-23 N 367 500
03-Jan-24 N 504 520
01-Feb-24 OW 556 690
27-Feb-24 OW 557 680
28-Mar-24 OW 558 700
19-Apr-24 OW 530 710
Date Rating Price (€) Price Target (€)
25-May-21 N 16.46 15.8
12-Jul-21 N 16.20 16.4
06-Sep-21 N 16.02 17.7
22-Oct-21 N 16.00 16.4
20-Jan-22 OW 16.22 21
17-May-22 OW 13.60 20.5
15-Jul-22 OW 12.04 19
26-Jul-22 OW 12.87 19.2
10-Oct-22 OW 10.64 17.7
08-Nov-22 OW 12.76 18.2
15-Dec-22 OW 12.85 21
16-Jan-23 OW 14.65 21.3
02-Feb-23 OW 14.96 22
25-Apr-23 OW 14.94 22.5
25-May-23 OW 16.55 23
29-Jun-23 OW 16.94 24.5
15-Sep-23 OW 16.34 24.8
22-Sep-23 OW 16.30 24.6
07-Nov-23 OW 16.01 25
07-Dec-23 OW 18.42 28.5
04-Jan-24 OW 18.18 28.4
30-Jan-24 OW 19.56 28.5
27-Feb-24 OW 20.46 28.7
05-Apr-24 OW 20.98 29
08-May-24 OW 19.00 28.5

The chart(s) show J.P. Morgan's continuing coverage of the stocks; the current analysts may or may not have covered it over the entire period. J.P. Morgan ratings or designations: OW = Overweight, N= Neutral, UW = Underweight, NR = Not Rated

Explanation of Equity Research Ratings, Designations and Analyst(s) Coverage Universe: J.P. Morgan uses the following rating system: Overweight (over the duration of the price target indicated in this report, we expect this stock will outperform the average total return of the stocks in the Research Analyst’s, or the Research Analyst’s team’s, coverage universe); Neutral (over the duration of the price target indicated in this report, we expect this stock will perform in line with the average total return of the stocks in the Research Analyst’s, or the Research Analyst’s team’s, coverage universe); and Underweight (over the duration of the price target indicated in this report, we expect this stock will underperform the average total return of the stocks in the Research Analyst’s, or the Research Analyst’s team’s, coverage universe. NR is Not Rated. In this case, J.P. Morgan has removed the rating and, if applicable, the price target, for this stock because of either a lack of a sufficient fundamental basis or for legal, regulatory or policy reasons. The previous rating and, if applicable, the price target, no longer should be relied upon. An NR designation is not a recommendation or a rating. In our Asia (ex-Australia and ex-India) and U.K. small- and mid-cap Equity Research, each stock’s expected total return is compared to the expected total return of a benchmark country market index, not to those Research Analysts’ coverage universe. If it does not appear in the Important Disclosures section of this report, the certifying Research Analyst’s coverage universe can be found on J.P. Morgan’s Research website, https://www.jpmorganmarkets.com.

J.P. Morgan Equity Research Ratings Distribution, as of April 06, 2024

Overweight(buy) Neutral(hold) Underweight(sell)
J.P. Morgan Global Equity Research Coverage* 48% 39% 14%
    IB clients** 49% 45% 35%
JPMS Equity Research Coverage* 46% 42% 12%
    IB clients** 70% 66% 52%

*Please note that the percentages may not add to 100% because of rounding.**Percentage of subject companies within each of the "buy," "hold" and "sell" categories for which J.P. Morgan has provided investment banking services within the previous 12 months. For purposes of FINRA ratings distribution rules only, our Overweight rating falls into a buy rating category; our Neutral rating falls into a hold rating category; and our Underweight rating falls into a sell rating category. Please note that stocks with an NR designation are not included in the table above. This information is current as of the end of the most recent calendar quarter.

Equity Valuation and Risks: For valuation methodology and risks associated with covered companies or price targets for covered companies, please see the most recent company-specific research report at http://www.jpmorganmarkets.com, contact the primary analyst or your J.P. Morgan representative, or email research.disclosure.inquiries@jpmorgan.com. For material information about the proprietary models used, please see the Summary of Financials in company-specific research reports and the Company Tearsheets, which are available to download on the company pages of our client website, http://www.jpmorganmarkets.com. This report also sets out within it the material underlying assumptions used.

A history of J.P. Morgan investment recommendations disseminated during the preceding 12 months can be accessed on the Research & Commentary page of http://www.jpmorganmarkets.com where you can also search by analyst name, sector or financial instrument.

easyJet - J.P. Morgan Credit Opinion History

Date Action Rating/Designation Ticker/ISIN
Issuer 18 May 21 Downgrade Underweight EZJLN
Issuer 18 Mar 22 Upgrade Neutral EZJLN
1.875% '28 * 10 Jan 24 Initiate Neutral XS2306601746
1.75% '23 18 May 21 Downgrade Underweight XS1361115402
1.75% '23 18 Mar 22 Upgrade Neutral XS1361115402
1.75% '23 10 Jan 24 Terminate Not Covered XS1361115402

Ryanair - J.P. Morgan Credit Opinion History

Date Action Rating/Designation Ticker/ISIN
Issuer 14 Jul 20 Upgrade Overweight RYAID
0.875% '26 * 10 Jan 24 Initiate Overweight XS2344385815
1.125% notes due 2023 10 Jan 24 Terminate Not Covered XS1199964575
1.125% notes due 2023 10 Jan 24 Not Covered XS1565699763
1.875% EUR Notes due 2021 10 Jan 24 Terminate Not Covered XS1077584024

*Indicates representative/primary bond/instrument.

The table(s) above show the recommendation changes made by J.P. Morgan Credit Research Analysts in the subject company and/or instruments over the past three years (or, if no recommendation changes were made during that period, the most recent change). Notes: Effective April 11, 2016, J.P. Morgan changed its Credit Research Ratings System. Please see the Explanation of Credit Research Ratings below for the new definitions. The previous rating system no longer should be relied upon. For the history prior to April 11, 2016, please call 1-800-447-0406 or e-mail research.disclosure.inquiries@jpmorgan.com.

Explanation of Emerging Markets Sovereign Research Ratings System and Valuation & Methodology: Ratings System : J.P. Morgan uses the following issuer portfolio weightings for Emerging Markets Sovereign Research: Overweight (over the next three months, the recommended risk position is expected to outperform the relevant index, sector, or benchmark credit returns); Marketweight (over the next three months, the recommended risk position is expected to perform in line with the relevant index, sector, or benchmark credit returns); and Underweight (over the next three months, the recommended risk position is expected to underperform the relevant index, sector, or benchmark credit returns). NR is Not Rated. In this case, J.P. Morgan has removed the rating for this security because of either legal, regulatory or policy reasons or because of lack of a sufficient fundamental basis. The previous rating no longer should be relied upon. An NR designation is not a recommendation or a rating. NC is Not Covered. An NC designation is not a rating or a recommendation. Recommendations will be at the issuer level, and an issuer recommendation applies to all of the index-eligible bonds at the same level for the issuer. When we change the issuer-level rating, we are changing the rating for all of the issues covered, unless otherwise specified. Ratings for quasi-sovereign issuers in the EMBIG may differ from the ratings provided in EM corporate coverage. Valuation & Methodology : For J.P. Morgan's Emerging Markets Sovereign Research, we assign a rating to each sovereign issuer (Overweight, Marketweight or Underweight) based on our view of whether the combination of the issuer’s fundamentals, market technicals, and the relative value of its securities will cause it to outperform, perform in line with, or underperform the credit returns of the EMBIGD index over the next three months. Our view of an issuer’s fundamentals includes our opinion of whether the issuer is becoming more or less able to service its debt obligations when they become due and payable, as well as whether its willingness to service debt obligations is increasing or decreasing.

J.P. Morgan Emerging Markets Sovereign Research Ratings Distribution, as of April 6, 2024

Overweight(buy) Marketweight(hold) Underweight(sell)
Global Sovereign Research Universe* 12% 82% 6%
    IB clients** 13% 50% 75%

*Please note that the percentages may not add to 100% because of rounding. **Percentage of subject issuers within each of the "Overweight, "Marketweight" and "Underweight" categories for which J.P. Morgan has provided investment banking services within the previous 12 months. For purposes of FINRA ratings distribution rules only, our Overweight rating falls into a buy rating category; our Marketweight rating falls into a hold rating category; and our Underweight rating falls into a sell rating category. The Emerging Markets Sovereign Research Rating Distribution is at the issuer level. Issuers with an NR or an NC designation are not included in the table above. This information is current as of the end of the most recent calendar quarter.

Explanation of Credit Research Valuation Methodology, Ratings and Risk to Ratings: J.P. Morgan uses a bond-level rating system that incorporates valuations (relative value) and our fundamental view on the security. Our fundamental credit view of an issuer is based on the company's underlying credit trends, overall creditworthiness and our opinion on whether the issuer will be able to service its debt obligations when they become due and payable. We analyze, among other things, the company's cash flow capacity and trends and standard credit ratios, such as gross and net leverage, interest coverage and liquidity ratios. We also analyze profitability, capitalization and asset quality, among other variables, when assessing financials. Analysts also rate the issuer, based on the rating of the benchmark or representative security. Unless we specify a different recommendation for the company’s individual securities, an issuer recommendation applies to all of the bonds at the same level of the issuer’s capital structure. We may also rate certain loans and preferred securities, as applicable. This report also sets out within it the material underlying assumptions used. We use the following ratings for bonds (issues), issuers, loans, and preferred securities: Overweight (over the next three months, the recommended risk position is expected to outperform the relevant index, sector, or benchmark); Neutral (over the next three months, the recommended risk position is expected to perform in line with the relevant index, sector, or benchmark); and Underweight (over the next three months, the recommended risk position is expected to underperform the relevant index, sector, or benchmark). J.P. Morgan Emerging Markets Sovereign Research uses Marketweight, which is equivalent to Neutral. NR is Not Rated. In this case, J.P. Morgan has removed the rating for this particular security or issuer because of either a lack of a sufficient fundamental basis or for legal, regulatory or policy reasons. The previous rating no longer should be relied upon. An NR designation is not a recommendation or a rating. NC is Not Covered. An NC designation is not a rating or a recommendation. For CDS, we use the following rating system: Long Risk (over the next three months, the credit return on the recommended position is expected to exceed the relevant index, sector or benchmark); Neutral (over the next three months, the credit return on the recommended position is expected to match the relevant index, sector or benchmark); and Short Risk (over the next three months, the credit return on the recommended position is expected to underperform the relevant index, sector or benchmark).

J.P. Morgan Credit Research Ratings Distribution, as of April 06, 2024

Overweight(buy) Neutral(hold) Underweight(sell)
Global Credit Research Universe* 27% 56% 17%
    IB clients** 65% 59% 63%

*Please note that the percentages may not add to 100% because of rounding.**Percentage of subject companies within each of the "Overweight," "Neutral" and "Underweight" categories for which J.P. Morgan has provided investment banking services within the previous 12 months.For purposes of FINRA ratings distribution rules only, our Overweight rating falls into a buy rating category; our Neutral rating falls into a hold rating category; and our Underweight rating falls into a sell rating category. The Credit Research Rating Distribution is at the issuer level. Issuers with an NR or an NC designation are not included in the table above. This information is current as of the end of the most recent calendar quarter.

Analysts' Compensation: The research analysts responsible for the preparation of this report receive compensation based upon various factors, including the quality and accuracy of research, client feedback, competitive factors, and overall firm revenues.

Registration of non-US Analysts: Unless otherwise noted, the non-US analysts listed on the front of this report are employees of non-US affiliates of J.P. Morgan Securities LLC, may not be registered as research analysts under FINRA rules, may not be associated persons of J.P. Morgan Securities LLC, and may not be subject to FINRA Rule 2241 or 2242 restrictions on communications with covered companies, public appearances, and trading securities held by a research analyst account.

Other Disclosures

J.P. Morgan is a marketing name for investment banking businesses of JPMorgan Chase & Co. and its subsidiaries and affiliates worldwide.

UK MIFID FICC research unbundling exemption: UK clients should refer to UK MIFID Research Unbundling exemption for details of J.P. Morgan’s implementation of the FICC research exemption and guidance on relevant FICC research categorisation.

QIB Only

All research material made available to clients are simultaneously available on our client website, J.P. Morgan Markets, unless specifically permitted by relevant laws. Not all research content is redistributed, e-mailed or made available to third-party aggregators. For all research material available on a particular stock, please contact your sales representative.

Any long form nomenclature for references to China; Hong Kong; Taiwan; and Macau within this research material are Mainland China; Hong Kong SAR (China); Taiwan (China); and Macau SAR (China).

J.P. Morgan Research may, from time to time, write on issuers or securities targeted by economic or financial sanctions imposed or administered by the governmental authorities of the U.S., EU, UK or other relevant jurisdictions (Sanctioned Securities). Nothing in this report is intended to be read or construed as encouraging, facilitating, promoting or otherwise approving investment or dealing in such Sanctioned Securities. Clients should be aware of their own legal and compliance obligations when making investment decisions.

Any digital or crypto assets discussed in this research report are subject to a rapidly changing regulatory landscape. For relevant regulatory advisories on crypto assets, including bitcoin and ether, please see https://www.jpmorgan.com/disclosures/cryptoasset-disclosure.

An analyst listed on the front cover has personal holdings in digital or crypto assets.

The author(s) of this research report may not be licensed to carry on regulated activities in your jurisdiction and, if not licensed, do not hold themselves out as being able to do so.

Exchange-Traded Funds (ETFs): J.P. Morgan Securities LLC (“JPMS”) acts as authorized participant for substantially all U.S.-listed ETFs. To the extent that any ETFs are mentioned in this report, JPMS may earn commissions and transaction-based compensation in connection with the distribution of those ETF shares and may earn fees for performing other trade-related services, such as securities lending to short sellers of the ETF shares. JPMS may also perform services for the ETFs themselves, including acting as a broker or dealer to the ETFs. In addition, affiliates of JPMS may perform services for the ETFs, including trust, custodial, administration, lending, index calculation and/or maintenance and other services.

Options and Futures related research: If the information contained herein regards options- or futures-related research, such information is available only to persons who have received the proper options or futures risk disclosure documents. Please contact your J.P. Morgan Representative or visit https://www.theocc.com/components/docs/riskstoc.pdf for a copy of the Option Clearing Corporation's Characteristics and Risks of Standardized Options or http://www.finra.org/sites/default/files/Security_Futures_Risk_Disclosure_Statement_2018.pdf for a copy of the Security Futures Risk Disclosure Statement.

Changes to Interbank Offered Rates (IBORs) and other benchmark rates: Certain interest rate benchmarks are, or may in the future become, subject to ongoing international, national and other regulatory guidance, reform and proposals for reform. For more information, please consult: https://www.jpmorgan.com/global/disclosures/interbank_offered_rates

Private Bank Clients: Where you are receiving research as a client of the private banking businesses offered by JPMorgan Chase & Co. and its subsidiaries (“J.P. Morgan Private Bank”), research is provided to you by J.P. Morgan Private Bank and not by any other division of J.P. Morgan, including, but not limited to, the J.P. Morgan Corporate and Investment Bank and its Global Research division.

Legal entity responsible for the production and distribution of research: The legal entity identified below the name of the Reg AC Research Analyst who authored this material is the legal entity responsible for the production of this research. Where multiple Reg AC Research Analysts authored this material with different legal entities identified below their names, these legal entities are jointly responsible for the production of this research. Research Analysts from various J.P. Morgan affiliates may have contributed to the production of this material but may not be licensed to carry out regulated activities in your jurisdiction (and do not hold themselves out as being able to do so). Unless otherwise stated below, this material has been distributed by the legal entity responsible for production. If you have any queries, please contact the relevant Research Analyst in your jurisdiction or the entity in your jurisdiction that has distributed this research material.

Legal Entities Disclosures and Country-/Region-Specific Disclosures: Argentina: JPMorgan Chase Bank N.A Sucursal Buenos Aires is regulated by Banco Central de la República Argentina (“BCRA”- Central Bank of Argentina) and Comisión Nacional de Valores (“CNV”- Argentinian Securities Commission - ALYC y AN Integral N°51). Australia: J.P. Morgan Securities Australia Limited (“JPMSAL”) (ABN 61 003 245 234/AFS Licence No: 238066) is regulated by the Australian Securities and Investments Commission and is a Market Participant of ASX Limited, a Clearing and Settlement Participant of ASX Clear Pty Limited and a Clearing Participant of ASX Clear (Futures) Pty Limited. This material is issued and distributed in Australia by or on behalf of JPMSAL only to "wholesale clients" (as defined in section 761G of the Corporations Act 2001). A list of all financial products covered can be found by visiting https://www.jpmm.com/research/disclosures. J.P. Morgan seeks to cover companies of relevance to the domestic and international investor base across all Global Industry Classification Standard (GICS) sectors, as well as across a range of market capitalisation sizes. If applicable, in the course of conducting public side due diligence on the subject company(ies), the Research Analyst team may at times perform such diligence through corporate engagements such as site visits, discussions with company representatives, management presentations, etc. Research issued by JPMSAL has been prepared in accordance with J.P. Morgan Australia’s Research Independence Policy which can be found at the following link: J.P. Morgan Australia - Research Independence Policy. Brazil : Banco J.P. Morgan S.A. is regulated by the Comissao de Valores Mobiliarios (CVM) and by the Central Bank of Brazil. Ombudsman J.P. Morgan: 0800-7700847 / 0800-7700810 (For Hearing Impaired) / ouvidoria.jp.morgan@jpmorgan.com. Canada : J.P. Morgan Securities Canada Inc. is a registered investment dealer, regulated by the Canadian Investment Regulatory Organization and the Ontario Securities Commission and is the participating member on Canadian exchanges. This material is distributed in Canada by or on behalf of J.P.Morgan Securities Canada Inc. Chile: Inversiones J.P. Morgan Limitada is an unregulated entity incorporated in Chile. China: J.P. Morgan Securities (China) Company Limited has been approved by CSRC to conduct the securities investment consultancy business. Dubai International Financial Centre (DIFC) : JPMorgan Chase Bank, N.A., Dubai Branch is regulated by the Dubai Financial Services Authority (DFSA) and its registered address is Dubai International Financial Centre - The Gate, West Wing, Level 3 and 9 PO Box 506551, Dubai, UAE. This material has been distributed by JP Morgan Chase Bank, N.A., Dubai Branch to persons regarded as professional clients or market counterparties as defined under the DFSA rules. European Economic Area (EEA): Unless specified to the contrary, research is distributed in the EEA by J.P. Morgan SE (“JPM SE”), which is authorised as a credit institution by the Federal Financial Supervisory Authority (Bundesanstalt für Finanzdienstleistungsaufsicht, BaFin) and jointly supervised by the BaFin, the German Central Bank (Deutsche Bundesbank) and the European Central Bank (ECB). JPM SE is a company headquartered in Frankfurt with registered address at TaunusTurm, Taunustor 1, Frankfurt am Main, 60310, Germany. The material has been distributed in the EEA to persons regarded as professional investors (or equivalent) pursuant to Art. 4 para. 1 no. 10 and Annex II of MiFID II and its respective implementation in their home jurisdictions (“EEA professional investors”). This material must not be acted on or relied on by persons who are not EEA professional investors. Any investment or investment activity to which this material relates is only available to EEA relevant persons and will be engaged in only with EEA relevant persons. Hong Kong : J.P. Morgan Securities (Asia Pacific) Limited (CE number AAJ321) is regulated by the Hong Kong Monetary Authority and the Securities and Futures Commission in Hong Kong, and J.P. Morgan Broking (Hong Kong) Limited (CE number AAB027) is regulated by the Securities and Futures Commission in Hong Kong. JP Morgan Chase Bank, N.A., Hong Kong Branch (CE Number AAL996) is regulated by the Hong Kong Monetary Authority and the Securities and Futures Commission, is organized under the laws of the United States with limited liability. Where the distribution of this material is a regulated activity in Hong Kong, the material is distributed in Hong Kong by or through J.P. Morgan Securities (Asia Pacific) Limited and/or J.P. Morgan Broking (Hong Kong) Limited. India : J.P. Morgan India Private Limited (Corporate Identity Number - U67120MH1992FTC068724), having its registered office at J.P. Morgan Tower, Off. C.S.T. Road, Kalina, Santacruz - East, Mumbai – 400098, is registered with the Securities and Exchange Board of India (SEBI) as a ‘Research Analyst’ having registration number INH000001873. J.P. Morgan India Private Limited is also registered with SEBI as a member of the National Stock Exchange of India Limited and the Bombay Stock Exchange Limited (SEBI Registration Number – INZ000239730) and as a Merchant Banker (SEBI Registration Number - MB/INM000002970). Telephone: 91-22-6157 3000, Facsimile: 91-22-6157 3990 and Website: http://www.jpmipl.com. JPMorgan Chase Bank, N.A. - Mumbai Branch is licensed by the Reserve Bank of India (RBI) (Licence No. 53/ Licence No. BY.4/94; SEBI - IN/CUS/014/ CDSL : IN-DP-CDSL-444-2008/ IN-DP-NSDL-285-2008/ INBI00000984/ INE231311239) as a Scheduled Commercial Bank in India, which is its primary license allowing it to carry on Banking business in India and other activities, which a Bank branch in India are permitted to undertake. For non-local research material, this material is not distributed in India by J.P. Morgan India Private Limited. Compliance Officer: Spurthi Gadamsetty; spurthi.gadamsetty@jpmchase.com; +912261573225. Grievance Officer: Ramprasadh K, jpmipl.research.feedback@jpmorgan.com; +912261573000.

Investment in securities market are subject to market risks. Read all the related documents carefully before investing. Registration granted by SEBI and certification from NISM in no way guarantee performance of the intermediary or provide any assurance of returns to investors.

Indonesia : PT J.P. Morgan Sekuritas Indonesia is a member of the Indonesia Stock Exchange and is registered and supervised by the Otoritas Jasa Keuangan (OJK). Korea : J.P. Morgan Securities (Far East) Limited, Seoul Branch, is a member of the Korea Exchange (KRX). JPMorgan Chase Bank, N.A., Seoul Branch, is licensed as a branch office of foreign bank (JPMorgan Chase Bank, N.A.) in Korea. Both entities are regulated by the Financial Services Commission (FSC) and the Financial Supervisory Service (FSS). For non-macro research material, the material is distributed in Korea by or through J.P. Morgan Securities (Far East) Limited, Seoul Branch. Japan : JPMorgan Securities Japan Co., Ltd. and JPMorgan Chase Bank, N.A., Tokyo Branch are regulated by the Financial Services Agency in Japan. Malaysia : This material is issued and distributed in Malaysia by JPMorgan Securities (Malaysia) Sdn Bhd (18146-X), which is a Participating Organization of Bursa Malaysia Berhad and holds a Capital Markets Services License issued by the Securities Commission in Malaysia. Mexico : J.P. Morgan Casa de Bolsa, S.A. de C.V. and J.P. Morgan Grupo Financiero are members of the Mexican Stock Exchange and are authorized to act as a broker dealer by the National Banking and Securities Exchange Commission. New Zealand : This material is issued and distributed by JPMSAL in New Zealand only to "wholesale clients" (as defined in the Financial Markets Conduct Act 2013). JPMSAL is registered as a Financial Service Provider under the Financial Service providers (Registration and Dispute Resolution) Act of 2008. Philippines : J.P. Morgan Securities Philippines Inc. is a Trading Participant of the Philippine Stock Exchange and a member of the Securities Clearing Corporation of the Philippines and the Securities Investor Protection Fund. It is regulated by the Securities and Exchange Commission. Singapore : This material is issued and distributed in Singapore by or through J.P. Morgan Securities Singapore Private Limited (JPMSS) [MCI (P) 030/08/2023 and Co. Reg. No.: 199405335R], which is a member of the Singapore Exchange Securities Trading Limited, and/or JPMorgan Chase Bank, N.A., Singapore branch (JPMCB Singapore), both of which are regulated by the Monetary Authority of Singapore. This material is issued and distributed in Singapore only to accredited investors, expert investors and institutional investors, as defined in Section 4A of the Securities and Futures Act, Cap. 289 (SFA). This material is not intended to be issued or distributed to any retail investors or any other investors that do not fall into the classes of “accredited investors,” “expert investors” or “institutional investors,” as defined under Section 4A of the SFA. Recipients of this material in Singapore are to contact JPMSS or JPMCB Singapore in respect of any matters arising from, or in connection with, the material. South Africa : J.P. Morgan Equities South Africa Proprietary Limited and JPMorgan Chase Bank, N.A., Johannesburg Branch are members of the Johannesburg Securities Exchange and are regulated by the Financial Services Conduct Authority (FSCA). Taiwan : J.P. Morgan Securities (Taiwan) Limited is a participant of the Taiwan Stock Exchange (company-type) and regulated by the Taiwan Securities and Futures Bureau. Material relating to equity securities is issued and distributed in Taiwan by J.P. Morgan Securities (Taiwan) Limited, subject to the license scope and the applicable laws and the regulations in Taiwan. According to Paragraph 2, Article 7-1 of Operational Regulations Governing Securities Firms Recommending Trades in Securities to Customers (as amended or supplemented) and/or other applicable laws or regulations, please note that the recipient of this material is not permitted to engage in any activities in connection with the material that may give rise to conflicts of interests, unless otherwise disclosed in the “Important Disclosures” in this material. Thailand : This material is issued and distributed in Thailand by JPMorgan Securities (Thailand) Ltd., which is a member of the Stock Exchange of Thailand and is regulated by the Ministry of Finance and the Securities and Exchange Commission, and its registered address is 3rd Floor, 20 North Sathorn Road, Silom, Bangrak, Bangkok 10500. UK: Unless specified to the contrary, research is distributed in the UK by J.P. Morgan Securities plc (“JPMS plc”) which is a member of the London Stock Exchange and is authorised by the Prudential Regulation Authority and regulated by the Financial Conduct Authority and the Prudential Regulation Authority. JPMS plc is registered in England & Wales No. 2711006, Registered Office 25 Bank Street, London, E14 5JP. This material is directed in the UK only to: (a) persons having professional experience in matters relating to investments falling within article 19(5) of the Financial Services and Markets Act 2000 (Financial Promotion) (Order) 2005 (“the FPO”); (b) persons outlined in article 49 of the FPO (high net worth companies, unincorporated associations or partnerships, the trustees of high value trusts, etc.); or (c) any persons to whom this communication may otherwise lawfully be made; all such persons being referred to as "UK relevant persons". This material must not be acted on or relied on by persons who are not UK relevant persons. Any investment or investment activity to which this material relates is only available to UK relevant persons and will be engaged in only with UK relevant persons. Research issued by JPMS plc has been prepared in accordance with JPMS plc's policy for prevention and avoidance of conflicts of interest related to the production of Research which can be found at the following link: J.P. Morgan EMEA - Research Independence Policy. U.S .: J.P. Morgan Securities LLC (“JPMS”) is a member of the NYSE, FINRA, SIPC, and the NFA. JPMorgan Chase Bank, N.A. is a member of the FDIC. Material published by non-U.S. affiliates is distributed in the U.S. by JPMS who accepts responsibility for its content.

General: Additional information is available upon request. The information in this material has been obtained from sources believed to be reliable. While all reasonable care has been taken to ensure that the facts stated in this material are accurate and that the forecasts, opinions and expectations contained herein are fair and reasonable, JPMorgan Chase & Co. or its affiliates and/or subsidiaries (collectively J.P. Morgan) make no representations or warranties whatsoever to the completeness or accuracy of the material provided, except with respect to any disclosures relative to J.P. Morgan and the Research Analyst's involvement with the issuer that is the subject of the material. Accordingly, no reliance should be placed on the accuracy, fairness or completeness of the information contained in this material. There may be certain discrepancies with data and/or limited content in this material as a result of calculations, adjustments, translations to different languages, and/or local regulatory restrictions, as applicable. These discrepancies should not impact the overall investment analysis, views and/or recommendations of the subject company(ies) that may be discussed in the material. J.P. Morgan accepts no liability whatsoever for any loss arising from any use of this material or its contents, and neither J.P. Morgan nor any of its respective directors, officers or employees, shall be in any way responsible for the contents hereof, apart from the liabilities and responsibilities that may be imposed on them by the relevant regulatory authority in the jurisdiction in question, or the regulatory regime thereunder. Opinions, forecasts or projections contained in this material represent J.P. Morgan's current opinions or judgment as of the date of the material only and are therefore subject to change without notice. Periodic updates may be provided on companies/industries based on company-specific developments or announcements, market conditions or any other publicly available information. There can be no assurance that future results or events will be consistent with any such opinions, forecasts or projections, which represent only one possible outcome. Furthermore, such opinions, forecasts or projections are subject to certain risks, uncertainties and assumptions that have not been verified, and future actual results or events could differ materially. The value of, or income from, any investments referred to in this material may fluctuate and/or be affected by changes in exchange rates. All pricing is indicative as of the close of market for the securities discussed, unless otherwise stated. Past performance is not indicative of future results. Accordingly, investors may receive back less than originally invested. This material is not intended as an offer or solicitation for the purchase or sale of any financial instrument. The opinions and recommendations herein do not take into account individual client circumstances, objectives, or needs and are not intended as recommendations of particular securities, financial instruments or strategies to particular clients. This material may include views on structured securities, options, futures and other derivatives. These are complex instruments, may involve a high degree of risk and may be appropriate investments only for sophisticated investors who are capable of understanding and assuming the risks involved. The recipients of this material must make their own independent decisions regarding any securities or financial instruments mentioned herein and should seek advice from such independent financial, legal, tax or other adviser as they deem necessary. J.P. Morgan may trade as a principal on the basis of the Research Analysts’ views and research, and it may also engage in transactions for its own account or for its clients’ accounts in a manner inconsistent with the views taken in this material, and J.P. Morgan is under no obligation to ensure that such other communication is brought to the attention of any recipient of this material. Others within J.P. Morgan, including Strategists, Sales staff and other Research Analysts, may take views that are inconsistent with those taken in this material. Employees of J.P. Morgan not involved in the preparation of this material may have investments in the securities (or derivatives of such securities) mentioned in this material and may trade them in ways different from those discussed in this material. This material is not an advertisement for or marketing of any issuer, its products or services, or its securities in any jurisdiction.

Confidentiality and Security Notice : This transmission may contain information that is privileged, confidential, legally privileged, and/or exempt from disclosure under applicable law. If you are not the intended recipient, you are hereby notified that any disclosure, copying, distribution, or use of the information contained herein (including any reliance thereon) is STRICTLY PROHIBITED. Although this transmission and any attachments are believed to be free of any virus or other defect that might affect any computer system into which it is received and opened, it is the responsibility of the recipient to ensure that it is virus free and no responsibility is accepted by JPMorgan Chase & Co., its subsidiaries and affiliates, as applicable, for any loss or damage arising in any way from its use. If you received this transmission in error, please immediately contact the sender and destroy the material in its entirety, whether in electronic or hard copy format. This message is subject to electronic monitoring: https://www.jpmorgan.com/disclosures/email

MSCI: Certain information herein (“Information”) is reproduced by permission of MSCI Inc., its affiliates and information providers (“MSCI”) ©2024. No reproduction or dissemination of the Information is permitted without an appropriate license. MSCI MAKES NO EXPRESS OR IMPLIED WARRANTIES (INCLUDING MERCHANTABILITY OR FITNESS) AS TO THE INFORMATION AND DISCLAIMS ALL LIABILITY TO THE EXTENT PERMITTED BY LAW. No Information constitutes investment advice, except for any applicable Information from MSCI ESG Research. Subject also to msci.com/disclaimer

Sustainalytics: Certain information, data, analyses and opinions contained herein are reproduced by permission of Sustainalytics and: (1) includes the proprietary information of Sustainalytics; (2) may not be copied or redistributed except as specifically authorized; (3) do not constitute investment advice nor an endorsement of any product or project; (4) are provided solely for informational purposes; and (5) are not warranted to be complete, accurate or timely. Sustainalytics is not responsible for any trading decisions, damages or other losses related to it or its use. The use of the data is subject to conditions available at https://www.sustainalytics.com/legal-disclaimers. ©2024 Sustainalytics. All Rights Reserved.

"Other Disclosures" last revised April 06, 2024.

Copyright 2024 JPMorgan Chase & Co. All rights reserved. This material or any portion hereof may not be reprinted, sold or redistributed without the written consent of J.P. Morgan. It is strictly prohibited to use or share without prior written consent from J.P. Morgan any research material received from J.P. Morgan or an authorized third-party (“J.P. Morgan Data”) in any third-party artificial intelligence (“AI”) systems or models when such J.P. Morgan Data is accessible by a third-party. It is permissible to use J.P. Morgan Data for internal business purposes only in an AI system or model that protects the confidentiality of J.P. Morgan Data so as to prevent any and all access to or use of such J.P. Morgan Data by any third-party. #$J&098$#*P

Completed 13 May 2024 12:38 PM EDTDisseminated 13 May 2024 12:41 PM EDT