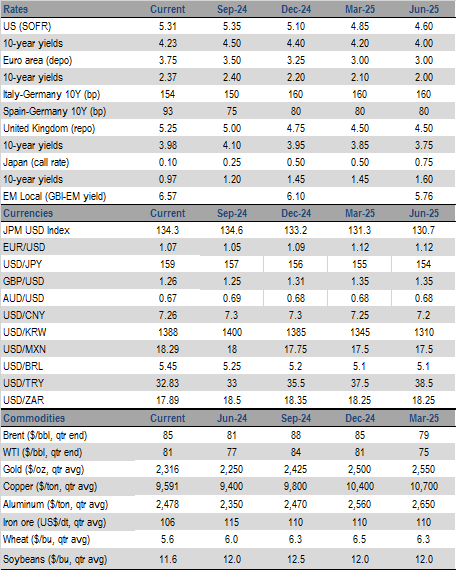
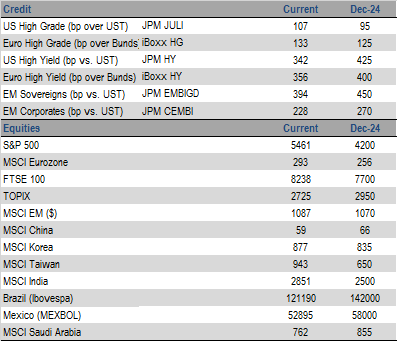
Cross-Asset Strategy: Bonds sold off modestly over the past week amid somewhat softer economic data, as the previous flight-to-quality flow was partially unwound. US yields remain close to the lower end of their recent ranges and valuations in 5Y remain rich, so we keep tactical shorts in 5Y USTs. Euro area spreads have stabilized over the past week after the previous widening when the snap French election was called. We retain a bullish bias on duration and would look to add longs if 5-10Y German yields rise closer to 2.6%. The BoE kept rates on hold as expected, though the minutes had a dovish tilt in tone; we continue to expect a 25bp cut at the Aug and Nov meetings. In China, some additional scope for PBoC easing support keeps us bullish duration. In Credit, we raise our US HG YE spread forecast to 110bps, as slower GDP growth in 2H24 could lead to a continuation of the recent trend of declining yields, which is a negative for spreads. Leveraged loan credit metrics are showing signs of stabilizing, but a large gap exists between public and private company balance sheets. In FX, we believe the dollar smile still exists but with caveats, that it will be narrow and that the composition of USD strength will be different on either ends of the smile. We believe the recent pullback in commodities is just that—a pullback—and we continue to see a 10% appreciation in the broader BCOM Commodities index by year-end. The fundamental backdrop for Eurozone equities is improving, but political uncertainty needs to lift to see sustained outperformance.
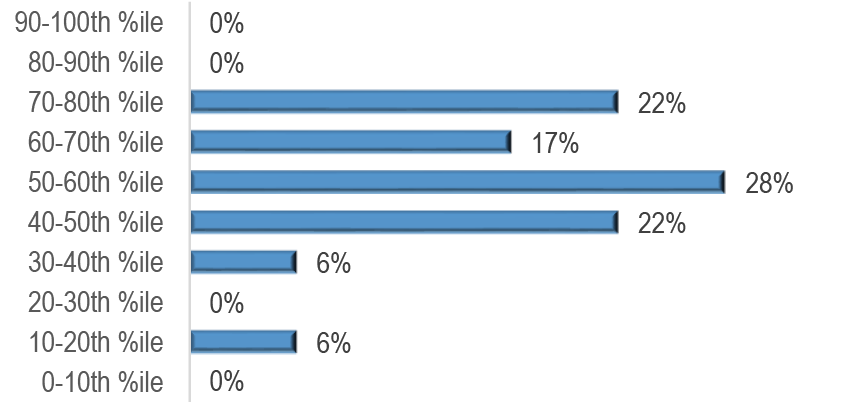
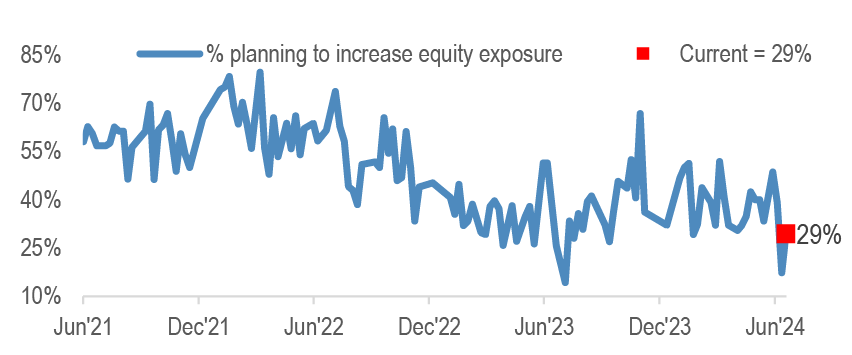
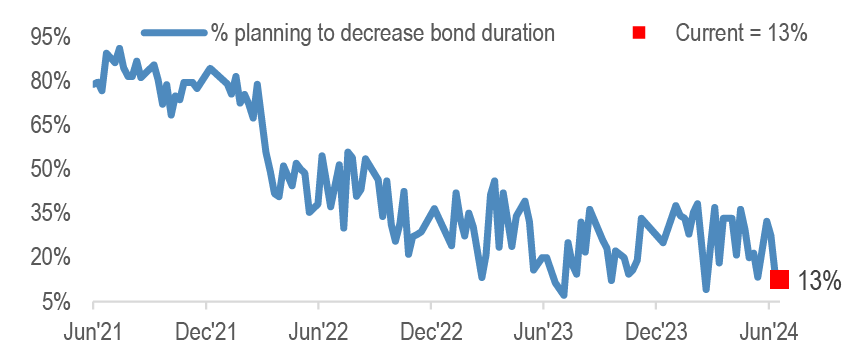
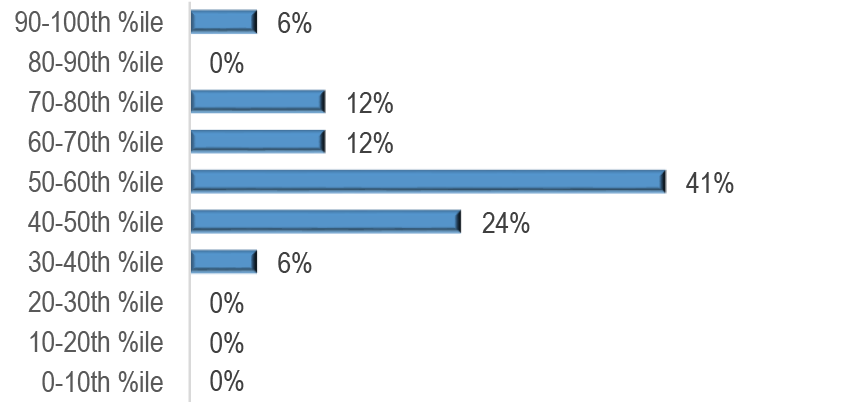
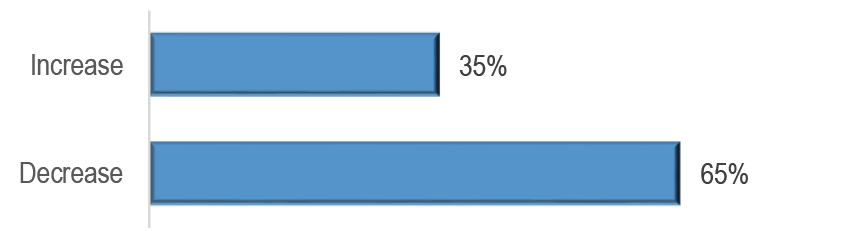
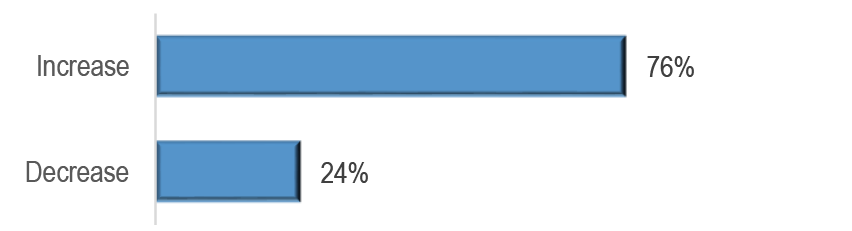
JPM Clients’ View: Click here to take this week’s survey. This week we poll investors on the cycle, labor markets, NVDA and French elections, in addition to our running sentiment questions. Our last survey results indicated: (1) average equity exposure/sentiment is ~56th percentile; (2) 29% planned to increase equity exposure, and 87% to increase bond duration near term; (3) 76% believe the French elections have systemic implications; (4) more believe a large UK election majority would be positive (44%) than negative (31%) for UK assets; (5) 59% expect the first Fed cut in Nov or Dec; (6) most (76%) believe the May CPI print was the start of a weaker trend.
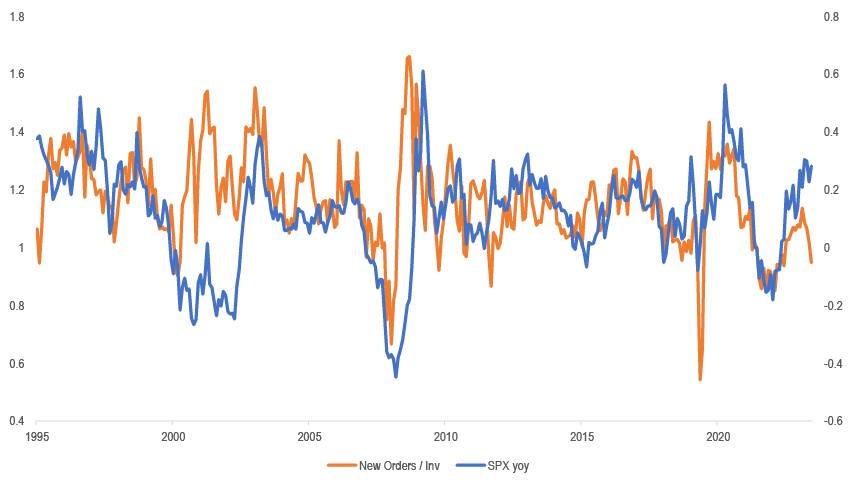
Stock disconnects grow: Two consecutive soft CPI prints point toward a soft landing, yet a number of indicators suggest elevated market and growth risks, including the disconnect between market returns and manufacturing new orders/inventories, narrow market breadth, rising jobless claims and unemployment rates, and falling housing starts.
Upcoming catalysts: US cons. conf. (6/25); Mortgage applications, new home sales (6/26); US Presidential debate, US GDP/jobless claims/durable goods, Japan CPI (6/27); US PCE, Chicago PMI, U.Mich sentiment (6/28).
Cross-Asset Strategy
Economics
After a strong 1H24, softer data is still consistent with 2H24 moderation. A key call in our global outlook for this year has been that the expansion would gradually slow under the pressure of sticky inflation that kept financial conditions tight. In the event, inflation has proven even stickier than we had expected, leading to a significant delay in the anticipated easing cycles of central banks. The latest data have been mixed, but are challenging what earlier this quarter had looked like a broadening in the global expansion. We remain confident, however, that the global consumer will perk back up given healthy fundamentals.
Fiscal drags to temper EMU recovery, smoothing way to ECB cuts. The decline in the Euro area flash June PMI raises some concern that the nascent rebound is being cut short. The abruptness of the drop is notable against the backdrop of the French election, and a large decline in Germany is a reminder that structural headwinds remain. Fiscal drags are reinforcing this cautious outlook. The European Commission has proposed putting five EMU countries into excessive deficit procedures (EDP), including France and Italy. This requires them to improve their primary structural deficits by 0.5% per year. The sluggishness of Euro area growth should smooth the path for ECB cuts later this year, which is being pressured by elevated price and wage inflation.
China data mixed but on net soft, tracking weak 3.5%ar 2Q growth. IP disappointed with a modest gain, while consumers perked up a bit. Industrial policy supports continue to fuel gains in manufacturing fixed asset investment, but the housing sector remains a large drag. The PBOC’s caution in easing monetary policy (we now look for just one 10bp policy rate cut this year) keeps pressure on fiscal policy to deliver our forecast of trend-like growth in 2H24. The risk is that, with real estate drags continuing and private sector investment growth lackluster, policies narrowly geared toward strategic industries and credit will be insufficient for growth.
Equities
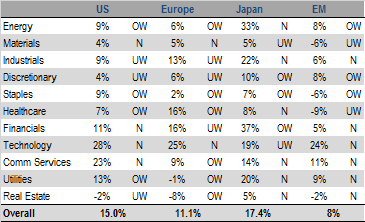
When will Eurozone equities be able to move on? The fundamental backdrop is continuing to track better in the Euro area vs the US this year, with Eurozone CESI above the US, ECB already easing, and valuations cheap. Having said that, current uncertainty still needs to lift and Eurozone equities are not showing oversold extremes. The key will be any improving visibility with respect to the political backdrop. Here, we do not see the current French risks as a game changer for the region. Put together, we think that, as we move through 2H, there is likely to be a good entry point to go OW Eurozone vs the US (Equity Strategy, Jun 23rd).
1Q24 US reporting saw 76% of companies beat earnings estimates (vs. 73% avg last 4Qs) and 60% beat revenue estimates (vs. 64%). S&P 500 companies surprised on net income by 3.4% (vs. 4.6% last 4Qs), though ~6% if adjusted for one-time charges at BMY. Much of the earnings surprise was concentrated in Mag7 vs. remaining S&P 493 (9.9% vs. 1.6%). Unsurprisingly, with the market near all-time highs, earnings beats were not as rewarded and misses were treated poorly by investors (US Equity Strategy, Jun 21st).
A new reform proposal for TOPIX calls for raising the minimum market cap threshold, with the aim of downsizing it from 2,164 stocks at present to 1,200 by Oct’28. We expect the change to have little impact on coverage, share-price performance, ROE, or P/B (Japan Equity Strategy, Jun 21st).
Buyback activity in EM has gained momentum in 2024 in the aftermath of market reforms in China and Korea. However, the likely uptick in EM buyback activity will still likely be dwarfed by US as Dividend yield remains a preferred tool of shareholder returns across EM (EM Lighthouse, Jun 21st).
China consumer names retreated on mixed consumption data; we advise using this pullback to add exposure to domestic demand vs. exports. Investors we have spoken with lately are generally cautious on consumption, while China May retail sales beat consensus and the unemployment rate was down 0.2% y/y (China Equity Data Tracker, Jun 21).
We upgraded South Africa from UW to OW in CEEMEA. We believe this is the best-case scenario for SA politics - the DA’s active participation in a Government of National Unity (GNU) - and SA stocks should rally further, like in the Ramaphoria rally of Dec ‘17-Feb ‘18 (Upgrade SA to OW, Jun 17).
Bonds
Bonds sold off modestly over the past week amid somewhat softer economic data, as the previous flight-to-quality flow was partially unwound. In the US, yields remain close to the lower end of their recent ranges and valuations in 5Y remain rich relative to 2Y and 10Y. We keep tactical shorts in 5Y USTs, though with somewhat reduced conviction given the expected strength in May retail sales data did not materialize and event risk from the first round of the French election on Jun 30th is approaching. We also keep 5s/30s steepeners.
In the Euro area, spreads have stabilized over the past week after the previous widening after the snap French election was called. We retain a bullish bias on duration and would look to add longs if 5-10Y German yields rise closer to 2.6%. We hold 5s/10s Germany and 2Yx2Y/10Yx10Y EUR swaps steepeners. In the UK, the BoE kept rates on hold as expected with a 7-2 vote, though the minutes had a dovish tilt in tone. We continue to expect a 25bp cut at the Aug and Nov meetings, and have a bias for a flatter Aug/Nov24 MPC OIS curve. We hold tactical 10s/30s flatteners.
In EM, some of the political uncertainty in South Africa has faded after a Government of National Unity was agreed, but we are reluctant to chase the rally and stay neutral, though shift to a bullish bias. In China, some additional scope for PBoC easing support keeps us bullish duration, but only on a currency-hedged basis. Overall, we remain Nduration overall, with OWs Poland, Türkiye and Uruguay offset by a short duration overlay and an UW in Thailand.
Credit
Revising our US HG YE 2024 spread forecast to 110bps (from 95bp previously). W e expect slower GDP growth in 2H24, which could lead to a continuation of the recent trend of declining yields, a negative for spreads. Also, global rates dynamics have made US credit less attractive to overseas investors, and domestic fund inflows have slowed in line with middling YTD total return. Election uncertainty and Fed uncertainty could increase volatility, generally a market negative. That said, we believe spreads can stay tight with still strong technicals driven by high yields, a slowdown in supply, an expected improvement in corporate earnings and the start of Fed policy easing in 2H24 ( US High Grade Credit 2024 Mid-Year Outlook , Jun 24th).
Leveraged loan credit metrics are showing signs of stabilizing, but a large gap exists between public and private company balance sheets. Notably, last quarter we saw a decline in leverage for the 11th time over the last 12 qtrs, but a gap between public (4.5x) and private companies (5.7x); revenues and EBITDA expanded at the 3rd slowest and slowest rates over the last 3Y, respectively; interest expense decreased q/q; and interest coverage rose slightly overall but public coverage ratios are more than twice that for private companies 1Q24 Leveraged Loan Credit Fundamentals, Jun 18th).
European credit markets broadly stabilized last week, with IG and HY 1bp and 10bp tighter, respectively. The preference in our conversations with clients so far has been for French international corporates with significant overseas revenue over purely domestic issuers. We have been recommending to buy ‘dislocations’, such as Italian bank AT1 and to a lesser extent short-call hybrids, although these have already partially retraced. In terms of valuations, French HG issuers only trade marginally wide to broader credit indices after the recent moves (European Credit Weekly, Jun 21st).
The investment opportunities from the data center dynamic should last for years. Many of these names and securities should benefit from these underlying dynamics even through the vicissitudes of the normal credit market cycle. We like them now, and will probably like them even more down the road. Even through our skeptical lens and under what we think are realistic assumptions, there is an enormous amount of growth in the data center universe over the medium term with structural implications across sectors and asset classes (US Credit Research, Jun 17th).
Currencies
Does the dollar smile still exist? USD has strengthened in periods of both US growth exceptionalism and moderation in 2024, leading some to question if the dollar smile still even exists. Our answer is YES, but with caveats, that it will be narrow and that the composition of USD strength will be different on either ends of the smile. On one end, US exceptionalism like in 1Q will weigh on funders while a shift to the defensive part of the smile will weigh more on high yielders. The valley, though narrow, is best played through the mid-yielders (Scandis, AUD in G10).
Trade Recommendations: Initiated short EUR/NOK, long NOK/SEK & long AUD/NZD last week. Rotate AUD vs JPY & CHF basket into long AUD/JPY cash. Keep USD longs vs EUR & CNH in options. Stay MW EM FX into H2 due to macro and US election risks (FXMW, Jun 21st).
Commodities
We believe the recent pullback in commodities is just that—a pullback—and we continue to see a 10% appreciation in the broader BCOM Commodities index by year-end. Given the latest sell-off, agricultural commodities like sugar and wheat move to the top of our list of preferred longs. Brent oil is back on the long trade list with an unchanged target of $90 by September. We remain structurally bullish on gold and silver and see the ongoing consolidation as a buying opportunity. We expected a price correction in copper and feel current levels present a good re-entry point. Lastly, after rallying ~12%, US HH natural gas moves to the bottom of the list for now (Got Commodities this summer?, Jun 20th).
Global oil demand expanded by 1.4 mbd over year ago levels. US gasoline demand has been on a steady rise since Memorial Day and we expect a further advance as a record 71 Mn Americans are expected to travel during the upcoming July 4th holiday (Oil Demand & Inventory Tracker, Jun 20th).
Hot weather expected to push June to the warmest on record since 1950 will likely raise total natural gas power burn to ~41 Bcf/day, the highest ever level for June. We hold our bullish price call for 2024 in place, and revise our 2025 price forecast lower (Power burn perseveres in the face of wind, Jun 21st).
This week, we poll investors on the cycle, labor markets, NVDA and French elections, in addition to our running survey questions on equity positioning/sentiment, and intentions for near-term changes to equity allocation and bond duration. The results from the last survey are shown below.1
Figure 1: What is your current equity positioning or sentiment in historical terms, expressed from most bearish (0th percentile) to most bullish (100th percentile)?
Source: J.P.Morgan
Figure 2: Are you more likely to increase or decrease equity exposure over the coming days/weeks?
Source: J.P. Morgan.
Figure 3: Are you more likely to increase or decrease bond portfolio duration over the coming days/weeks?
Source: J.P. Morgan.
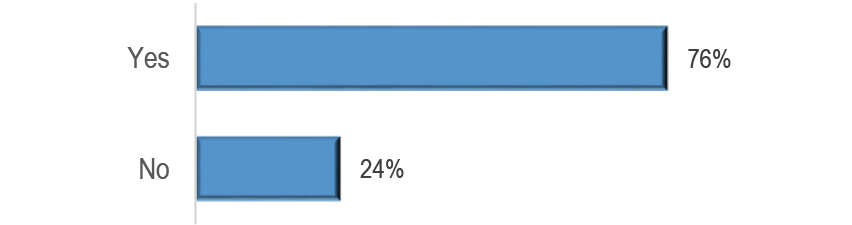
Figure 4: Do the French elections have systemic implications for the broader Eurozone?
Source: J.P. Morgan.
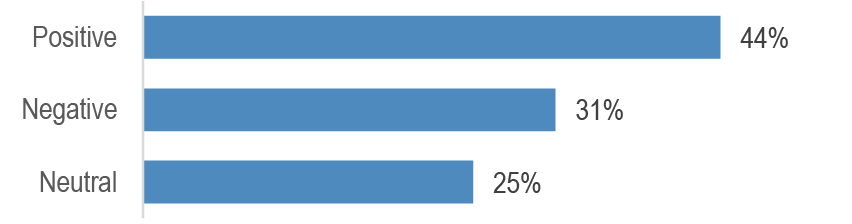
Figure 5: Would a large majority win in the UK elections be positive or negative for UK assets?
Source: J.P. Morgan.
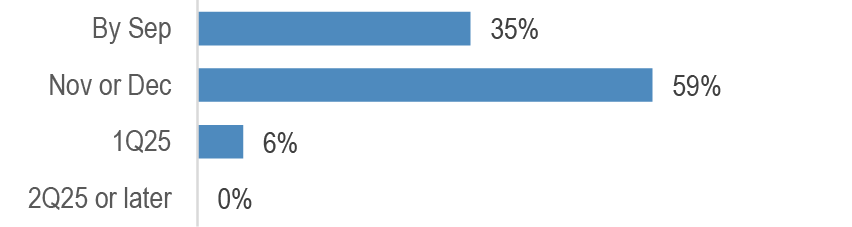
Figure 6: Following last week’s CPI data and FOMC, what’s your current expectation for when the Fed will first cut rates?
Source: J.P. Morgan.
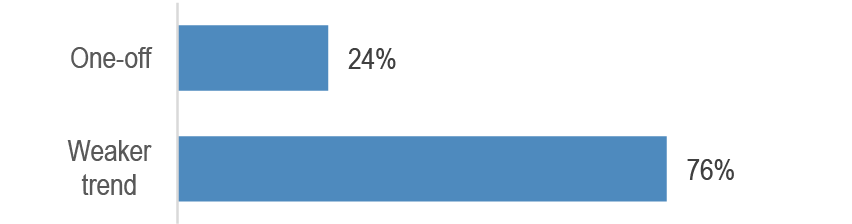
Figure 7: Do you believe the weakness in US May CPI and PPI was a one-off or the start of a weaker trend?
Source: J.P. Morgan.
JPM Clients’ View - This Week’s Interim Survey Results
The charts below show interim results from this week’s survey, collected over the first ~24 hours it was live. The survey remains open here, and we will show updated results in the next J.P. Morgan View publication
Figure 8: What is your current equity positioning or sentiment in historical terms, expressed from most bearish (0th percentile) to most bullish (100th percentile)?
Source: J.P.Morgan
Figure 9: Are you more likely to increase or decrease equity exposure over the coming days/weeks?
Source: J.P. Morgan.
Figure 10: Are you more likely to increase or decrease bond portfolio duration over the coming days/weeks?
Source: J.P. Morgan.
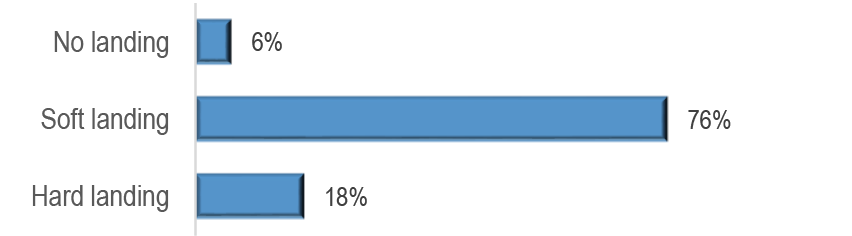
Figure 11: Which of the following outcomes do you believe is most likely over the next 12-18 months?
Source: J.P. Morgan.
Figure 12: Are jobless claims signaling a material weakening in US labor markets is coming?
Source: J.P. Morgan.
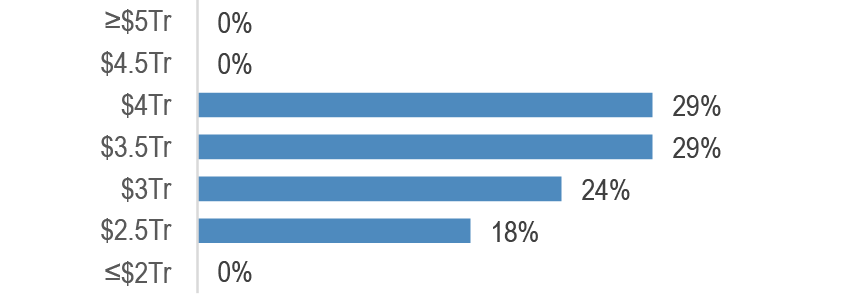
Figure 13: Where do you see Nvidia’s market capitalization at year-end? (current = $3.1Tr)
Source: J.P. Morgan.
Figure 14: Is a National Rally party win in the upcoming French elections priced in by markets?
Source: J.P. Morgan.
Stock disconnects grow
With regard to the French election, Polls still suggest a relative, rather than absolute, majority for Le Pen’s party is most likely, leading to a probable cohabitation. However, a larger turnout can favor Le Pen as it increases the likelihood of having the three main candidates (left alliance, Macron and Le Pen candidates) going through to the second round in more constituencies, as contestants qualify if they receive votes representing more than 12.5% of the people on the electoral register. If only two candidates qualify for the second-round, the third candidate in some cases may call to vote against Le Pen. If three candidates qualify for the second round, the vote is split and national polls suggest that Le Pen has a significant lead. The platform for Le Pen’s National Rally included a proposal for VAT reduction on gas and fuels and lower electricity prices. The party seems to have put aside many reforms that would heavily weigh on public finances, and our sense is that fiscal slippage would be likely compared to the 0.5% structural deficit tightening required by the EC. Unlike in 2017, Le Pen is no longer calling for ‘Frexit’, making this more of a French idiosyncratic issue and not producing contagion for Euro sovereign spreads. Relating this to rates markets, we expect uncertainty to persist into the election, warranting a cautious short-term stance on French spreads. The recent widening in non-France sovereign spreads makes an attractive entry point for long-term investors who are willing to see through some volatility in the near-term. For Euro duration positioning, we would consider adding outright longs if 5-10Y Germany moves closer to 2.60%.
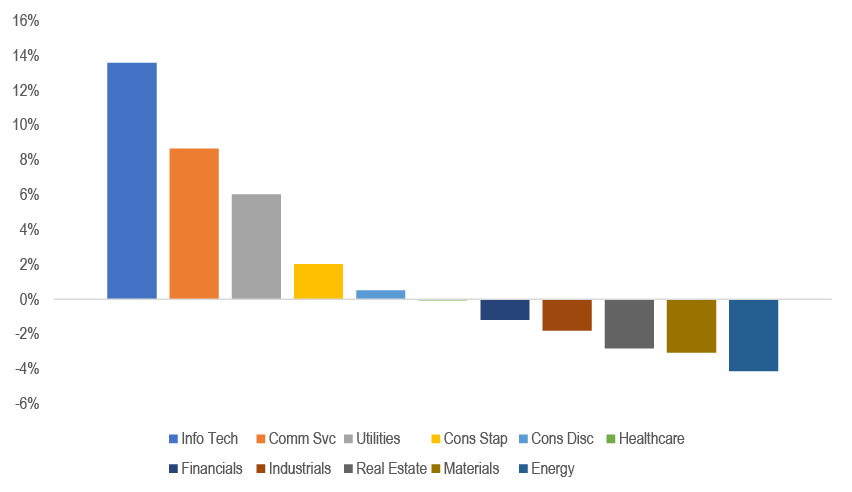
For US equities, it is useful to look at equity sectors to see what’s the opinion expressed on the business cycle by their relative performance ( Figure 16). As of the current quarter, the top performers are Info Tech and Communication Services, so this return suggests that the dominant opinion is of an economy that is slowing but not breaking. Defensives such as Staples and Utilities are positive but a distant second, suggesting there is some portion of the market worries about growth risk, although the small uptick in defensive leadership is a far cry from the signal this flashed ahead of Dotcom and GFC. Finally, in last place and negative are cyclical value sectors, which is to be expected in a slowing economy. One example of the disconnect between buoyant stocks and the slowing economy would be the gap between S&P 500 yoy returns at highs and the ISM Manufacturing New Orders / Inventories ratio ( Figure 18).
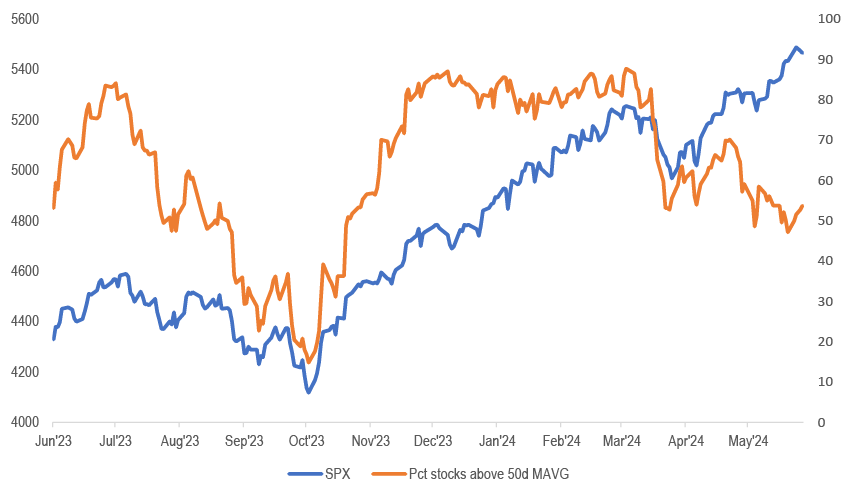
With NVDA recently becoming the world’s largest company by market cap but then coming off all-time highs in the last few days, it’s worth revisiting the topic of market concentration, given this one stock now exceeds the value of all listed stocks in Germany, France, and the UK respectively. We have described leadership as narrow, given the large proportion of the returns and earnings growth that comes from the Mag7. We’ve highlighted many times that ex-Mag7, earnings growth y/y has been negative for 5 quarters. For bulls, the response has been to point out that market breadth as defined by various moving averages was ~80%, indicative of a well-participated rally. Acknowledging this, our interpretation was that the equal weight was getting dragged up by Mag7 euphoria, and not the case that equal-weight was ever taking the reins. Now, this cap-weight vs equal weight has worsened, with equal-weight flat-lining as cap-weight has continued to rally in recent months. From a market breadth perspective, we can see this in market breadth proxied by percent of stocks above the 50d moving average going from ~90% earlier in the year to ~50% ( Figure 17). Rising markets on narrowing breadth has historically been an ominous sign.
Even as two mild CPI prints in a row were supposed to put things firmly in soft landing territory, some volatility in the initial jobless claims raises our antennas on growth risk. Initial claims declined 5k to 238k, partially reversing the uptick in the previous two weeks of 13k and 8k. Allowing for the issues of holidays and school breaks, the 4w moving average has been trending slowly higher since the end of April, up by around 22k, providing further evidence of a gradually softening labor market. As for the rate cutting cycle, cutting rates due to growth risk saw negative stock returns as per Dotcom and GFC, while the rate-cutting of the mid-1990’s saw positive stock returns. Our recent study on market regimes showed that the current period showed some similarities to other late cycle periods as well as the mid-1990’s. However, the key differentiators were that the yield curve did not invert in the 1994 hiking cycle, and 1995 saw strong performance in cyclical value, which has been underperforming.
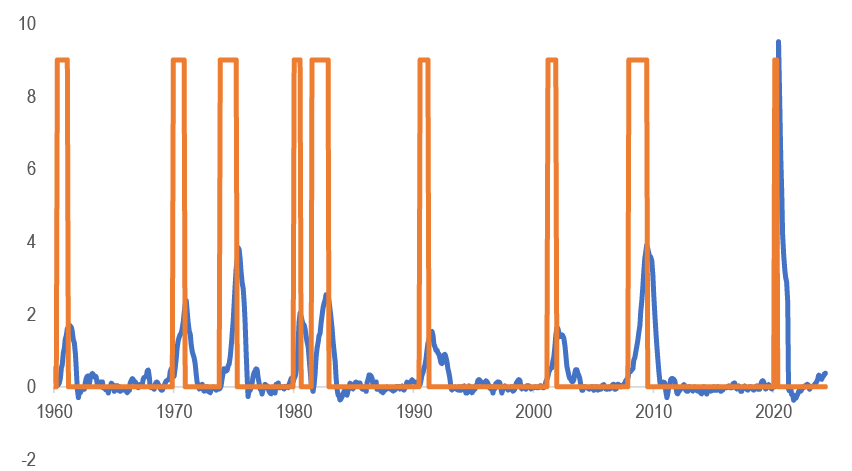
Despite unemployment being a lagging indicator, we note that when it inflects meaningfully upward off the lows, it has been a sign of worse things to come. Another closely watched labor market recession indicator, the Sahm rule, has also been ticking up. Definition from FRED: Sahm Recession Indicator signals the start of a recession when the three-month moving average of the national unemployment rate (U3) rises by 0.50 percentage points or more relative to the minimum of the three-month averages from the previous 12 months. Currently at 0.37, if we see unemployment at one or two tenths higher for a few months, this would hit 0.50, triggering a recession warning, which could alarm people ( Figure 19).
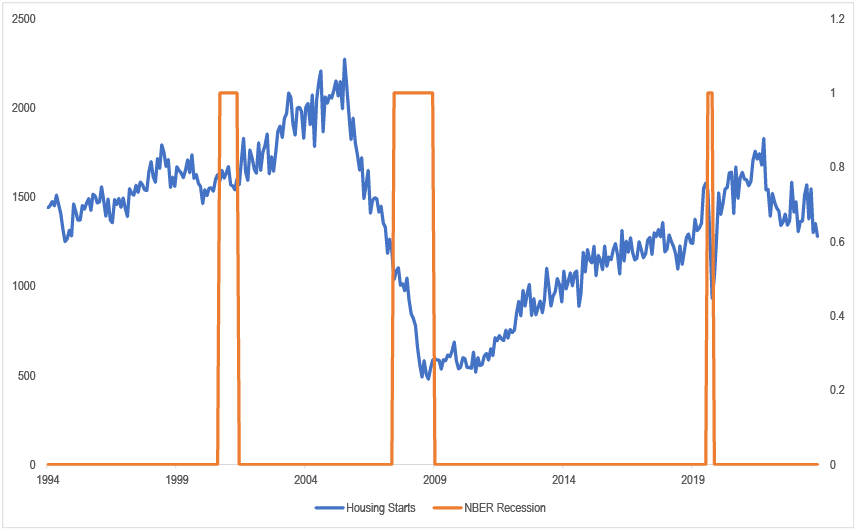
Housing starts, another popular input in recession probability models, also flashed a warning as starts are on track for a sizable 2Q decline. Much like yield curve inversion, a sharp fall in starts preceded most recessions, with DotCom and Covid recessions being recent exceptions. Economist Edward Leamer highlighted the importance of this indicator ahead of the GFC in his paper ‘Housing IS the business cycle.’ While higher mortgage rates produced lower purchase applications, one could argue the housing market has held up better than expected, thanks to a strong jobs market and tight housing supply. Despite this, the current trend is down, now hitting lower lows ( Figure 20).
In China, our forecast scenario looks for 2Q GDP growth to ease to 3.5% q/q saar (from 7.4% q/q saar in 1Q). Our 2H forecast assumes a steady, trend-growth pace of around 4.5% q/q saar. For the full-year 2024, our growth forecast stands at 5.2%yoy. The return of growth-supportive policy stance could help to reduce downside risks to growth, though policy transmission will likely take time, and meanwhile housing market momentum seems to remain weak in the near term. It has been one month since the PBOC and NAFR announced the three easing measures which aimed to increase house affordability, but bottoming out requires more time and policy support. Housing transactions for 30 major cities may contract 42.4%oya in June (vs -38.1% in May) if the month-to-date daily average pace extends to the rest of the month. Recent policy efforts could help mitigate downside risk, but appear insufficient to stabilize the market, and we further mark down our full-year real estate FAI forecast to around 9.5% decline (previously, a decline of 6-7%).
Despite some downside risk related to housing, we remain bullish on Chinese stocks in the near term. After an 8% decline in MXCN since May 20th, we expect the index to trade better in coming months, supported by continued buybacks, and consensus EPS growth at 16% and 13% for 2024 and 2025 respectively. MXCN NTM PE discounts vs MSCI World and MSCI EM stand at ~98% percentile using data since 2001. Based our current targets, we see 9% upside to the end of the year. While housing remains a drag, from an onshore local TAA perspective, the unattractiveness of housing and low CGB yields favor a re-allocation into stocks. For external risks, we would highlight ‘high for long’ and US election risk, which should come into focus in mid-July.
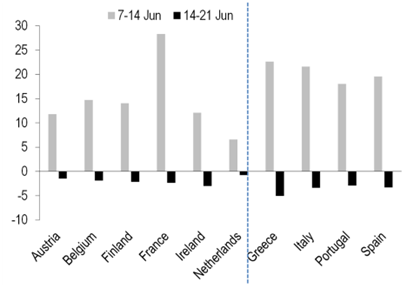
Figure 15: Intra-EMU spreads tightened modestly over the week, retracing only small fraction of past week’s large widening move
Source: J.P. Morgan Global Fixed Income Research, Bloomberg Finance L.P.
Figure 16: QTD sector returns as of Jun 20th
Source: J.P. Morgan, Bloomberg Finance L.P.
Figure 17: Rising markets on falling market breadth is an ominous sign
Source: J.P. Morgan, Bloomberg Finance L.P.
Figure 18: SPX yoy returns at highs with New Orders/Inventories turning downwards
Source: J.P. Morgan, Bloomberg Finance L.P.
Figure 19: Sahm rule may be just a few months away from triggering
Source: J.P. Morgan, Bloomberg Finance L.P.
Figure 20: Housing starts, one of the best recession indicators, have been ticking down
We are moving to a weekly schedule, discussing topics relevant to the strategic investor and including an expanding data section that starts with very long-term historic returns and risks on major asset classes; an overview of the investable world financial market; and a review of our recommended strategic allocations. In equities, we retain Strategic Overweights of Tech and Health Care and exit Financials. We also exit our strategic overweight of Climate Change funds as we have not yet found much with a decent return as most assets in this area are expensive. Given our focus on long-term investing, we have little need for the diversification advantage of government debt from its lower correlation with equities.
We believe that the weaker performance of Cyclicals is here to stay, and reiterate our barbell OW of Defensives and Commodities. This is in contrast to the frequent feedback from investors that one should be buying Cyclicals now that PMIs are picking up. Our call remains that other Cyclicals, such as Consumer, Corporate and even Financials should not be working in the current environment. While activity momentum is picking up in manufacturing and in Europe/China, crucially US growth momentum is likely slowing into year end. On the negative side, we remain cautious on Consumer Discretionary - in particular on Autos and on Luxury, we are still UW Chemicals.
The declining short interest on SPY and QQQ ETFs to successive record lows has been providing a steady flow support to US equities over the past year helping to suppress volatility, thus acting as an implicit short vol trade. This poses vulnerability to US equities in a scenario were negative news start reversing the past year’s decline in short interest. We estimate quarter-end rebalancing flow of around $50bn out of equities. With French insurance companies and pension funds reducing government bond holdings, and French households tending not to hold very high shares of government bonds, it appears much of the net supply from issuance and QT would need to be absorbed by foreign investors and banks.
Brazil’s share of Chinese imports grew for decades, with a new rise after the beginning of the trade war. We think the geographic rotation is at least partly driven by the US-China tariff war, which has made imports from Brazil more attractive. Looking relative to the pre-trade war trend, this new force added almost 0.5%-point of GDP in exports by 2019 and, with Chinese imports from Brazil growing strongly, it may add about 0.3%-point to Brazil’s trade balance this year if the share of Brazil exports to China return to the 2020’s highs.
From a fiscal perspective, there is continuity in Germany after the EU election and even a marginal hardening cannot be ruled out. While Germany is clearly having to juggle many spending demands, the direction of fiscal policy remains towards smaller deficits and to outperforming the EU fiscal rules. We doubt that Germany will be changing, on the basis of the EU parliament election, its position in European fiscal debates. We also expect German positions are much more likely to change in directions that, for example, take a more pragmatic approach to green issues (e.g. on regulation), rather than affect the broad direction of spending policy.
We expect Japan to continue moving to a "world where interest rates exist" in 2H24, seeking “hope” for Japan’s medium-term path toward a new inflation equilibrium associated with higher growth potential. While starting QT from August, we expect the BoJ to raise the policy rate as its confidence increases that inflation will continue to be anchored to its target of 2% over the medium term. We maintain our expectation of two rate hikes in 2H24, raising the policy rate to 0.5% by end-2024. Government's preparations for BoJ rate hikes and fiscal consolidation will continue but political risks related to upcoming elections could lead to unexpected fiscal expansion and market volatility.
We find that broad measures of liquidity have been on an improving trend through 2024, supported by declining delivered volatility. We also find that dispersion in off-the-run Treasuries has increased, but some of the recent concerns have been exaggerated by the presence of very small and highly illiquid bonds issued in the late-1990s. We also find little evidence of increased liquidity preference. However, it is notable that dealer positions, while still low compared to pre-GFC trends, have made new highs recently, approaching a share of total marketable debt outstanding that persisted just prior to the outbreak of the COVID-19 pandemic.
The investment opportunities from the data center dynamic should last for years. Given how broad-based the impacts of the data center build out are, it may very well be that markets as a whole are the ultimate beneficiary. Over the last decade, aggregate capex spending by the hyperscalers has increased from $20bn to over $100bn, with consensus forecasts calling for aggregate capex to soon eclipse $150bn. We are skeptical of the deliverability of data center growth forecasts in excess of 10GW per annum.
Investors’ preference for frontier markets over more liquid EMs in fixed income is a prominent theme this year. In recent quarters, investors have been flocking to frontier fixed income markets due to idiosyncratic turnaround stories and valuation resets, which are generally uncorrelated to the global business cycle or DM monetary policy. Frontier local markets are gradually taking the baton from hard currency debt, although there is dispersion. However, frontier economies still require significant capital to finance their infrastructure gap; the extended debt restructuring process has not helped.
We believe the recent pullback in commodities is just that, and we continue to see a 10% appreciation in the broader BCOM Commodities index by year-end. Sugar and wheat move to the top of our list of preferred longs, with a projected 30% and 25% return, respectively, by year-end. We still see Brent oil at $90 by September. We remain structurally bullish on gold and silver and see the ongoing consolidation as a buying opportunity with a target of $2,600/oz and $34/oz, respectively, in 2025. The current levels in copper present a good re-entry point towards our $11,500 target by 3Q25. After rallying ~12%, US HH natural gas moves from #1 buy recommendation in April to the bottom of the list for now.
A higher for longer scenario didn’t weigh on the mood among participants at our sixth annual Asia Credit Conference. Investors appreciate the Asia credit market’s defensive characteristics, and expect these supports to remain in place. This year, participants are constructive on the market, with 44% of respondents describing their positioning as neutral and planning to stay unchanged, while another third of respondents are underweight but planning to increase their allocation.
Datacom Optical Transceiver market to accelerate to a +17% CAGR through to 2029, led by strong demand for high-speed transceivers from Cloud customers. Within the overall market, the 400G+ market is expected to outpace with a +28% CAGR driven by robust investments from Cloud customers in AI datacenter infrastructure. Coherent is our “top pick” with depth and breadth of Datacom portfolio, one of the many reason to like the shares.
Although servers are only ~10% of the overall semiconductor market, datacenter AI is going to be the key driver of semi capex over the next five years. We also show that AI will require the addition of as much as 500k wafer capacity in DRAM by 2027. ASML remains our top pick in 2024 with an Overweight rating and price target of €1,100.
We expect TSMC’s structural growth levers to remain strong from its near-monopoly position in AI accelerators and edge AI due to its strong process roadmap (N3 and N2) and industry leading packaging technology. With the 2025 price hikes, improving N7 utilizations and better N3 yields, we believe GMs could reach high-50% to 60% levels by 2H25/1H26, driving ~NT$64 EPS power in 2026. We move our PT to Jun-25 and raise it to NT$1080, based on 18x 12-month forward EPS (unchanged).