
Flows & Liquidity
Updated bond demand and supply for H2
- Our updated bond demand/supply analysis points to a net improvement in bond demand in 2024 vs. 2023 of around $0.5tr, largely due to an improvement in retail bond demand as well as some improvement in G4 commercial bank and foreign official demand.
- Combined with an increase in net supply of $0.8tr, our framework now implies a more modest deterioration in the supply-demand balance of $0.4tr vs. $0.6tr previously.
- This would imply upward pressure on Global Agg yields of around 25bp-30bp for the whole year compared to a YTD rise of around 40bp.
- In other words, our updated bond demand/supply analysis implies around 10-15bp decline in global bond yields between now and year-end.
- The Q1 2024 bond fund inflow globally was the highest since data began in 2006.
- Balanced/Mixed funds, a category that includes the so called 60:40 funds and other multi asset funds, continues to bleed with another $60bn of outflows in Q1 2024.
- Of the $8.33bn that MicroStrategy spent cumulatively since inception to acquire bitcoins, $3.4bn or 40% was spent over the past three quarters alone.
- As we pass the mid-year mark and the focus shifts to the second half, we revisit our estimate of the global bond supply/demand balance. This incorporates updated projections for net bond demand from key global bond investors, as well as updates supply estimates for 2024 from 2H24 outlooks. Turning first to demand, after quite sharp deteriorations in net bond demand from G4 central banks in recent years, the overall deterioration in 2024 vs. 2023 is set to be markedly more modest. The reduction in the Fed’s monthly QT pace of UST runoffs being cut to $25bn from $60bn, a modestly larger cut than the $30bn/m we had expected, is set to be largely offset by the shift from the ECB to partial reinvestment of maturing PEPP holdings in 2H24, as well as the BoJ shifting to QT. Indeed, Governor Ueda indicated that it would prefer a ‘predictable’ approach to QT and that reductions would be ‘sizeable’, but will release further details after consultations with market participants at the July meeting and we assume a relatively gradual shift to QT by the BoJ outlined by our Japan rates strategists (Japan Fixed Income Markets Weekly, Jun 28th). Overall, we project net bond sales by G4 central banks of around $1.3tr in 2024 ( Figure 1), or a decline of around $240bn vs. 2023.
Figure 1: Net QE by G4 central banks
In $bn.
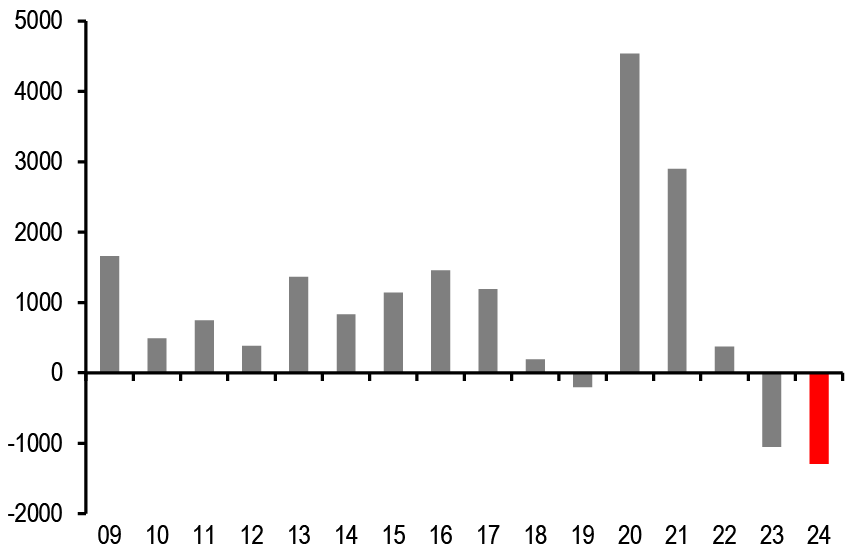
Source: J.P. Morgan.
- For G4 commercial banks, 2023 had seen a modest improvement in net demand of around $100bn vs. 2022 as significant net sales from US commercial banks were offset by net purchases from other G4 commercial banks, particularly Euro area banks. In 2024 to-date, there has been a notable pickup with around $430bn of net purchases. This includes a notable increase in bond holdings from US banks in 1Q24, with the US flow of funds showing around $185bn of net purchases. However, we are reluctant to project this strength going forward given that in 2Q24 we estimate net sales of around $20bn based on the Fed H.8 release with weekly changes in bond holdings adjusted for our proxy for net unrealised gains. In addition, the share of US banks’ holdings of debt securities as a share of total assets remains elevated ( Figure 2). And while the FDIC’s Quarterly Banking profile for 1Q24 shows that there has been some reduction in unrealised losses that stood at over $680bn in 3Q24, they still remain elevated at just under $520bn ( Figure 3).
Figure 2: US and Euro area banks’ holdings of bonds as a share of total assets
In %. Dashed lines are pre-pandemic averages.
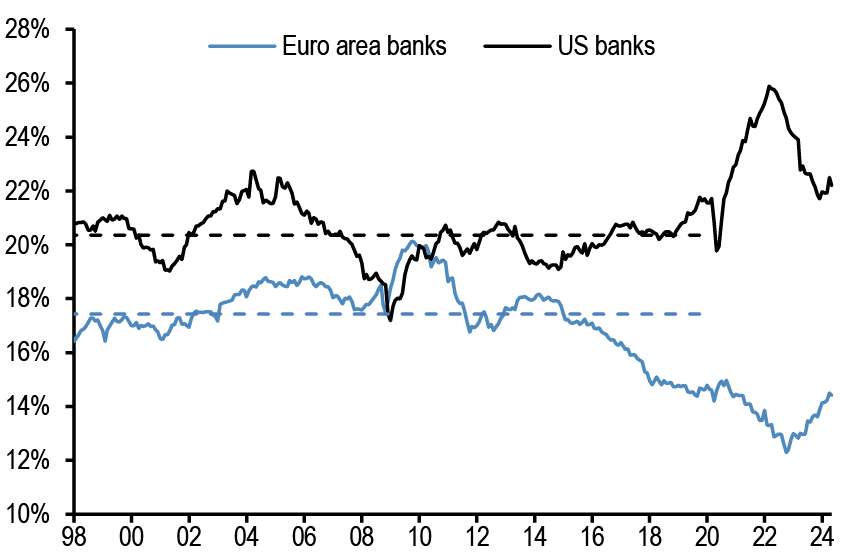
Source: Federal Reserve, ECB, J.P. Morgan.
Figure 3: FDIC-insured institutions’ unrealised gains (losses) on investment securities
$bn.
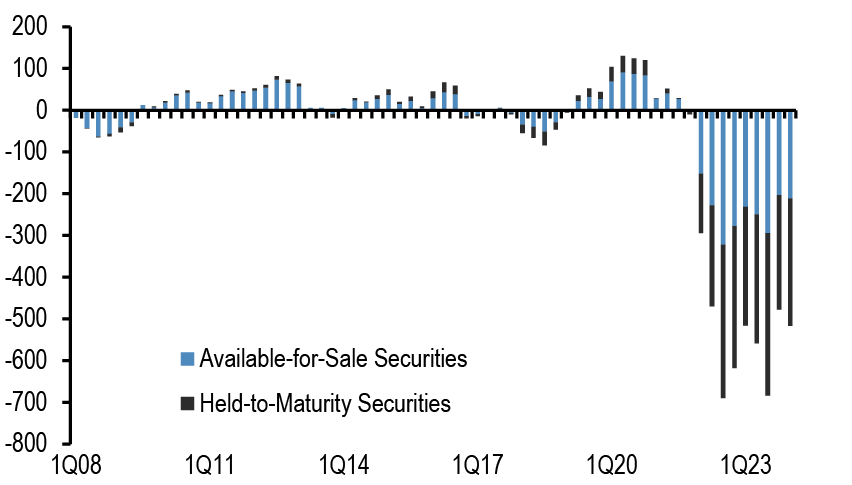
Source: FDIC.
- At the same time, the pickup in demand from euro area banks has seen the share of bonds as a % of total assets increase to a level close to its end-2019 level, though it remains some way below its pre-2019 average. Much of the TLTROs outstanding at the start of the year have now matured or been pre-paid, with around $80bn outstanding, and together with QT reserves look set to contract by around $290bn. As we have argued previously, given the ongoing contraction in reserves we see banks increasing their bond holdings at least in part to ensure that they have sufficient high quality liquid assets for regulatory purposes. That said, the 2H24 decline in reserves looks set to be somewhat slower than the 1H24 decline, suggesting a somewhat more modest pace of net demand for Euro area banks. Taking the above, we project an improvement in bond demand from G4 commercial banks of around $350bn in 2024 vs. 2023, compared to our previous projection of around $200bn.
- What about retail investors? 2023 saw a normalisation in bond fund demand to net purchases of around $630bn, modestly above its average for the past decade, after net outflows in 2022 (Chart A1 in the Appendix). The net inflow YTD, however, has been elevated, with 1Q24 in particular seeing the strongest quarter of net inflows since at least 2006. 2Q24 has seen net inflows more in line with its average for 2023, and projecting the 2Q24 pace forward suggests overall net inflows into bond funds for 2024 of around $830bn. This represents an improvement in demand of around $200bn in 2024 vs. 2023, compared to our previous projection of unchanged flat demand.
- What about foreign official demand? The recently released IMF COFER data for 1Q24, where we adjust changes in reserve balances by currency for both currency and bond returns (using our 1-5y GBI country indices), suggest that reserves mangers saw net inflows of just under $150bn ( Figure 4). For 2Q24, we use a more timely proxy of net reserves accumulation for EM based on monthly or weekly disclosures of FX reserves. Similar to the COFER data, we adjust changes in FX reserves for bond and currency returns, assuming for simplicity that reserves are distributed roughly 60:40 in USD and non-USD currencies, broadly in line with the distribution in the COFER data, and proxy non-USD currencies with DXY returns and DXY weighted bond returns. This proxy suggests a sharp slowdown in reserve accumulation in 2Q, and given the marked volatility in quarter-to-quarter flows that have since end-2021 averaged zero we are reluctant to project the strength in 1Q24 flows. At the same time, net bond sales of $100bn in 2023 look less likely to be repeated, and we project an improvement in net bond demand from reserve managers of $150bn in 2024 vs. 2023.
Figure 4: Quarterly flows by FX Reserve Managers
In $bn per quarter. Based on COFER data adjusted for both bond and FX returns. Last obs. is for 1Q24.
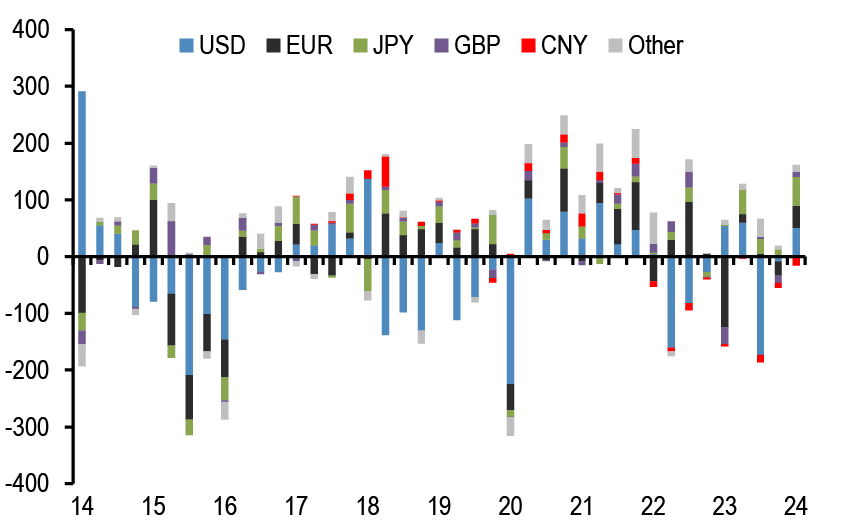
Source: IMF COFER, J.P. Morgan.
- What about G4 pension funds and insurance companies? In 2023, we now estimate they bought around $620bn of bonds based on the flow of funds. Previously, we had estimated based on the strength in 1H24 and 3Q24 data that G4 pension funds that 2023 net bond demand would be markedly stronger at $880bn, but a softer 4Q pace and revisions mean that net purchases came in markedly weaker. Given the improvement in the funded status of defined benefit pension funds amid strength in equity markets and still high yields suggests that there remains an incentive to lock in these gains, but also recognising that these rebalancing flows have taken longer to materialise than we have expected, we project a similar modestly above average demand for 2024. In other words, we now project unchanged bond demand in 2024 vs. 2023, vs. a deterioration of around $150bn previously.
- Turning to supply, our colleagues in US rates strategy have revised higher their net issuance forecasts, and similar to the previous revisions earlier this year the upward revisions were primarily due to ongoing strength in corporate issuance. In addition, we now see higher HG net supply and modestly higher government supply in Europe. Taking on board these net issuance revisions across govt and spread products, Figure 5 shows our updated projections for global bond net supply. We now project an increase in net issuance in 2024 vs. 2023 of around $0.8tr compared to close to around $0.4tr previously and close to flat back in Nov23 (F&L, Nov 23rd).
Figure 5: Net global bond supply
$bn per annum.
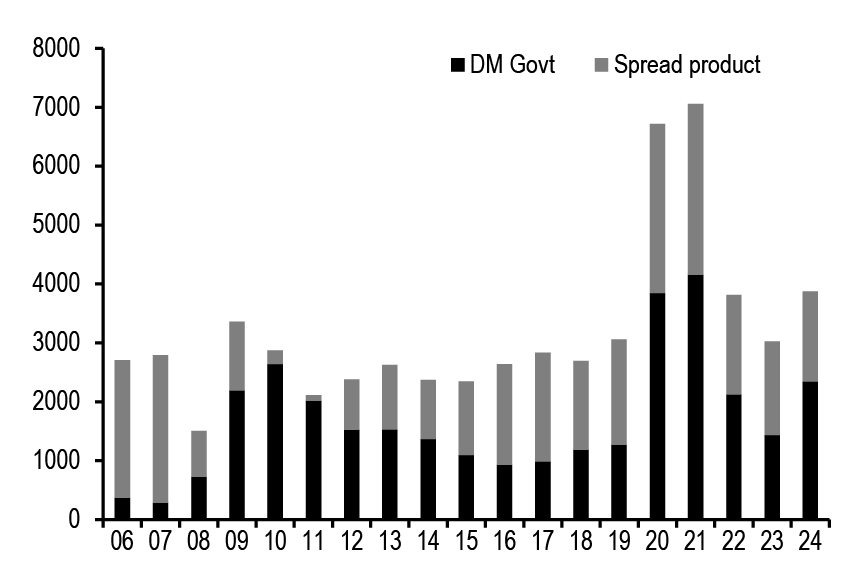
Source: J.P. Morgan.
- Putting it all together, we now project an improvement in bond demand in 2024 vs. 2023 of around $0.5tr, compared to a deterioration of around $0.3tr previously. With bond supply now around $0.8tr higher in 2024 vs. 2023, compared to $0.4tr previously, this now implies a deterioration in the global bond supply-demand balance of around $0.4tr vs. around $0.6tr previously ( Figure 6). Based on the relationship between annual changes in excess supply and the changes in the Global Agg index yield would imply upward pressure on Global Agg yields of around 25bp-30bp for the whole year compared to a YTD change of around 40bp. In other words, our updated bond demand/supply analysis implies around 10bp-15bp decline in global bond yields between now and year end.
Figure 6: Annual change in the balance between global bond supply and demand
Change in excess bond supply in $bn per annum in the left axis calculated as the difference between changes in global bond supply and changes in global bond demand as explained in the text. It includes our 2024 estimates. Right axis shows the annual change of the yield on the Bloomberg Global Agg index in % (Jan-Oct in dotted lines for 2016 and 2018), and the blue diamonds shows change for 2023 and the YTD change in 2024.
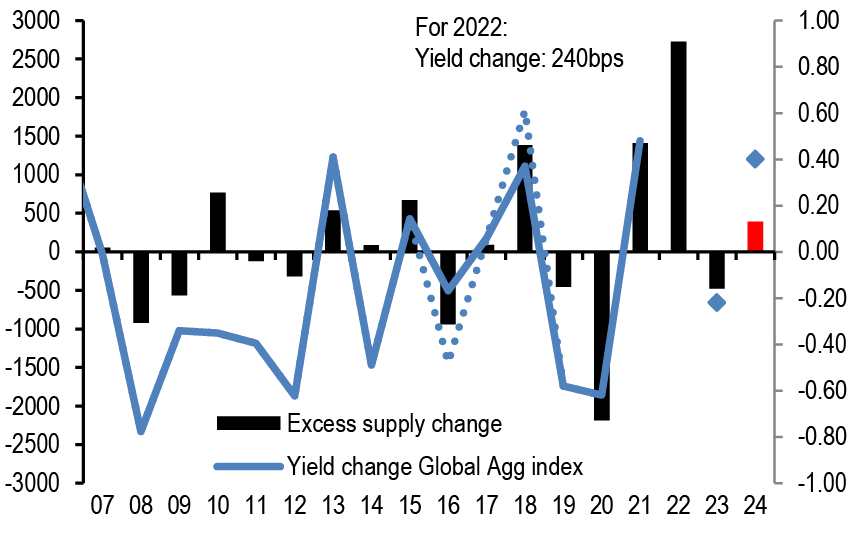
Source: J.P. Morgan.
The Q1 2024 bond fund inflow globally was the highest since data began in 2006. Balanced/Mixed funds, a category that includes the so called 60:40 funds and other multi asset funds, continues to bleed with another $60bn of outflows in Q1 2024.
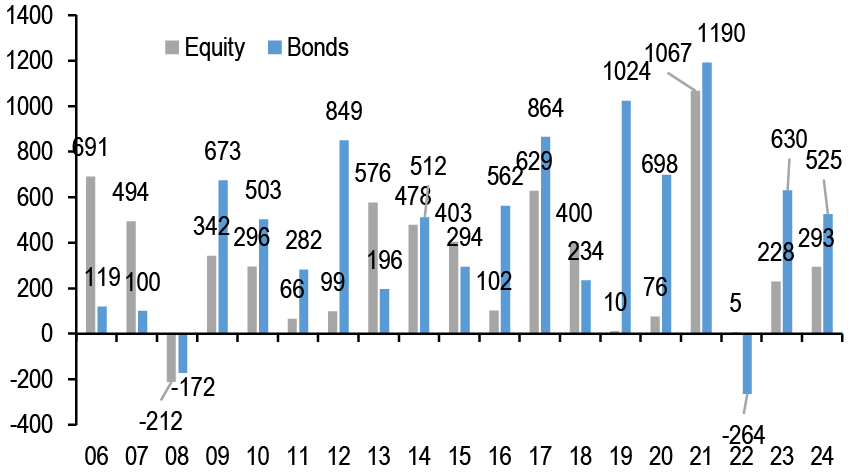
- The Q1 quarterly worldwide fund flow data released by ICI last week revealed a much stronger inflow into both bond and equity funds in the first quarter of the year than previously suggested by monthly and weekly flow data ( Figure 7). In particular, the Q1 2024 bond fund inflow at $359bn was the strongest since worldwide bond fund flow data began in 2006.
- And the equity fund flow for Q1 2024 was almost as strong as that seen in Q4 2023, suggesting that the retail impulse into equities was strong for two straight quarters. The $190bn per quarter pace of equity fund flows during Q4 2023 and Q1 2024 represents the strongest equity fund buying since 2021.
- Fund flow data from monthly and weekly reporting funds point to some slowing in both equity and bond fund flows in Q2 as shown in Figure 7 , but there clearly is a risk upward revisions in the Q2 fund flows of Figure 7 once quarterly reporting flow data become available in about three months.
Figure 7: Quarterly equity & bond fund flows globally
$bn per quarter of Net Sales, i.e. includes net new sales + reinvested dividends for Mutual Funds and ETFs globally, i.e. for funds domiciled both inside and outside the US. Data come from ICI (worldwide data up to Q1’24). Data for Q2 2024 are a combination of monthly and weekly data from Lipper, EPFR and ETF flows from Bloomberg Finance L.P.
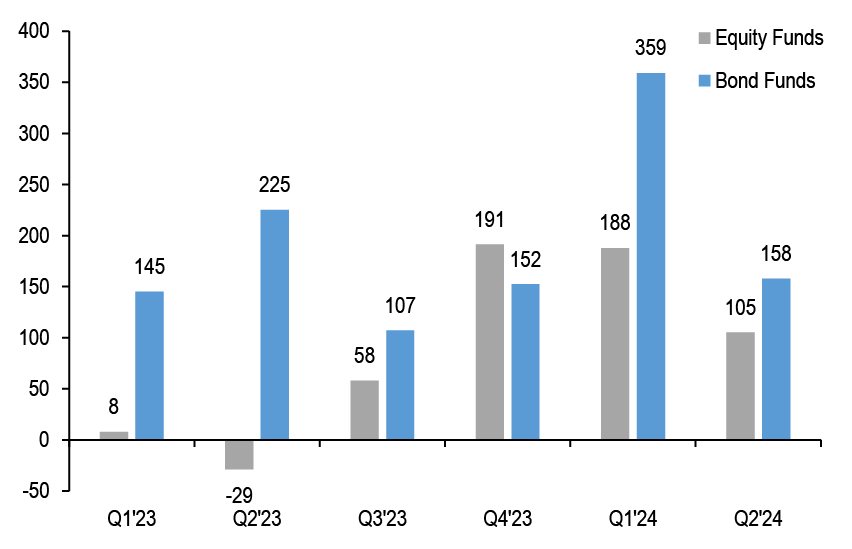
Source: ICI, EPFR, Lipper, Bloomberg Finance L.P., J.P. Morgan.
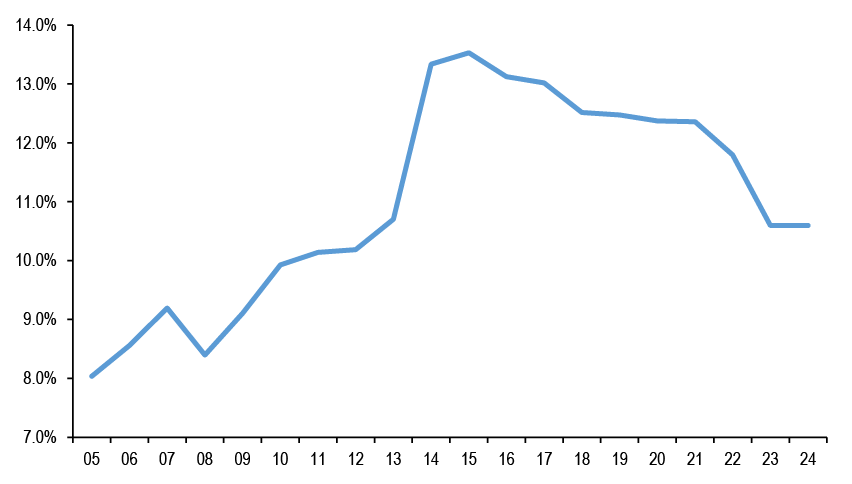
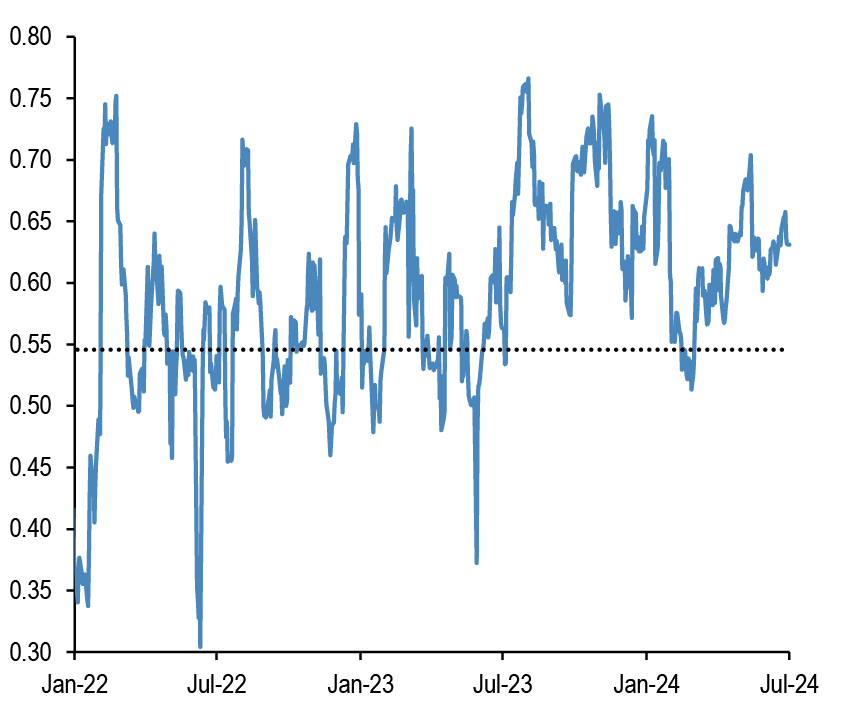
- What has been also striking within the Q1 worldwide fund flow data is the persistency of the outflows from Balanced/Mixed funds despite all other categories (Equity, Bond and Money Market Funds) seeing strong inflows. Balanced/Mixed funds, a category that includes the so called 60:40 funds and other multi asset funds, lost another $60bn in Q1 2024, the eight consecutive quarter of large outflows ( Figure 8). As we argued before in our publication, the structural shift in bond/equity correlation to positive territory since 2022 ( Figure 9) appears to have inflicted a structural damage to Balanced/Mixed funds, the case for these funds has diminished in investors’ minds. Instead of Balanced/Mixed funds, investors have been preferring to buy funds focused on individual asset classes, i.e. Equity, Bond and Money Market Funds over the past two years. In addition, investors may prefer funds focused on individual asset classes it may give them more flexibility, e.g. if they want to avoid negative carry in government bond funds they can direct flows into funds that focus on spread products. As a result of outflows, the AUM of Balanced/Mixed funds has declined to its lowest share since 2013 as percentage of the AUM of all funds ( Figure 10).
Figure 8: Quarterly Balanced/Mixed fund flows worldwide
$bn per quarter of Net Sales, i.e. includes net new sales + reinvested dividends for Mutual Funds and ETFs globally, i.e. for funds domiciled both inside and outside the US. Data come from ICI (worldwide data) and are till Q1’24.
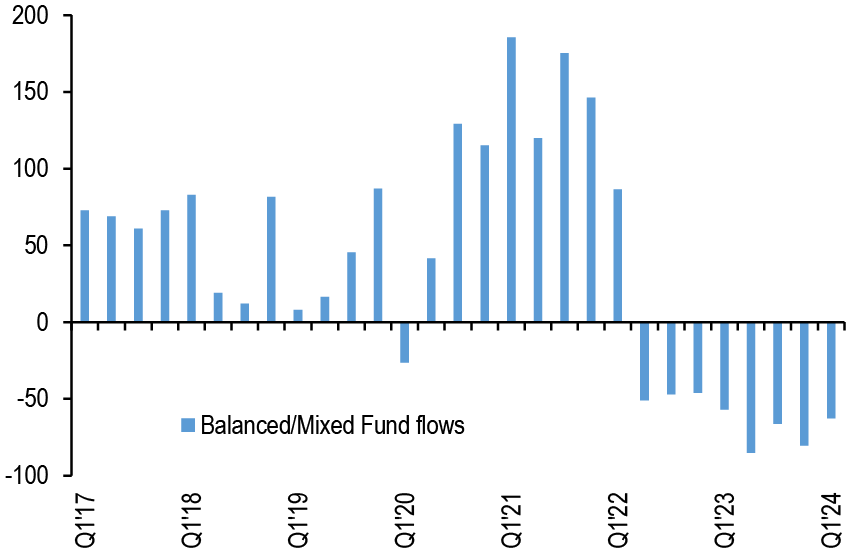
Source: ICI, J.P. Morgan.
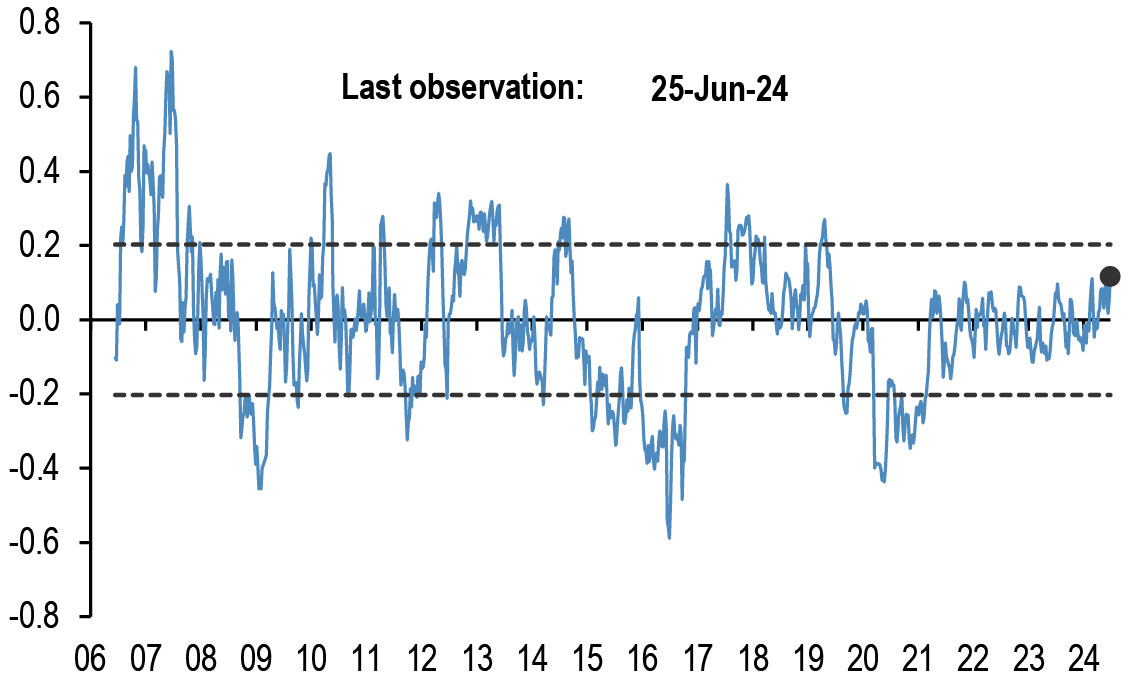
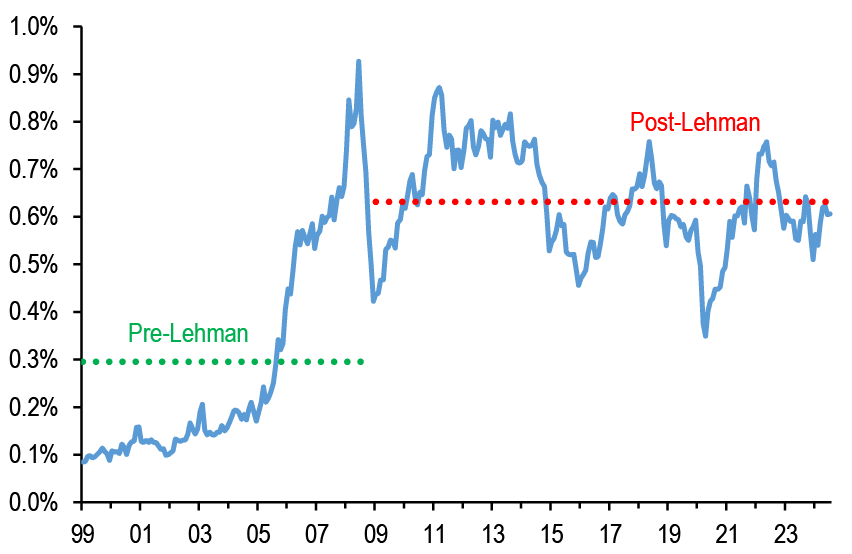
Figure 9: Bond/Equity correlation
Rolling 2- and 6-month correlation of daily returns of the MSCI AC World Index in local currency terms and the JPM Global Government Bond Index hedged into USD.
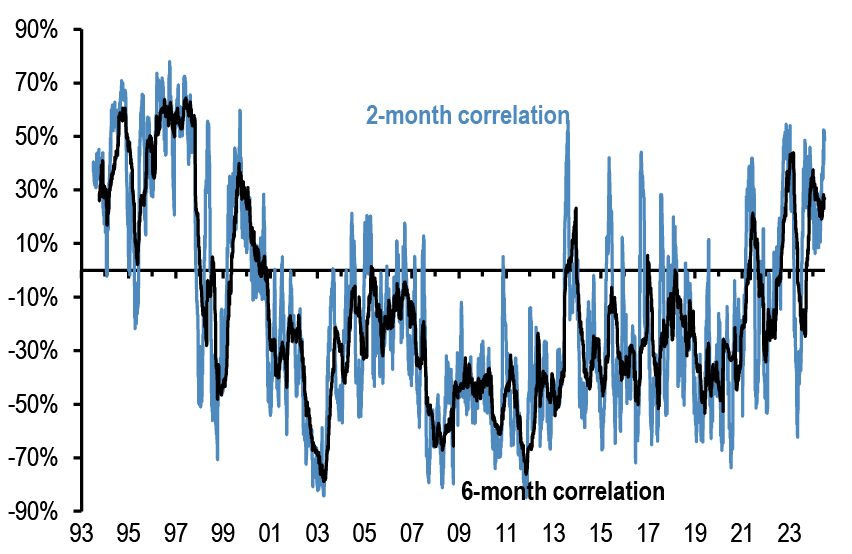
Source: Bloomberg Finance L.P., J.P. Morgan.
Figure 10: Balanced/Mixed Fund AUM as % of Total Fund AUM worldwide
In %.
Source: ICI, J.P. Morgan.
Of the $8.33bn that MicroStrategy spent cumulatively since inception to acquire bitcoins, $3.4bn or 40% was spent over the past three quarters alone
- On June 20, 2024, MicroStrategy announced that it acquired 11,931 bitcoins for approximately $786mn in cash between April 27th and June 19th, using proceeds from a $800mn convertible note offering. This takes MicroStrategy’s total holdings to 226,331 bitcoins as of June 20th . Cumulatively since inception, MicroStrategy spent $8.33bn to acquire these 226,331 bitcoins at an average purchase price of $36,798 per bitcoin, inclusive of fees and expenses.
- MicroStrategy’s 226,331 bitcoin holdings as of June 20th compare to 214,278 at end-March 2024 and 189,150 at year-end. In other words, MicroStrategy spent more than $2bn to buy bitcoins in the first half of the year funded via the sale of convertible notes, showing once again the company’s determination to transform itself to a leveraged bet on bitcoin. This follows $1.25bn of bitcoin purchases in Q4 2023.
- The above purchases imply that of the $8.33bn that MicroStrategy spent cumulatively since inception to acquire bitcoins, $3.4bn or 40% was spent over the past three quarters alone. This proves that MicroStrategy played a very significant role in propagating bitcoin and crypto over the past three quarters. As mentioned before in our publication, we believe debt-funded bitcoin purchases by MicroStrategy add leverage and froth to the current crypto rally and raise the risk of more severe deleveraging in a potential downturn in the future.
Appendix
Chart A1: Global equity & bond fund flows
$bn per year of Net Sales, i.e. includes net new sales + reinvested dividends for Mutual Funds and ETFs globally, i.e. for funds domiciled both inside and outside the US. Flows come from ICI (worldwide data up to Q1’24). Data since then are a combination of monthly and weekly data from Lipper, EPFR and ETF flows from Bloomberg Finance L.P.
Source: ICI, EPFR, Lipper, Bloomberg Finance L.P., J.P. Morgan.
Chart A2: Fund flow indicator
Difference between flows into Equity and Bond funds: $bn per week. Difference between flows into Equity vs. Bond funds in $bn per week. Flows include Mutual Fund and ETF flows globally, i.e. funds domiciled both inside and outside the US (source: EPFR) The thin blue line shows the 4-week average of difference between Equity and Bond fund flows. Dotted lines depict ±1 StDev of the blue line. The thick black line shows a smoothed version of the same series. The smoothing is done using a Hodrick-Prescott filter with a Lambda parameter of 100.
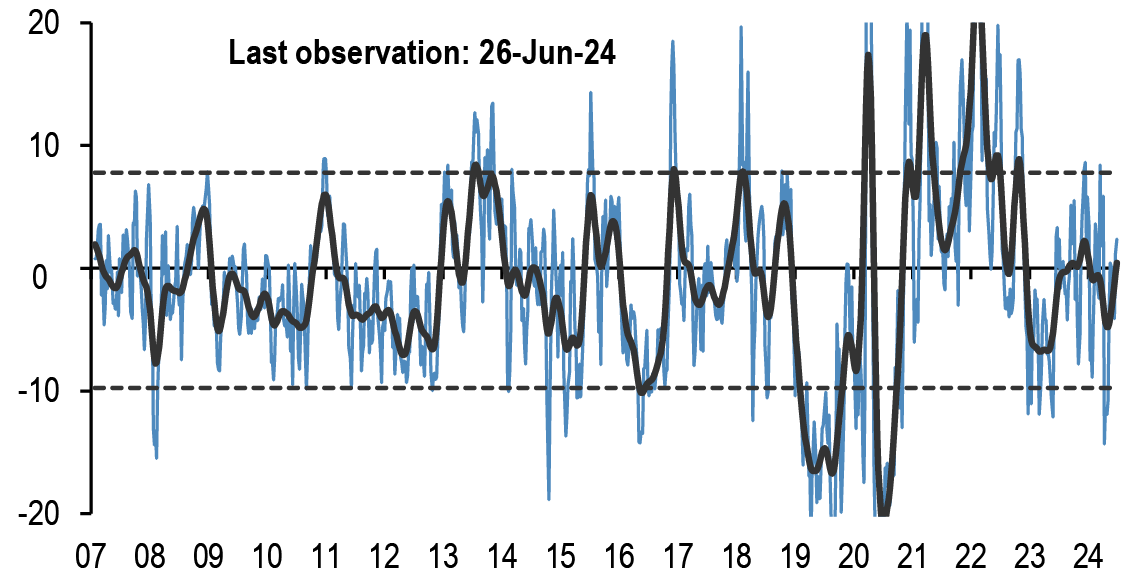
Source: EPFR, J.P. Morgan.
Table A1: Flow Monitor
$bn per week. The first two rows include Mutual Fund and ETF flows globally, i.e.flows for funds domiciled both inside and outside the US(source: EPFR). The last four rows only include funds domiciled in the US.International Equity funds are equity funds domiciled in the US that invest outside the US (source: ICI and Bloomberg Finance L.P.).
| MF & ETF Flows | 26-Jun | 4 wk avg | 13 wk avg | 2024 avg |
| All Equity | 8.68 | 12.8 | 6.9 | 8.6 |
| All Bond | 7.34 | 10.5 | 10.0 | 10.7 |
| US Equity | -14.05 | -1.0 | -5.5 | -4.5 |
| US Bonds | 0.64 | 3.3 | 4.4 | 7.1 |
| Non-US Equity | 22.73 | 13.8 | 12.3 | 13.1 |
| Non-US Bonds | 6.70 | 7.1 | 5.7 | 3.6 |
| US Taxable Bonds | 6.07 | 5.8 | 4.7 | 4.2 |
| US Municipal Bonds | -0.65 | 0.2 | 0.1 | 0.0 |
| US HG Bonds | 3.86 | 3.2 | 2.9 | 4.1 |
| US HY Bonds | -0.43 | 0.3 | 0.3 | 0.3 |
| US MMFs | 15.09 | 7.5 | 2.5 | 8.1 |
| UCITS Flows | Apr-24 | 3 mth avg | 2023 avg | 2024 avg |
| Euro MMFs | 15.04 | 1.23 | 15.63 | 8.36 |
| Euro Equities | -1.49 | 3.4 | 0.6 | 2.5 |
| Euro Bonds | 28.26 | 28.4 | 12.3 | 30.0 |
Source: ICI, EPFR, EFAMA, Bloomberg Finance L.P., and J.P. Morgan.
Table A2: Trading turnover monitor
Volumes are monthly and Turnover ratio is annualised (monthly trading volume annualised divided by the amount outstanding). UST Cash is primary dealer transactions in all US government securities. UST futures are from Bloomberg Finance L.P. JGBs are OTC volumes in all Japanese government securities. Bunds, Gold, Oil and Copper are futures. Gold includes Gold ETFs. Min-Max chart is based on Turnover ratio. For Bunds and Commodities, futures trading volumes are used while the outstanding amount is proxied by open interest. The diamond reflects the latest turnover observation. The thin blue line marks the distance between the min and max for the complete time series since Jan-2005 onwards. Y/Y change is change in YTD notional volumes over the same period last year.
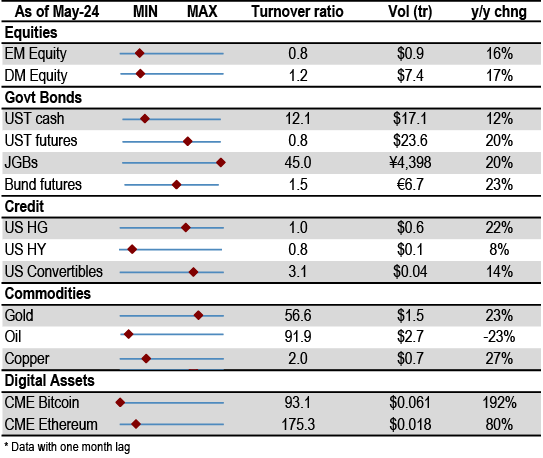
Source: Bloomberg Finance L.P., Federal Reserve, Trace, Japan Securities Dealer Association, WFE, J.P. Morgan.
ETF Flow Monitor (as of 3rd July)
Chart A3: Global Cross Asset ETF Flows
Cumulative flow into ETFs as a % of AUM
Source: Bloomberg Finance L.P., J.P. Morgan.
Chart A4: Bond ETF Flows
Cumulative flow into bond ETFs as a % of AUM
Source: Bloomberg Finance L.P., J.P. Morgan.
Chart A5: Global Equity ETF Flows
Cumulative flow into global equity ETFs as a % of AUM
Source: Bloomberg Finance L.P., J.P. Morgan. Note: We include ETFs with AUM > $200mn in all the flow monitor charts. Chart A5 exclude China On-shore (A-share) ETFs from EM and in Japan. We subtract the BoJ buying of ETFs.
Chart A6: Equity Sectoral and Regional ETF Flows
Rolling 3-month and 12-month change in cumulative flows as a % of AUM. Both sorted by 12-month change
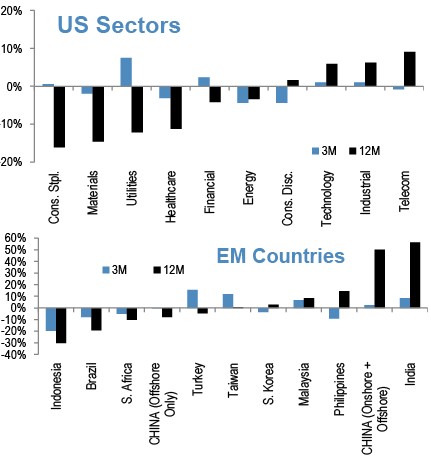
Source: Bloomberg Finance L.P., J.P. Morgan.
Short Interest Monitor
Chart A7: Short interest on the EEM and EMB US ETF
Short Interest as a % share of share outstanding.
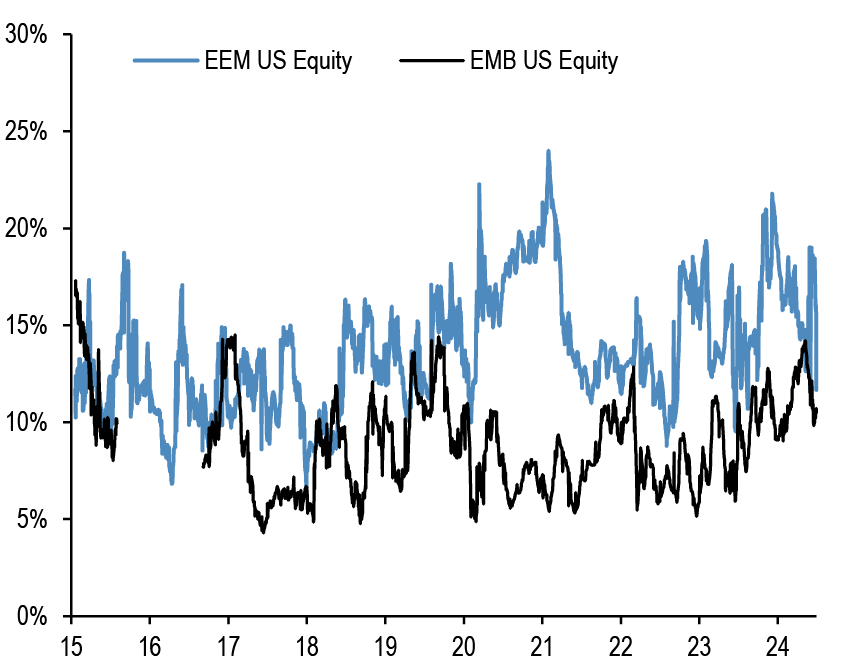
Source: S3, J.P. Morgan
Chart A9: Short interest on the SPY and QQQ US ETF
Short Interest as a % share of share outstanding. Last obs is for 1st July 2024.
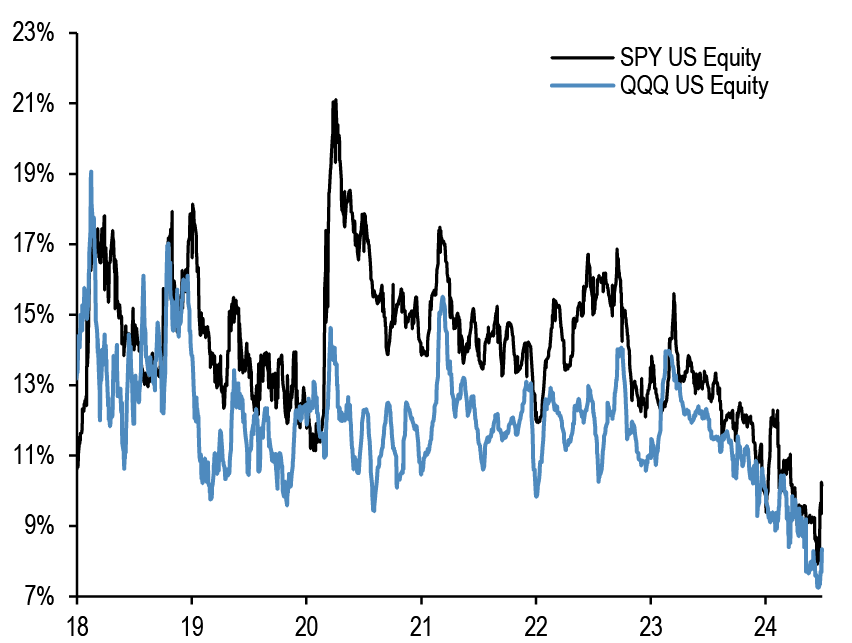
Source: S3, J.P. Morgan
Chart A8: Short interest on the LQD and HYG US ETF
Short Interest as a % share of share outstanding.
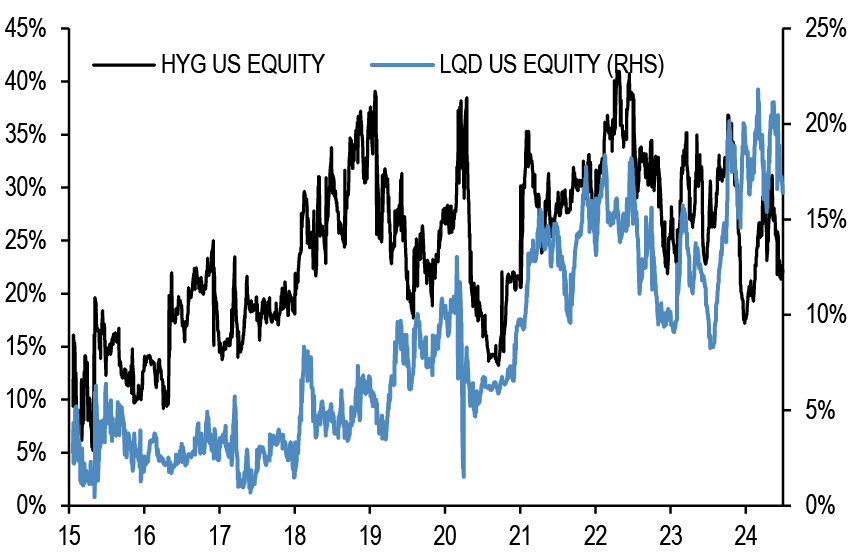
Source: S3, J.P. Morgan
Chart A10: S&P500 sector short interest
Short interest as a % of shares outstanding based on z-scores. A strategy which overweights the S&P500 sectors with the highest short interest z-score (as % of shares o/s) vs. those with the lowest, produced an information ratio of 0.7 with a success rate of 56% (see F&L, Jun 28,2013 for more details).
Source: NYSE, Bloomberg Finance L.P., J.P. Morgan
Chart A11a: Cross Asset Volatility Monitor 3m ATM Implied Volatility (1y history) as of 1st July-2024
This table shows the richness/cheapness of current three-month implied volatility levels (red dot) against their one-year historical range (thin blue bar) and the ratio to current realised volatility. Assets with implied volatility outside their 25th/75th percentile range (thick blue bar) are highlighted. The implied-to-realised volatility ratio uses 3-month implied volatilities and 1-month (around 21 trading days) realised volatilities for each asset.
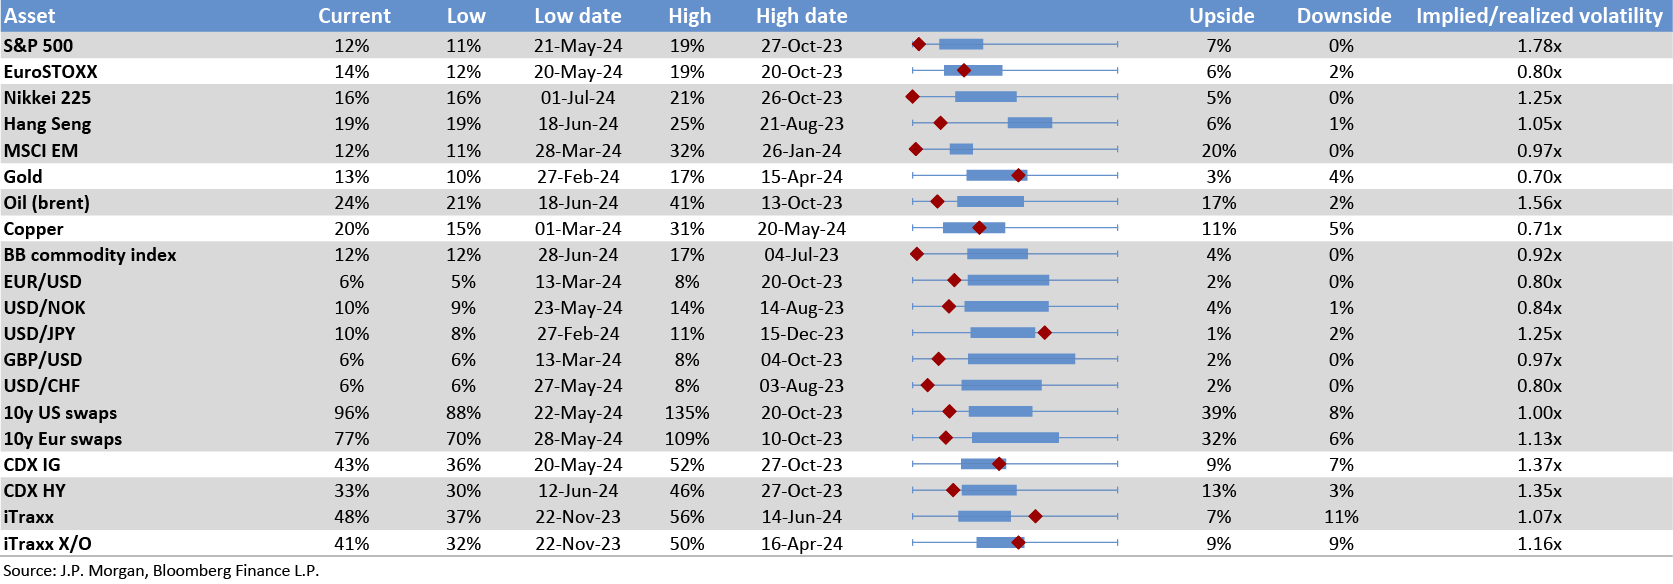

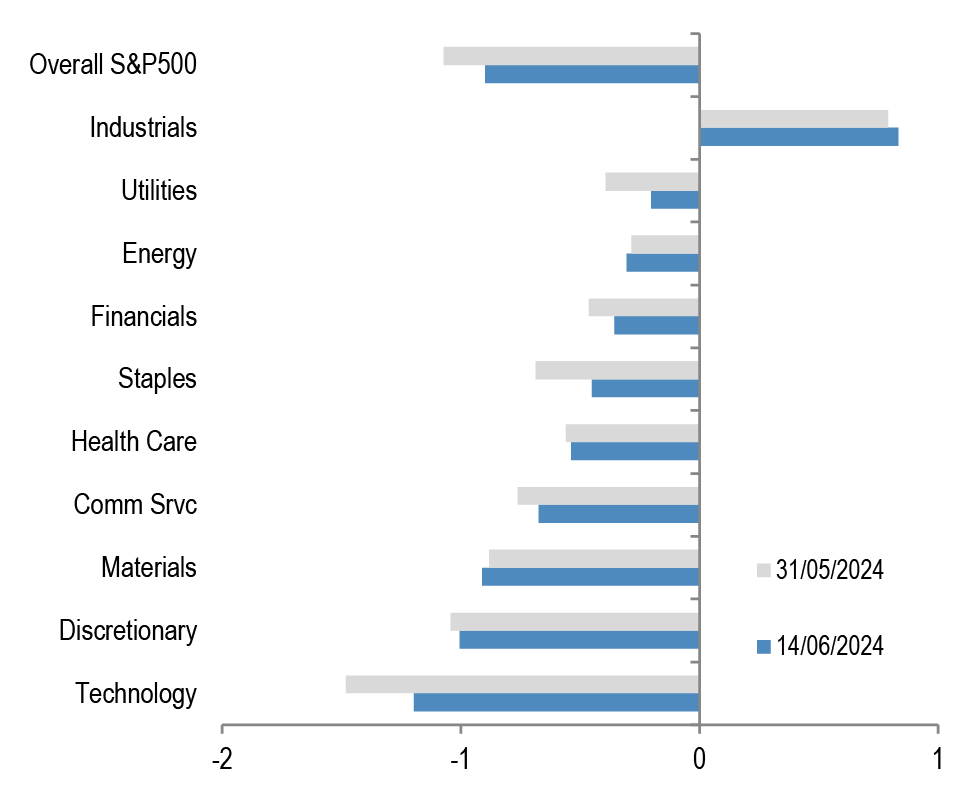
Chart A11b: Option skew monitor
Skew is the difference between the implied volatility of out-of-the-money (OTM) call options and put options. A positive skew implies more demand for calls than puts and a negative skew, higher demand for puts than calls. It can therefore be seen as an indicator of risk perception in that a highly negative skew inequities is indicative of a bearish view. The chart shows z-score of the skew, i.e. the skew minus a rolling 2-year avg skew divided by a rolling two-year standard deviation of the skew. A negative skew on iTraxx Main means investors favour buying protection, i.e. a short risk position. A positive skew for the Bund reflects a long duration view, also a short risk position.
Source: J.P. Morgan.
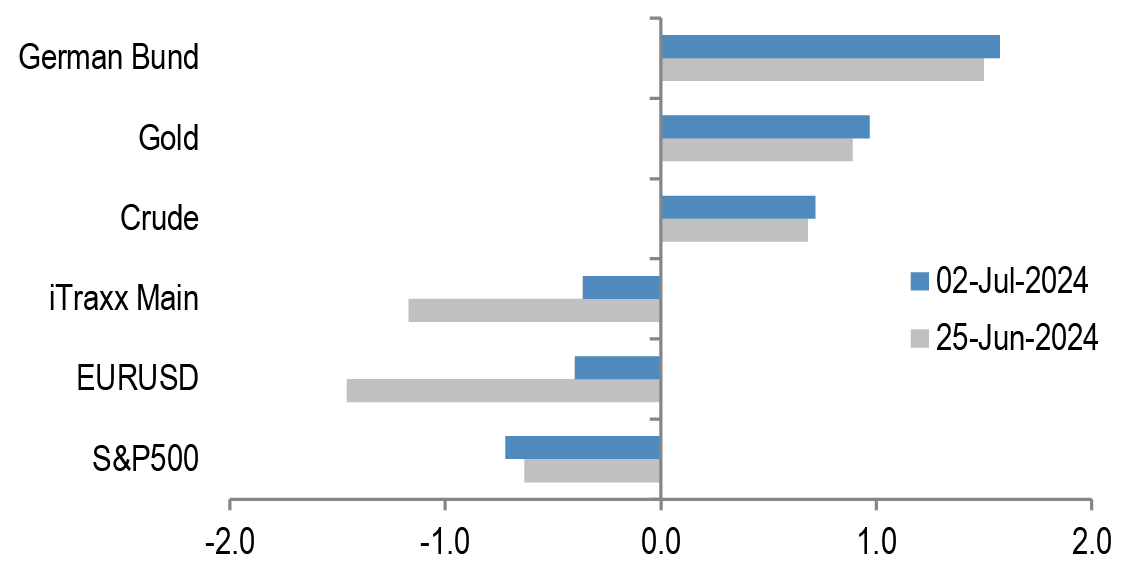
Chart A11c: Equity-Bond metric map
Explanation of Equity - Bond metric map: Each of the five axes corresponds to a key indicator for markets. The position of the blue line on each axis shows how far the current observation is from the extremes at either end of the scale. For example, a reading at the centre for value would mean that risky assets are the most expensive they have ever been while a reading at the other end of the axis would mean they are the cheapest they have ever been. Overall, the larger the blue area within the pentagon, the better for the risky markets. All variables are expressed as the percentile of the distribution that the observation falls into. I.e. a reading in the middle of the axis means that the observation falls exactly at the median of all historical observations. Value: The slope of the risk-return trade-off line calculated across USTs, US HG and HY corporate bonds and US equities(see GMOS p. 6, Loeys et al, Jul 6 2011 for more details). Positions: Difference between net spec positions on US equities and intermediate sector UST. See Chart A13. Flow momentum: The difference between flows into equity funds (incl. ETFs) and flows into bond funds. Chart A1. We then smooth this using a Hodrick-Prescott filter with a lambda parameter of 100. We then take the weekly change in this smoothed series as shown in Chart A1. Economic momentum:The 2-month change in the global manufacturing PMI. (See REVISITING: Using the Global PMI as trading signal, Nikolaos Panigirtzoglou, Jan 2012). Equity price momentum: The 6-month change in the S&P500 equity index. As of 28th June 24.

Source: Bloomberg Finance L.P., J.P. Morgan.
Spec position monitor
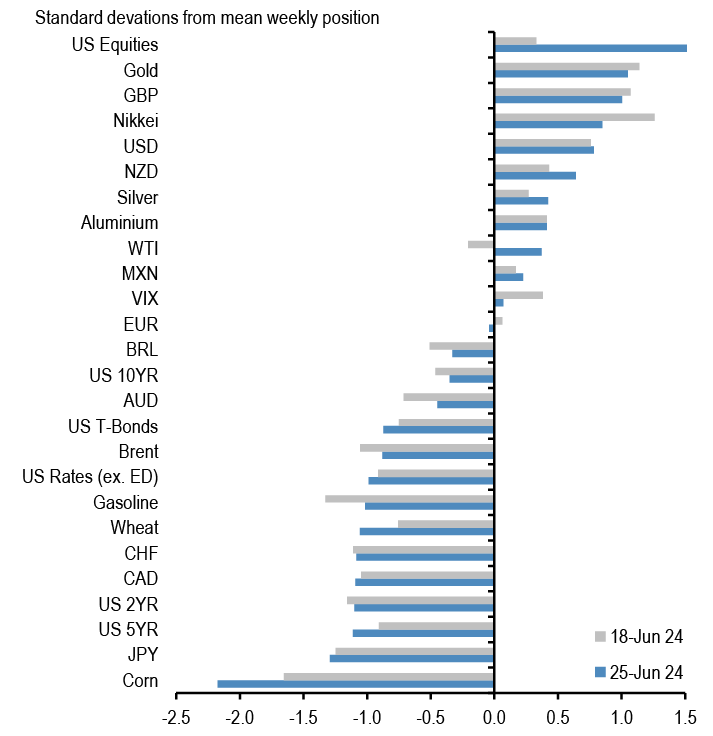
Chart A12: Weekly Spec Position Monitor
Net spec positions are proxied by the number of long contracts minus the number of short contracts using the speculative category of the Commitments of Traders reports (as reported by CFTC). To proxy for speculative investors for equity and US Treasury bond futures positions we use Asset managers and leveraged funds (see Chart A13), whereas for other assets we use the legacy Non-Commercial category. This net position is then converted to a dollar amount by multiplying by the contract size and then the corresponding futures price. We then scale the net positions by open interest. The chart shows the z-score of these net positions. US rates is a duration-weighted composite of the individual UST futures contracts excluding the Eurodollar contract.
Source: Bloomberg Finance L.P., CFTC, J.P. Morgan
Chart A14: Spec position indicator on Risky vs. Safe currencies
Difference between net spec positions on risky & safe currencies. Net spec position is calculated in USD across 5 ‘risky’ and 3 ‘safe’ currencies (safe currencies also include Gold). These positions are then scaled by open interest and we take an average of ‘risky’ and ‘safe’ assets to create two series. The chart is then simply the difference between the“risky” and “safe” series. The final series shown in the chart below is demeaned using data since 2006. The risky currencies are: AUD, NZD,CAD, MXN and BRL. The safe currencies are: JPY, CHF and Gold.
Source: Bloomberg Finance L.P., CFTC, J.P. Morgan.
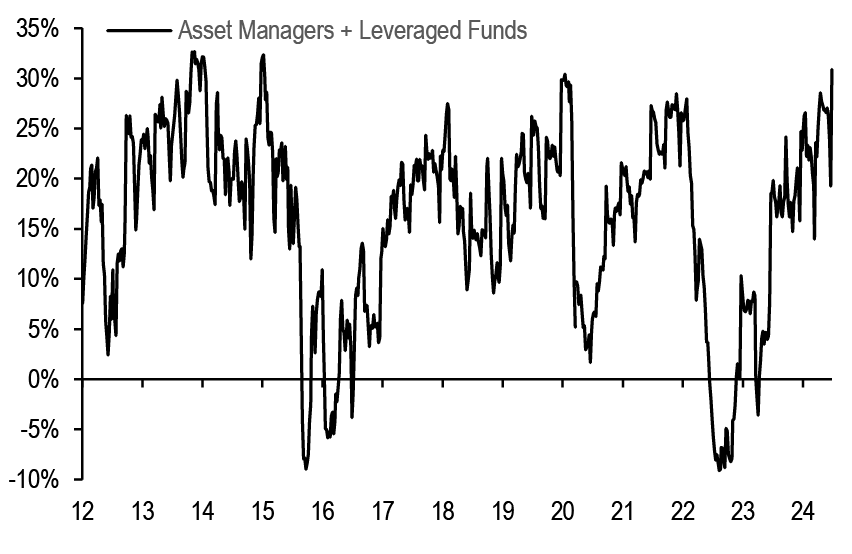
Chart A13: Positions in US equity futures by Asset managers and Leveraged funds
CFTC positions in US equity futures by Leveraged funds and Asset managers (as a % of open interest). It is an aggregate of the S&P500, DowJones, NASDAQ and their Mini futures contracts.
Source: CFTC, Bloomberg Finance L.P. and J.P. Morgan
Chart A15: Spec position indicator on US equity futures vs. intermediate sector UST futures
Difference between net spec positions on US equity futures vs.intermediate sector UST futures. This indicator is derived by the difference between total CFTC positions in US equity futures by Asset managers + Leveraged Funds scaled by open interest minus the Asset managers + Leveraged Funds spec position on intermediate sector UST futures (i.e. all UST futures duration weighted ex ED and ex 2Y UST futures) also scaled by open interest.
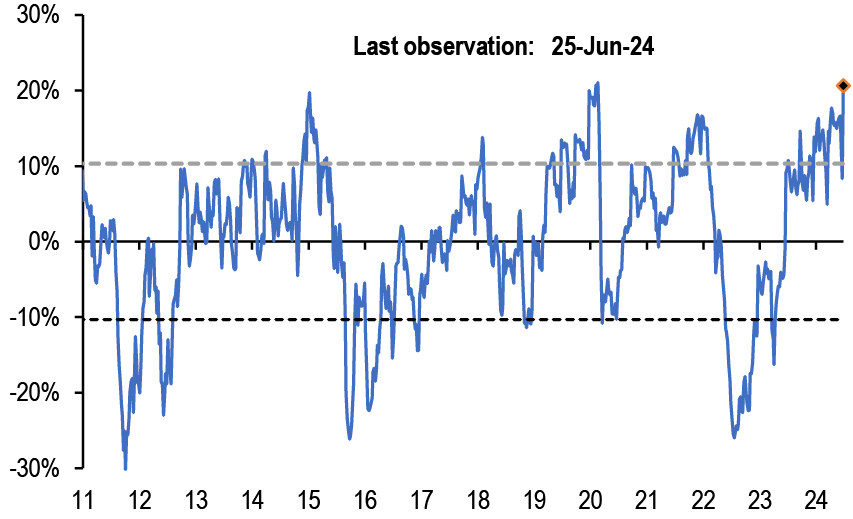
Source: CFTC, Bloomberg Finance L.P. and J.P. Morgan
Mutual fund and hedge fund betas
Chart A16: 21-day rolling beta of 20 biggest active US bond mutual fund managers with respect to the US Agg Bond Index
The dotted line shows the average beta since 2013.
Source: Bloomberg Finance L.P., J.P. Morgan.
Chart A17: 21-day rolling beta of 20 biggest active Euro bond mutual fund managers with respect to the Euro Agg Bond Index
The dotted line shows the average beta since 2013.
Source: Bloomberg Finance L.P., J.P. Morgan.
Chart A18: Performance of various type of investors
The table depicts the performance of various types of investors in % as of 10th June 2024.
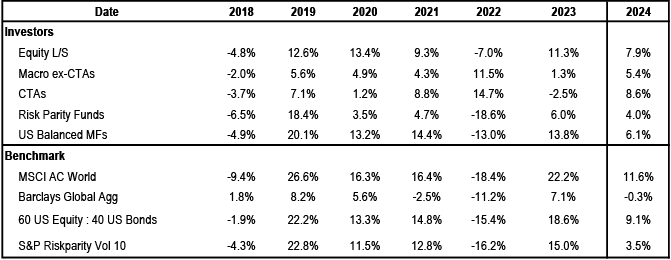
Source: Bloomberg Finance L.P., HFR, Pivotal Path, J.P. Morgan.
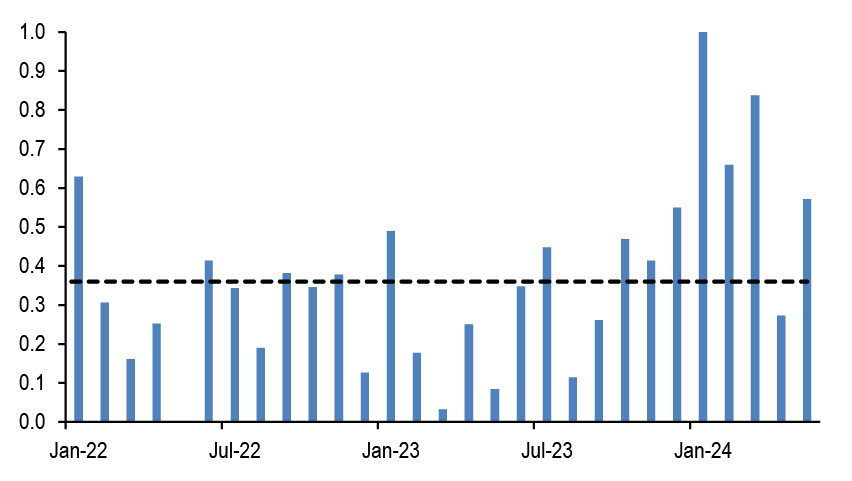
Chart A19: Momentum signals for 10Y UST and 10Y Bunds
Average z-score of Short- and Long-term momentum signal in our Trend Following Strategy framework shown in Tables A3 and A4 below in the Appendix
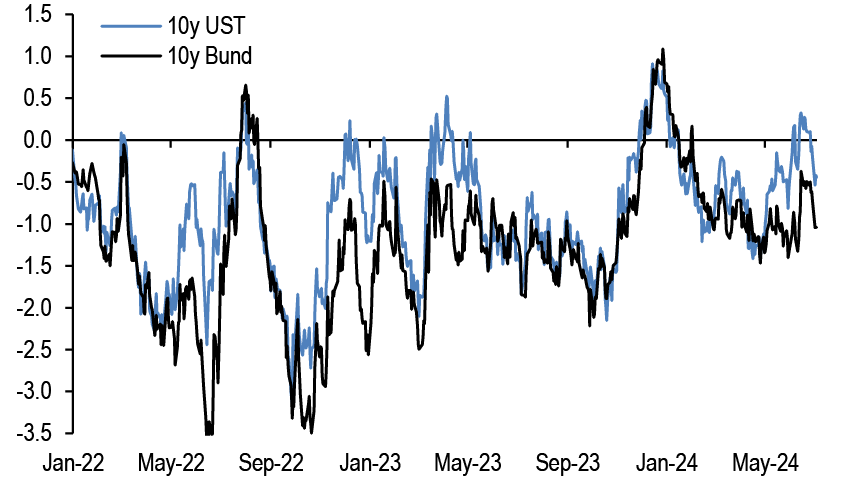
Source: Bloomberg Finance L.P., J.P. Morgan.
Chart A20: Momentum signals for S&P500
Average z-score of Short- and Long-term momentum signal in our Trend Following Strategy framework shown in Tables A3 and A4 below in the Appendix.
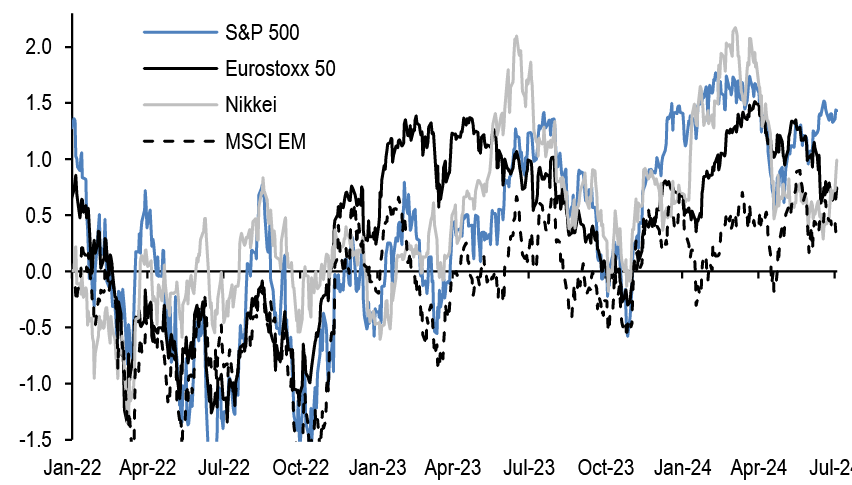
Source: Bloomberg Finance L.P., J.P. Morgan.
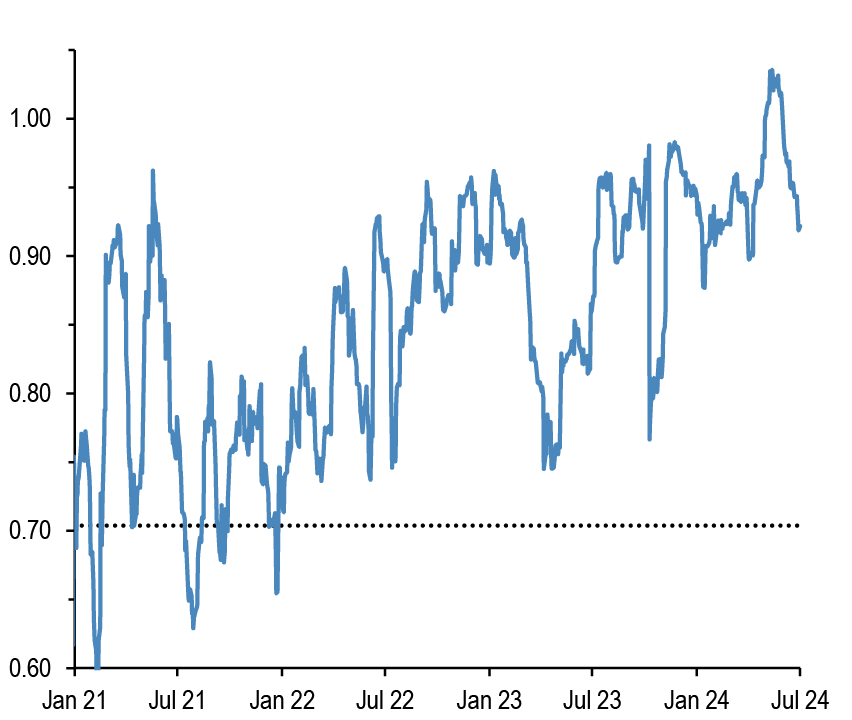
Chart A21: Equity beta of US Balanced Mutual funds and Risk Parity funds
Rolling 21-day equity beta based on a bivariate regression of the daily returns of our Balanced Mutual fund and Risk Parity fund return indices to the daily returns of the S&P 500 and BarCap US Agg indices. Given that these funds invest in both equities and bonds we believe that the bivariate regression will be more suitable for these funds. Our risk parity index consists of 25 daily reporting Risk Parity funds. Our Balanced Mutual fund index includes the top 20 US-based active funds by assets and that have existed since 2006. Our Balanced Mutual fund index has a total AUM of$700bn, which is around half of the total AUM of $1.5tr of US based Balanced funds which we believe to be a good proxy of the overall industry It excludes tracker funds and funds with a low tracking error. Dotted lines are average since 2015.
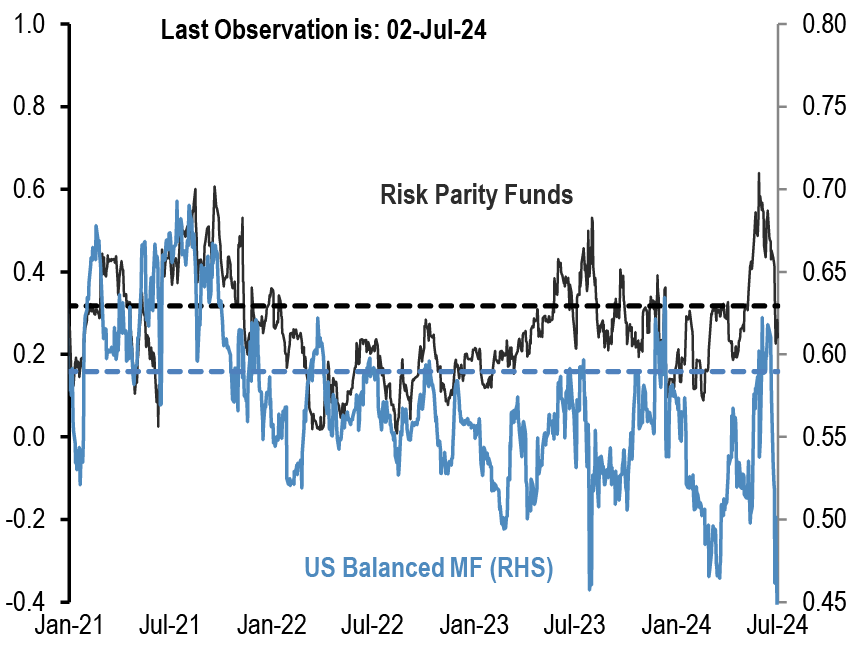
Source: Bloomberg Finance L.P., J.P. Morgan.
Chart A22: Equity beta of monthly reporting Equity Long/Short hedge funds
Proxied by the ratio of the monthly performance of Pivotal Path Asset-Weighted Equity Hedge fund index divided by the monthly performance of MSCI ACWorld Index.
Source: Bloomberg Finance L.P., Pivotal Path, J.P. Morgan
Chart A23: USD exposure of currency hedge funds
The net spec position in the USD as reported by the CFTC. Spec is the non-commercial category from the CFTC.
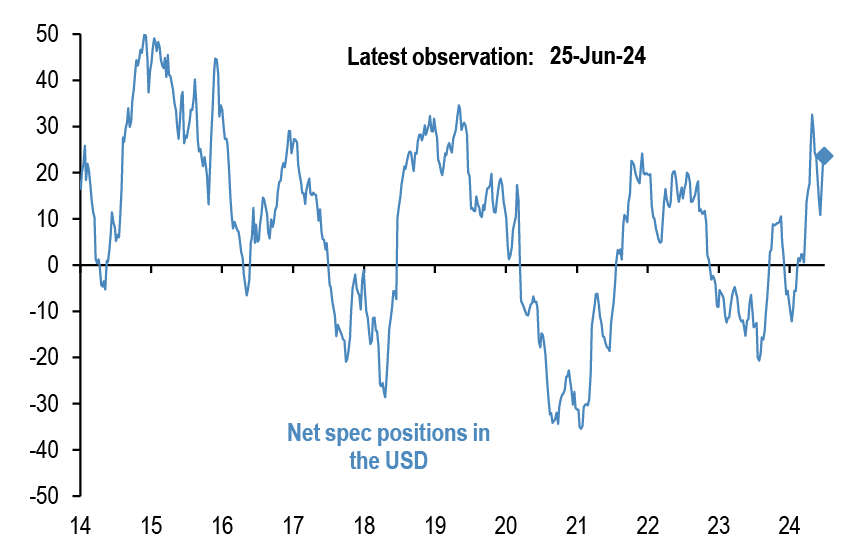
Source: CFTC, Barclay, Datastream, Bloomberg Finance L.P., J.P. Morgan.
CTAs – Trend following investors’ momentum indicators
Table A3: Simple return momentum trading rules across various commodities
Optimal lookback period of each momentum strategy combined with a mean reversion indicator that turns signal neutral when momentum z-score more than 1.5 standard deviations above or below mean, and a filter that turns neutral when the z-score is low (below 0.05 and above -0.05) to avoid excessive trading. Lookbacks, current signals and z-scores are shown for shorter-term and longer-term momentum separately, along with performance of a combined signal. Annualized return, volatility and
information ratio of the signal; current signal; and z-score of the current return over the relevant lookback period; data from 1999 onward.
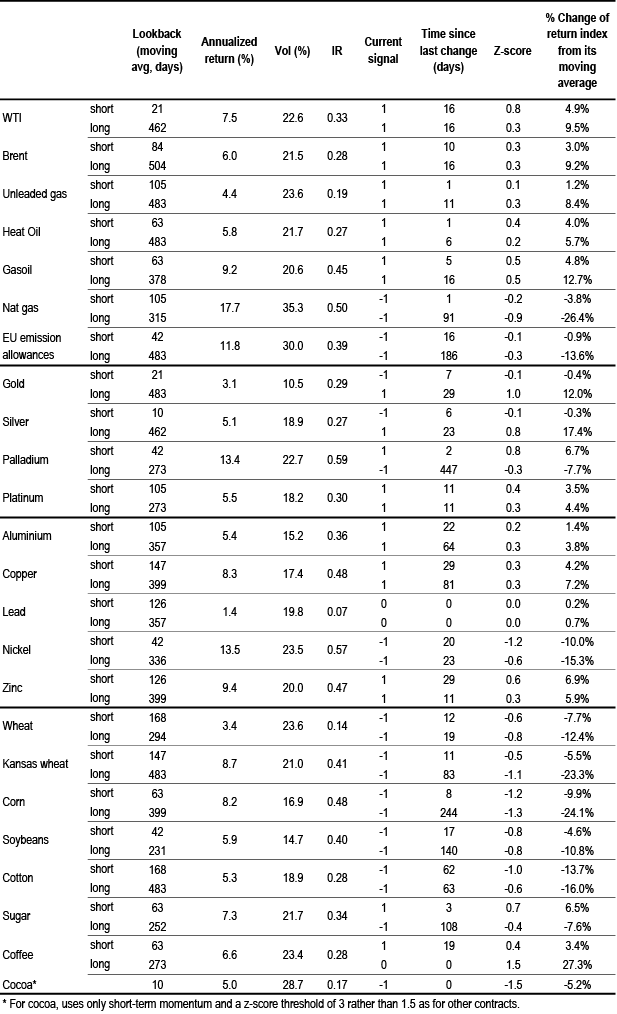
Source: Bloomberg Finance L.P., J.P. Morgan calculations.
Table A4: Simple return momentum trading rules across international equity indices, bond futures and FX
Optimal lookback period of each momentum strategy combined with a mean reversion indicator that turns signal neutral when momentum z-score more than 1.5 standard deviations above or below mean, and a filter that turns neutral when the z-score is low (below 0.05 and above -0.05) to avoid excessive trading. Lookbacks, current signals and z-scores are shown for shorter-term and longer-term momentum separately, along with performance of a combined signal. Annualized return, volatility and
information ratio of the signal; current signal; and z-score of the current return over the relevant lookback period; data from 1999 onward.
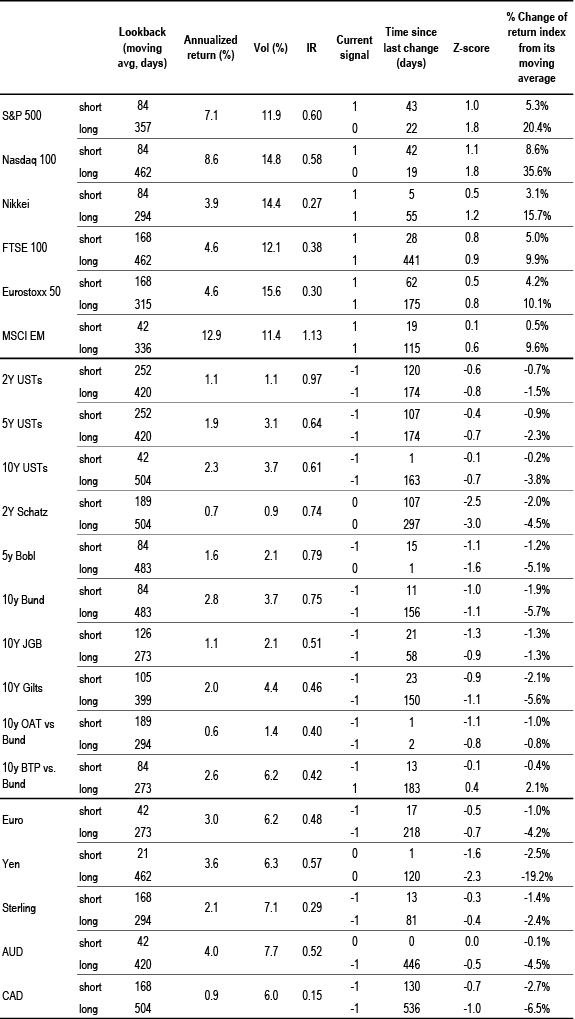
Source: Bloomberg Finance L.P., J.P. Morgan calculations.
Corporate Activity
Chart A24: G4 non-financial corporate capex and cash flow as % of GDP
% of GDP, G4 includes the US, the UK, the Euro area and Japan. Last observation as of Q4 2023.
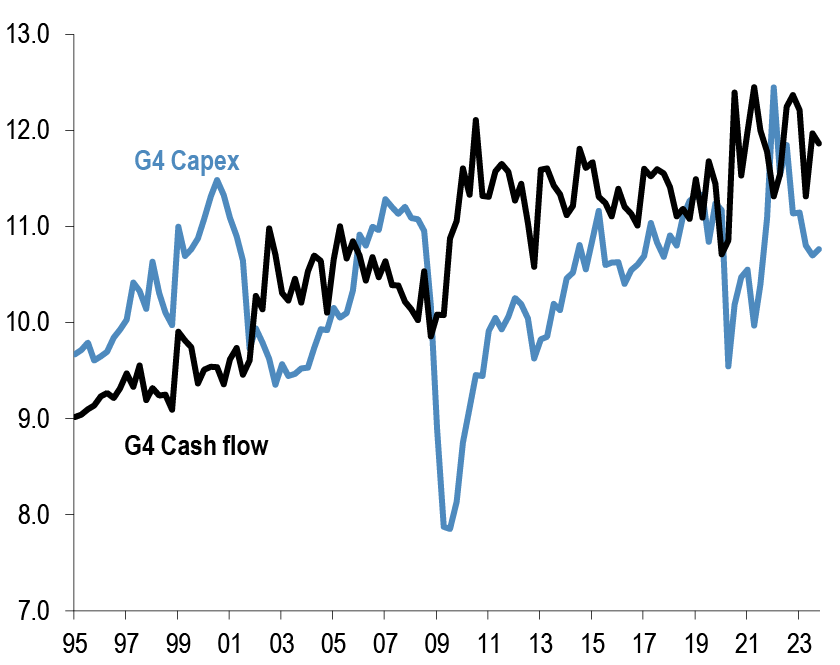
Source: ECB, BOJ, BOE, Federal Reserve flow of funds, J.P. Morgan.
Chart A25: G4 non-financial corporate sector net debt and equity issuance
$tr per quarter, G4 includes the US, the UK, the Euro area and Japan. Last observation as of Q4 2023.
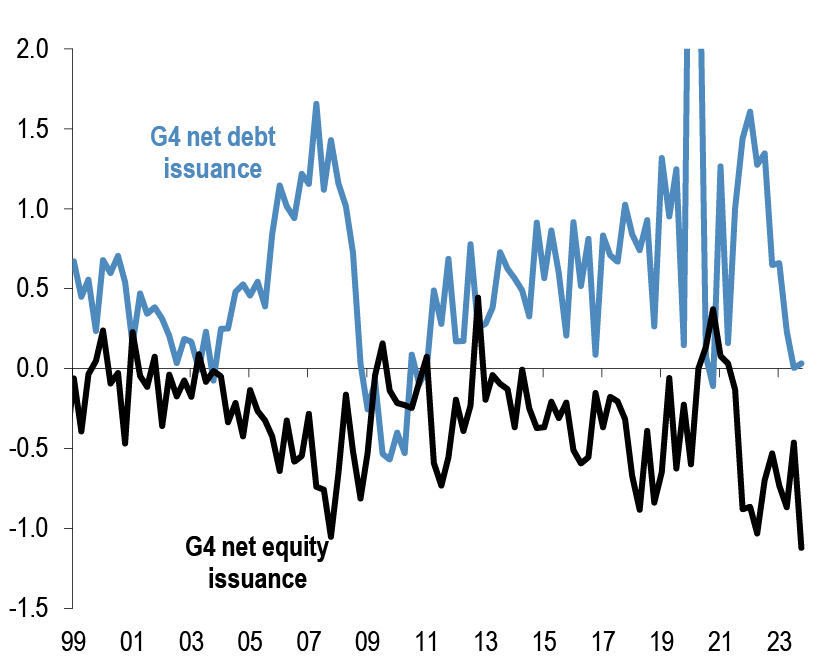
Source: ECB, BOJ, BOE, Federal Reserve flow of funds, J.P. Morgan.
Chart A26: Global M&A and LBO
$tr. M&A and LBOs are announced.
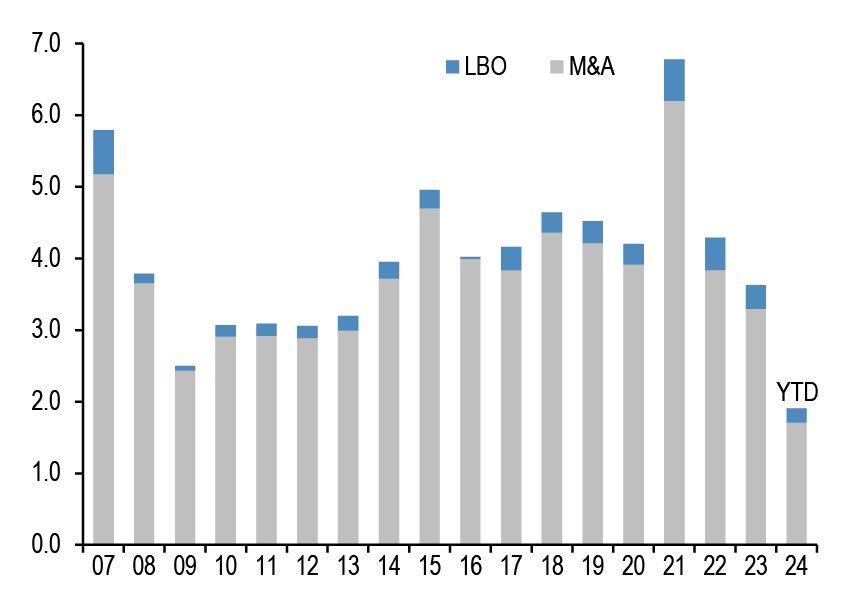
Source: Dealogic, J.P. Morgan.
Chart A27: US and non-US share buyback
$bn, are as of June’24. Buybacks are announced.
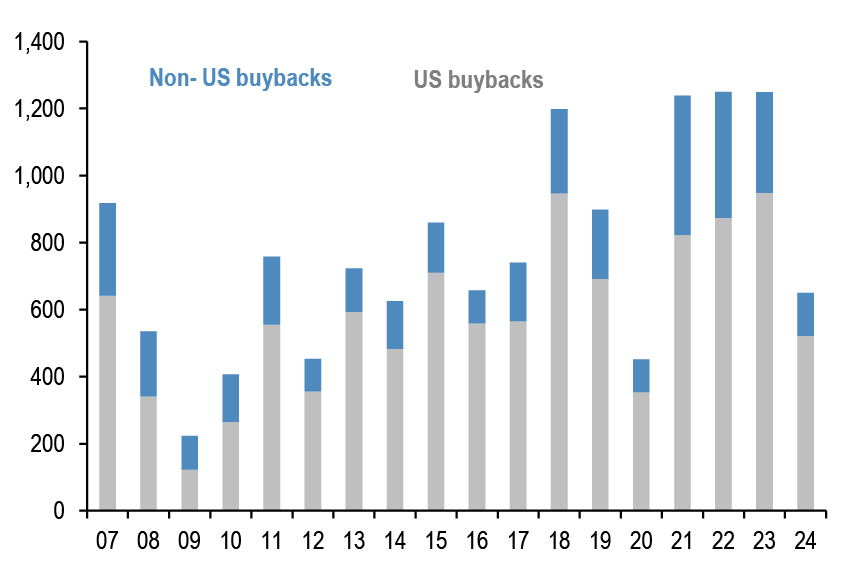
Source: Bloomberg Finance L.P., Thomson Reuters, J.P. Morgan
Pension fund and insurance company flows
Chart A28: G4 pension funds and insurance companies equity and bond flows
Equity and bond buying in $bn per quarter. G4 includes the US, the UK,Euro area and Japan. Last observation is Q4 2023.
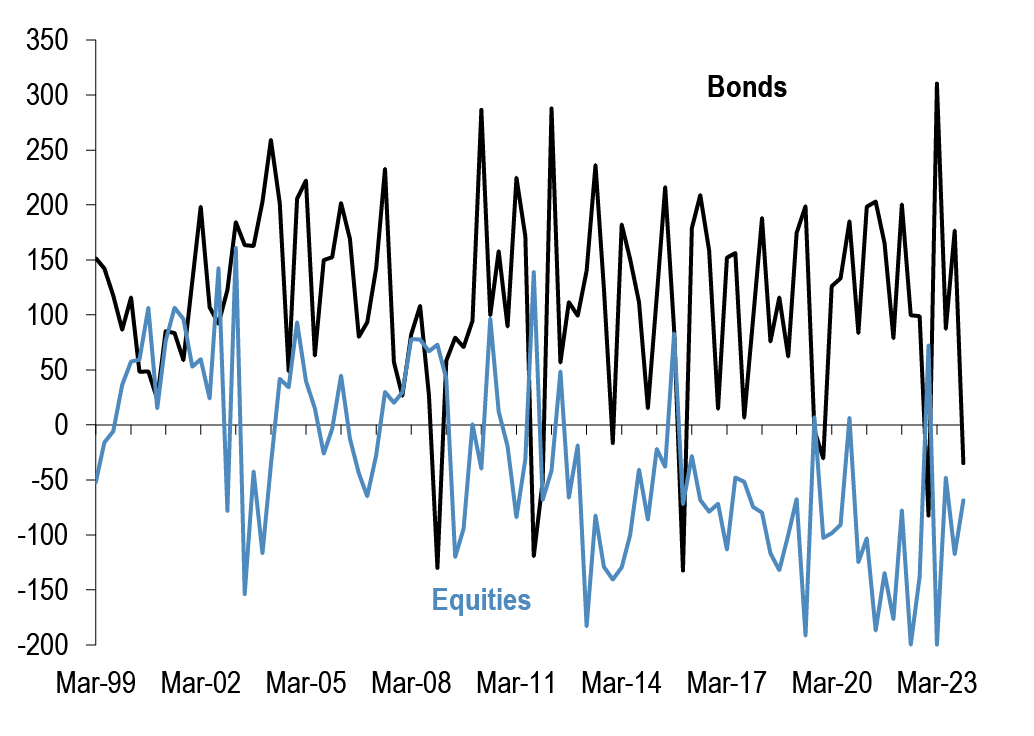
Source: ECB, BOJ, BOE, Federal Reserve flow of funds, J.P. Morgan.
Chart A29: G4 pension funds and insurance companies equity and bond levels
Equity and bond as % of total assets per quarter. G4 includes the US, the UK, Euro area and Japan. Last observation is Q4 2023.
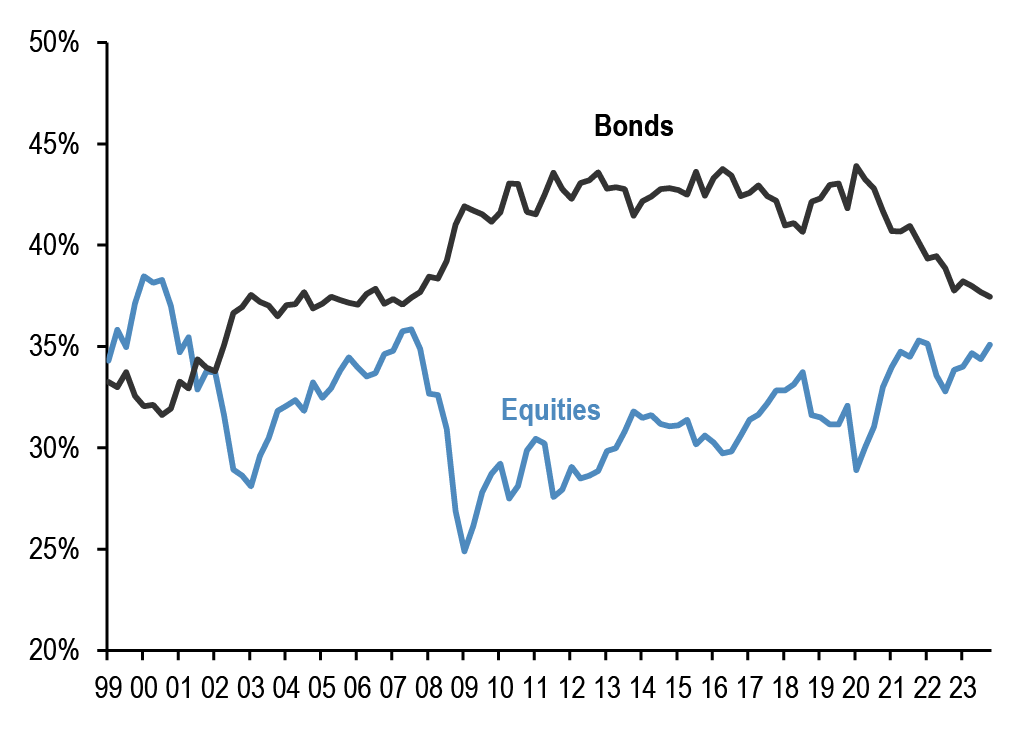
Source: ECB, BOJ, BOE, Federal Reserve flow of funds., J.P. Morgan
Chart A30: Pension fund deficits
US$bn. For US, funded status of the 100 largest corporate defined benefit pension plans, from Milliman. For UK, funded status of the defined benefit schemes eligible for entry to the Pension Protection Fund, converted to US$at today’s exchange rates.
Last obs. is May’24 for US & UK.
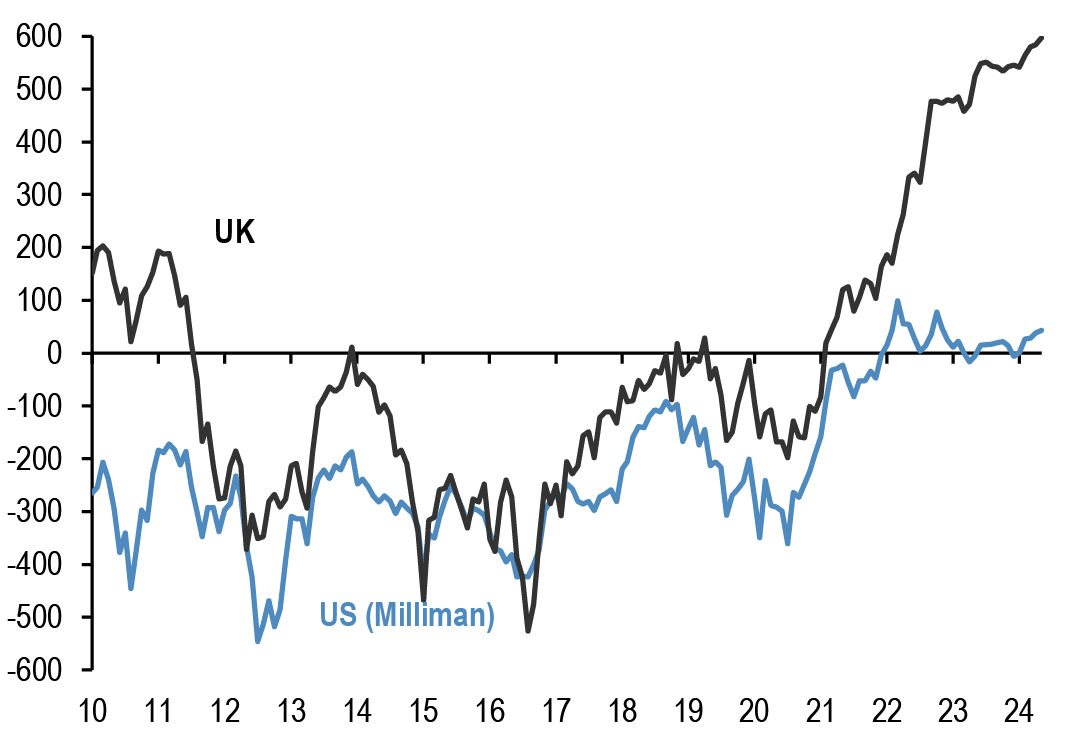
Source: Milliman, UK Pension Protection Fund, J.P. Morgan.
Chart A31: G4 pension funds and insurance companies cash and alternatives levels
Cash and alternative investments as % of total assets per quarter. G4 includes the US, the UK, Euro area and Japan. Last observation is Q4 2023.
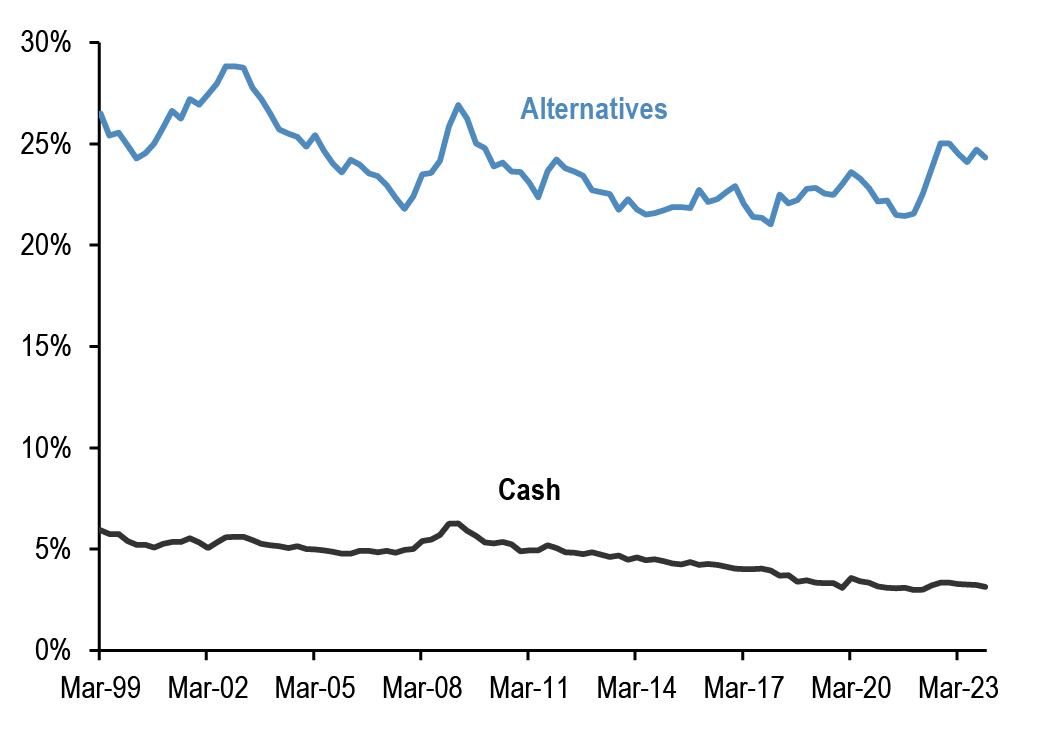
Source: ECB, BOJ, BOE, Federal Reserve flow of funds, J.P. Morgan.
Credit Creation
Chart A32: Credit creation in the US, Japan and Euro area
Rolling sum of 4-quarter credit creation as % of GDP. Credit creation includes both bank loans as well as net debt issuance by non-financial corporations and households. Last obs. is Q4’23 for Japan, & Euro Area and Q1’24 for US.
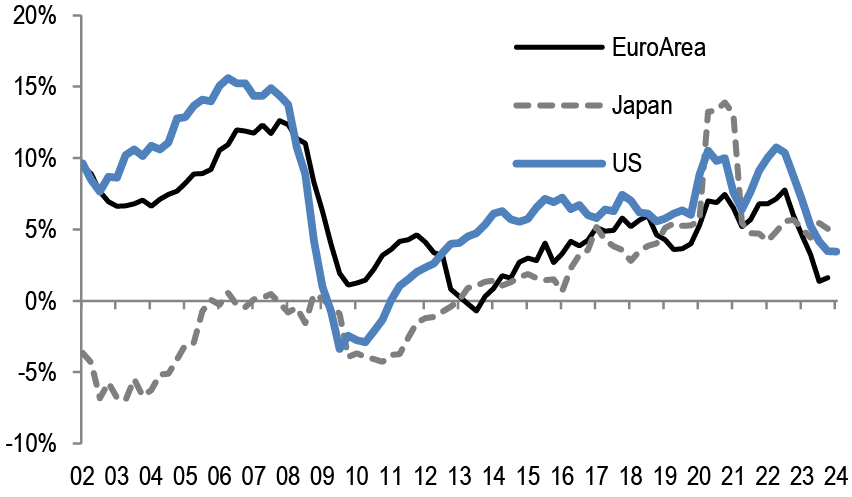
Source: Fed, ECB, BoJ, Bloomberg Finance L.P., and J.P. Morgan calculations.
Chart A33: Credit creation in EM
Rolling sum of 4-quarter credit creation as % of GDP. Credit creation includes both bank loans as well as net debt issuance by non-financial corporations and households. Last obs. is for Q3’23.
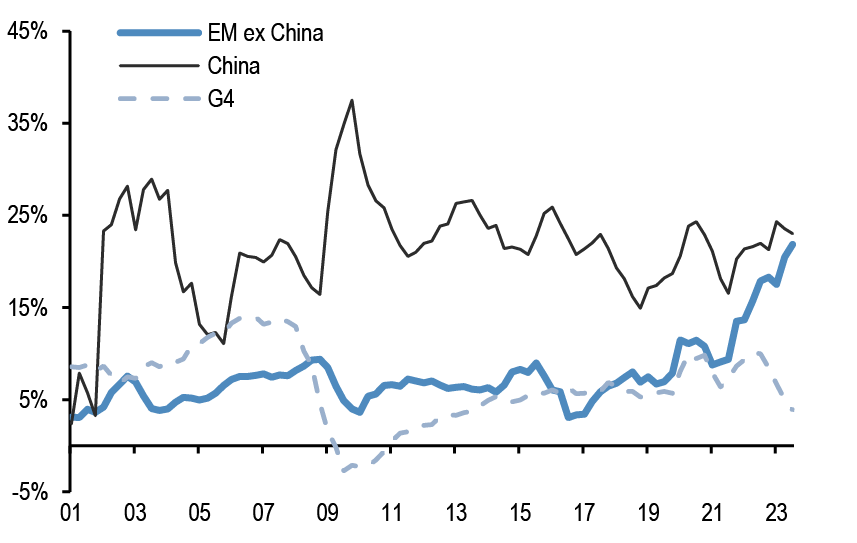
Source: G4 Central banks FoF, BIS, ICI, Barcap, Bloomberg Finance L.P., IMF, and J.P.Morgan calculation
Chart A34: Monthly net issuance of US HG bonds
$bn. May 2024.
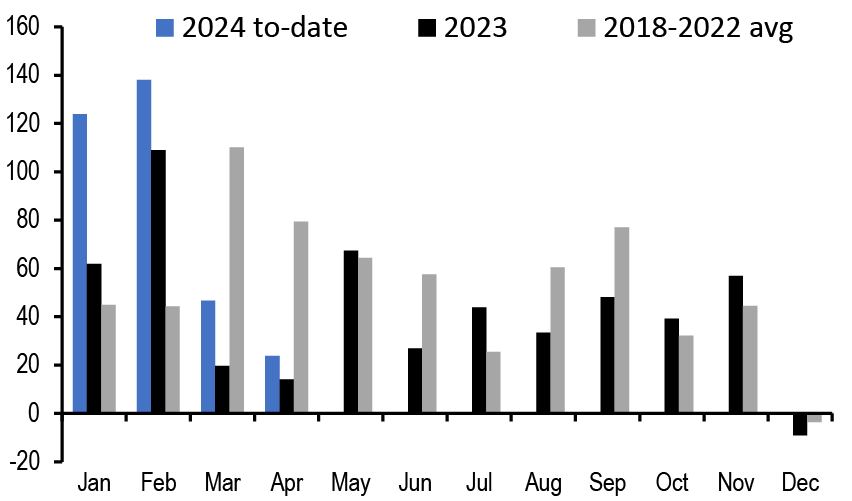
Source: Dealogic, J.P. Morgan
Table A5: Equity and Bond issuance
$bn, Equity supply and corporate announcements are based on announced deals, not completed. M&A is announced deal value and buybacks are announced transactions. Y/Y change is change in YTD announcements over the same period last year.
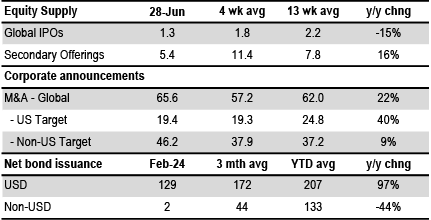
Source: Bloomberg Finance L.P., Dealogic, Thomson Reuters, J.P. Morgan.
Bitcoin monitor
Chart A35: Our Bitcoin position proxy based on open interest in CME Bitcoin futures contracts
In number of contracts. Last obs. for 2nd July 2024.
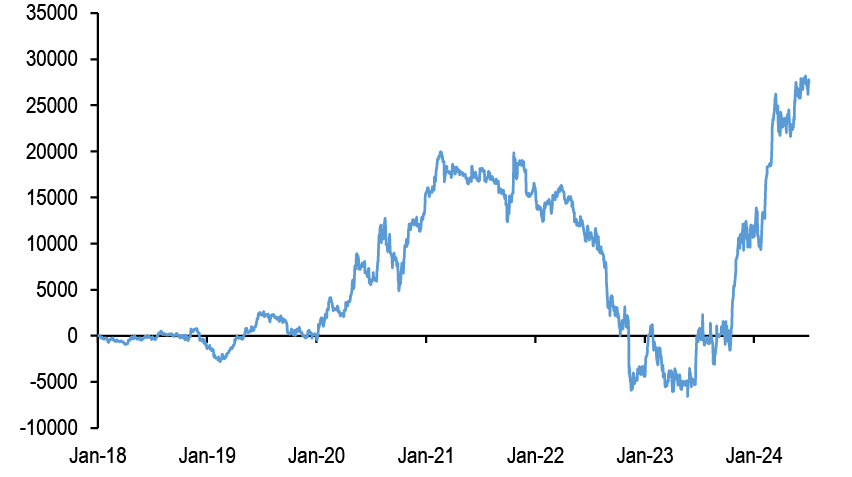
Source: Bloomberg Finance L.P., J.P. Morgan
Chart A36: Cumulative Flows in all Bitcoin funds and Gold ETF holdings
Both the y-axis in $bn.
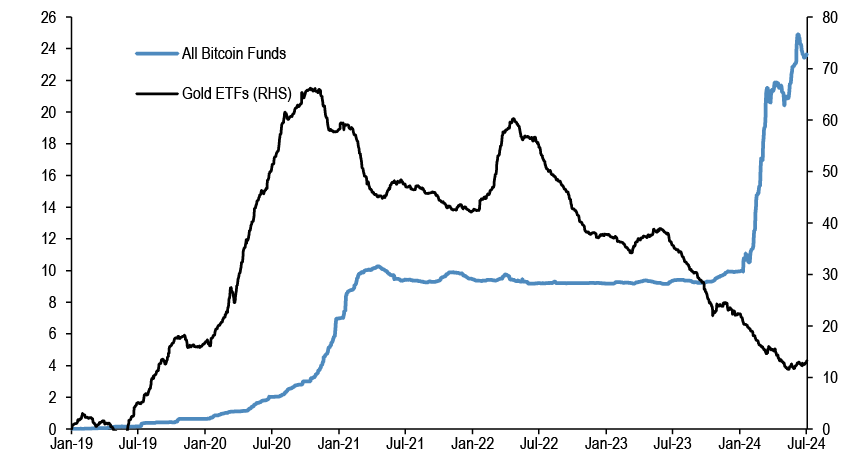
Source: Bloomberg Finance L.P., J.P. Morgan.
Chart A37: Ratio of Bitcoin market price to production cost
Based on the cost of production approach following Hayes (2018).
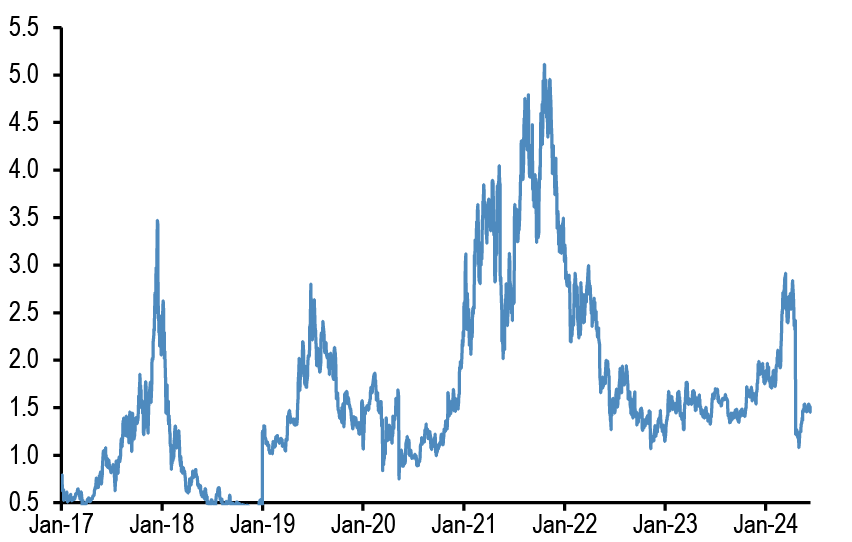
Source: Bitinfocharts, J.P. Morgan
Chart A38: Flow pace into publicly-listed Bitcoin funds including Bitcoin ETFs
$mm per week, 4-week rolling average flow.
Source: Bloomberg Finance L.P., J.P. Morgan.
Japanese flows and positions
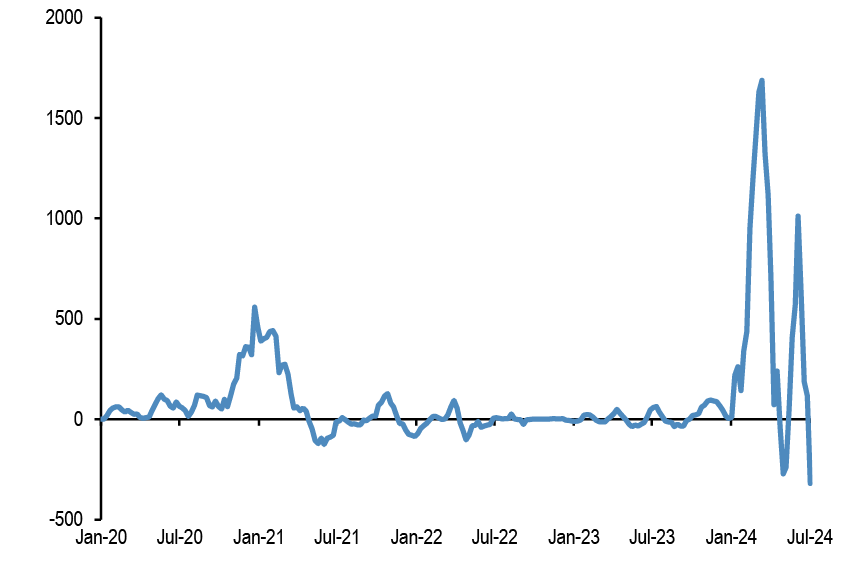
Chart A39: Tokyo Stock Exchange margin trading: total buys minus total sells
In bn of shares. Topix on right axis.
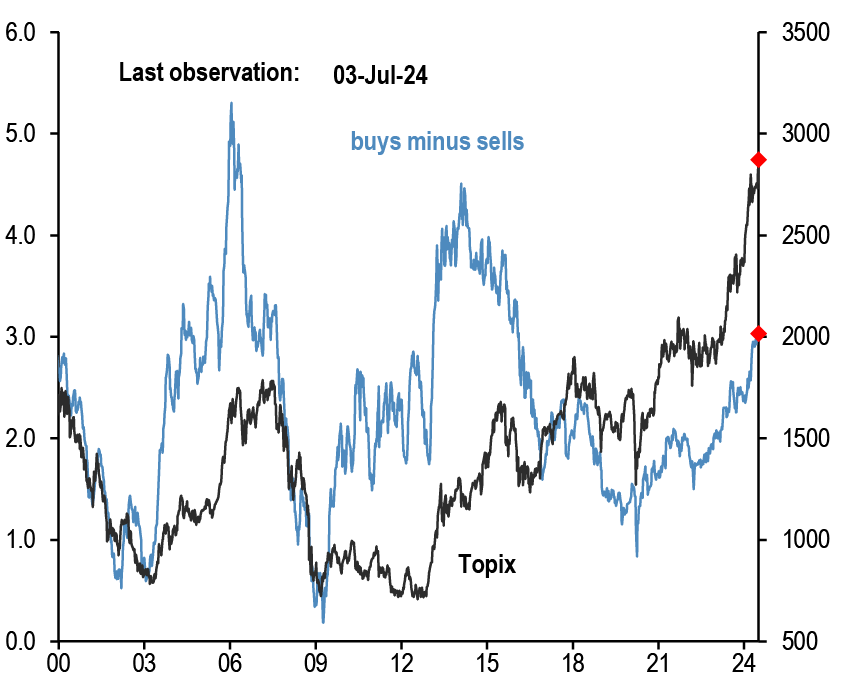
Source: Tokyo Stock Exchange, Bloomberg Finance L.P., J.P. Morgan.
Chart A40: Monthly net purchases of Japanese bonds and Japanese equities by foreign residents
$bn, Last weekly obs. is for 21st June’ 24.
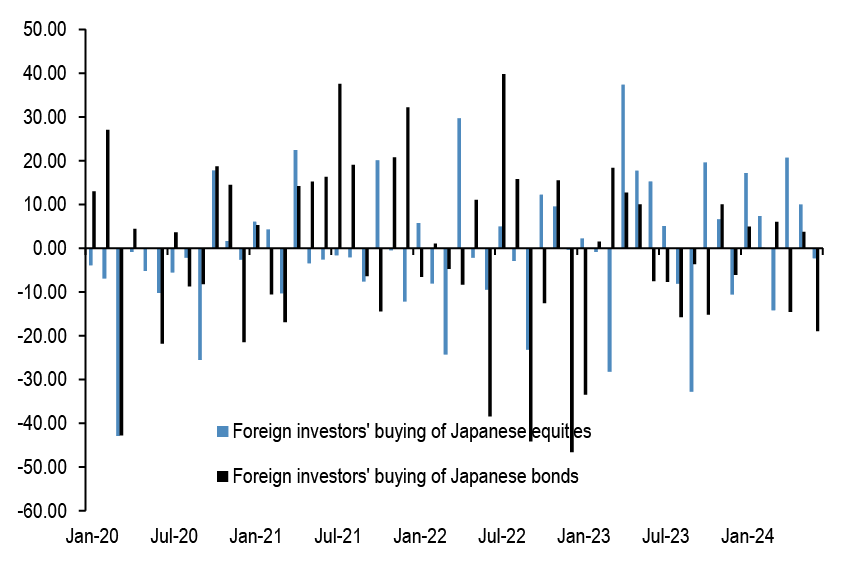
Source: Japan MoF, Bloomberg Finance L.P., and J.P. Morgan.
Chart A41: Monthly net purchases of foreign bonds and foreign equities by Japanese residents
$bn, Last weekly obs. is for 21st June’ 24.
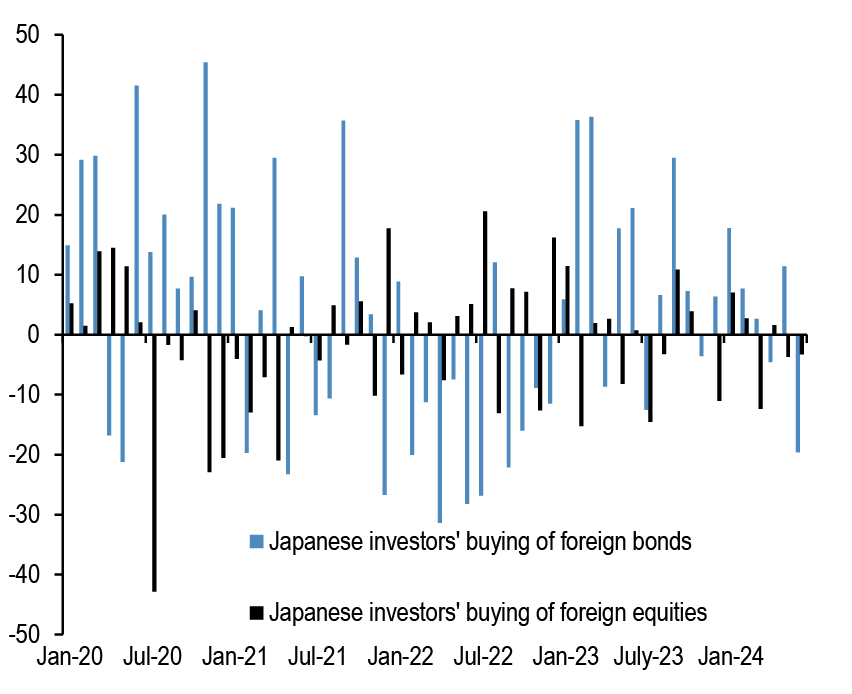
Source: Japan MoF, Bloomberg Finance L.P., and J.P. Morgan.
Chart A42: Overseas CFTC spec positions
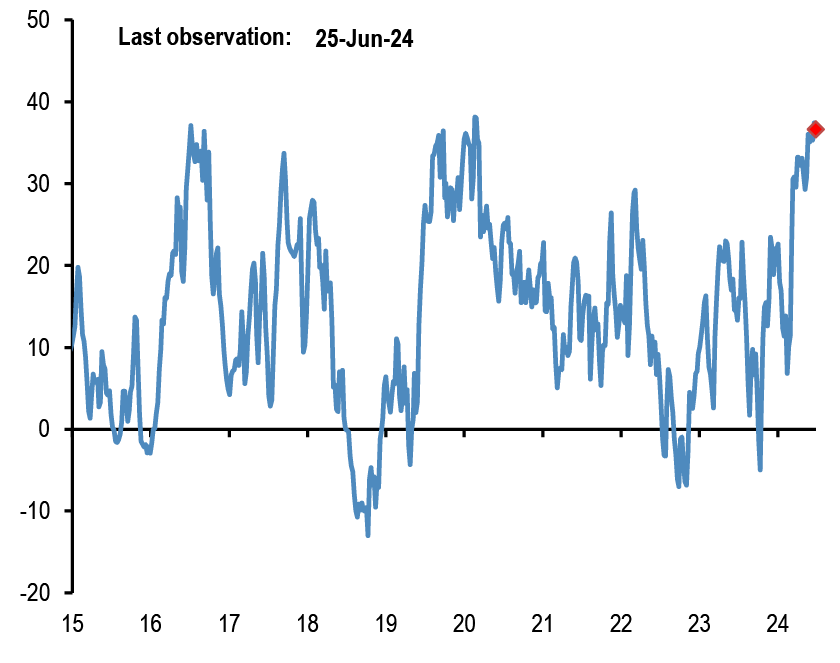
CFTC spec positions are in $bn. For Nikkei we use CFTC positions in Nikkei futures (USD & JPY) by Leveraged funds and Asset managers.
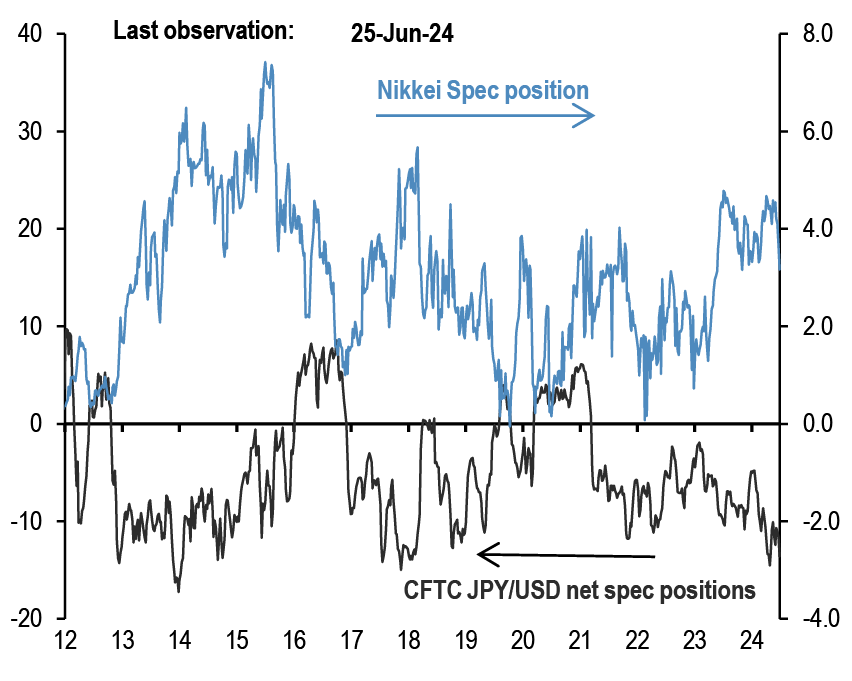
Source: Bloomberg Finance L.P., CFTC, J.P. Morgan calculations.
Commodity flows and positions
Chart A43: Gold spec positions
$bn. CFTC net long minus short position in futures for the Managed Money category.
Source: CFTC, Bloomberg Finance L.P., J.P. Morgan.
Chart A44: Gold ETFs
Mn troy oz. Physical gold held by all gold ETFs globally.
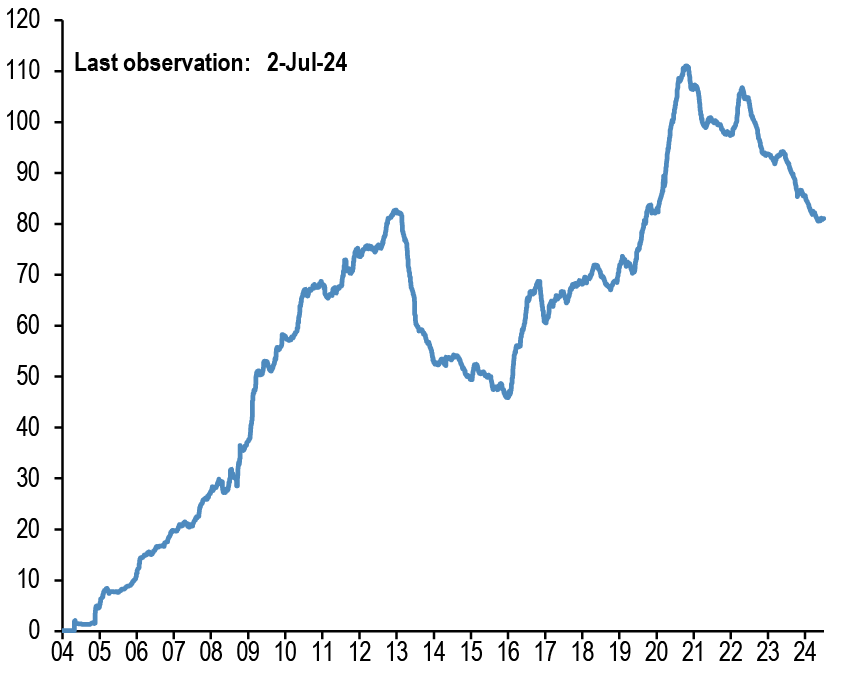
Source: Bloomberg Finance L.P., J.P. Morgan.
Chart A45: Oil spec positions
Net spec positions divided by open interest. CFTC futures positions for WTI and Brent are net long minus short for the Managed Money category.
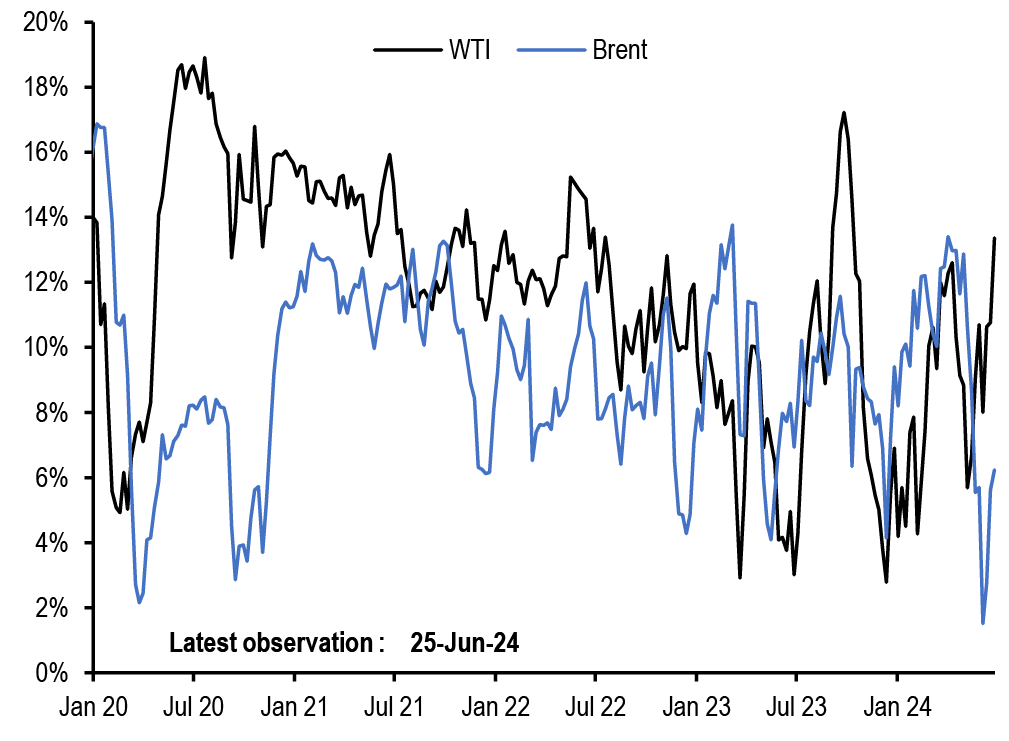
Source: CFTC, Bloomberg Finance L.P., J.P. Morgan.
Chart A46: Energy ETF flows
Cumulative energy ETFs flow as a % of AUM. MLP refers to the Alerian MLP ETF.
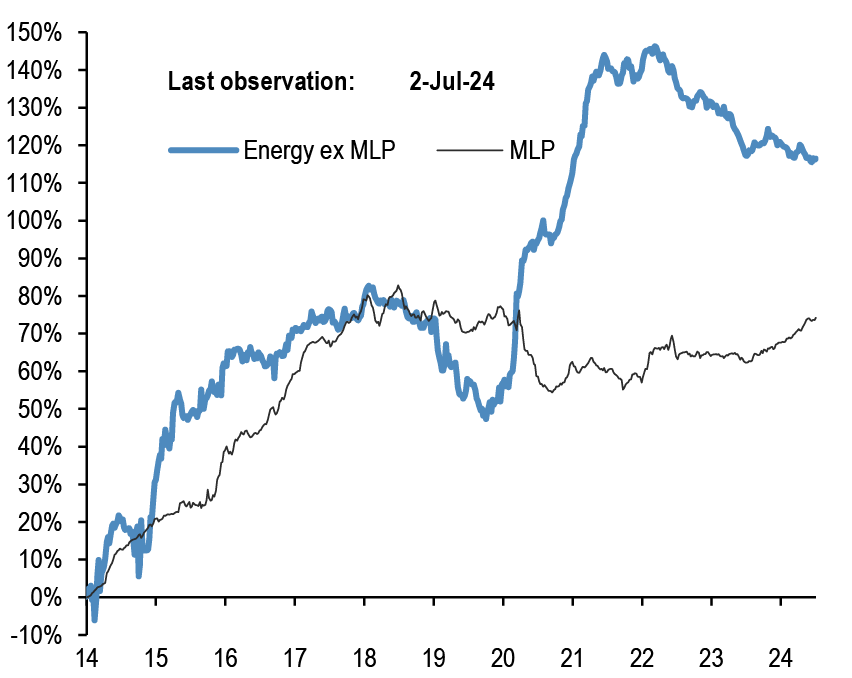
Source: CFTC, Bloomberg Finance L.P., J.P. Morgan.
Corporate FX hedging proxies
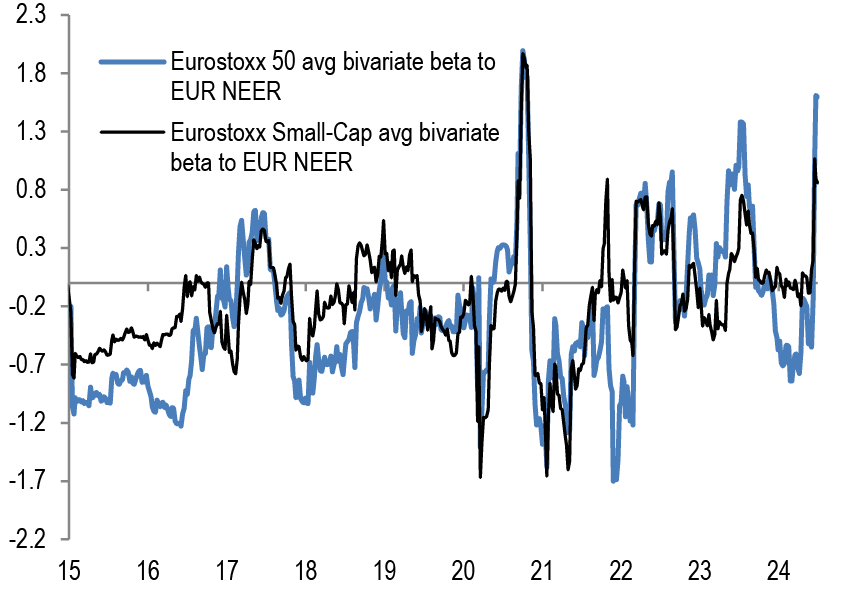
Chart A47: Average beta of Eurostoxx 50 companies and Eurostoxx Small-Cap to trade-weighted EUR
Rolling 26 weeks average betas based on a bivariate regression of the weekly returns of individual stocks in the Eurostoxx 50 index to the weekly returns of the MSCI AC World and JPM EUR Nominal broad effective exchange rate (NEER).
Source: Bloomberg Finance L.P., J.P. Morgan
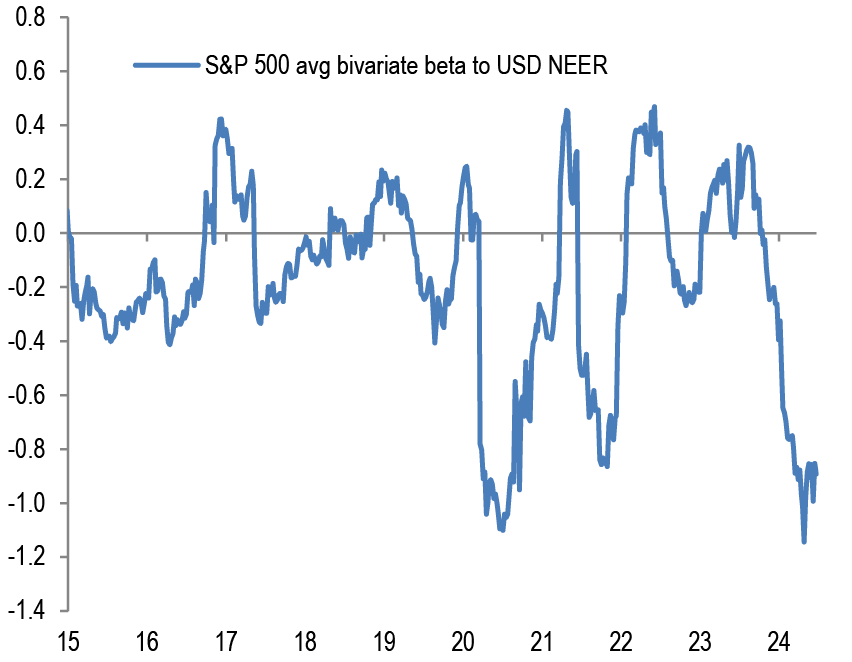
Chart A48: Average beta of S&P500 companies to trade-weighted US dollar
Rolling 26 weeks average betas based on a bivariate regression of the weekly returns of stocks in the S&P500 index to the weekly returns of the MSCI AC World and JPM USD Nominal broad effective exchange rate(NEER).
Source: Bloomberg Finance L.P., J.P. Morgan
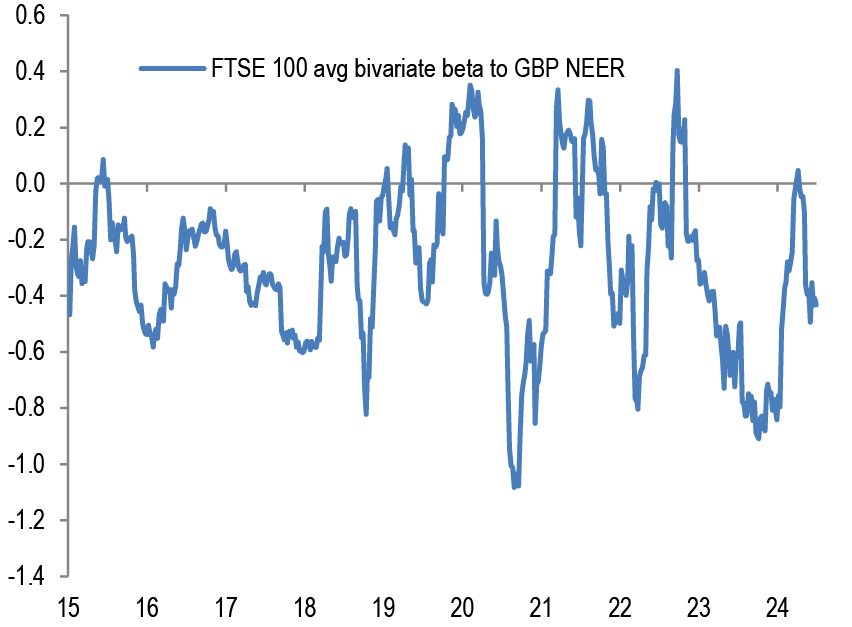
Chart A49: Average beta of FTSE 100 companies to trade-weighted GBP
Rolling 26 weeks average betas based on a bivariate regression of the weekly returns of individual stocks in the FTSE 100 index to the weekly returns of the MSCI AC World and JPM GBP Nominal broad effective exchange rate (NEER).
Source: Bloomberg Finance L.P., J.P. Morgan
Chart A50: Average beta of MSCI EM companies to trade-weighted EM Currency Index
Rolling 26 weeks average betas based on a bivariate regression of the weekly returns of individual stocks in the MSCI EM index to the weekly returns of the MSCI AC World and JPM EM Nominal broad effective exchange rate (NEER).
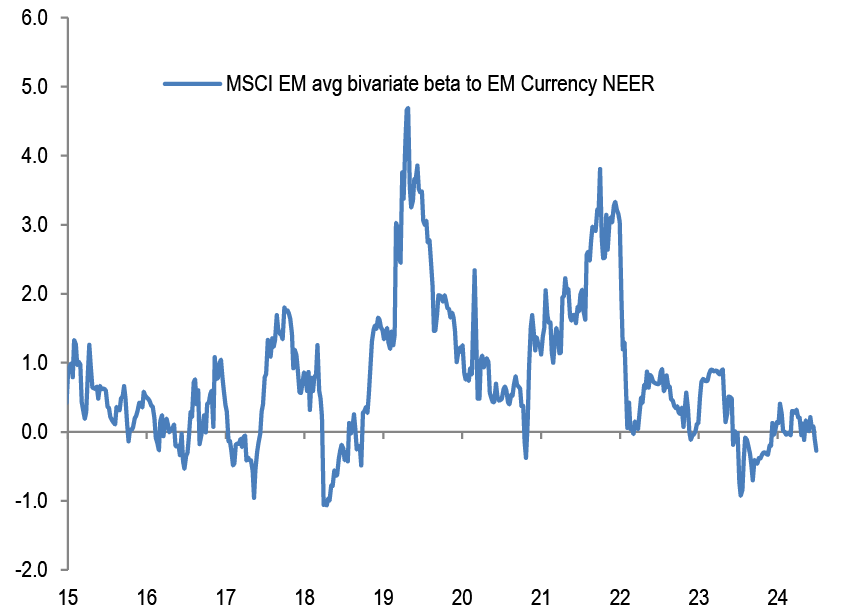
Source: Bloomberg Finance L.P., J.P. Morgan
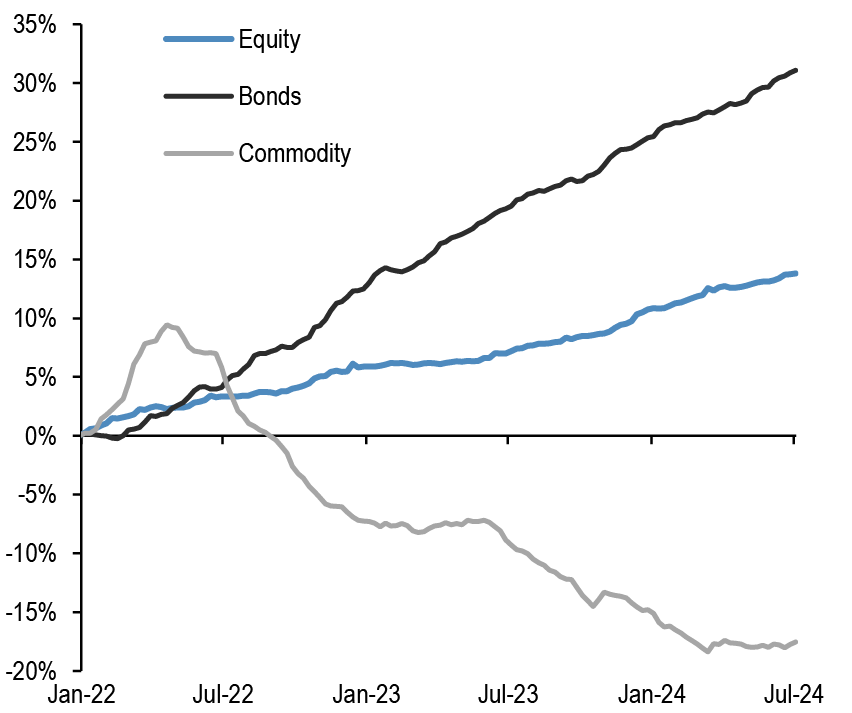
Non-Bank investors’ implied allocations
Chart A51: Implied equity allocation by non-bank investors globally
Global equities as % total holdings of equities/bonds/M2 by non-bank investors. Dotted lines are averages.
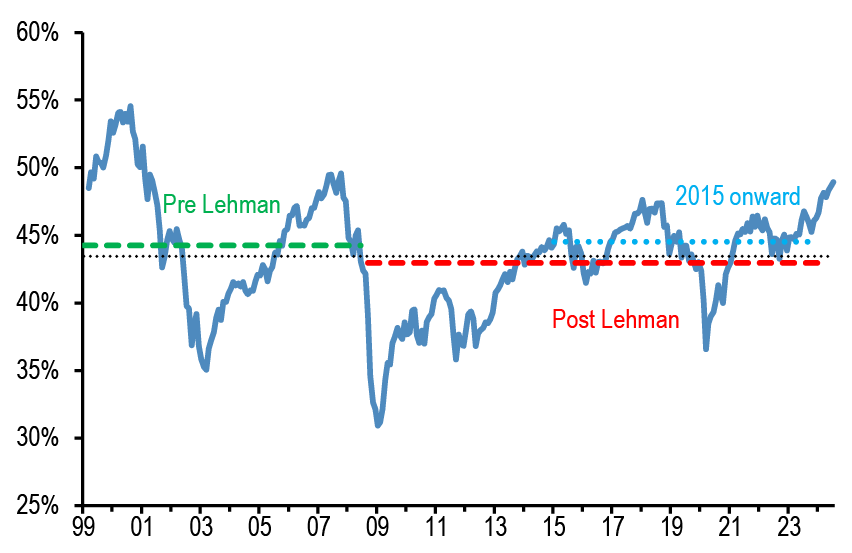
Source: Bloomberg Finance L.P., J.P. Morgan
Chart A52: Implied bond allocation by non-bank investors globally
Global bonds as % total holdings of equities/bonds/M2 by non-bank investors. Dotted lines are averages.
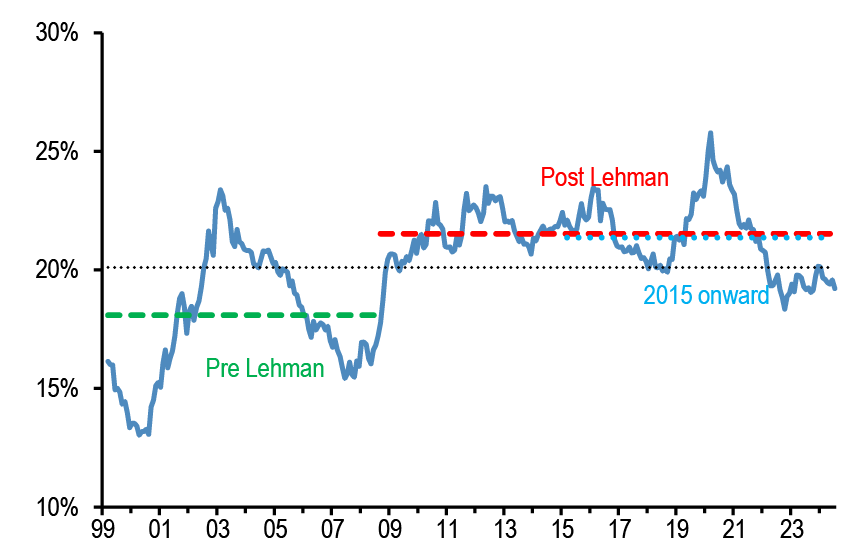
Source: Bloomberg Finance L.P., J.P. Morgan
Chart A53: Implied cash allocation by non-bank investors globally
Global cash held by non-bank investors as % total holdings of equities/bonds/M2 by non-bank investors. Dotted lines are averages.
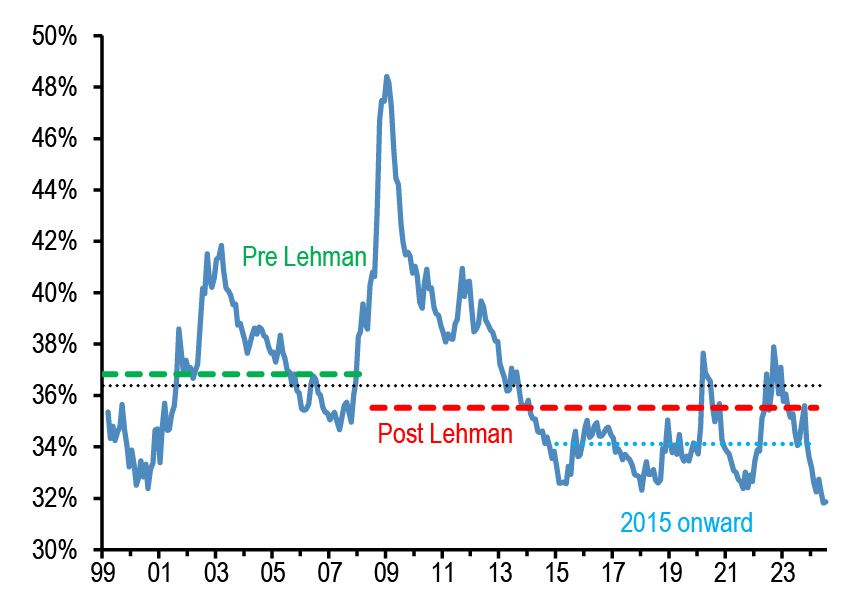
Source: Bloomberg Finance L.P., J.P. Morgan
Chart A54: Implied commodity allocation by non-bank investors globally
Proxied by the open interest of commodity futures ex gold as % of the stock of equities, bonds and cash held by non-bank investors globally.
Source: Bloomberg Finance L.P., J.P. Morgan