
This one’s optimistic
Broad improvements in Treasury market liquidity trends in 2024
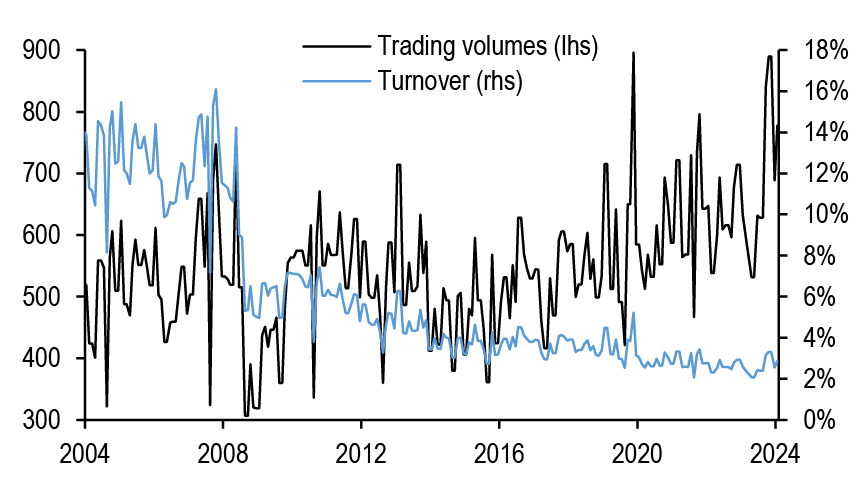
- Treasury trading volumes in 2024 have averaged $817bn daily, a 30% increase from 2023. Turnover has risen modestly but remains low, stabilizing after a decade-long decline. The 3- to 5-year sector has seen the highest volumes, followed by T-bills. Long-end volumes in the 20+ year sector are nearly triple those in the 10- to 20-year sector
- Market depth, has improved since early 2022 but remains 50% below its decade-long average. Depth is highly sensitive to volatility, which has declined from decade-long highs but remains above pre-COVID levels. Improvement is uneven across the curve, with the front end lagging
- Price impact, has declined from its pandemic-era peak and is now close to average levels observed since 2016, indicating a smaller footprint for each trade. The share of depth provided by more high frequency traders has been stable around 75% in the 10-year sector for the last three years. However, their share in the long end has been more variable, influenced by events like the UK LDI deleveraging and Treasury auction size increases
- The RMSE of our par curve has risen to 2-year highs, and increased dispersion has traditionally indicated deteriorating liquidity in off-the-run Treasuries and potential for deleveraging. A deeper dive shows increased dispersion is mainly evident at the front end. We think the recent rise in dispersion is overstated and largely reflects the outsized influence of a number of illiquid and deeply off the run bonds which were issued more than 20 years ago
- Combining various liquidity measures, the market functioning index shows that Treasury market liquidity is close to average levels observed over the last three years. The front end is the main exception
- Primary dealer inventories have risen above pandemic peaks, nearly 2 standard deviations above the 5-year average. Inventories as a share of total marketable debt remain below pre-GFC levels
- TIPS daily trading volumes have averaged $18.5bn YTD, close to averages observed in recent years, with daily turnover of the market excluding Fed holdings remaining just above 1%. TIPS volumes as a share of overall Treasury volumes have declined from their post-COVID peak but remain elevated on a historical basis...
- ...TRACE data reveal that TIPS trading volumes remain highly cyclical, with volumes rising on month-end, CPI release days, and auction days
- Overall, Treasury market liquidity has improved in 2024, with rising market depth, falling price impact, and moderate dispersion. Despite rising dealer inventories, market functioning remains relatively healthy, though weaker than pre-pandemic conditions. Elevated dealer balance sheets are a development to watch, given their impact during the pandemic
This one’s optimistic
Treasury market liquidity and functioning has been back at the forefront of conversations over the last week or so: the unwind of carry trades and signs that Treasury curve dispersion was rising led market participants to question whether the Treasury market was at the incipient stages of another round of dysfunction. Thus far, the deleveraging that occurred across various markets has not led to a broader deterioration in bond market liquidity. Nonetheless, we think it’s an opportune time to take an in-depth look at Treasury market liquidity and functioning. In the coming pages, we will dissect the overall state of affairs in Treasury market liquidity, from trading volumes, turnover and market depth, down to trading conditions in off-the-run Treasuries.
Overall, we find that broad measures of liquidity have been on an improving trend through 2024, supported by declining delivered volatility amid one of the longer Fed-on-hold periods in modern history. We also find that dispersion in off-the-run Treasuries has increased, but some of the recent concerns have been exaggerated by the presence of very small and highly illiquid bonds issued in the late-1990s. We also find little evidence of increased liquidity preference. However, it is notable that dealer positions, while still low compared to pre-GFC trends, have made new highs recently, approaching a share of total marketable debt outstanding that persisted just prior to the outbreak of the COVID-19 pandemic.
Trading volumes surge, but turnover stabilizes at low level
Figure 1: Trading volumes have increased 30% YTD from 2023, but turnover remains stuck at historically low levels...
Average daily Treasury trading volumes (lhs, $bn) versus daily Treasury market turnover (rhs; %); monthly data
Source: Federal Reserve Bank of New York, US Treasury
Figure 2: ..and most volumes are occurring in the intermediate sector
Average daily Treasury trading volumes by sector, YTD; $bn
| Type | Avg daily volumes | Share of total |
| T-bills | 176 | 20.0% |
| FRNs | 3 | 0.3% |
| 0-2y | 129 | 14.6% |
| 2-3y | 85 | 9.7% |
| 3-5y | 186 | 21.1% |
| 5-7y | 60 | 6.8% |
| 7-10y | 130 | 14.8% |
| 10-20y | 26 | 2.9% |
| 20y+ | 68 | 7.7% |
| <5y TIPS | 11 | 1.2% |
| 5-10y TIPS | 6 | 0.6% |
| >10y TIPS | 1 | 0.2% |
| Total | 881 | 100% |
Source: FINRA TRACE
From a high-level perspective, there has been a healthy increase in Treasury trading in 2024, as daily volumes have averaged $817bn YTD a 30% increase from 2023 ( Figure 1). This increase has outstripped the growth of the Treasury market, and turnover has risen modestly, but has merely stabilized at low levels after a decade of a declining trend. Along the curve, volumes have been generally focused in intermediates: by share the largest volumes YTD have been in the 3- to 5-year sector ( Figure 2), with T-bills seeing the second largest share of volumes on a notional basis. Within the details, it’s notable that volumes in the 3- to 5-year sector far outpace those in surrounding tenors, while at the long end, volumes in the 20+ year sector are nearly tripled those in the 10- to 20-year sector. To an extent this makes sense, as there is a two-year gap in the 2034-2036 sector where no securities exist, and even then, many of the bonds outstanding are original-issue 30-years from the GFC period with relative small free float, which trade less actively than less deeply off-the-runs at the very long end. Overall, though turnover is low, this is not a new dynamic, and it’s been more stable in recent years.
Depth and price impact point to improving liquidity conditions
Increased volumes indicate better liquidity conditions, but we have a bigger suite of liquidity measures which offer deeper insight into Treasury market functioning. Many of the other metrics we follow all indicate liquidity is stable to improving: market depth, our preferred measure of Treasury market liquidity, has been steadily improving since hitting its lows in early-2022 ( Figure 3). To be fair, market depth remains about 50% below its decade-long average, as Treasury market liquidity remains highly sensitive to uncertainty. Figure 4 shows total Treasury market depth regressed on the daily delivered volatility of our US Government Bond Index (GBI-US), and we see that depth decreases as volatility increases and vice versa. Though delivered volatility has declined this year from decade-long highs, it remains considerably above pre-COVID levels: uncertainty has declined as the Fed has held rates steady for the last 11 months, but the path for easing has been pushed back, and the Treasury market has experienced a wide 90bp range in 10-year yields YTD. Looking ahead, the empirical vol/rate directionality imply that volatility should decline further as yields decline, which would support a further increase in market depth as the Fed beigns easing. However, this is predicated on a Fed which eases because the disinflationary process resumes, not because an exogenous shock to the labor market forces aggressive easing.
Figure 3: Market depth has steadily improved from its nadir in mid-2022, but remains well below decade-long averages...
Duration-weighted Treasury market depth*, 1-month moving average; $mn 10-year Treasury equivalents
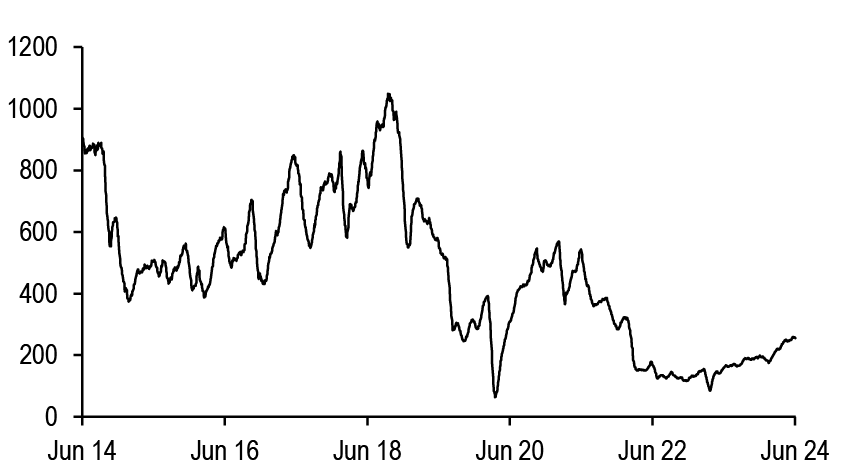
Source: BrokerTec, J.P. Morgan
* The sum of the three bids and offers by queue position, averaged between 8:30 and 10:30am daily. This is the sum of 2-, 5-, 10-, and 30-year depth in 10-year equivalents
Figure 4: ...as volatility remains elevated compared to the pre-pandemic period
Duration-weighted Treasury market depth*; 3-month moving average, regressed on 3-month standard deviation of daily changes in US-GBI yield (bp/day), regression over the last decade; $mn 10-year Treasury equivalents
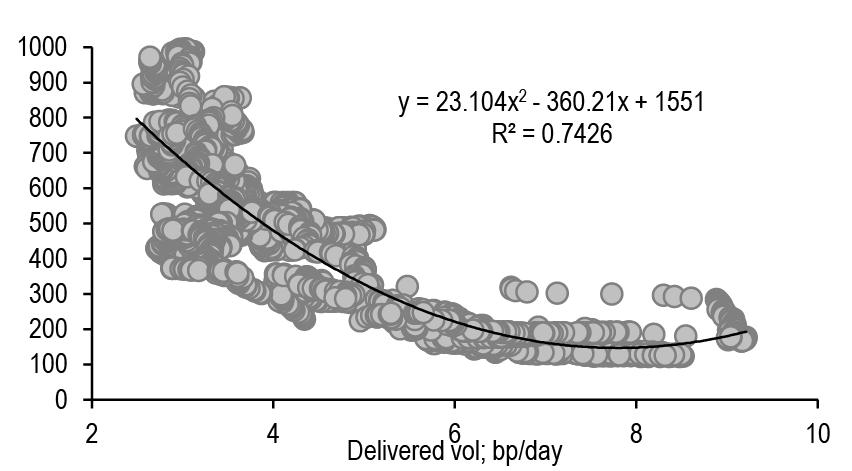
Source: Source: J.P. Morgan, BrokerTec
* The sum of the three bids and offers by queue position, averaged between 8:30 and 10:30am daily. This is the sum of 2-, 5-, 10-, and 30-year depth in 10-year equivalents
Along the curve the improvement has not been uniform: at the front end, market depth remains below averages observed over the last 5 years, while in longer tenors, depth is sitting in the upper 20-35% of ranges observed over the period ( Figure 5).This makes sense given that the front end continues to experience significantly higher volatility now than it did during the pandemic; thus front-end depth is very unlikely to retrace back toward those highs any time soon.
Figure 5: The front end has lagged the broad improvement in liquidity conditions
Treasury market depth by tenor, latest readings with 5-year statistics; $mn unless otherwise indicated
| Sector | Latest | 5-year min | 5-year max | 5-year avg. | Percentile |
| 2y | 98 | 16 | 857 | 227 | 45% |
| 3y | 45 | 10 | 630 | 152 | 46% |
| 5y | 97 | 19 | 367 | 136 | 40% |
| 10y | 126 | 16 | 266 | 123 | 56% |
| 20y | 15 | 5 | 25 | 13 | 65% |
| 30y | 19 | 4 | 35 | 15 | 78% |
Source: BrokerTec, J.P. Morgan
* The sum of the three bids and offers by queue position, averaged between 8:30 and 10:30am daily.
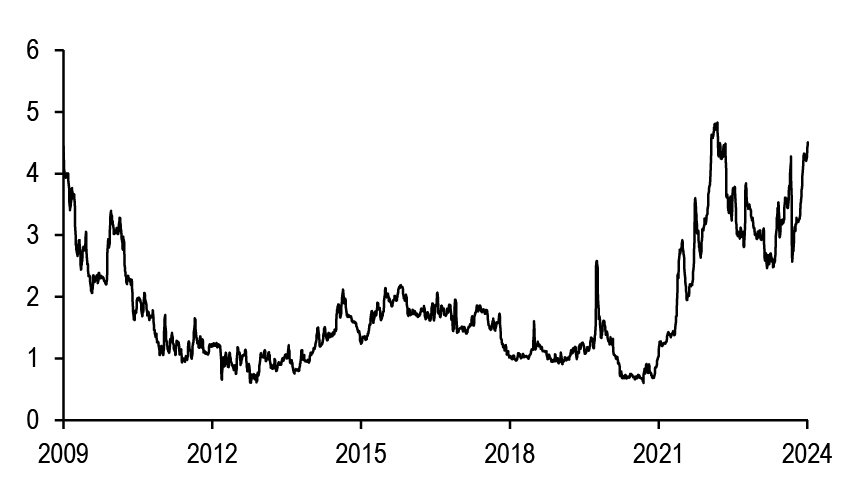
Below the surface, more advanced measures indicate healthy liquidity conditions as well. Figure 6 displays the evolution of price impact, which measures the average move for a $100mn notional trade in 10-year Treasuries. This metric spiked to over 1.4/32nds on average, during the onset of the COVID-19 pandemic, but then normalized thanks to the Fed’s unprecedented actions. However, unsurprisingly, price impact rose as volatility increased sharply during the Fed’s breakneck 2022-2023 tightening campaign. However, this measure has retraced over the last year or so, supported by a Fed on hold, and is sitting close to average levels observed since we first began capturing this series in 2016.
Figure 6: Price impact has declined, indicating a smaller footprint for each trade in the Treasury market...
10-year Treasury price impact*, 1-month moving average; 32nds
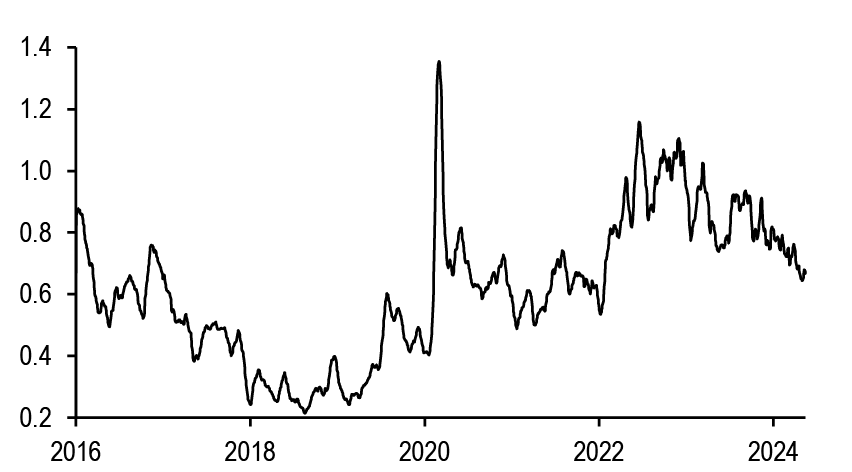
Source: J.P. Morgan, BrokerTec
* The average move in order book mid-price against a $100mn flow in traded notional. See Drivers of price impact and the role of hidden liquidity, 1/13/17 for more details.
Figure 7: ...and the fast flow share of liquidity provision remains stable at high levels, despite high volatility
Fraction of 10-year Treasury market depth provided by high-frequency activity*, 1-month moving average; %
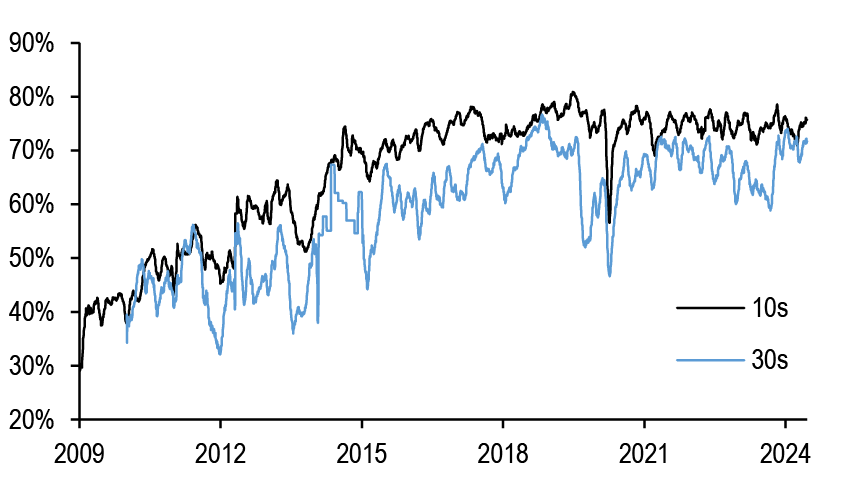
Source: J.P. Morgan, BrokerTec
* Defined as passive limit orders that are reacting within 0.1 second to another event in the CLOB
Microstructure data also indicate more stable liquidity provision: Figure 7 shows the share of market depth provided by high frequency traders has remained relatively stable in the 10-year sector, averaging 75% over the last 3 years. However, the share of liquidity provision from higher-frequency traders at the long end has been more variable, rising in the post-pandemic period, but declining in 2022-2023. Recall, late-2022 was defined by the UK LDI deleveraging, which seemed to impact long-dated Treasuries, and the summer of 2023 was punctuated by the Treasury’s open-ended series of long-duration auction size increases; thus, the decline in automated liquidity provision could have been prompted by the policy uncertainty and volatility surrounding those events. It’s notable that now the share of depth being provided by high-frequency participants at the long end is nearly on par with the share provided in the 10-year sector, and this has been a relatively rare occurrence, seen only for a brief period in 2018 and in early-2021.
Dispersion rising, but mainly a function of curve construction
In recent weeks, market participants and the media have noted that a rise in Treasury yield curve dispersion point to deteriorating liquidity and risks of deleveraging. Indeed, the RMSE of our Treasury par curve has been on a rising trend and is now at levels last seen during the early days of QT2 and the LDI-related delevering in the fall of 2022 ( Figure 8). In the past, rising RMSE has been associated with liquidation of more financing intensive off-the-runs, as occurred during fall 2022 and before that, during the onset of the COVID-19 pandemic in March 2020. Rising RMSE could be a proverbial canary in the coal mine for a more serious deterioration in liquidity conditions, but we believe the recent rise in dispersion is overstated, and a relic of curve construction, rather than a harbinger of potential financial calamity. Indeed, Figure 9 shows the largest moves in RMSE have been isolated to the two front-end buckets, which are now both at 5-year highs, while RMSE in other tenors are generally above their 5-year averages, but not dislocated by any stretch.
Figure 8: The dispersion to our fitted curve has risen to two-year high...
Root mean square error of J.P. Morgan Treasury par curve, one-week moving average; bp
Source: J.P. Morgan
Figure 9: ...mainly driven by the front end...
RMSE of J.P. Morgan Treasury par curve by sector with 6-month changes and 5-year statistics
| Maturity | Last | 6m chg | 5y min | 5y max | 5y avg | % |
| 0-2y | 30.9 | 10.9 | 0.8 | 317.9 | 12.5 | 94% |
| 2-3y | 7.7 | 6.5 | 0.3 | 7.7 | 1.5 | 100% |
| 3-5y | 3.1 | 0.6 | 0.3 | 4.0 | 1.6 | 92% |
| 5-7y | 2.3 | -0.5 | 0.3 | 4.3 | 1.9 | 56% |
| 7-10y | 5.7 | -0.4 | 0.5 | 7.2 | 2.7 | 94% |
| 10-20y | 2.2 | -2.8 | 0.8 | 11.7 | 3.9 | 25% |
| 20-30y | 1.0 | -0.7 | 0.6 | 6.3 | 1.9 | 13% |
Source: J.P. Morgan
Drilling down, this high RMSE largely stems from original-issue 30-year bonds issued in the late 1990s. Recall these bonds were issued during the days of small budget deficits and even surpluses, with free floats (amount issued less SOMA ownership and bonds held in stripped form) of $5bn or less, and are substantially smaller than other off-the-runs in this sector ( Figure 10). As the figure shows, most of these small, illiquid issues are all trading very rich relative to our fitted curve, disproportionately impacting RMSE measures at the front end. Thus, while dispersion is likely increasing somewhat, it’s being overstated by these tiny, illiquid deeply off-the-run bonds which were auctioned more than 20-years ago, and trade very infrequently.
Figure 10: ...driven by deeply off-the-run original-issue 30-year bonds issued in the late-1990s, all of which have small free floats and trade extremely rich relative to the curve
Treasury securities with less than $8bn in free float*; units as indicated
| CUSIP | Free float ($bn) | Issue Date | Maturity Date | Orig. issue (years) | Yield error (bp) |
| 912810FA1 | 2.1 | 8/15/1997 | 8/15/2027 | 30 | -5.2 |
| 912810EZ7 | 2.2 | 2/18/1997 | 2/15/2027 | 30 | -20.5 |
| 912810EV6 | 2.3 | 8/15/1995 | 8/15/2025 | 30 | -32.8 |
| 912810ET1 | 2.3 | 2/15/1995 | 2/15/2025 | 30 | -66.5 |
| 912810ES3 | 2.5 | 8/15/1994 | 11/15/2024 | 30 | -74.9 |
| 912810EX2 | 2.9 | 8/15/1996 | 8/15/2026 | 30 | -17.1 |
| 912810FJ2 | 3.2 | 8/16/1999 | 8/15/2029 | 30 | -4.0 |
| 912810EY0 | 3.2 | 11/15/1996 | 11/15/2026 | 30 | -40.2 |
| 912810FG8 | 4.0 | 2/16/1999 | 2/15/2029 | 30 | -9.9 |
| 912810FE3 | 4.1 | 8/17/1998 | 8/15/2028 | 30 | -11.9 |
| 912810PT9 | 4.8 | 2/15/2007 | 2/15/2037 | 30 | -2.3 |
| 912810EW4 | 5.6 | 2/15/1996 | 2/15/2026 | 30 | -23.2 |
| 912810FM5 | 5.6 | 2/15/2000 | 5/15/2030 | 30 | -1.2 |
| 912810PU6 | 6.0 | 8/15/2007 | 5/15/2037 | 30 | -2.3 |
| 912810PW2 | 6.1 | 2/15/2008 | 2/15/2038 | 30 | -2.8 |
| 912810FB9 | 6.4 | 11/17/1997 | 11/15/2027 | 30 | -5.4 |
| 912810FT0 | 6.6 | 2/15/2006 | 2/15/2036 | 30 | -4.2 |
| 912810FF0 | 7.1 | 11/16/1998 | 11/15/2028 | 30 | -5.1 |
| 912810PX0 | 7.2 | 8/15/2008 | 5/15/2038 | 30 | -2.7 |
| 912810FP8 | 7.4 | 2/15/2001 | 2/15/2031 | 30 | -10.6 |
Source: J.P. Morgan, US Treasury
*Amount outstanding less the sum of SOMA holdings and the stripped amount
Away from dispersion, comparing matched-maturity SOFR spreads for on-the-run Treasuries with their near off-the-run counterparts give us insight on liquidity preference ( Figure 11). Prior to the Fed’s interventions in March 2020, on-the-runs in the 5- and 10-year sectors traded 5-7bp rich relative to their near off-the-run counterparts on a matched-maturity SOFR spread basis. 5s traded with some liquidity premium during the 2022-2023 tightening cycle as demand to borrow collateral drove consistent repo specialness. However, it’s notable that on-the-run 5- and 10-year notes now display no liquidity premium relative to off-the-runs issued 4- to 12 months ago. Overall, given near off-the-runs are trading relatively in line with on-the-runs, this doesn’t give us a sense that off-the-run liquidity conditions have deteriorated materially.
Figure 11: There are no signs of liquidity preference in on-the-run/off-the-run spreads
5s/quadruple old 5s and 10s/quadruple old 10s spreads matched-maturity SOFR spread curves; bp
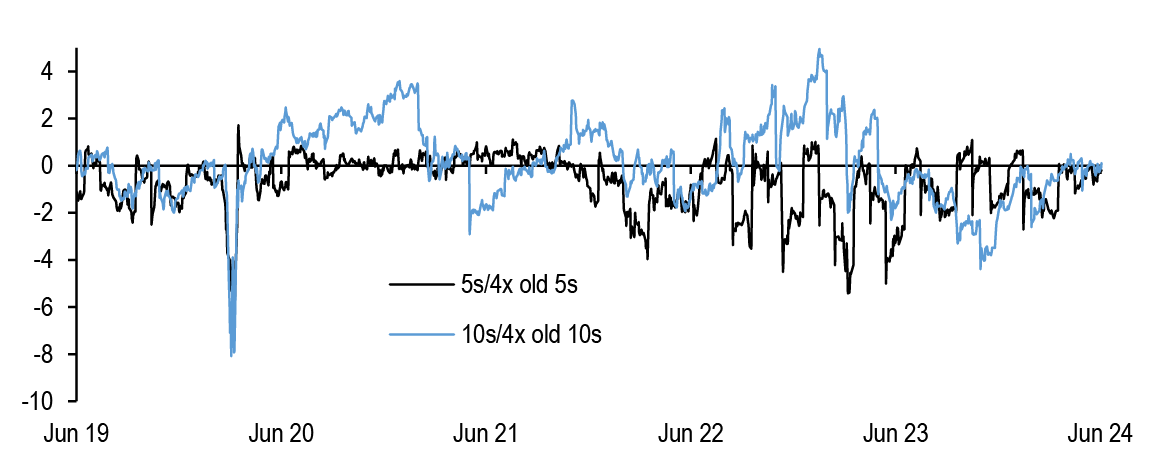
Source: J.P. Morgan
Market functioning sitting at post-pandemic averages
In sum, with market depth rising, price impact falling, and dispersion increasing moderately, these data points suggest that Treasury market liquidity has been on an improving trend in 2024. Each of the data series above are individually helpful in identifying liquidity trends, but we can combine these measures to provide a more holistic view of Treasury market liquidity conditions by tenor. Figure 12 displays current levels as well as 3-year z-scores for each of these factors, broken out by sector of the curve. We also average these z-scores into a “market functioning index” for each tenor, in order to illustrate the relative health of the Treasury market by maturity. The table shows that in aggregate, market functioning is very close to average levels observed over the last 3 years in most tenors.
Figure 12: Market functioning in most sectors is in line with post-pandemic averages, with the exception of the front end, which is being compromised by elevated RMSE
Current levels and 3-year z-scores for Treasury market depth*, price impact**, and Treasury curve RMSE***, by sector of the curve, with Treasury market functioning index†; units as indicated
| Market depth | Current ($mn) | 3y z-score | Price impact (32nds) | Current | 3y z-score | RMSE (bp) | Current | 3y z-score | Market functioning |
| 2y | 102 | -0.1 | 2y | 0.00 | 0.9 | 2y | 7.7 | -4.5 | -1.3 |
| 5y | 87 | -0.1 | 5y | 0.23 | 1.6 | 5y | 3.1 | -1.1 | 0.1 |
| 10y | 129 | 0.9 | 10y | 0.73 | 0.5 | 10y | 5.7 | -1.3 | 0.0 |
| 30y | 19 | 1.2 | 30y | 0.77 | 0.3 | 30y | 1.0 | 1.1 | 0.9 |
Source: J.P. Morgan, BrokerTec
* Market depth is the sum of the three bids and offers by queue position, averaged between 8:30 and 10:30am daily
**Defined as passive limit orders that are reacting within 0.1 second to another event in the CLOB
** Root Mean Square Error of J.P. Morgan para fitted Treasury curve. We use Fed purchase buckets: 2y = 0-2y, 5y = 3-5y, 10y = 7-10y, 30y = 20-30y
† We multiply the price impact and RMSE z-scores by -1 so positive z-score means better Treasury market functioning
The main exception we can observe is at the front end, where historically high dispersion is dragging down the market functioning index in the 0-2-year sector. As discussed above, we think this is more a factor of curve construction than a sign of compromised market functioning. As a result, we can conclude that in aggregate, Treasury market functioning is sitting at relatively average levels compared to the last 3 years, although is clearly much weaker than conditions that persisted prior to the pandemic.
Primary dealer near record levels, but less alarming after accounting for growth of the Treasury market
Amid relatively healthy market functioning, primary dealer inventories have been rising, and for the last 2-3 months have been sitting above the highest levels observed during the pandemic, and nearly 2 standard deviations above the trailing 5-year average ( Figure 13). Recall that high dealer inventories were an impediment to market functioning during 2020. Across the curve it’s notable that most of the increase has come in the intermediate sector of the nominal curve, and in TIPS, while inventory at the front end and long end is sitting pretty close to average levels observed over the last 5 years.
Figure 13: Dealer inventories in Treasuries are at record levels...
Primary dealer inventory in Treasuries, current levels, YTD changes with 5-year statistics; $bn unless otherwise indicated
| Maturity | Last | YTD chg | 5y avg | 5y min | 5y max | 5y z-score |
| T-bills | 75 | 23 | 51 | -4 | 119 | 0.9 |
| <2y | 33 | 16 | 35 | -17 | 97 | -0.1 |
| 2-3y | 16 | 12 | 5 | -14 | 18 | 1.9 |
| 3-6y | 69 | 18 | 29 | -2 | 69 | 2.6 |
| 6-7y | 25 | 11 | 12 | -4 | 29 | 2.0 |
| 7-11y | 23 | 4 | 3 | -10 | 27 | 2.7 |
| >11y | 50 | 5 | 44 | 0 | 62 | 0.8 |
| 11-21y | 21 | 2 | ||||
| >21y | 29 | 3 | ||||
| TIPS | 24 | 8 | 13 | 1 | 25 | 2.2 |
| FRNS | 10 | 6 | 8 | -1 | 52 | 0.4 |
| Total | 325 | 101 | 201 | 76 | 325 | 2.2 |
Source: Federal Reserve Bank of New York
Figure 14: ..and have risen as a share of the Treasury market, but remain well below pre-GFC shares
Primary dealer inventory in Treasuries as a share of total marketable Treasury debt outstanding, annual average*; %
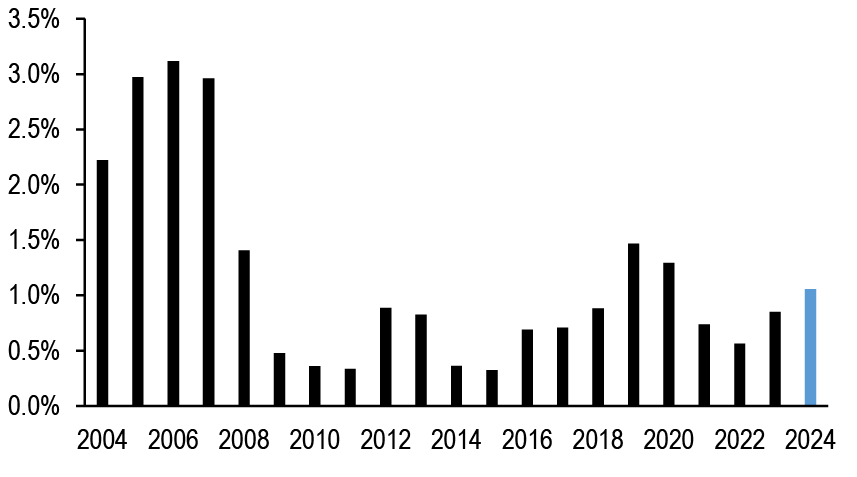
Source: Federal Reserve Bank of New York, US Treasury*2024 through 6/5/24
While inventories have exceeded the peak during the pandemic, given the growth of the Treasury market over the last 4 years, inventories as a share of total marketable Treasury debt remains below the 2019-2020 local peak: YTD primary dealer inventory in Treasuries accounts for approximately 1.1% of total marketable debt outstanding ( Figure 14). This share has risen sequentially over the last 2 years, and is approaching the peak in 2019-2020, but is well below pre-GFC levels. While banks do not appear to be leverage constrained right now, this is a development worth watching, because elevated dealer balance sheets heading into the pandemic gave dealers little room to add inventory amid the wholesale deleveraging that occurred in March 2020.
TIPS liquidity remains robust
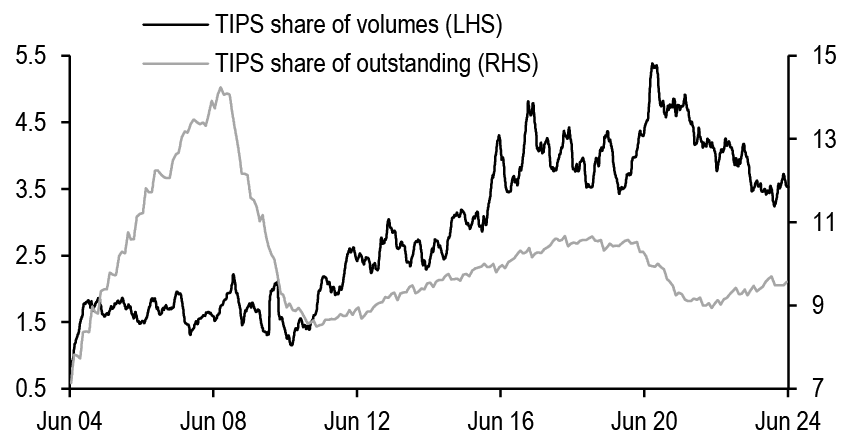
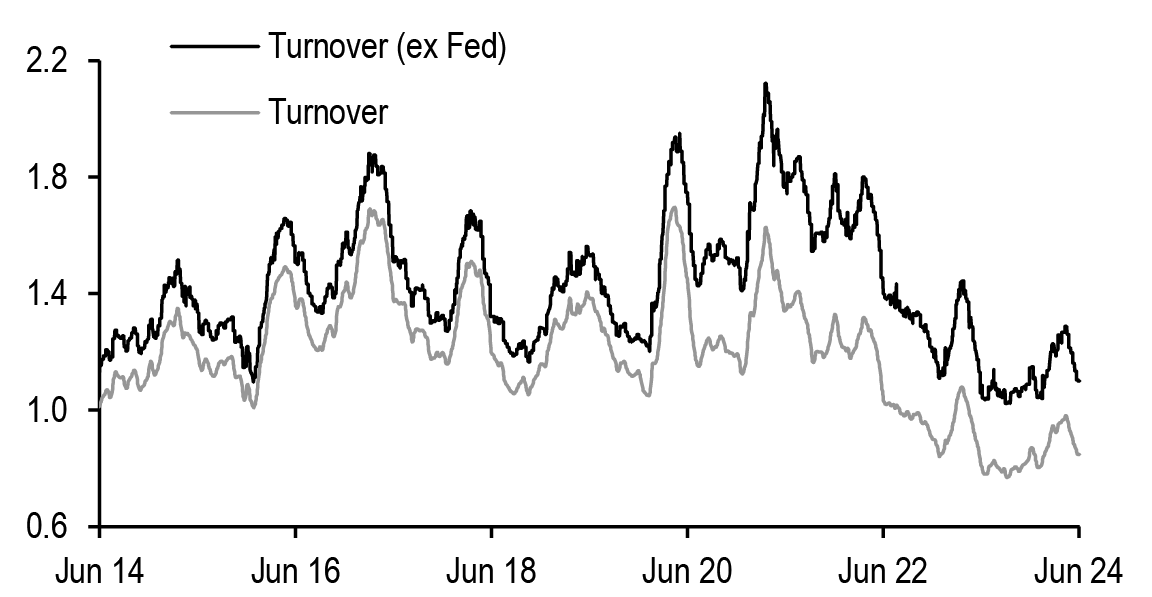
Daily trading volumes of TIPS have averaged $18.5bn YTD, close to averages observed in recent years, with volumes close to evenly split between on-the-run and off-the-runs. On a relative basis, TIPS volumes as a share of coupon Treasury volumes have fallen in recent years, averaging roughly 3.5% YTD, down from a peak above 5% in mid 2020. It’s not surprising to see this share decline in recent years, as the demand for inflation protection has fallen, but it’s worth recognizing that this share remains near pre-pandemic levels, even as the TIPS share of the coupon Treasury market remains below levels that prevailed in 2019 ( Figure 15). Daily turnover remains depressed near 2023 levels, and below average levels observed prior to the pandemic, but once adjusting for the higher share of the market held by the Fed, turnover has remained fairly stable just above 1% ( Figure 16). The share of the TIPS market held by SOMA peaked at 27% prior to the start of QT, and has fallen to a still historically elevated 23% share. While a high share of the market held by the Fed has reduced the tradable float of the TIPS market and contributed to declining turnover, it’s notable that the share of the market held by foreign official investors has fallen markedly over the last 5 years, from approximately 31% to 16% as of June 2023 (see TIPS Strategy, 5/3/24), increasing the tradeable float, on the margin.
Figure 15: TIPS volumes as a share of coupon Treasury volumes has fallen in recent years, averaging roughly 3.5% YTD
TIPS average daily trading volumes relative to total Treasury (ex-bill) volumes (LHS) and TIPS outstanding relative to total Treasury (ex-bill) market (RHS); % both axes
Source: Federal Reserve Bank of New York, US Treasury, J.P. Morgan
Figure 16: Daily turnover of the TIPS market (excluding Fed holdings) remains just above 1% on average
Daily TIPS market turnover, including and excluding Fed holdings; %
Source: US Treasury, Federal Reserve Bank of New York, J.P. Morgan
Digging a level deeper, we recognize that while volumes on average have remained robust, trading volumes in the TIPS market are highly cyclical. Utilizing daily volumes data from TRACE since February 2023, we observe that TIPS trading volumes tend to more than double on month-end dates, and this rise in volumes is much more pronounced in TIPS relative to nominal Treasuries ( Figure 17). This makes sense intuitively given the significant share of the TIPS market held by inflation-focused funds, mutual funds and ETFs (see The inflation fund landscape: Reviewing trends in flows, composition, and positioning, 5/28/24). More specifically, we find that month-end trading volumes in the TIPS market tend to be highly correlated with the size of the monthly extension in the Bloomberg US Treasury Inflation-linked Bond Index (see TIPS Strategy, 2/2/24). We also observe a significant rise in front-end TIPS trading volumes on CPI release days, and, like nominal Treasuries, trading volumes tend to rise on auction days in the sector being offered. This is particularly true at the long end, where the auction can be used as a liquidity event: on average, trading volumes in the 10- to 30-year sector are nearly triple on the day of a 30-year TIPS auction compared with all other days, driven by a jump in on-the-run 30-year TIPS volumes.
Figure 17: TIPS trading volumes are more cyclical than nominals, with volumes jumping on month-end. Front-end volumes also rise materially on CPI release days
Ratio of daily trading volume by sector for each event versus average daily trading volume*
| Nominals | TIPS | |||||||||||
| (0,2y] | (2,3y] | (3,5y] | (5,7y] | (7,10y] | (10,20y] | (20,30y] | Total | (0,5y] | (5,10y] | (10,30y] | Total | |
| Month end | 1.8 | 1.7 | 1.4 | 1.9 | 1.4 | 1.5 | 1.5 | 1.6 | 2.2 | 2.9 | 3.2 | 2.5 |
| Auction | 1.4 | 1.8 | 1.3 | 1.8 | 1.8 | 1.6 | 1.4 | 1.6 | 1.5 | 2.2 | 2.8 | 2.2 |
| CPI | 1.1 | 1.4 | 1.1 | 1.0 | 1.3 | 1.0 | 1.2 | 1.2 | 1.7 | 1.0 | 0.8 | 1.4 |
| Fed | 1.2 | 1.1 | 1.2 | 1.0 | 1.1 | 1.0 | 1.0 | 1.1 | 2.2 | 1.7 | 1.1 | 1.9 |
Source: TRACE, J.P. Morgan
* For auctions, event dates vary by sector. We compare volumes in the sector being offered on auction day to volumes on all other days. Total reflects the average ratio across sectors. Data since February 13, 2023
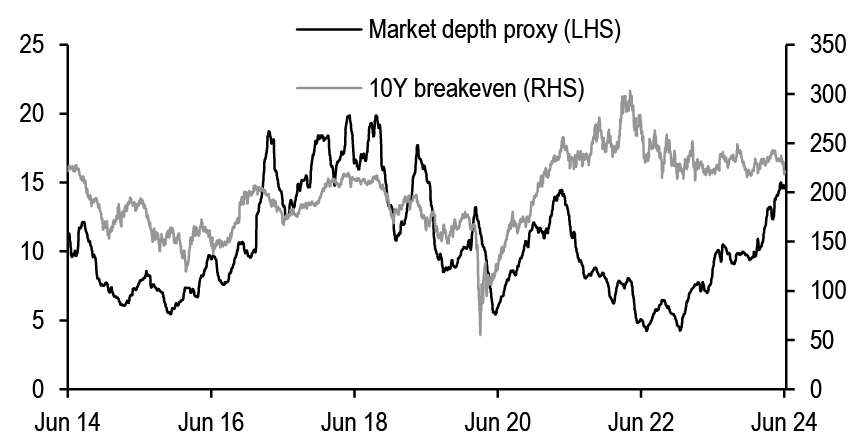
Turning to market behavior and pricing, it appears that liquidity remains robust, by a variety of measures. Our TIPS market depth proxy, calculated as average TIPS trading volumes relative to realized volatility in 10-year breakevens, has been on the rise over the last couple of years, after declining in the aftermath of the pandemic ( Figure 18). Notably, this is largely a reflection of breakeven volatility declining, even while TIPS trading volumes have remained relatively elevated. Lastly, against a backdrop in which liquidity remains healthy by a variety of measures, we observe that 5Y and 10Y IOTAs, a proxy for the liquidity premium embedded in cash breakevens, have narrowed over the past year ( Figure 19). At the long-end, 30Y IOTAs remain near the wide end of their 5-year range. The richening of cash breakevens on this basis in the front to intermediate part of the curve is notable against the backdrop of ongoing Fed QT, although unsurprisingly, IOTAs remain considerably wider than levels observed during the QE period. Looking ahead, if macro volatility remains subdued, we expect liquidity in the TIPS markets to remain supported. However, we are cognizant that an unexpected flight to quality could drive renewed preference for nominal Treasuries, implying a wider liquidity premium in TIPS breakevens, as we saw in certain pockets of the market last week (see TIPS Strategy, 6/14/24).
Figure 18: Our TIPS market depth proxy has been on the rise recently...
TIPS market depth proxy* (lhs; unitless) versus 10-year TIPS breakevens (rhs; bp)
Source: Federal Reserve Bank of New York, J.P. Morgan
* Depth proxy is one-month moving average of dealer transactions in TIPS divided by one-week average of the magnitude of daily changes in 10-year TIPS breakevens
Figure 19: ...and IOTAs have narrowed over the past year, primarily in the 5- and 10-year sectors, despite ongoing QT
IOTA (from Z-spread to SOFR differential) for 5-, 10-, and 30-year TIPS; bp

Source: J.P. Morgan
Conclusions: liquidity conditions stable and improving, with a watchful eye on dealer inventories and liquidity preference
Overall, a host of Treasury market metrics indicate stable to improving liquidity conditions: trading volumes are rising, and turnover has stabilized at low levels. Meanwhile, market depth in nominals and TIPS has been on a rising trend, price impact has continued to decline, and the HFT share of depth provision has been stable as well. Meanwhile, dispersion has been on the rise, but we attribute much of this move to a select few deeply off-the-run bonds from the late-1990s and early-2000s, and moves look muted when excluding these CUSIPs. In contrast though, dealer inventories have been on the rise, and as a share of total Treasury debt outstanding, inventories are approaching levels reached in late-2019/early-2020. Overall, if volatility continues to decline, we think this bodes well for Treasury market liquidity conditions, but we do not expect a return to pre-pandemic levels. Of course, any exogenous shock would be a negative for liquidity conditions.