
U.S. Fixed Income Markets Weekly
Cross Sector P. White, L. Wash, H. Cunningham
Softening inflation should allow the Fed to cut in November followed by a quarterly cadence thereafter. We remain patient to add duration and prefer carry trades. We think mortgages have the ability to outperform corporate credit in a high-for-longer environment. Balance sheet runoff should continue through year-end and we see limited funding stress implications. We revise higher our 2024 net issuance forecast to $3.275tn.
Governments J. Barry, P. White, A. Borges, L. Wash
We expect a rangebound environment for Treasury yields in the months ahead. Even shallow easing cycles support lower yields, but Fed pricing and carry implications make it challenging to be long duration. We continue to see value in 5s/30s steepeners to position for Fed easing and fiscal dynamics. We discuss the impact of different election outcomes on the fiscal outlook and the Treasury market. We update our Treasury supply and demand forecasts. Remain bullish at the front end of the inflation curve. Though valuations have moved closer to fair, we expect a positive risk premium to emerge ahead of the US election: hold 1Yx1Y inflation swaps. Stay overweight $-SSA spreads.
Interest Rate Derivatives S. Ramaswamy, I. Ozil, P. Michaelides, A. Parikh
Swap curves should drift steeper in 2H24, but this is mostly priced into forwards except for curves anchored in the back end. Option-implied Fed expectations have coalesced around a moderate cutting path, which implies lesser jump risk and favors carry trades on the curve as well as short-gamma strategies. Term funding is expected to drift higher in coming months - we look for wider swap spreads in the front end, but long end spreads are likely to remain flat to current levels. We describe a new approach to trading the volatility of yield curve principal components that opens up a new class of relative value gamma trades - selling the volatility of the second principal component is likely to be attractive in coming months.
Short-Term Fixed Income T. Ho, P. Vohra, H. Cunningham
Funding conditions should remain benign, with liquidity remaining abundant, limiting any potential impacts to spreads. MMF reform should not have any outsized impact on money market credit spreads. Treasury repo clearing is work in progress, but concerns about readiness are emerging. Total money market supply (ex-Fed) should increase by nearly $550bn in 2H24, driven largely by T-bills and dealer repo.
MBS and CMBS J. Sim
Mortgages are a bit snug, but not terribly so. If our house rate forecast of a single cut this year is realized, higher coupons should again outperform in the second half of the year. CRE transaction cap rate expansion has been muted year-to-date through May. CMBS is no longer a ‘cheap’ asset class and spreads across the stack appear full.
ABS and CLOs A. Sze, R. Ahluwalia
We expect that ABS should continue to outperform over 2H24, with tighter spreads despite brisk issuance, and structures holding up well against minimal credit deterioration. Demand for floaters is solid and CLO T1 AAAs swept through our 140bp MY target and are closer to our 130bp YE target we set back in April.
Investment-Grade CorporatesE. Beinstein, S. Doctor, N. Rosenbaum, S. Mantri
Spreads to stay tight, though we revise our YE24 HG bond spread forecast to 110bp from 95bp (current 109bp). 2H24 Demand to be less strong with slower growth and election uncertainty. We also revise gross issuance forecast up to $1.45tr.
High Yield N. Jantzen, T. Linares
We believe leveraged credit will provide carry-esque returns over the next six months and spreads will finish 2024 well inside the long-term average.
Municipals P. DeGroot, Y. Tian, R.Gargan
Finding sustained market consensus while transitioning to an easing cycle may be difficult, but we suggest investing with a longer-term perspective, particularly in periods where Treasuries sell-off. We look for 2H24 IG muni index performance of 3-3.5% and favor adding idiosyncratic municipal risk opportunistically on market weakness, and highlight potential market cheapening in the period before the election.
Emerging Markets L. Oganes
In EM fixed income, we are MW GBI-EM local rates, CEMBI and EMBIGD.
Summary of Views
| SECTOR | CURRENT LEVEL | YEAR END TARGET | COMMENT |
| Jun 28, 2024 | Dec 31, 2024 | ||
| Treasuries | |||
| 2-year yield (%) | 4.72 | 4.60 | Maintain 5-year shorts |
| 10-year yield (%) | 4.34 | 4.40 | Maintain 5s/30s steepeners and 75:6 weighted 5s/10s/30s belly-cheapening butterflies to position for higher term premium |
| Technical Analysis | |||
| 5-year yield (%) | 4.33 | 3.85 | Longer-term setup suggests an emerging bull market |
| 5s/30s curve (bp) | 17 | 45 | The curve continues to carve out a cycle bottom pattern |
| TIPS | |||
| 10-year TIPS breakevens (bp) | 227 | 230 | Hold 1Y1Y inflation swap longs |
| Interest Rate Derivatives | |||
| 2-year SOFR swap spread (bp) | -14 | -6 | Swap curves should drift steeper in 2H24, but this is mostly priced into forwards except for curves anchored in the back end. Option-implied Fed expectations have coalesced around a moderate cutting path, which implies lesser jump risk and favors carry trades on the curve as well as short-gamma strategies. TFP is expected to drift higher - look for wider swap spreads in the front end, but long end spreads are likely to remain flat to current levels. We describe a new class of RV trades involving selling the volatility of the second principal component, which is likely to be attractive in coming months. |
| 5-year SOFR swap spread (bp) | -28 | -22 | |
| 10-year SOFR swap spread (bp) | -42 | -37 | |
| 30-year SOFR swap spread (bp) | -79 | -79 | |
| Agency MBS | |||
| FNMA 30yr 6% Front Tsy OAS (bp) | 28 | 30 | Mortgages are a bit snug, but not terribly so. If our house rate forecast of a single cut this year is realized, higher coupons should again outperform in the second half of the year. |
| RMBS Credit | |||
| CRT M1B/M2 (DM@10CPR) | 1MS + 167bp | 1MS + 175bp | Mortgage credit spreads are already retracing wider from their tightest levels this year. We expect further widening into year-end as we enter a slower GDP-growth and election period, although a possible Fed rate cut could help. |
| RMBS 2.0 PT (6s) | 1-04bk of TBA | 1-12bk of TBA | |
| AAA Non-QM | I + 130bp | I + 150-175bp | |
| ABS | |||
| 3-year AAA card ABS to Treasuries (bp) | 48 | 40 | Despite the recent spread rally, ABS remains relatively cheap to corporates; however, it is tough to make a case for material spread tightening from hereon given the macro uncertainty still ahead in 2024 |
| CMBS | |||
| 10yr conduit CMBS LCF AAA | 98 | 95 | LCF AAAs look Freddie K A2 spreads look about fair to their corporate and mortgage comps. |
| 10yr Freddie K A2 | 48 | 48 | |
| Investment-grade corporates | |||
| JULI spread to Treasuries (bp) | 109 | 110 | Less demand and less supply in 2H24 vs 1H24 argues for spreads slightly less tight than previously expected.Slower growth and election volatility are risks, duration demand post a Fed cut could drive tighter spreads. |
| High yield | |||
| Domestic HY Index spread to worst (bp) | 351 | 380 | We believe HY spreads will be supported in the near-term by low near-term recession risks and improving capital market access into 2Q. |
| Credit Derivatives | |||
| High Grade (bp) | 53 | 50 | We prefer our longs in Cash and shorts in Derivatives as the latter looks stretched. We are sticking with Decompression as Recession remains on the horizon and Rates volatility subdued. We use Credit options to buy cheap Rates optionality. We expect US indices to outperform. |
| High Yield | $106.4/341bp | 350 | |
| Short-term fixed income | |||
| EFFR (%) | 5.33 | 5.10 | Funding conditions should remain benign, with liquidity remaining abundant, limiting any potential impacts to EFFR/SOFR, T-bills/OIS, and CP/OIS spreads. We do not expect MMF reform to have any outsized impact on money market credit spreads. Treasury repo clearing remains work in progress, though concerns about readiness are emerging. |
| SOFR (%) | 5.34 | 5.10 | |
| CLOs | |||
| US CLO Primary AAA (Tier 1, bp) | 138 | SOFR + 130 | CLO new issue T1 AAAs recently reached our MY spread forecast of 140bp in the US. Our 130bp YE target may well be met sooner on strong technicals and bid for floating rates. |
| Municipals | |||
| 10-year muni yield (%) | 2.84 | 2.60 | Finding sustained market consensus while navigating transition to an easing cycle may be difficult, but we suggest playing the long game, and buying municipal bonds with a longer term perspective, particularly in periods where Treasuries sell-off. We suggest adding idiosyncratic municipal risk opportunistically on market weakness, and highlight potential market cheapening in the period before the election. |
| 30-year muni yield (%) | 3.72 | 3.55 | |
| Emerging Markets | |||
| Hard currency: EMBIG Div (bp) | 395 | 400 | MW EMBIGD |
| Hard currency: CEMBI Broad (bp) | 225 | 220 | MW CEMBI Br |
| Local currency: GBI-EM yield (%) | 6.56% | 5.58% | MW local rates |
Source: J.P. Morgan
US Fixed Income Overview
2024 Mid-Year Outlook
- We expect core PCE inflation to soften sequentially and GDP growth to step down to 1% saar in 2H24. We see the first Fed rate cut in November, followed by a quarterly cadence thereafter. We think balance sheet runoff can continue at the now-tapered pace over the remainder of the year
- We revise up our 2024 long-term net issuance forecast across US fixed income markets by $225bn to $3.275tn given heavy corporate credit supply in 1H24. We do not expect further Treasury coupon auction size increases until November 2025
- Treasuries: We expect a rangebound environment for Treasury yields in the months ahead. Even shallow easing cycles support lower yields, but Fed pricing and carry implications make it challenging to be long duration. We continue to see value in 5s/30s steepeners. Remain bullish at the front end of the inflation curve. Though valuations have moved closer to fair, we expect a positive risk premium to emerge ahead of the US election
- Derivatives: Option-implied Fed expectations have coalesced around a moderate cutting path, which implies lesser jump risk and favors carry trades on the curve as well as short-gamma strategies. Term funding is expected to drift higher in coming months. We look for wider swap spreads in the front end, but long-end spreads are likely to remain flat to current levels
- Short Duration: Funding conditions should remain benign, with liquidity remaining abundant. MMF reform should not have any outsized impact on money market credit spreads
- Securitized products: Mortgages are a bit snug, but not terribly so. If the Fed delivers one cut this year, higher coupons should again outperform in the second half of the year
- Corporates: We look for HG spreads to stay tight, though we revise our YE24 HG bond spread forecast to 110bp from 95bp. 2H24 demand to be less strong with slower growth and election uncertainty. We also revise our gross issuance forecast up to $1.45tn
- Near-term catalysts: May JOLTS (7/2), June FOMC minutes (7/3), June employment (7/5), June CPI (7/11)
The outlook for rates and spreads in 2H24
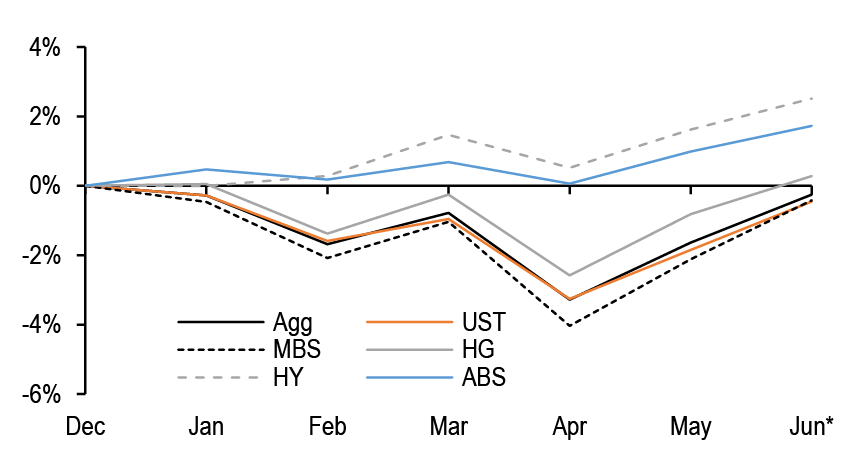
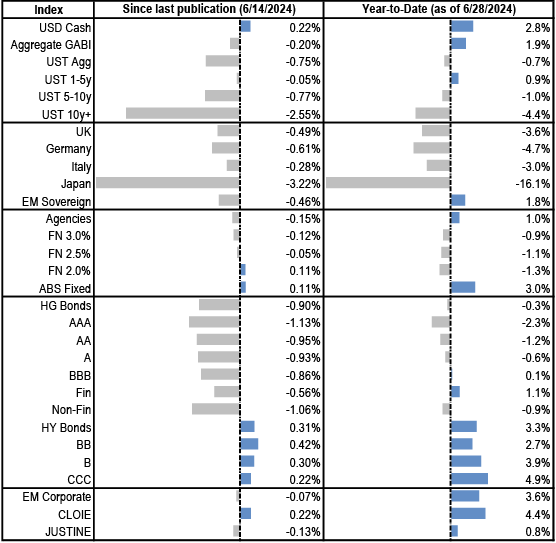
In our year-ahead outlook published last November, we predicted that the disinflationary trend that gained momentum in 2H23 would continue in early 2024, alongside slowing growth and a cooling in labor markets, driving further declines in yields and spread decompression. Instead, core inflation accelerated over the first quarter and job growth continued to surprise to the upside, driving yields higher and spreads tighter across most fixed income products. Yields have retreated from their highs as the last two months of inflation data have been more benign, and there are clear signs that activity growth has stepped down from elevated levels observed in 2H23. Still, Treasury yields are 40-70bp higher YTD, the curve has flattened, and high-yield credit has outperformed other fixed income products ( Figure 1). As we look ahead, we expect GDP growth to step down further toward a 1% pace in 2H24, but with markets already priced for roughly 140bp of easing over the next 18 months, we look for yields to remain broadly rangebound in the second half of the year and for spreads to trade sideways. Against this backdrop, seeking positive carry trade opportunities is likely to remain a theme. Moreover, the US election could be a key catalyst for fixed income markets in the second half of the year, as well as various elections that will take place globally over coming months.
Figure 1: Rising yields drove returns negative early in the year before reversing. HY credit has outperformed
Cumulative returns on the Bloomberg US Aggregate Bond Index, together with its subcomponents, YTD*; %
Source: Bloomberg Finance L.P.
*June data through 6/28/2024
Figure 2: We look for moderate economic cooling over the next year without an outright contraction
J.P. Morgan Economic Forecast; units as indicated

Source: J.P. Morgan
* Average level for the period
Economics & Rates: Consumer spending growth has moderated recently, as the post-pandemic tailwinds supporting last year’s exceptional growth have begun to normalize. While there are mixed signals from the labor market, the broad thrust of the data indicates that nominal labor income growth should continue coming back down to earth in 2H24, providing a further tempering influence on consumers. Business capital spending has been supported by IRA and CHIPS Act-related spending. The more recent data suggest that the growth in this policy-supported capex is starting to peter out. Outside of this category, business capital spending growth has been soft, and business surveys indicate that this should remain the case in coming months. Though the inflation process has been bumpy over 1H24, we look for core inflation to cool gradually on a sequential basis over the second half, though base effects should drive core PCE slightly higher again later in the year. We forecast core PCE inflation to run at 2.8% q4/q4 in 2024 ( Figure 2). Against this backdrop, we expect the Fed will cut rates at the November FOMC meeting and continue at a quarterly cadence in 2025. While a September cut remains a risk, we think it may take the five reports available between now and the November FOMC meeting to see a broader weakening in job growth (see Economics).
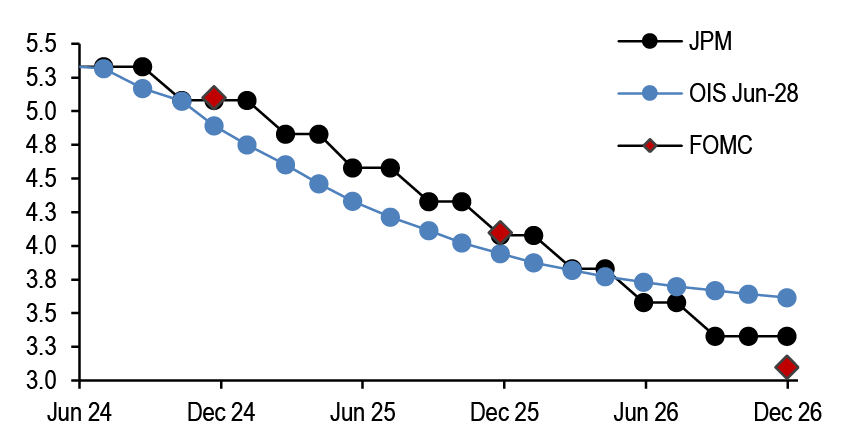
Meanwhile, markets are pricing roughly 140bp of easing over the next 18 months, slightly more than our own forecast ( Figure 3). Moreover, we recognize that the lack of clear economic vulnerabilities together with an uncertain inflation outlook may leave the upcoming easing cycle shallower than many prior cycles, perhaps more closely resembling the experiences of 1995 and 2019. However, even in those cycles, yields declined more than 125bp on average in the six months prior to the first cut. Thus, we believe there is still room for yields to decline ( Figure 4). Nonetheless, even though the onset of the easing cycle appears to be just a few months away, we will be patient in adding duration longs, given negative carry implications and outright valuations. Along the yield curve, we think long-end steepeners provide the best value as we approach the start of an easing cycle, especially as most curve pairs remain near their flattest levels of the last 3 years. We prefer 5s/30s steepeners: this curve displays a high sensitivity to medium-term Fed expectations, should benefit from rising term premium, and appears too flat versus our fair value framework (see Treasuries).
Figure 3: Markets are pricing in close to 140bp of easing over the next 18 months. We and the Fed are projecting 125bp of cuts
OIS forward rates by meeting date versus J.P. Morgan forecast and median SEP dot from June FOMC meeting; %
Source: J.P. Morgan, Federal Reserve Board
Figure 4: We look for yields to remain rangebound through the summer and for the front-end to lead the move to lower yields in the fall
J.P. Morgan US interest rate forecast; %
| Actual | 3Q24 | 4Q24 | 1Q25 | 2Q25 | |
| 28-Jun | 30-Sep | 31-Dec | 31-Mar | 30-Jun | |
| Rates (%) | |||||
| Fed Funds | 5.33 | 5.35 | 5.10 | 4.85 | 4.60 |
| SOFR | 5.34 | 5.35 | 5.10 | 4.85 | 4.60 |
| 2-yr UST | 4.72 | 4.75 | 4.60 | 4.30 | 4.05 |
| 3-yr UST | 4.51 | 4.55 | 4.40 | 4.15 | 3.95 |
| 5-yr UST | 4.33 | 4.40 | 4.25 | 4.00 | 3.80 |
| 7-yr UST | 4.32 | 4.40 | 4.25 | 4.00 | 3.80 |
| 10-yr UST | 4.34 | 4.50 | 4.40 | 4.20 | 4.00 |
| 20-yr UST | 4.60 | 4.70 | 4.60 | 4.40 | 4.20 |
| 30-yr UST | 4.50 | 4.65 | 4.60 | 4.50 | 4.35 |
Source: J.P. Morgan
In inflation markets, we remain bullish at the front end of the curve. Even with inflation and growth projected to cool gradually, recession fears are likely to remain at bay, the disinflationary process is likely to be bumpy, and the market remains priced for weaker inflation outturns over the second half of the year relative to our own forecast. Additionally, as the US election comes into focus, we expect the front end of the inflation curve to price additional risk premium, as trade policy is one of the few issues garnering bipartisan support in a polarized US political environment. Importantly, in the event of a Trump victory, we would expect the Former President to take a harder line on foreign policy, particularly with China, through a greater use of Executive Orders. If Trump proceeds with the tariffs that have been floated, our economists estimate a 1.1% increase in price level from a 60% tariff on China and a 1.5% increase in price level coming from the 10% universal tariff (see US: Economic policy implications of the election, Michael Feroli, 6/28/24). With IOTAs trading near their tightest levels in nearly two years, we think inflation swaps can outperform cash breakevens, and we maintain longs in 1Yx1Y inflation swaps (see TIPS).
With Fed expectations coalescing around a path of moderate rate cuts and tails thinning, this implies reduced jump risk in markets going forward and makes swap yield curve carry trades attractive as a theme. We continue to advocate for well-hedged carry trades that mitigate directional curve exposure while enhancing carry-to-risk ratios. This also implies broadly supportive conditions for short gamma strategies. That said, implied volatility levels are close to our fair value estimates, suggesting gamma strategies should be actively managed in coming months. Swaps spreads have also traded in a wide range in 1H24, but not driven by a correlation with yield levels. Instead, swap spreads have reflected swings in macro factors affecting the entire term structure. Indeed we think term funding premium - the incremental compensation demanded by Treasury investors for each additional year of duration after hedging interest rate risk - has risen in part due to declining liquidity amid ongoing Fed balance sheet reduction (see Term Funding Premium and the Term Structure of SOFR Swap Spreads, Srini Ramaswamy, 4/29/24). We expect that QT can continue at the now-tapered pace for the remainder of the year, increasing term funding premium and leading the swap spread curve to twist flatter. The upcoming US Presidential elections add some upside risk to term funding premium, as concerns around fiscal expansion and longer-term risks to Treasury supply could provide incremental narrowing pressure at the long end (see Interest Rate Derivatives).
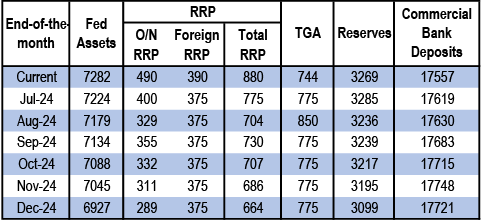
In 2H24, we believe funding conditions will continue to be relatively benign, though acknowledge there are a variety of risks that liquidity investors will have to grapple with in the coming months. Even with QT taper, the Fed’s balance sheet is still shrinking, albeit at a slower pace, which means reserves are still increasingly approaching scarcity. As of the time of writing, reserve balances registered $3.4tn. Market expectations have largely coalesced around $3.0-$3.1tn as the lowest comfortable level of reserves (LCLoR), and while our Fed balance sheet expectations call for reserve balances to remain comfortably above $3tn during 2H24, signs of reserve scarcity could start to emerge towards year-end as we come closer to approaching LCLoR ( Figure 5). The good news is that we also project ON RRP balances to remain near $400bn for at least a few months and over $300bn for the remainder of the year, which will help to offset any funding pressures arising from balance sheet normalization. Looking beyond year-end, we expect QT to come to a halt in 1Q25 when the O/N RRP balance falls to near or below $300bn--a reasonably sized RRP facility is likely necessary as a buffer against stress in funding markets, given that the marginal propensity of RRP investors to lend in response to spikes in repo rates is higher than the marginal propensity of banks to do the same. We could see increased rotation out of the credit side of money markets as the remaining institutional prime funds shore up liquidity heading into the MMF reform deadlines this October, though it is likely any cheapening in CP/CD will be minimal, as we suspect other liquidity buyers will step in. The scaling back of both the timing and depth of the upcoming Fed easing cycle has likely extended the attractiveness of the front-end, and we expect MMF AUMs will stay elevated for the remainder of the year (see Short-Term Fixed Income).
Figure 5: We estimate that Quantitative Tightening can continue over the remainder of the year at the now-tapered pace
Current* and projected** values for Fed balance sheet assets, RRP, TGA, Reserves, and Commercial bank deposits*** through 2024; $bn
Source: J.P. Morgan, FRED, Federal Reserve H.4.1, Federal Reserve H.8
* Current as of 6/27/2024 Fed H.4. release
** Deposits as of 6/21/2024 Fed H.8. release
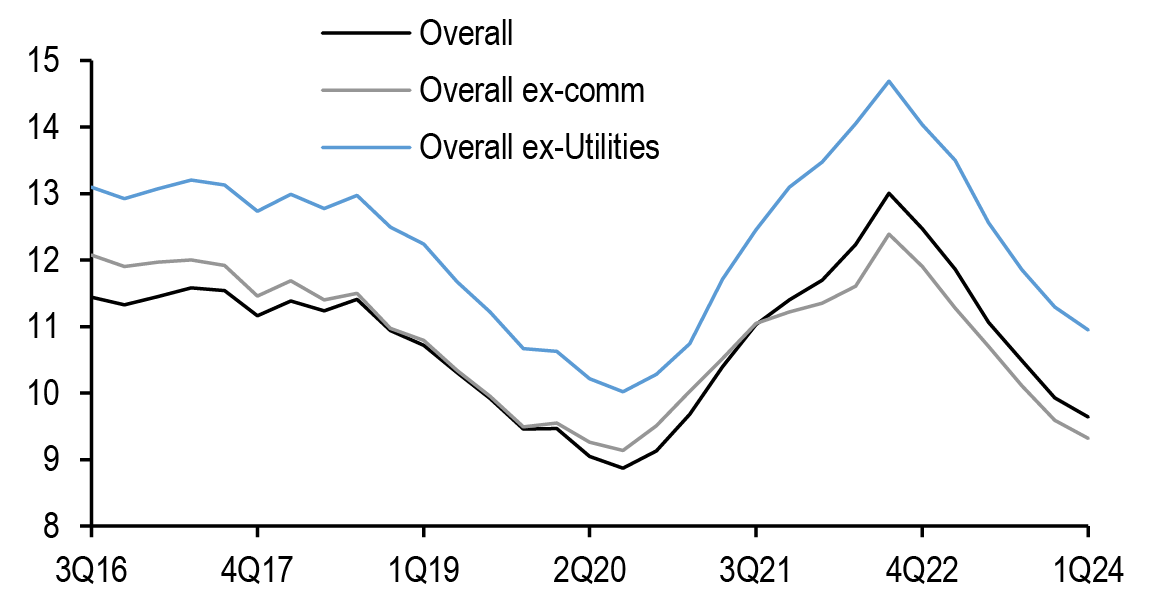
Corporate credit: Corporate balance sheets continue to come under strain with credit metrics steadily deteriorating, but we think they are overall still in solid shape. For high-grade issuers, the recent deterioration has been driven primarily by negative EBITDA growth combined with rising debt and interest expense. Weakness in commodity prices and reduced profit margins are eating into EBITDA, leading to increasing leverage and interest coverage metrics, but they are within long-term averages ( Figure 6, see HG Credit Fundamentals: 1Q24 Review, Eric Beinstein, 5/31/24). Companies have responded to weakening earnings by lowering buybacks and dividends, which have contributed to positive rating developments. Indeed the ratings momentum in HG has been extremely robust with an upgrade/downgrade ratio at record 4.8x, and 4.5% of the HG market has been upgraded in 2024 on a net basis.
The story is similar down the credit spectrum where US HY issuer balance sheets remain strong heading into what could prove a more challenging 2H24. We have seen modest erosion across most credit metrics including declining EBITDA and rising leverage, but they have yet to reach worrying levels. Meanwhile inflation has been stickier on the cost side than the revenue side, degrading profit margins and leading coverage ratios to soften, even more so for private companies (see 1Q24 High Yield Credit Fundamentals, Nelson Jantzen, 6/12/24). That said these metrics still stand near long-term averages and ratings are historically benign. While the ratings narrative is less supportive for loan issuers, the product is already trading near a historic extreme discount versus bonds and we are seeing access to capital broadening for B3 or lower ratings amid a historic refi wave. A slowing but not contracting economy is an ideal recipe for corporate credit, especially as EPS growth is expected to increase from 3.5% in 1Q to 18% by 4Q, based on consensus equity analyst forecasts. As we look ahead, we think deteriorating credit metrics will not become a primary driver of spreads unless economic growth weakens materially and thus we think technicals will play a much larger role over the near-term.
Figure 6: Interest coverage ratio is declining but remains modestly above its pre-Covid level
Interest coverage metrics; %
Source: J.P. Morgan
Figure 7: We see default rates rising to 2.00% for bonds and 3.75% for loans by YE24
High yield and leverage loan default rates, yield, and spread forecasts for YE24; units as indicated

Source: J.P. Morgan*par-weighted default rates
Stronger-than-expected economic growth and higher-than-expected yields led to very strong demand technicals over the first half of the year. Despite this, HG spreads did not stay sustainably below 100b. In 2H24, we expect some of the demand technicals to become less strong, especially if the start of the Fed easing cycle drives yields lower. Also, global rates dynamics have made US credit less attractive to overseas investors, and domestic fund inflows have slowed in line with middling YTD total return. Election uncertainty could increase volatility, generally a market negative. Overall, we have revised our year-end spread target to 110bp (from 95bp previously)--still a tight spread historically (see Corporates).
For high yield bonds, weakening credit fundamentals, a less supportive technical backdrop, and negative agency rating trends are expected to be offset by supportive factors such as elevated yields, strong balance sheets, benign credit ratings, improving capital market conditions, resurfacing retail inflows, and a yoy decline in default activity. For leveraged loans, the negative fundamental ramifications from elevated rates and slower growth should lead to ongoing downgrade and default risk, which we expect to be offset by elevated coupons (9%), earnings delivery, a record pace of CLO origination, steady inflows, and a negligible pace of net new supply. We believe credit will provide carry-esque returns over the next six months, with high yield bond spreads widening 25bp to 380bp, comfortably inside the long-term average, while leveraged loan spreads end the year at 8.75%. We see default rates rising to 2.00% for bonds and 3.75% for loans by YE24 ( Figure 7, see High Yield).
Given our modest default forecast, we think CLO credit performance is unlikely to meaningfully turn in 2H24 unless the economy falls into a recession. That said, we think the 1H24 bullish tone in CLOs is susceptible to macro events from geopolitics to disinflation, as demand for floaters has largely been driven by yield curve inversion. While technicals could prove strong, with US CLO new origination at near-consecutive monthly records despite little net loan creation, portfolios could be at risk of future extensions as tight spreads encourage CLO resets and as the loan maturity wall extends. We look for our CLOIE to return 3.2% for the remained of the year. We like relative value in selectively selling par-plus AAA in secondary to buy short refi at par or buying deleveraging/near-deleveraging AA and A for low spread duration while earning carry (see CLOs).
In terms of sector recommendations, in HG we have overweights in Yankee Banks, Finance Cos, Consumer, Basics, Domestic Telecoms, Insurance and Media/Entertainment, while we have underweights in Technology and Retail. In HY we are overweight in Financials, Metals/Mining, Media, and Utility while we are underweight Consumer Products, Housing, Industrials, and Paper/Packaging.
Securitized products: Turning to the mortgage space, we head into 2H24 with OASs looking a bit snug, ZVs still historically wide, and the supply/demand picture looking manageable. Higher coupons have generally outperformed Treasuries thanks to a combination of carry and spread tightening while discounts have lagged on the back of technical pressures from bank portfolio reallocations. Even after portfolio repositioning in the second quarter, bank activity has surprised to the upside and we now think they can be a net buyer over the course of the year. That said, banks have generally been letting their lower yielding fixed rates burn off and replacing with Ginnie floaters, partially offsetting otherwise positive demand for mortgages. Risks to lower total capital build from a revised Basel 3 Endgame remains a medium-term risk and risk capital constrained banks will prefer Ginnies. Meanwhile money managers have been responsible for most net conventional buying to start the year. With corporate spreads moderately higher and YTD excess returns on higher coupons giving more credence to the mortgage vs. corporate trade, we think that money managers can maintain their current allocations given the yields available. If our base rates forecast is realized, higher coupons will likely outperform, but with OASs in the 20-30bp range and the marginal buyer still spread sensitive, we think excess returns will need to be driven by earned spread rather than tightening.
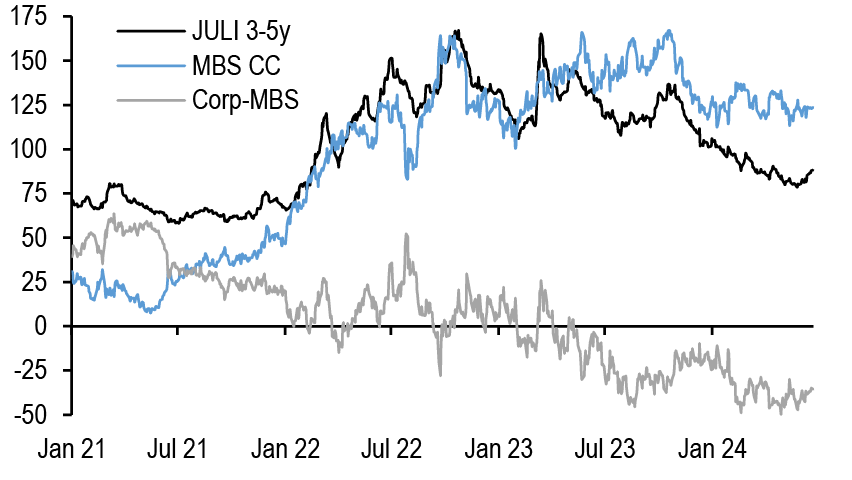
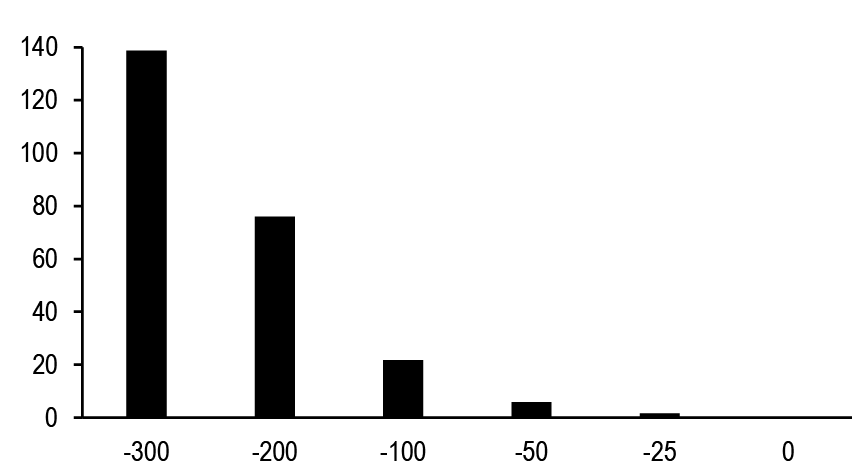
Given the importance of bank and money managers to mortgage demand, a key question among cross asset investors is whether mortgages look cheap on a relative basis to Treasuries and IG corporates. We have argued in the past this depends on which mortgage one buys, but we also note it depends on how one is using mortgages as either a relative value play or as a way to position for a potential recession. Broadly speaking, we think lower coupons remain compelling 5-7yr Treasury proxies with spread pickup, while higher coupons are a way to pick up carry, fade vol, and arguably shed some exposure to historically tight IG corporate spreads. At the present, current coupon mortgages pick up ZV spread vs. similar duration corporates, but OAS doesn’t look particularly cheap vs. the bond/CDS basis ( Figure 8). Indeed at the local level mortgages have displayed a positive correlation and corporates a negative relation with yield moves given technical demand factors, but this is unlikely to hold in large rate rallies predicated on worsening economic outcomes. Our mortgage analysts compute ‘break-even spreads’ which show that unless IG corporate spreads widen by more than these thresholds, they will likely outperform negatively convex current coupon mortgages in such rate moves ( Figure 9). The question remains that if shorter duration mortgages offer relatively competitive yields vs. corporates, whether recession scenarios are priced well (see Agency MBS).
Figure 8: Current coupon mortgages still look cheap to similar duration corporates on a ZV basis…
JULI 3-5y Treasury spread, FN 30yr cc ZV spread, and difference; bp
Source: J.P. Morgan
Figure 9: …but are likely to underperform IG corporates in large rate rallies unless IG spreads widen materially
Amount of spread widening on 3-5yr IGs to make their price move equivalent to an even duration blend of FN 5s/5.5s in different rate rallies; bp
Source: J.P. Morgan
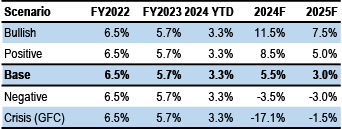
Mortgage credit spreads continued their tightening trend in the first half of the year but are bouncing back and we believe a weakening economic outlook leaves room for spreads to widen more, with jumbo 2.0 pass-through spreads softening to 1-12 back, nearer to 70 TOAS. Our empirical models favor non-QM over TBA 7s, although investors could be hesitant with very few and largely untested prepayment models for the product. We see non-QM spreads widening back out to 150-175bp on slower demand. Looking ahead, we think strong fundamentals are fully priced in and we expect mortgage credit to be more rangebound. While the top of the capital structure appears to have room to widen, technicals in the form of a limited supply of mortgage credit could keep spreads a bit firmer. Calls and tenders in CRT have most investors looking at the bonds as having a 5yr (or shorter) maturity. We continue to think the extra home appreciation and call/tender potential of ‘21/‘22 vintage CRT B2 spreads make them cheap to new issue collateral which benefits from increased credit enhancement. On the regulatory front, the FHFA approved the Freddie proposal for closed-end second liens, but only allows the agency to purchase $2.5bn over the next 18 months, significantly below initial expectations. On the housing side, we revise our home price forecast higher to 5.5% for 2024, but note risks to the upside as we head into the seasonally strong summer months ( Figure 10). Supply remains constrained and while builders are already pulling back on forward builds, they will likely suffer if rates remain elevated well into 2025 (see RMBS).
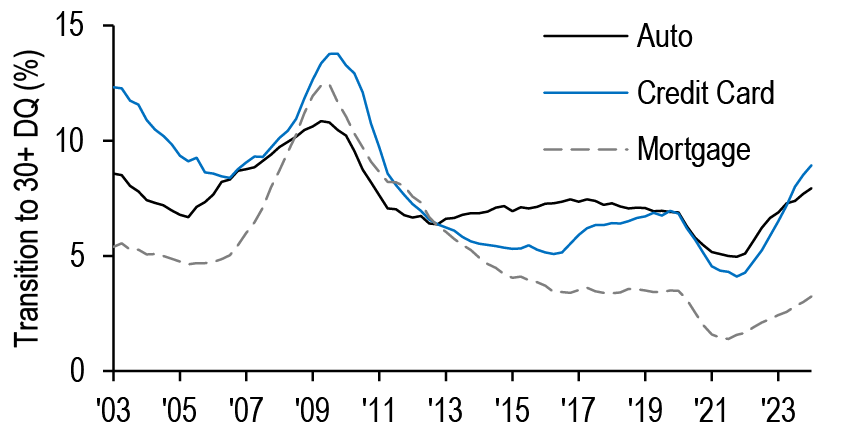
We look for the ABS market to finish 2024 with record new issue supply, spreads at the tight end of their two-year ranges and solid structures against minor underlying credit deterioration. We have seen some deterioration in credit quality, with delinquencies rising in auto and credit card debt among lower FICO borrowers indicating some stress for low-end consumers ( Figure 11). That said, ABS is often much better than what sits on bank balance sheets given heavy concentration among prime borrowers with seasoned accounts. Looking ahead, we expect minimal further deterioration if our 4.1% 4Q24 unemployment rate forecast is realized. We expect ABS spreads to reach the tights of their two-year ranges, with our indicative 3-year AAA credit card ABS at Treasury + 40bp and 3-year BBB subprime auto ABS at +135bp. We could see downside risk stemming from heavy supply in 2H24 and investor fatigue. However we note that even after the 1H24 rally, ABS still offers pickup versus comparable corporates and we think AAA benchmark bankcard and prime auto loan ABS should lead this spread narrowing given their history of solid credit fundamentals. Our top pick is AAA 3-year private credit student loan ABS which offers significant spread concession, has a robust capital structure, and reflects high underlying asset collateral (see ABS).
Figure 10: We expect home prices will be up 5.5% in 2024
Historical and projected home price growth for the Case-Shiller HPI Index; %
Source: J.P. Morgan
Figure 11: Auto and credit card delinquencies are rising above pre-COVID levels, while mortgage delinquencies increase at a slower pace
% of 30+ delinquencies by consumer debt category; %
Source: J.P. Morgan, New York FED, Consumer Credit Panel/Equifax
CRE transaction cap rate expansion has been muted YTD with blended cap rates across the major property types sitting roughly 6.5%. Levered return on equity (ignoring NOI growth and exit cap rates) has remained low as borrowing rates have remained high while LTV expansion has been limited, suggesting financing remains less accretive to returns relative to the past and this, in turn, has kept transaction activity low. We think cap rates can expand to 7% driven by seller capitulation if the high for longer rate narrative persists. We no longer think CMBS is trading cheap on a cross-asset perspective. The top of the conduit CMBS stack should largely avoid meaningful extensions over the medium-term as refi success rates are high, but spreads no longer look compelling to single-A corporates. The middle of the stack is more exposed to extension risk and spreads have closed to similar duration REIT bonds. Conduit BBB-s remain optically wide to HY CRE REIT bonds as investors question their relative value given thin enhancements. However there is value to be gained in the CRE space. We like floating SASB AAAs versus BLS CLO AAAs given their attractive spreads, low probability of losses, and sound collateral. We also like FRESB A10Fs versus 10yr Freddie K A2s which suffers from worse liquidity but offers better spread pickup with similar legal hard finals (see CMBS).
Municipals: In the municipal space we continue to favor playing the long game, and buying municipal bonds with longer term perspective, in periods where Treasuries sell off. We believe that bouts of illiquidity should be viewed as an opportunity to add idiosyncratic risk, given that a cycle turn is in the offing. We highlight that prices will be particularly vulnerable in the September/October period given an expected spike in supply as issuers look to avoid election-related market volatility. Both the slowing economy and election supply technicals should drive solid performance by year-end and slightly tighter spreads, as capital continues to chase yield. While the timing remains elusive, this should drive a sustained bull steepening of the curve and lead to inflows across municipal fund complexes, thus driving continued demand for yield, suggesting adding to duration, off-the-run structures, lower BBB & HY (on dips) before the Fed eases and the bull steepening takes hold (see Municipals).
Emerging markets: EM credit has outperformed local markets YTD, as EM sovereign spreads tightened 41bp (when properly adjusted for Venezuela’s index inclusion) and EM corporates tightened 58bp, for total returns of 2.2% and 3.3% respectively. Local markets have been hurt by higher yields (+40bp), while carry has helped limit the total return loss to -2.9% on local bonds in USD terms. Looking ahead, EM does not offer attractive risk/reward at the current juncture. Given a lack of risk-premia in EM assets ahead of the US election, there is an element of complacency. On the positive side of the ledger, we still think EM has good idiosyncratic carry in places where two cycles of distress have abated: an EM default cycle and an EM inflation cycle. Both were precipitated by a generational US hiking cycle and there is still some excess risk premia we think in some high yielding local and hard currency markets to exploit. Harvesting this idiosyncratic carry while remaining hedged against market beta is how we are currently recommending to position within EM. In terms of trading themes, we have OWs in Latam and EMEA EM while UW in Asia. Within EM sovereigns, we stay MW EMBIGD. Turning to EM corporates, we also remain MW given CEMBI outperformance and compressed relative spread. We prefer EM Europe and Africa HY for further spread compression and carry trades in Latam. We prefer non-financials over financials and like commodity segments (see Emerging Markets)
Supply & Demand update
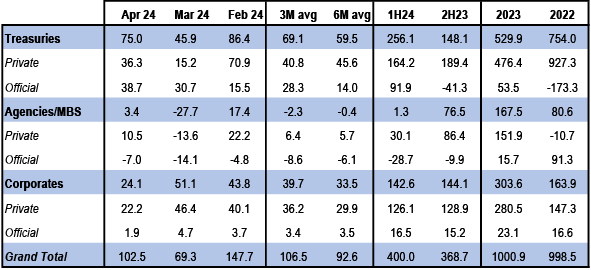
Demand for US fixed income from abroad accelerated in 1H24 after net purchases stepped down late last year. Indeed, foreign investors purchased $400bn of long dated (>1Y) US fixed income securities through April, an increase from the $370bn bought over 2H23 but a reduction from the $630bn purchased in 1H23 ( Figure 12). Demand was once more concentrated in the foreign private sector, which represented 80% of these net purchases, with the foreign official sector contributing to the remainder. Moreover these net purchases were almost exclusively concentrated in Treasuries ($260bn) and corporates ($140bn), with foreign investors net buying only $1bn of Agencies/MBS over the course of the year to date. European investors alone account for over a third of corporate purchases but we think such demand wanes as French and UK election uncertainty combined with increasing hedging costs stemming from the recent ECB cut have helped contribute to EUR credit once more appearing attractive versus USD credit (see HG Credit Foreign Demand Monitor, Nathan Rosenbaum, 6/24/24). Meanwhile demand for Treasuries was more varied to start the year, but was mostly concentrated among investors based in Europe, Japan, and emerging markets (ex-China). We think demand will moderate over 2H24 as continued EM FX reserve drawdowns should restrain foreign official demand whereas we think some of the private demand to start the year was to position for an easing Fed.
Figure 12: Foreign investors were prolific buyers of USD corporate debt in 1H24
Net sales by US residents of long-term (>1Y to maturity) US securities to foreigners by sector, investor type*, and by month, as well as 1H24, 2H23, 2023, and 2022 totals; $bn
Source: Treasury International Capital (TIC) System, J.P. Morgan
*Excludes International Regional Organizations (IROs)
Note: Corporations include corporate ABS. Agencies/MBS is calculated as price-adjusted change in holdings
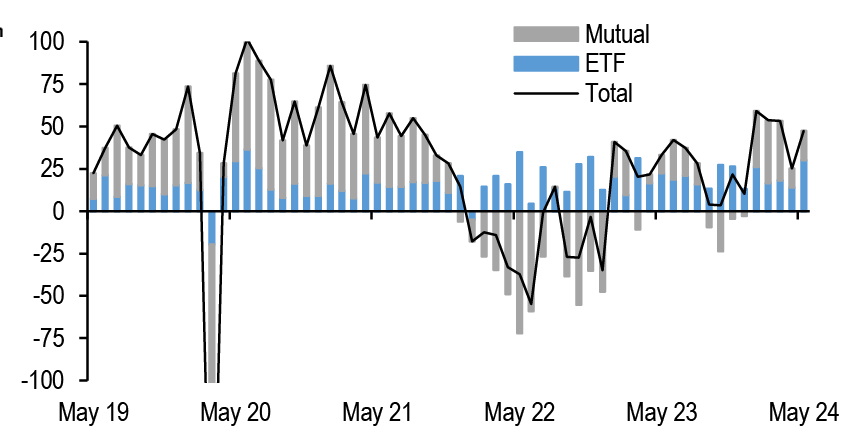
Figure 13: Bond fund inflows have been robust in 1H24
Monthly* net flows into domestic US bond funds, mutual and ETF; $bn
Source: EPFR, J.P. Morgan
*Data through May
Mutual funds and ETFs continue to remain a strong source of demand for fixed income thus far in 2024 ( Figure 13). As of May, bond funds have accumulated roughly $240bn of inflows (+3.9% of YE23 AUM), compared to $300bn of inflows over the course of 2023 (+4.4% of YE22 AUM), and this represents the second largest 1H intake of inflows in dollar terms and third largest in %-age of AUM terms over the past decade. Inflows have been predominantly skewed towards Agg and IG credit funds. Much of this growth came early in the year as the combination of elevated yields, expectations of near-term Fed easing, and lagging returns from the 4Q23 rally led to a surge in retail inflows. As we look ahead, inflation uncertainty and rangebound yields are likely to keep inflows modest over the summer and will likely only pick up alongside the Fed easing cycle if the economy softens materially. Indeed we have previously shown that more prolonged and deeper easing cycles, which are often associated with worse economic recessions, see a more pronounced increase in the volume and duration of inflows as retail flows follow returns and seek safety (see Overview, U.S. Fixed Income Markets Weekly, 12/15/23).
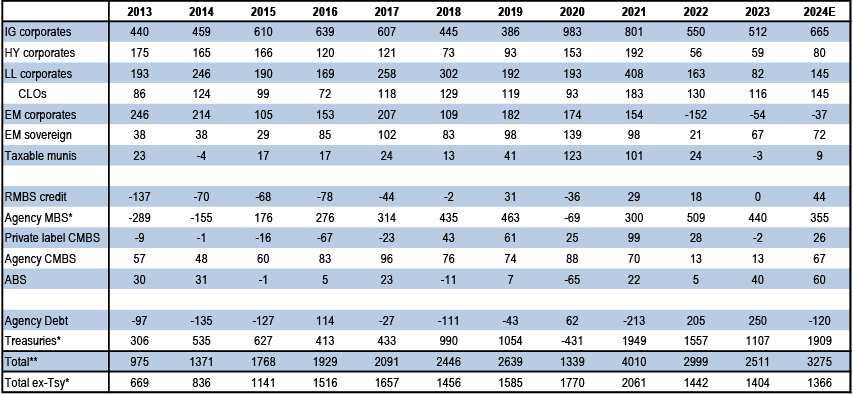
Turning to supply, we have updated our 2024 cross-sector fixed income net issuance forecast since our last supply update in March ( Figure 14). We now see a total of $3.275tn in fixed income net issuance for 2024 (from $3.05tn previously), which would make for an increase of over $760bn in net supply from 2023. The primary driver behind this upward revision is IG corporate credit, which we revised up by $127bn to $665bn, though supply should moderate from here relative to the rapid pace of 1H24, a seasonal dynamic likely to be accentuated by the US election. Other products with substantial upward revisions include emerging markets (+$54bn), ABS (+$40bn), and leveraged loan corporates (+$25bn), and we now expect this year’s ex-Treasury net supply to come pretty close to matching that of 2023.
Figure 14: We revise higher our total US fixed income net issuance forecast by $225bn to $3.275tn, driven primarily by an increase in IG corporate supply
Historical and J.P. Morgan forecast for long-term (>1Y) net issuance in 2024; $bn
Source: J.P. Morgan, Dealogic, Bloomberg Finance L.P., Bond Radar, Commercial Mortgage Alert, INTEX, FNMA, FHLMC, FHLB, GNMA, LoanPerformance, US Treasury, Thomson SDC, S&P, SIFMA, Trepp
* Net of Fed purchases
** The CLOs row is not included in the totals to avoid double-counting
Notes: For IG, net issuance figures exclude EM corporates. HY net issuance is calculated as gross issuance – refis, and LL net issuance is calculated as gross issuance – refis – repricings. For CLOs, figures represent US Arbitrage CLOs only. EM corporates includes IG, HY, and quasi-sovereigns and is only net USD issuance. Additionally, the issuance is adjusted for tender/buyback/call activity. EM sovereign figures reflect net USD issuance only, which is calculated using the historical average of 80% of total net issuance. Muni figures reflect taxable munis and muni corporate bonds with municipal industry codes. RMBS credit includes the following sectors: legacy, jumbo 2.0, non-QM, CRT, SFR and RPL/NPL. ABS includes all maturities. Agency debt includes FNMA, FHLMC, and FHLB. Treasuries includes TIPS and represents net issuance to the public.
While most of the changes stem from the spread side of the fixed income universe, we would be remiss to not discuss the evolving outlook for Treasury supply. In recent years Treasuries’ share of annual net US fixed income issuance has ballooned from an average 31% in the five years proceeding the pandemic to a projected 58% in 2024. Indeed we forecast $1.9tn net long-term Treasury supply in 2024, nearly unchanged from our initial estimate in November but roughly $800bn larger than in 2023. Given the increases in auction sizes over the last year, Treasury created approximately $600bn in additional borrowing capacity for FY25 relative to FY24. Accordingly, we see no need for Treasury to make any further changes to auction sizes this year. However, we estimate Treasury will have to address a financing gap of approximately $3.3tn from FY26-FY29, and we estimate auction sizes will begin increasing again in 4Q25 (see Wait till next year: Dissecting Treasury’s financing needs in the coming years, Jay Barry, 5/24/24).
Cross Sector Monitor
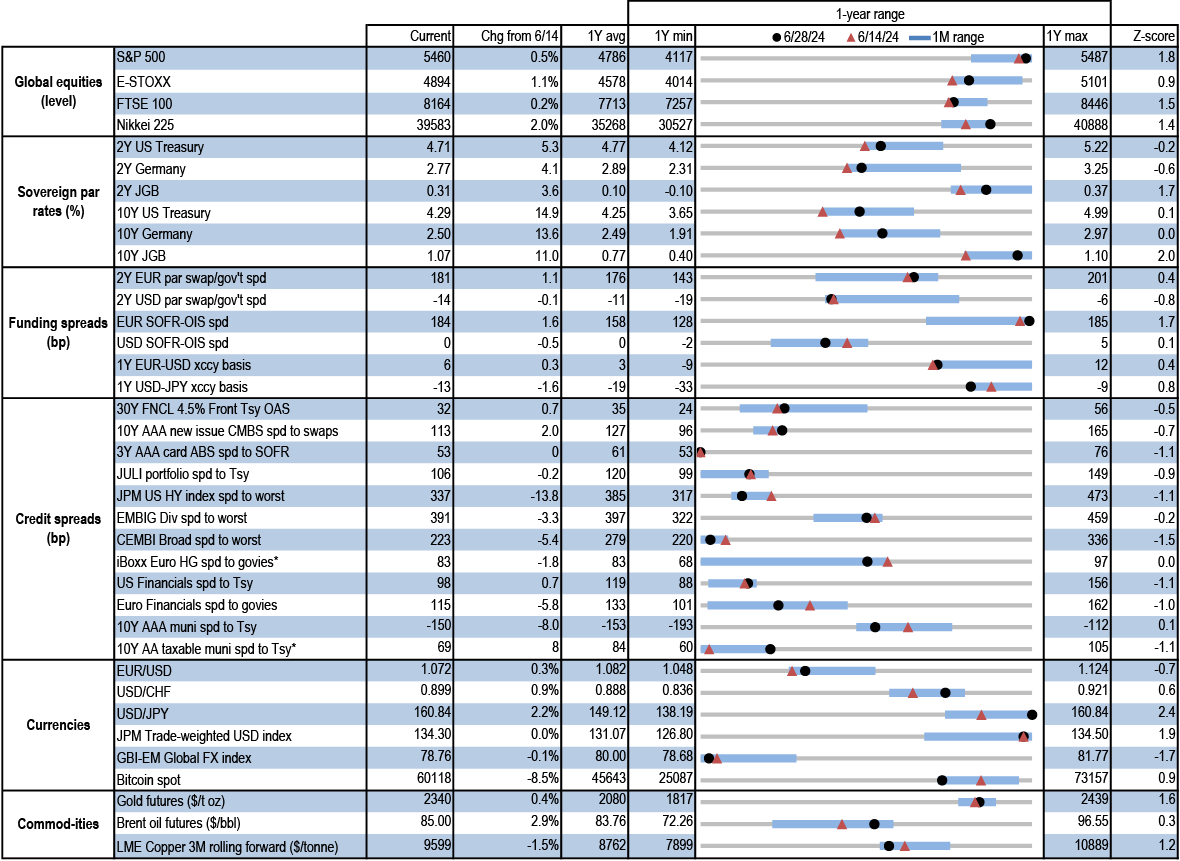
Figure 15: Treasury yields rose and credit and mortgage spreads tightened over the week
Current levels, change since 6/14/24, 1-year average, minimum, maximum, and current z-score for various market variables; units as indicated
Source: J.P. Morgan, Bloomberg Finance L.P., ICE, IHS Markit
* 6/27/24 levels for iBoxx Euro HG and AA taxable munis; 6/28/24 levels for all others
Figure 16: YTD returns on various fixed income indices; %
Source: J.P. Morgan
Economics
- May core PCE at 0.08% should help build some confidence for continued disinflation
- Real consumer spending looks to be downshifting in 1H
- Housing market revival has lost momentum
- We look for 200K payroll gains in June, steady 4% unemployment rate
This week attention was squarely focused on the looming presidential election. For the economy-minded, the outcome of that election will shape the macro backdrop next year and beyond. We provide a brief sketch of the relevant policy issues in an accompanying note. Meanwhile the data flow marches on, and this week’s figures point to only modest growth in current economic activity.
Perhaps more important for markets and Fed-watchers was the very soft reading on the May core PCE price index, the Fed’s preferred inflation gauge. Core PCE prices advanced only 0.08% last month, taking the year-ago reading down to 2.6%. The soft sequential increase—the lowest in over three years—suggests the disinflationary trends that were interrupted in 1Q are getting back on track. We still think this trend will continue, giving the Fed enough comfort to begin lowering the funds rate starting in 4Q.
Economy-wide spending growth appears to have moderated recently. Real consumer spending increased a respectable 0.3% last month, but this came after a modest decline in April and it looks like consumption growth this quarter is running a little shy of a 2% annual rate. This slowing comes after we also learned this week that consumption growth only expanded at a downward-revised 1.5% annual pace in 1Q.
Indicators on the interest-sensitive sectors also came in light this week. Real business investment spending on equipment in 2Q will likely benefit from a bounceback in civilian aircraft outlays (a very volatile category), as well as growth in vehicle sales and imported capital goods. But this week’s data for domestic manufacturers’ May orders and shipments for nondefense capital goods excluding aircraft dipped, and have been moving sideways over much of the past year.
After showing some hints of recovery earlier in the year, most housing figures have turned south again more recently. That trend continued this week, as both new and pending home sales fell materially in May. Inventories of unsold new homes have been creeping higher recently, and we think this will weigh on home building in the second half, something we discuss more in this week’s Focus.
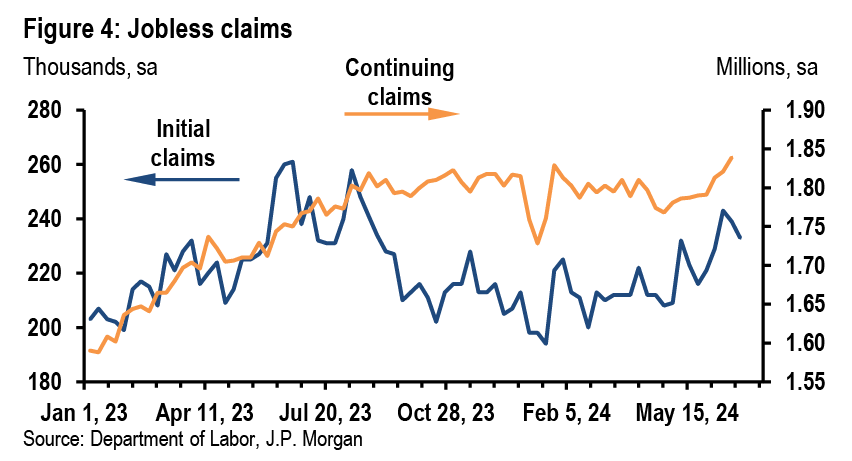
The labor market news this week was mixed. Initial jobless claims eased off a little, although continuing claims grinded up to the highest since late 2021. The labor market will remain front and center in next week’s holiday-shortened calendar. We get the May JOLTS report on Tuesday and the June employment report on Friday. For the latter we expect nonfarm payrolls to rise 200k and the unemployment rate to be unchanged at 4.0%.
Cooler inflation, softer consumption growth
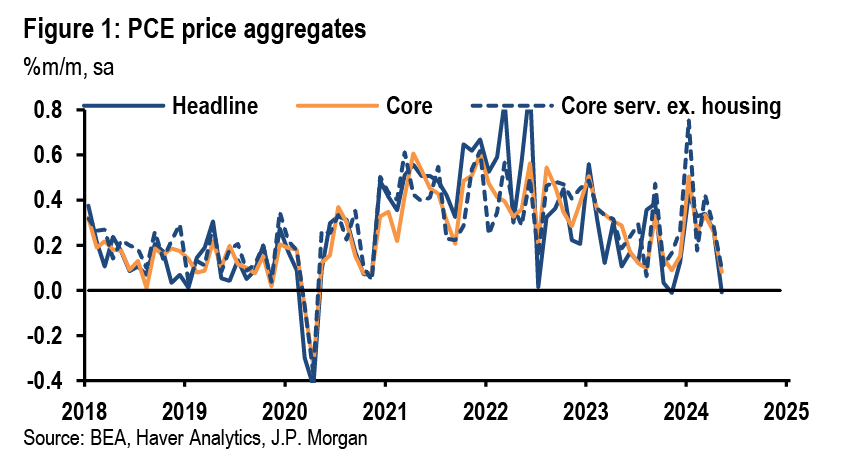
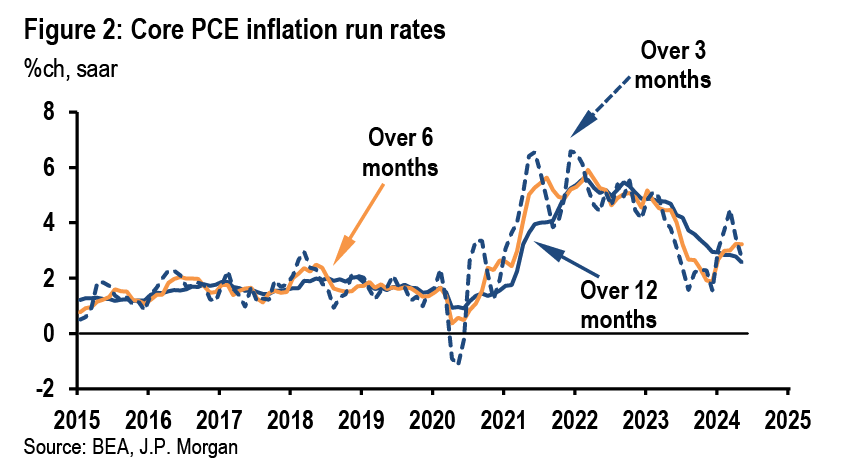
Core PCE price growth for May, at 0.083% to three decimals, was the softest monthly reading since November 2020 (Figure 1). Services excluding housing was also only up 0.1%m/m (3.4%oya), and headline inflation was flat (2.6%oya). These data are good news for the Fed, though FOMC members will want to see more low readings to gain confidence that inflation is moving back to 2%. Over the last three months core inflation rose 2.7% saar, down from a recent peak of 4.5% in March (Figure 2). While consistent with the story that the firm inflation we saw in 1Q was a bump amidst a gradual moderation, the May month-on-month change probably overstates how quickly core price growth will drop. Even so, we think that the FOMC will take enough comfort from this trend to begin lowering the funds rate starting in 4Q.
Real consumer spending rose 0.3%m/m (0.26%) in May, which brought the 2Q run-rate to 1.4%q/q, saar, and we now see a risk that the full 2Q growth could come in a bit below 2%. Growth for the first quarter had originally been reported at 2.5%, then 2.0% after Thursday’s final GDP report that had been revised down to 1.5%. 1H24 consumption growth around 1.5% is a notable downshift from 2H23, when growth ran a touch over 3%. That said, relatively healthy labor markets and wage gains should still provide some support for consumers. The May personal income and outlays data offered some evidence for this, with nominal personal income increasing 0.5%m/m and compensation up 0.6%m/m. With overall prices flat during the month real DPI increased a robust 0.5%m/m, the strongest gain seen within the past year. For the quarter, however, real DPI is increasing at a milder 1.4% annualized pace, similar to the 1.3% gain in 1Q.
Some weakness in core capital goods
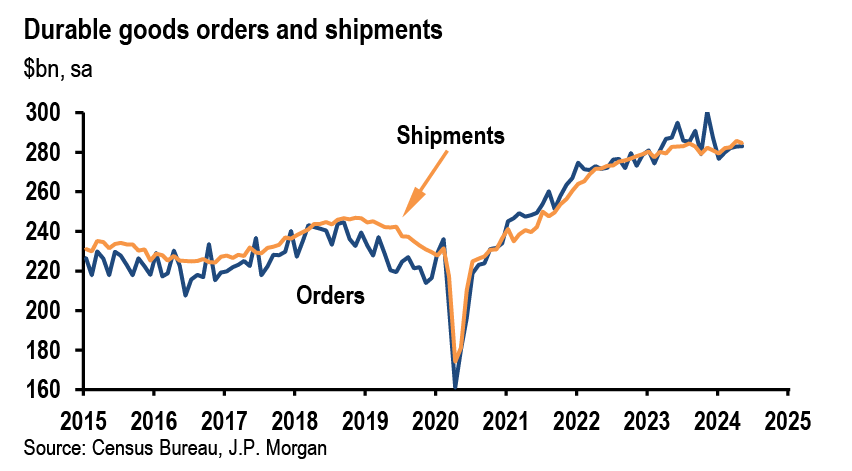
The details of the durable goods report were somewhat soft in May. Core capital goods shipments (nondefense ex aircraft) slid 0.5%m/m and are down at a 1.9%q/q, saar pace so far in 2Q, while core capital goods orders fell 0.6%m/m. On a 12-month basis both core capital goods shipments and orders are roughly unchanged (Figure 3). Moreover, regional Fed surveys of capex intentions point to little if any growth in core shipments in coming months, although the relationship between these surveys and the shipments data is loose. Ex-transportation shipments are tracking a 0.7%q/q, saar increase in 2Q, while total shipments are up at a 6.8% pace, reflecting 48%q/q, saar growth in volatile civilian aircraft shipments. Thus we still think overall equipment spending will be a boost for 2Q output growth despite the soft details in this week’s May report. This is also consistent with the strength in capex we have been tracking globally.
The housing revival, no more
The prospects of high-for-longer interest rates are again weighing on the housing recovery. After some glimmers of hope for the sector earlier in the year, recent readings from the housing market have been weaker. This week both new and pending home sales dropped in May. New home sales were down 11.3%m/m to a 619k annualized pace, but the blow was cushioned by material upward revisions to the prior three months. The May reading is the lowest since November 2022, but with the upward revisions it would be too early to conclude that new home sales are breaking lower for good. Similarly, the index of pending home sales, which lead existing home sales by one to two months, declined 2.1%m/m (-6.6%oya) to a new all-time low (ex-COVID) in May, signaling ongoing weakness in the existing home market. While a new low, the most recent reading is a just a bit below other recent observations. We think these recent readings imply that residential investment will fall 4-5% during 2H. For more on the single-family side of this, see this week’s Focus.
Calmer claims ahead of solid jobs report
Ahead of a week full of labor market data, initial jobless claims fell for the second consecutive week after heading higher for a number of weeks prior, which may have been partially related to noise around the earlier holidays. Initial claims pulled back to 233k in the week ending June 22, from 239k (previously 238k) in the prior week (Figure 4). On the other hand, continuing claims rose to 1.839m in the week ending June 15, from 1.821m. This is a new post-COVID high and is something to keep an eye on, though the latest reading isn’t that far above values in 4Q23.
The highlight of the holiday-shortened week next week will be the June jobs report. While we continue to look for the labor market to gradually cool over the rest of this year, we look for a firm report next Friday with nonfarm payrolls gaining 200k and the unemployment rate holding steady at 4.0%. Pandemic-distorted services, such as education and health care, as well as government, are likely to again account for the bulk of the job growth. Wage growth should also remain fairly firm, with average hourly earnings expected to rise 0.3% on the month. But this should put year-ago growth in earnings below 4% for the first time since mid-2021, another encouraging sign for the Fed. Earlier next week the May JOLTS report is expected to show job openings slipped below 8 million for the first time since early 2021—a further easing of labor demand and an indication that the labor market is continuing to gradually move into better balance.
Excerpted from, United States Data Watch , Michael Feroli, June 28, 2024
Treasuries
2024 Mid-year Outlook
- We expect Treasury yields to remain rangebound through the summer, with a decline from current levels expected later this year only once the Fed begins easing
- Yields tend to decline ahead of shallow easing cycles, as seen in 1995 and 2019. However, current market pricing and carry implications make it challenging to be structurally long duration. We find the most value in the 3- to 5-year sector
- We forecast a 25bp cut at the November FOMC meeting, followed by a quarterly cadence of cuts thereafter. We project 2-year yields to decline to 4.60% and 10-year yields to sit at 4.40% at YE24
- Synthetic forwards created from equi-notional curve flatteners provide a better carry profile for bullish duration exposure than outright longs
- Given the expected Fed easing and fiscal dynamics, long-end steepeners offer value: we find the most value in 5s/30s which appears too flat after adjusting for market-based Fed policy and inflation expectations, and the Fed’s share of the Treasury market
- The US Presidential and Congressional elections could impact the fiscal outlook and Treasury market. A Trump victory with a Republican sweep could lead to higher yields and steeper curves due to elevated volatility and fiscal concerns, while a Biden victory with a blue sweep could result in modestly lower yields
- We expect nominal coupon auction sizes to remain stable through fall 2025, as Treasury has created ample borrowing capacity for the next year. The risks to this baseline stem from potential changes to Treasury’s debt management strategy, the Fed’s balance sheet reinvestment strategy for MBS paydowns, and the results of the November election
- Demand from foreign investors and US banks has been stronger than anticipated in 1H24, and we revise our forecasts higher for the year. However, asset manager demand has been weaker than expected. Given the transition to more price-sensitive investor demand, dealer inventory in Treasuries have risen to record highs
Market views
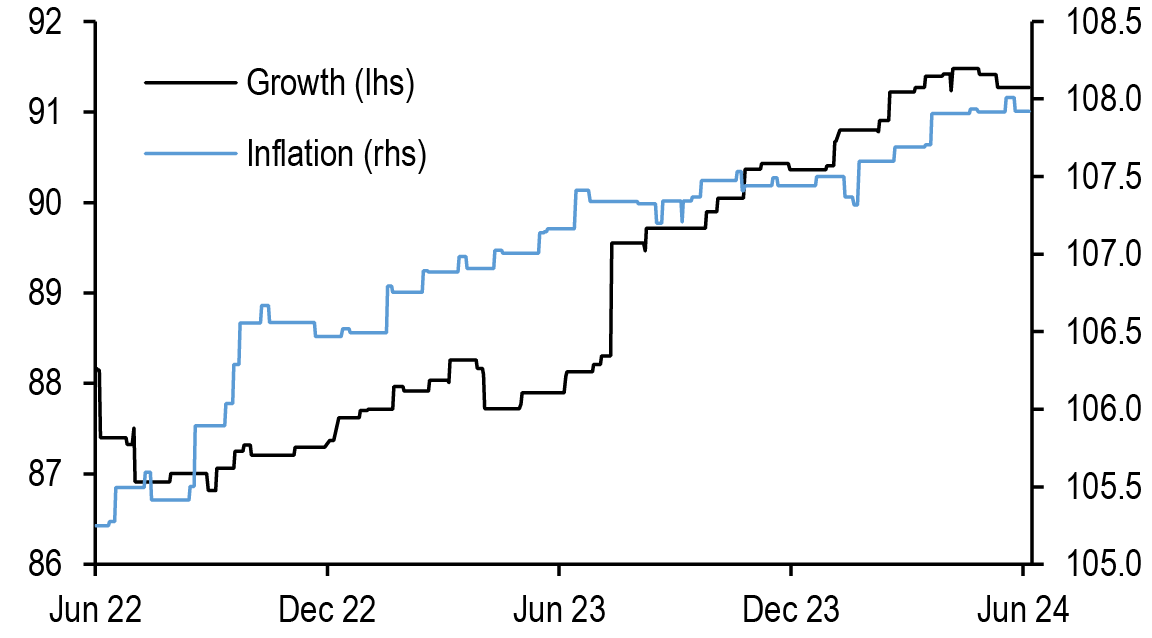
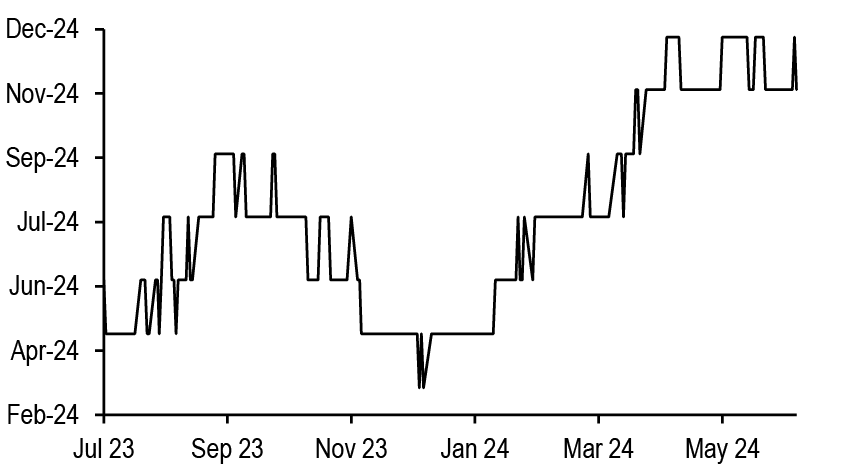
Rates market participants entered 2024 with peak optimism: core PCE had risen 1.9% at an annualized rate in 2H23, and the outcome of the December 2023 FOMC meeting was decidedly dovish. Given this backdrop, by mid-January, OIS forwards had priced a full 25bp ease by the March 2024 FOMC meeting and 175bp of easing in 2024. This optimism was relatively short-lived though, as a series of firmer-than-expected inflation prints in 1Q24 derailed the notion of an “immaculate disinflation.” This was accompanied by a series of upside surprises to growth, driving our US growth and core CPI Forecast Revision Indices higher over most of 1H24 ( Figure 17). In response, markets priced in a high for long path for the Fed, and money markets are not pricing a full 25bp ease until the November FOMC meeting ( Figure 18). Given this pendulum shift, Treasury yields rose in 1H24, though have retreated from their local peaks, as the May CPI report assuaged the worst fears that inflation was accelerating, retail sales indicated consumption is slowing, and both JOLTS as well as initial claims gave further sense the labor market continues to slowly rebalance. Net of these factors, 2-, 5-, 10-, and 30-year yields have risen 66bp, 55bp, 48bp, and 43bp, respectively, but are also 30-40bp off their highest levels seen just a month ago.
Figure 17: There were serially upward revisions to growth and core inflation forecasts in 1H24...
J.P. Morgan US Growth FRI (lhs) and US core CPI FRI (rhs); index
Source: J.P. Morgan
Figure 18: ...and the market-implied timing of the first cut has moved back to late-2024
Date of first expected Fed ease as derived from FOMC meeting date OIS forwards;
Source: J.P. Morgan
The rise in yields has certainly been justified by fundamentals: Figure 19 uses our fair-value framework in an attempt to attribute the YTD move in 10-year yields, and shows that rising inflation and Fed policy expectations explain substantially all the 48bp rise in yields in 1H24. First, 5- to 10-year ahead seasonally adjusted TIPS breakevens have risen 26bp YTD, but they are also considerably off their highs in April, and can explain 29bp of the bearish move. Second, 3- to 6-month ahead Fed policy expectations have risen 25bp as markets have pushed back on the timing of the first expected rate cut, contributing 12bp to the rise in yields. In aggregate, our fair-value framework would have implied a 44bp rise in yields over the first six months of the year, very close to the actual increase. It’s notable, however, that 10-year Treasuries continue to appear somewhat cheap to their drivers, and have not traded consistently rich on this basis since the wake of the regional banking crisis in spring 2023, and could perhaps reflect some implicit rise in term premium.
Figure 19: The rise in 10-year yields YTD has been justified by rising Fed policy and inflation expectations, and yields remain somewhat elevated after controlling for their fundamental drivers
Attribution analysis of 10-year Treasury yield changes 12/29/23-6/28/24*
| Variable | Current value | YTD Chg | Coeff. | Expected chg; bp |
| Intercept | -2.87 | |||
| 3m3m OIS rate; % | 5.10 | 0.25 | 0.470 | 12 |
| Fed fwd guidance; months | 0.0 | 0.0 | -0.01 | 0 |
| 5y5y TIPS breakevens; % | 2.23 | 0.26 | 1.105 | 29 |
| JPM US FRI; % pts | 91.3 | 0.9 | 0.026 | 2 |
| Fed share of UST mkt; % | 20.1 | -2.0 | -0.010 | 2 |
| Expected change from all factors; bp | 44 | |||
| Actual chg; bp | 48 | |||
| Residual on 29-Dec-23 | 17 | |||
| Residual on 28-Jun-24 | 20 |
Source: US Treasury, Federal Reserve Bank of New York, J.P. Morgan
* Regression from 1/4/19-12/29/23, R-squared = 98.1%, SE = 16.1bp
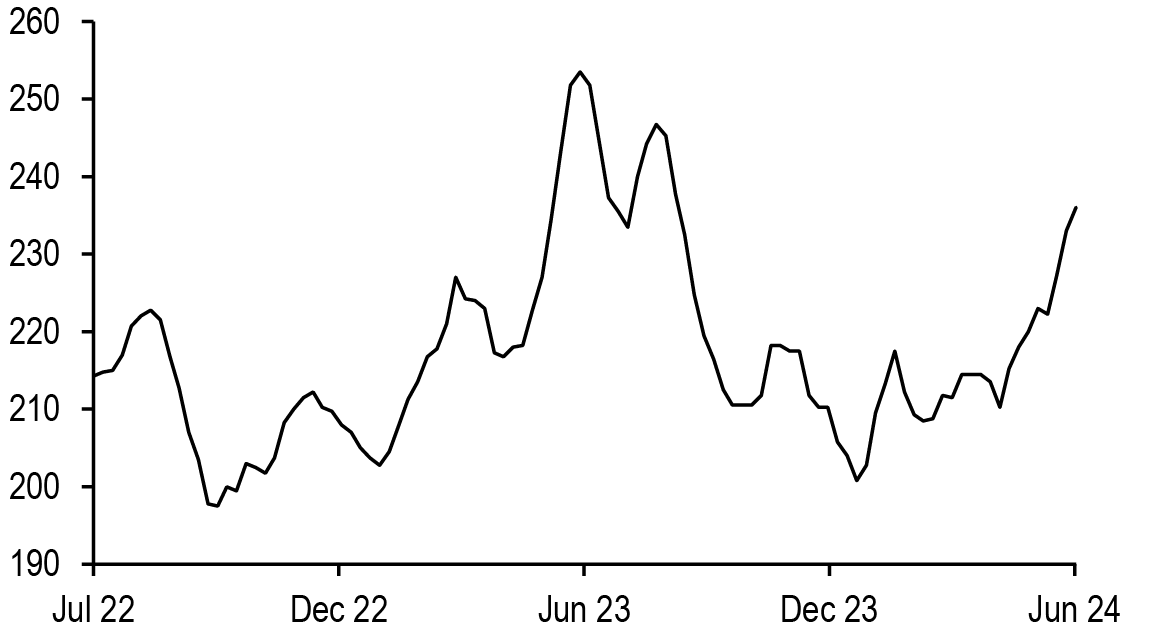
The market’s Fed expectations are likely to remain the dominant driver of Treasury yields over the 2H24. Overall, we continue to forecast a 25bp cut in November, followed by a quarterly cadence of cuts after that, and there is growing comfort the Fed will have room to ease for a number of reasons. First, consumption is slowing: after rising at a 3% annual rate in 2H23, real consumer spending is rising closer to 2% in 1H24. Second, job openings continue to decline sharply in 1H24, falling to their lowest levels since early-2021, giving an indication the labor markets continue to rebalance. Third, we see some indication that growth momentum is slowing in other labor market indicators as well: the 4-week average of initial claims has been steadily rising for the last two months and is now approaching its highest levels since last fall, indicating the labor markets are loosening somewhat ( Figure 20). Though claims have been rising, this does not give us immediate concern about a sharper rise in the unemployment rate, as we do not see a rising trend in layoffs at this point (see Focus: Claims could move up with falling job finding rates, Murat Tasci, 6/21/24).
Figure 20: Initial claims have risen to their highest levels since September, indicating some loss of growth momentum
Initial jobless claims, 4-week moving average; ‘000s
Source: Department of Labor
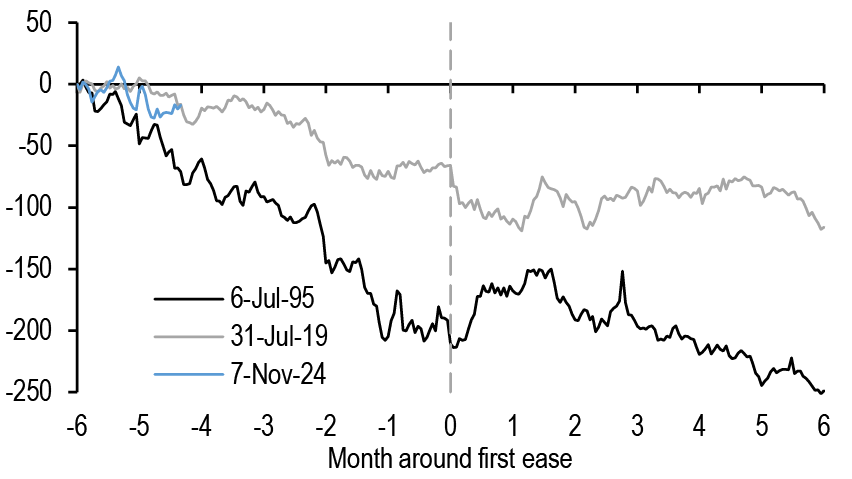
Figure 21: Yields have declined ahead of other shallow easing cycles in 1995 and 2019...
Cumulative change in 5-year Treasury yields in the months around the first ease in a shallow Fed easing cycle*; bp
Source: J.P. Morgan
*Dates used: 7/6/1995, 7/31/2019, 11/7/2024
Nevertheless, given the inability to identify vulnerabilities that would drive the US economy into a severe recession, it remains likely this easing cycle will be shallower, and perhaps more closely resemble the 1995 and 2019 easing cycles rather than the aggressive easing cycles during the 2001 recession and the GFC in 2007-2008. In that vein, it would seem there is still room for yields to decline, even if the Fed eases in a shallower fashion. Figure 21 tracks the changes in 5-year yields from 6 months prior to the first ease in these “mini” easing cycles to 6 months after, assuming the Fed first lowers rates at the November 7 FOMC meeting. On average, yields tend to decline more than 125bp in the six months prior to the first cut in these more muted easing cycles.
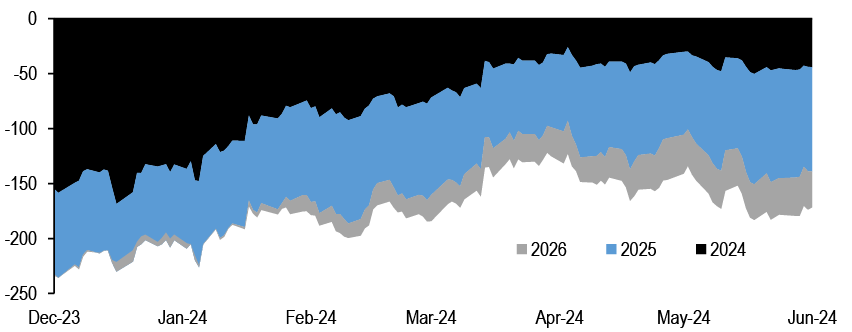
These factors make the case to be long duration as we enter 2H24, but we think market pricing is a limiting factor, as the inversion of money market curves means long duration trades incur negative carry. Indeed, OIS forwards are pricing in 140bp over the next 18 months ( Figure 22). This is roughly in line with our own forecast, and means it will be hard for yields to decline considerably from current levels, unless markets are willing to price in an earlier start to the easing cycle, a series of faster cuts, or a deeper cutting cycle. As a result, even though the onset of the easing cycle appears to be just a few months away, carry implications and outright valuations make it challenging to be structurally long duration. Therefore, we prefer to add duration when yields are near the upper end of their recent ranges, unless we see the data give us some sense the Fed needs to lower rates more aggressively than we expect, and we will be actively watching the trends in initial claims for signs of broader labor market weakness.
Figure 22: ...but money markets are already priced for such an outcome, with OIS forwards pricing 140bp in easing over the next 18 months
Amount of easing implied in 2024, 2025, and 2026 by OIS forwards; bp
Source: J.P. Morgan
Overall, while even shallower easing cycles are supportive of lower Treasury yields, given that money markets are priced for a path of Fed easing that looks similar to our own forecasts, we think it will be challenging for yields to decline further unless we price a faster or deeper easing cycle. As a result, with our own forecast looking for the first cut in November, we look for yields to remain rangebound through the summer, only declining more significantly once the Fed begin to deliver a series of quarterly cuts early in 2025 ( Figure 23). Overall, we look for 2-year yields to decline to 4.60% by YE24, while our forecast projects 10-year yields will sit at 4.40% by 4Q24.
Figure 23: We look for yields to remain rangebound through the summer and for the front-end to lead the move to lower yields in the fall
J.P. Morgan interest rate forecast; %
| Actual | 1m ahead | 3Q24 | 4Q24 | 1Q25 | 2Q25 | |
| 28-Jun-24 | 28-Jul-24 | 30-Sep-24 | 31-Dec-24 | 31-Mar-25 | 30-Jun-25 | |
| Rates (%) | ||||||
| Effective funds rate | #N/A Requesting Data... | 5.35 | 5.35 | 5.10 | 4.85 | 4.60 |
| SOFR | #N/A Requesting Data... | 5.30 | 5.35 | 5.10 | 4.85 | 4.60 |
| 2-yr Treasury | 4.72 | 4.70 | 4.75 | 4.60 | 4.30 | 4.05 |
| 3-yr Treasury | 4.51 | 4.50 | 4.55 | 4.40 | 4.15 | 3.95 |
| 5-yr Treasury | 4.33 | 4.30 | 4.40 | 4.25 | 4.00 | 3.80 |
| 7-yr Treasury | 4.32 | 4.30 | 4.40 | 4.25 | 4.00 | 3.80 |
| 10-yr Treasury | 4.34 | 4.35 | 4.50 | 4.40 | 4.20 | 4.00 |
| 20-yr Treasury | 4.60 | 4.60 | 4.70 | 4.60 | 4.40 | 4.20 |
| 30-yr Treasury | 4.50 | 4.50 | 4.65 | 4.60 | 4.50 | 4.35 |
Source: J.P. Morgan
Along the curve, given how little is priced into 2026, we think there is value in being long in the greens, or in the 3- to 5-year sector of the spot curve. Locally, with yields near the bottom end of their recent ranges, it’s tough to be long duration, even though Treasuries appear modestly cheap on a fair value basis. Furthermore, we think the ongoing rapid growth of the Treasury market will continue to outstrip demand from more price-insensitive investors, and this shift in demand will over time lead to higher term premium, which should result in a gentler decline in long-end yields even as the Fed begins easing (see In the eye of the beholder, 9/12/23). Thus, when we add duration we prefer to stay shorter in the curve to insulate against the risks of higher term premium.
Even front-end longs incur negative carry, but as we have discussed for the last few months, there are ways to thoughtfully construct long-duration proxies with better carry profiles. Equi-notional flatteners synthetically replicate exposure to Treasury forward yields and replicate bullish duration exposure with better carry profiles than outright longs (see Treasuries, US Fixed Income Markets Weekly, 3/22/24). By maintaining equal notionals, these flatteners have a smaller bearish exposure in the short-duration leg of the trade when compared to a duration-neutral flattener, resulting in a bullish duration exposure. Figure 24 displays various synthetic forward Treasuries constructed using equi-notional flatteners, with their carry statistics, the proportion of the variation in these forwards explained by underlying spot Treasury yields, and the beta to changes in spot yields. The table shows that spot Treasuries in the short- to intermediate sector explain a high share of the variation in these equi-notional flatteners, with relatively high betas as well. Along the curve, synthetic 2y3y and 3y2y forward Treasury yields are sitting above their 6-month averages, and exhibit a high correlation with changes in 3- to 7-year Treasury yields and relatively neutral carry profiles. Thus, we would use any bearish move to add synthetic front-end forward exposure via one of these equi-notional flatteners.
Figure 24: Synthetic forwards created from equi-notional Treasury curve flatteners create bullish duration exposure, but with a better carry profile than outright longs
Statistics of various synthetic forward rates created from equally-notional weighted curve trades*, 3-month percentile, and 3-month carry + roll, and statistics of 6-month regressions of 5-day changes versus different points of the Treasury curve; units as indicated
| R-squared | Beta | ||||||||||||||
| Forward | Level (bp) | 6m % | 3m C+R (bp) | 1y | 2y | 3y | 5y | 7y | 10y | 1y | 2y | 3y | 5y | 7y | 10y |
| 1y1y | 212 | 59% | -6.7 | 55% | 95% | 92% | 90% | 85% | 79% | 0.85 | 0.72 | 0.65 | 0.61 | 0.41 | 0.62 |
| 2y1y | 127 | 44% | -0.5 | 61% | 79% | 92% | 91% | 91% | 88% | 0.53 | 0.38 | 0.38 | 0.37 | 0.37 | 0.38 |
| 2y3y | 233 | 55% | 0.6 | 54% | 80% | 89% | 97% | 99% | 99% | 0.85 | 0.66 | 0.64 | 0.64 | 0.65 | 0.69 |
| 3y2y | 154 | 59% | 0.9 | 47% | 75% | 82% | 93% | 96% | 98% | 0.52 | 0.42 | 0.40 | 0.41 | 0.42 | 0.45 |
Source: J.P. Morgan
*2y1y is derived from an equi-notional weighted combination of 2- and 3-year Treasuries
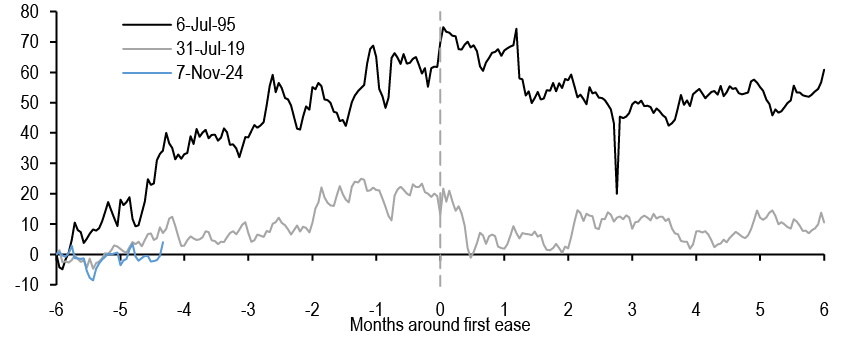
Turning to the curve, Fed easing supports a steeper curve, and our work has shown that the long end tends to steepen first in the period between the last hike and the first ease, while the front end reacts only once the Fed begins easing (see Treasuries 2023 Outlook, 11/22/22). For this reason, we have preferred long-end steepeners as a more strategic representation of our view, but these steepeners have had limited success thus far. Our work has also shown that the curve still steepens into shallow easing cycles ( Figure 25). However, the magnitude of steepening varies, as 5s/30s steepened about 75bp prior to the first ease in 1995, then traded in a range in the ensuing months, while the curve steepened just 25bp in the months leading up to the first cut in 2019. This makes sense to an extent: in 1995 the Fed eased modestly into an economy that was benefitting from rising productivity and trend growth rates, supporting a rising neutral policy rate, as policy rates passively became less restrictive over time. Meanwhile in 2019, the Fed preemptively eased in order to better anchor inflation expectations in an environment where core inflation was struggling to rise to 2%.
Figure 25: Similarly, the long end has steepened ahead of shallow easing cycles, though the curve steepened more aggressively in 1995 compared to 2019
Cumulative change in 5s/30s Treasury curve in the months around the first ease in a shallow Fed easing cycle*; bp
Source: J.P. Morgan
*Dates used: 7/6/1995, 7/31/2019, 11/7/2024
Figure 26: The market’s medium-term monetary policy and inflation expectations, alongside the Fed’s footprint in the Treasury market explain most of the variation in curve pairs and the long end appears somewhat flat on this basis
Statistics for various Treasury curves over the last 3 years, with statistics from 3-year regressions on 1y1y OIS (%), 5Yx5Y TIPS breakevens (%), and Fed share of the Treasury market (%); bp unless otherwise indicated
| Curve | Last | Min | Max | Avg | % | R^2 | Partial betas | Residual | Z-score | |||
| 1y1y OIS | 5y5y BE | Fed share | 3m C+R | |||||||||
| 2s/5s | -39 | -78 | 78 | -13 | 39% | 87% | -0.28 | 1.14 | 2.44 | 7.8 | 0.5 | -11.6 |
| 2s/7s | -40 | -91 | 108 | -9 | 37% | 88% | -0.38 | 1.31 | 1.05 | 3.5 | 0.2 | -13.9 |
| 2s/10s | -38 | -109 | 129 | -10 | 47% | 89% | -0.47 | 1.40 | -0.73 | 4.0 | 0.2 | -15.9 |
| 2s/20s | -11 | -96 | 183 | 24 | 42% | 90% | -0.51 | 1.34 | -0.39 | 1.3 | 0.1 | -18.7 |
| 2s/30s | -22 | -119 | 190 | 11 | 48% | 92% | -0.60 | 1.36 | -2.39 | 0.8 | 0.0 | -18.1 |
| 3s/7s | -19 | -55 | 81 | -2 | 41% | 90% | -0.28 | 0.69 | -1.86 | -5.0 | -0.5 | -8.1 |
| 3s/10s | -17 | -76 | 106 | -4 | 51% | 91% | -0.36 | 0.77 | -3.64 | -4.4 | -0.4 | -10.1 |
| 3s/20s | 9 | -63 | 162 | 31 | 43% | 91% | -0.41 | 0.71 | -3.30 | -7.2 | -0.5 | -12.9 |
| 3s/30s | -1 | -86 | 169 | 18 | 52% | 93% | -0.49 | 0.73 | -5.30 | -7.7 | -0.6 | -12.3 |
| 5s/10s | 1 | -36 | 61 | 3 | 62% | 90% | -0.19 | 0.25 | -3.17 | -3.8 | -0.6 | -4.2 |
| 5s/20s | 27 | -23 | 117 | 37 | 46% | 86% | -0.23 | 0.20 | -2.83 | -6.5 | -0.7 | -7.1 |
| 5s/30s | 17 | -46 | 124 | 24 | 60% | 91% | -0.32 | 0.22 | -4.83 | -7.0 | -0.7 | -6.5 |
| 7s/10s | 2 | -21 | 25 | -1 | 75% | 88% | -0.08 | 0.09 | -1.78 | 0.6 | 0.2 | -2.0 |
| 7s/20s | 28 | -8 | 82 | 33 | 47% | 77% | -0.13 | 0.03 | -1.44 | -2.2 | -0.3 | -4.8 |
| 7s/30s | 18 | -37 | 91 | 20 | 65% | 88% | -0.21 | 0.05 | -3.44 | -2.7 | -0.4 | -4.2 |
| 10s/20s | 26 | 13 | 58 | 35 | 22% | 55% | -0.05 | -0.06 | 0.34 | -2.7 | -0.5 | -2.8 |
| 10s/30s | 16 | -18 | 68 | 21 | 52% | 84% | -0.13 | -0.04 | -1.66 | -3.2 | -0.6 | -2.2 |
Source: J.P. Morgan
Nonetheless, we need to be discerning in choosing the right pair to express this view. Figure 26 shows that the market’s medium-term Fed policy and inflation expectations, as well as the Fed’s ownership share of the Treasury market can explain more than 50% of the variation in most Treasury curve pairs, with the R-squared above 77% for every pair except for 10s/20s, which has had a unique set of drivers in recent years. A few things stand out from this table. First, many curve pairs remain near their flattest levels of the last 3 years, making steepeners attractive if the Fed does indeed begin easing later this year. Second, most front-end pairs look too steep after controlling for these 3 factors, and when combined with exceedingly negative carry profiles, make these steepeners very unattractive. Third, most long-end pairs appear somewhat flat relative to their drivers, and the carry profiles are more reasonable than their front-end brethren. Accordingly, we think long-end steepeners offer value to position for the coming easing cycle, and we like 5s/30s, given it displays relatively high sensitivity to the market’s medium-term Fed policy expectations, and appears 7bp too flat in our fair-value framework.
The 2024 election and risks to the modal view
There are two distinct sets of risks to this modal view. On one hand, if the nascent signs of slowing we observe via consumer spending, demand for labor, and housing markets become more nefarious, this could force the Fed to ease earlier and more aggressively than we have forecast, which would present downside risk to our interest rate forecast. On the other, we think that this fall’s US presidential and congressional elections could also present risks to this modal view, particularly as it pertains to the fiscal outlook.
On that note, CBO’s latest 10-year budget projections forecasted $22tn in deficits over the next decade, an approximately $2.1tn increase from its prior projections. 1As a result, CBO projects debt held by the public rising from 97% of US GDP to 122% over the next decade, even with the baseline assumption that the individual income tax cuts from the 2017 TCJA expire after 2025. As a result, there’s been an intense amount of focus on how the elections could move the fiscal needle beyond this baseline. As a starting point, it seems there is little room for a major amount of fiscal expansion in a divided government, and it seems this is a consensus view, with the Senate likely to flip to Republican control, while the Democrats take the majority in the House of Representatives. In this case, some extension of the TCJA for low- and middle-income taxpayers seems likely, but in all likelihood this would be funded by higher corporate tax rates, thus mitigating the impact on the deficit in future years. Thus, purely from a fiscal perspective, we do not think a Biden or Trump victory, accompanied by a split Congress, should have major implications on the Treasury market.
However, we found that former President Trump’s relatively unorthodox style of addressing trading and monetary policy via social media played a statistically significant role in elevating implied volatility (see Introducing the Volfefe Index: Quantifying the impact of presidential tweets on rates volatility, 9/6/19). Should he proceed similarly in a second term, elevated volatility could also contribute to higher term premium, as we have found volatility is a key driver in academic measures of term premium (see In the eye of the beholder, 9/12/23). Thus, a Trump presidency, even with a divided government, could result in modestly higher yields and steeper curves, all else equal.
Meanwhile, sweeps in either direction matter for fiscal outcomes. On one hand, if President Biden is reelected with a blue sweep in Congress, his Administration would likely raise the corporate tax rate from 21% to 28% and also raise taxes on high income earners, and this would likely reduce the federal budget deficit by $2.2tn over the next decade. 2 On margin, this would be seen as a relief from a financing perspective, but the Tax Foundation also notes that this budget would reduce GDP by 2.2% over the next decade with lower wages and fewer jobs. As a result, we think a blue sweep would likely result in modestly lower Treasury yields.
Conversely, a red sweep could have serious consequences for Treasury yields. Former President Trump has talked about extending the tax cuts from the 2017 TCJA. Already CBO has published on how this could impact the budget, finding extending the 2017 act would add more than $4tn in primary deficits to the debt over the next decade if not accompanied by new revenue.3
On that note, former President Trump has also talked about imposing a 10% tariff on all imported goods, with a 60% tariff for imported Chinese goods. The US imported $3.1tn of good in 2023, with China comprising 16.5% of that total. At face value, this would be worth about $565bn in revenue annually, more than offsetting the loss of revenue from the TCJA extension. However, the Committee for a Responsible Federal Budget (CRFB) estimates that given expected behavioral shifts, this 60% Chinese tariff would raise only $300bn over a decade on the high side, and a $50bn loss of revenue on the low side. If we take the average of these two numbers, it’s only about $125bn in new revenue over the next 10 years. CRFB also estimated the 10% global tariff would bring in $2tn in revenue over a decade, though this was before the statement was made on Chinese tariffs. Accordingly, we would need to haircut this number by about $125bn.
In sum, the net of an extended TCJA would forego over $4tn in revenue over the next decade, with an additional $600bn in interest expense, but this would be offset by approximately $2tn in tariff revenue. Still, the deficit would widen by close to $2.5tn over the next decade, with much of this move occurring in FY26 onward. We think the fiscal concerns that briefly captured market participants’ attention last fall could come back to the forefront, driving the Treasury curve bearishly steeper. There is no perfect analog for this scenario, but 10-year yields rose more than 100bp last fall. To be fair, even though the Fed last hiked in July 2023, markets were pricing further Fed tightening through the fall, so this rise was definitely not primarily about fiscal concerns. However, the residual of our fair-value model rose more than 70bp over that period as yields rose, indicating that a substantial part of this increase was not driven by shifts in Fed policy, growth, or inflation expectations, and fiscal concerns could be responsible for part of the rise in yields ( Figure 27).
Figure 27: Long-end yields rose 100bp+ in the fall and summer of 2023, with the residual on our fair-value model rising more than 70bp over the period, indicating this move was not just about rising growth, inflation, and policy expectations...
10-year Treasury yields (lhs; %) versus residual from J.P. Morgan 10-year Treasury fair-valued model* (rhs; bp);
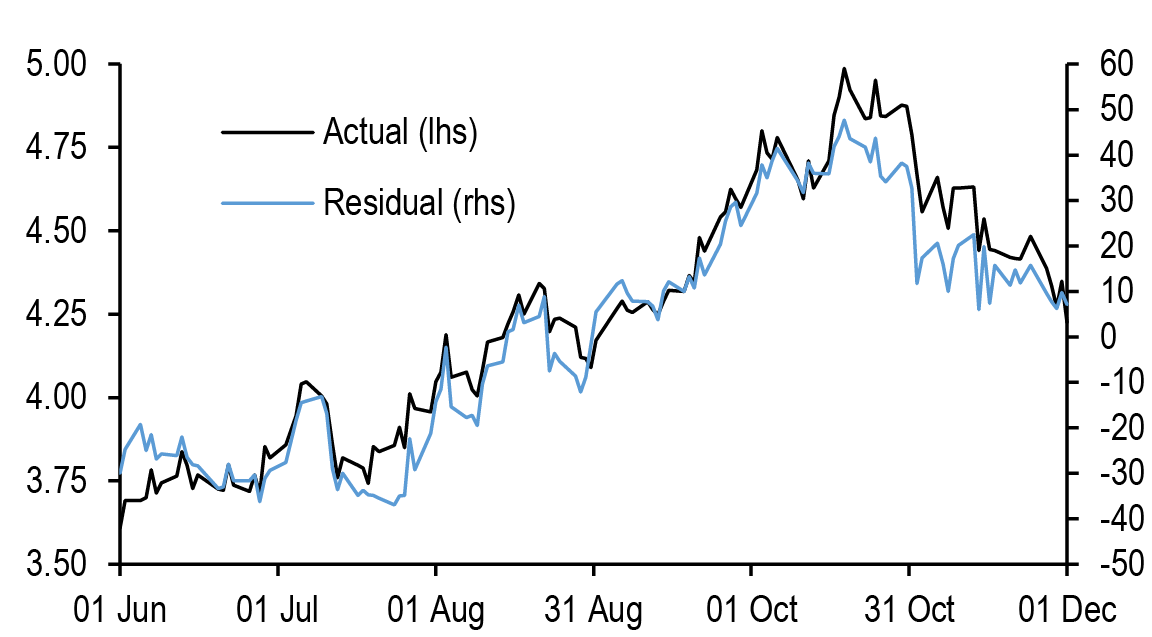
Source: J.P. Morgan, Federal Reserve, US Treasury
* Regression of 10-year Treasury yields on 5Yx5Y seasonally-adjusted TIPS breakevens (%), 3m3m OIS rates (%), Fed policy guidance (months), J.P. Morgan US Forecast Revision Index (%), and SOMA share of outstanding marketable US Treasury debt, excluding T-bills (%). Regression over the last 5-years. R-squared = 98.3%, SE = 17.1bp
Figure 28: ...and UK Gilt yields rose sharply following the mini-budget announcement in September 2022
10-year UK Gilt yields (lhs; %) versus 10-year UK swap spreads (rhs; bp), vertical line denotes UK mini-budget announcement on 9/23/22
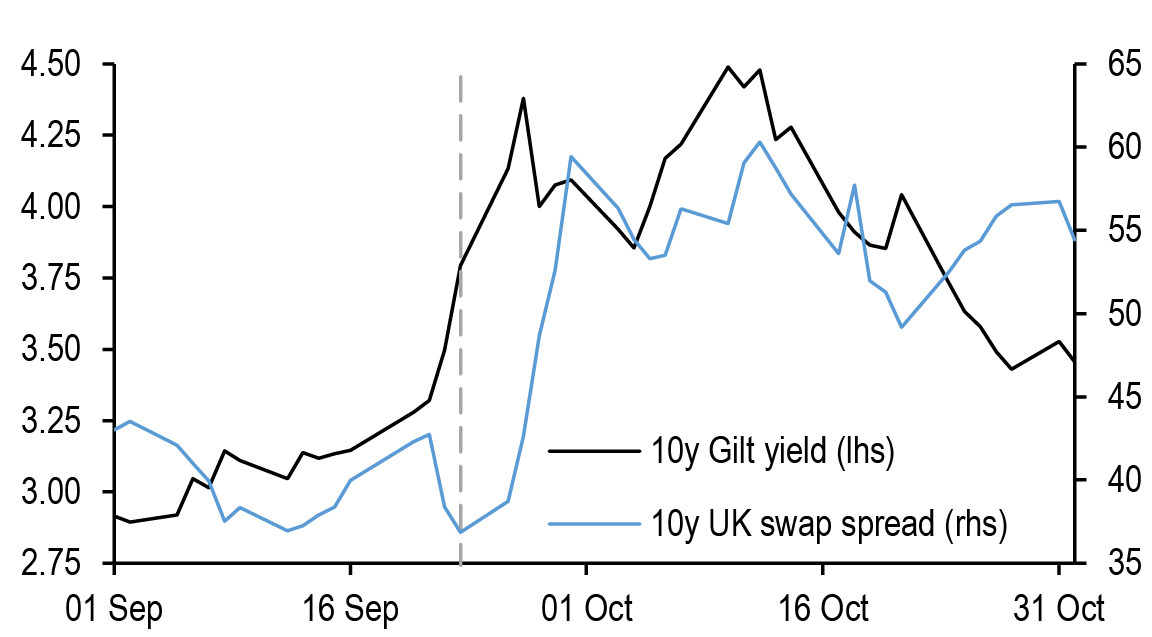
Source: J.P. Morgan
Away from the US, the UK mini-budget announcement of September 2023 sparked fiscal concerns there, as 10-year Gilt yields rose 125bp in short order, and cheapened 25bp on an asset swap basis ( Figure 28). Certainly, this disorderly move was sparked by unfunded tax cuts in this announcement but was also aided by the deleveraging of the UK LDI community. The Treasury market is tenfold larger than the gilt market, is supported by a wider set of global investors, and does not have a pooled, levered LDI universe like in the UK, so it seems it would be hard for Treasuries to experience a move anywhere near the magnitude of what was seen in the fall of 2022.
Treasury supply in 2H24
As we enter 2H24, the fiscal picture has slipped a bit further: we now project a $1.915tn deficit in FY24, versus our $1.6tn prior forecast ( Figure 29). However, we would note that this overstates the deterioration in public finances: a $145bn increase in projected outlays for student loans stems mostly from revisions that the Administration made to the estimated subsidy costs of previously issued loans and from the Administration’s proposed rule to reduce many borrowers’ student loan balances. Notably, the subsidy costs need to be recognized up front, thanks to the Fair Credit Reform Act of 1990. Adjusting for this accounting, we think this equates for a $1.770tn deficit that needs to be financed in FY24, or about 6.5% share of GDP. Though the fiscal picture appears somewhat worse than it did earlier this year, and will require more marketable borrowing, we do not anticipate this will require Treasury to lift coupon auction sizes further.
Figure 29: The budget deficit is wide for a labor market near full employment...
Annual budget balance by fiscal year*, reported vs. cash flow**; $bn
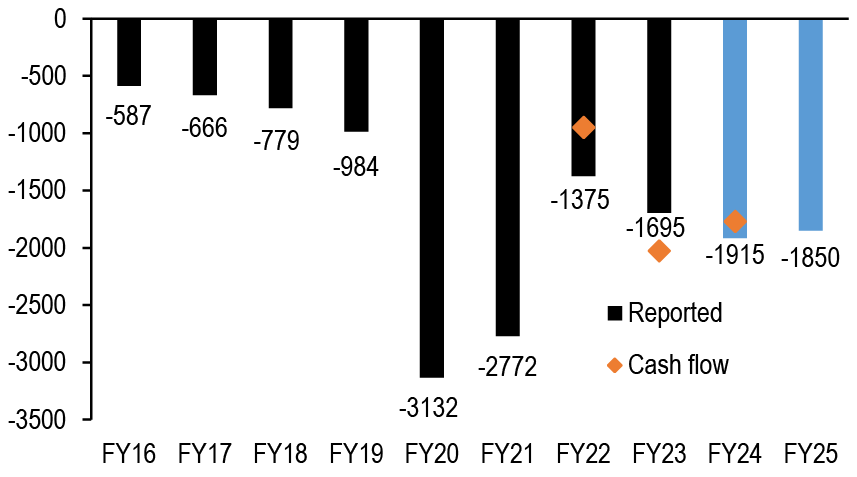
Source: US Treasury, J.P. Morgan
*FY24 and FY25 are forecasts
**Adjusts for implementation of student loan forgiveness in FY22, reversal in FY23, renewed implementation in FY24
Figure 30: ...but Treasury has created significant borrowing capacity over the last year
US Treasury net coupon borrowing capacity* versus total funding needs**; $bn
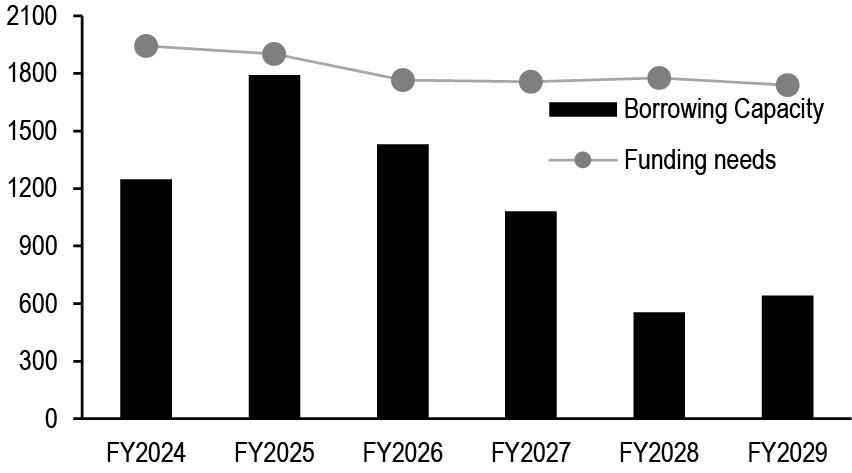
Source: US Treasury, Congressional Budget Office, J.P. Morgan
*Assumes current auction scheduled is maintained through FY29 and incorporates borrowing capacity created by SOMA reinvestments. Assumes pace of Treasury QT is cut to $25bn/month in June and to zero in January 2025
**Expected change in public debt, based on CBO’s budget projections and off-balance sheet funding needs
At the May refunding, Treasury commented, “Since August 2023, Treasury has significantly increased issuance sizes for nominal coupon and FRN securities. Treasury believes these cumulative changes leave it well positioned to address potential changes to the fiscal outlook and to the pace and duration of future SOMA redemptions...Based on current projected borrowing needs, Treasury does not anticipate needing to increase nominal coupon or FRN auction sizes for at least the next several quarters.” Indeed, Figure 30 shows Treasury’s expected funding needs stemming from our own budget deficit forecasts for the next two fiscal years, and CBO’s forecasts beyond that, and compares it with the borrowing capacity created via the current coupon auction schedule. Given the increases in auction sizes over the last year, Treasury created approximately $600bn in additional borrowing capacity for FY25 relative to FY24. Accordingly, we see no need for Treasury to make any further changes to auction sizes this year.
However, the figure also shows the picture changes drastically in future years: borrowing capacity begins to decline in FY26 and beyond, as large sized 5-year notes issued during the COVID-19 pandemic begin to mature and need to be refinanced. Assuming QT draws to a close by YE24, Treasury will have to address a financing gap of approximately $3.3tn from FY26-FY29, with the bulk of this gap appearing in FY27 and beyond. Though the longer-term path will necessitate larger coupon auction sizes over time, we do not think Treasury will need to address this gap in 2024. Given that the funding gap in Figure 30 is just $350bn in FY26 and the gap doesn’t widen in earnest until FY27, we think it’s unlikely Treasury will need to increase coupon auction sizes for more than a year, and we assume Treasury keeps auction sizes unchanged until November 2025 (see also Wait till next year Dissecting Treasury’s financing needs in the coming years , 5/24/24). Accordingly, we look for nominal auction sizes to remain stable at current levels for the balance of this year and project further modest increases to 5- and 10-year TIPS auction sizes ( Figure 31).
Figure 31: We project nominal coupon auction sizes are likely to be stable through fall 2025, while we expect modest further increases to 5- and 10-year TIPS auction sizes
Realized and projected gross Treasury coupon auction sizes for 2024, reopenings shaded in grey; $bn
| 2s | 3s | 5s | 7s | 10s | 20s | 30s | 5y TIPS | 10y TIPS | 30y TIPS | 2y FRN | Total | |
| Jan 24 | 60 | 52 | 61 | 41 | 37 | 13 | 21 | 18 | 28 | 331 | ||
| Feb 24 | 63 | 54 | 64 | 42 | 42 | 16 | 25 | 9 | 28 | 343 | ||
| Mar 24 | 66 | 56 | 67 | 43 | 39 | 13 | 22 | 16 | 28 | 350 | ||
| Apr 24 | 69 | 58 | 70 | 44 | 39 | 13 | 22 | 23 | 30 | 368 | ||
| May 24 | 69 | 58 | 70 | 44 | 42 | 16 | 25 | 16 | 28 | 368 | ||
| Jun 24 | 69 | 58 | 70 | 44 | 39 | 13 | 22 | 21 | 28 | 364 | ||
| Jul 24 | 69 | 58 | 70 | 44 | 39 | 13 | 22 | 19 | 30 | 364 | ||
| Aug 24 | 69 | 58 | 70 | 44 | 42 | 16 | 25 | 8 | 28 | 360 | ||
| Sep 24 | 69 | 58 | 70 | 44 | 39 | 13 | 22 | 17 | 28 | 360 | ||
| Oct 24 | 69 | 58 | 70 | 44 | 39 | 13 | 22 | 24 | 30 | 369 | ||
| Nov 24 | 69 | 58 | 70 | 44 | 42 | 16 | 25 | 17 | 28 | 369 | ||
| Dec 24 | 69 | 58 | 70 | 44 | 39 | 13 | 22 | 22 | 28 | 365 | ||
| Total | 810 | 684 | 822 | 522 | 478 | 168 | 275 | 90 | 103 | 17 | 342 | 4311 |
| 2023 | 549 | 510 | 561 | 435 | 415 | 161 | 240 | 82 | 94 | 17 | 286 | 3350 |
| Diff. | 261 | 174 | 261 | 87 | 63 | 7 | 35 | 8 | 9 | 0 | 56 | 961 |
Source: US Treasury, J.P. Morgan
We now forecast $2.317tn in net-privately held borrowing needs in 2024 and, even with a heavier reliance on T-bills than we previously expected, T-bills should comprise just 18% of total net privately-held issuance in 2024, versus 65% in 2023 ( Figure 32). If we are correct, the T-bill share of debt will remain above 20% through early-2026, even if Treasury begins increasing auction sizes in late-2025 as we have previously discussed ( Figure 33). This would leave the T-bill share above the top end of the 15-20% recommended range identified by TBAC and Treasury, but it’s been broadly understood this is a soft ceiling. Moreover, there is some indication this optimal range could be revised up. In their letter to Secretary Yellen at the May refunding, TBAC leadership "supported a return to the 15-20% range in the medium term, noting this may happen without further coupon increases. There were some members who felt the T-bill share recommendation could be revisited at a later date, given market developments and continued robust demand in the years since the original recommendation." Reading in between the lines, this indicates there is a risk that the optimal share of T-bills may migrate higher than the current recommended range over time.
Figure 32: We project $2.317tn in net privately held borrowing needs in 2024, with 80% of net issuance coming in coupons...
Annual net privately-held borrowing*, Federal Reserve purchases of Treasuries, and expected change in Treasuries held by private investors; $bn
| Year | Net privately-held borrowing | Fed secondary market purchases | Net change in privately-held debt | |||
| Bills | Coupons | Bills | Coupons | Bills | Coupons | |
| CY 2018 | 387 | 989 | 0 | 0 | 387 | 989 |
| CY 2019 | 77 | 1133 | 169 | 77 | -92 | 1056 |
| CY 2020 | 2547 | 1752 | 157 | 2184 | 2390 | -432 |
| CY 2021 | -1195 | 2898 | 0 | 957 | -1195 | 1942 |
| CY 2022 | -37 | 1638 | 0 | 75 | -37 | 1563 |
| CY 2023 | 2047 | 1107 | 0 | 0 | 2047 | 1107 |
| CY 2024 | 407 | 1909 | 0 | 0 | 407 | 1909 |
Source: J.P. Morgan, US Treasury, Federal Reserve Bank of New York
* 2024 is J.P. Morgan forecast
Figure 33: ...though the T-bill share of debt is likely to remain above 20% into 2026
T-bill share of marketable Treasury debt outstanding*; %
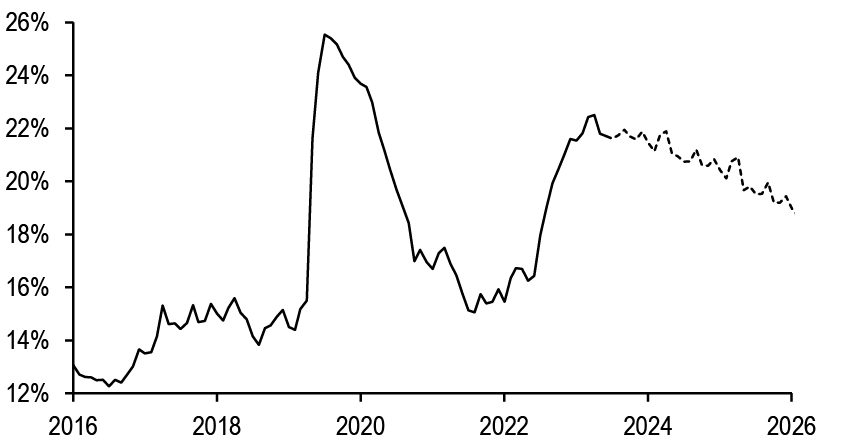
Source: US Treasury, J.P. Morgan
* Assumes issuance forecast in Figure 31, and assumes Treasury begins increasing auction sizes in November 2025, as discussed in Wait till next year, 5/24/24
Demand update
Turning to demand, we’ve been arguing for the last 18 months that Treasury demand is shifting away from price insensitive investors, like the Fed, foreign investors, and US banks, and that more price sensitive investors will comprise a larger share of Treasury market ownership over time. Indeed, this price insensitive share of demand continues to decline, falling to 51% as of 1Q24, the lowest share since 1997 ( Figure 34). Over time, we think the ongoing rapid growth of the Treasury market will continue to outstrip the demand from these investors, resulting in higher term premium.
Figure 34: The ownership of Treasuries continues to shift away from the Fed, banks, and foreign investors...
SOMA, US commercial bank, and foreign combined ownership share of marketable US Treasury debt outstanding; %
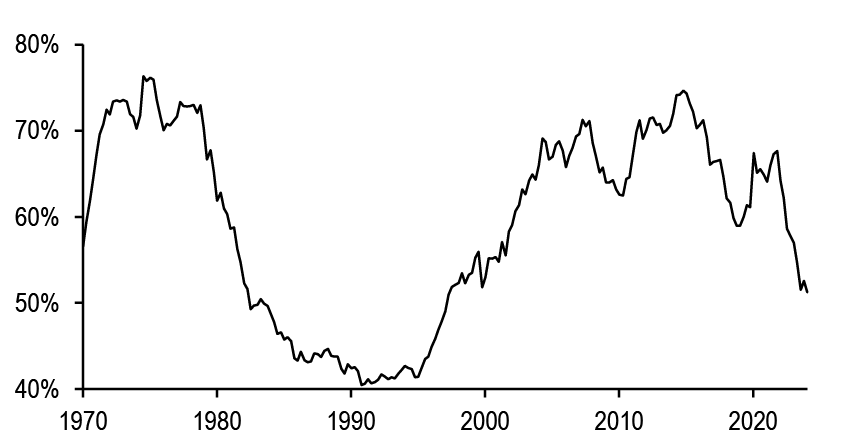
Source: Federal Reserve Z.1
Figure 35: ...though foreign demand has remained firm YTD
Annual net foreign purchases of long-term Treasuries by type*; $bn
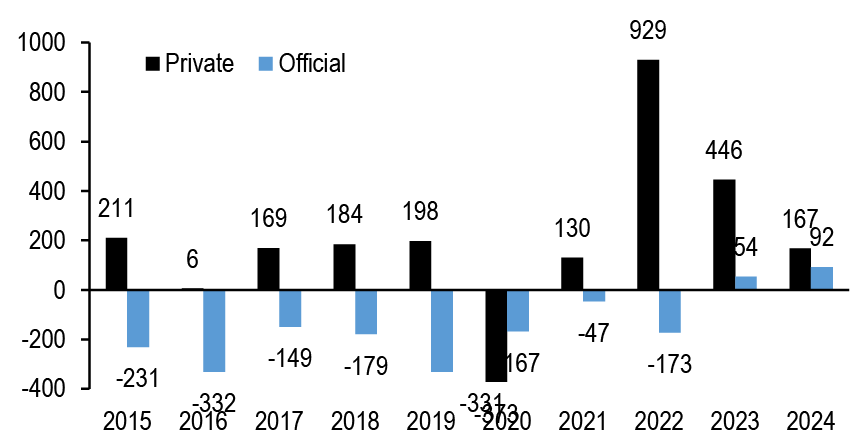
Source: Treasury International Capital System
* Though April 2024
However, it’s notable that demand from foreign investors and US banks has proven to be stronger than we had anticipated when we published our 2024 Outlook in November: YTD through April, foreign investors have bought $267bn Treasuries, running ahead of last year’s pace ( Figure 35). Notably, foreign official demand has already exceeded last year’s demand, even though our broad USD index has rallied more than 4% YTD, and foreign private demand has remained robust as well. On the private side, it’s notable that nearly 75% of this demand occurred over January and February, only just as the markets began to price in a more hawkish path for the Fed this year. Similarly, bank demand has been somewhat stronger than we had expected, totaling $66bn YTD, compared with our $25bn full-year forecast when we published in November.
Looking ahead, we update our forecasts to reflect some of this reality ( Figure 36). First, we raise our foreign demand forecast from $100bn to $400bn to reflect the trends discussed above. Looking ahead, our colleagues in EM economics continue to forecast a drawdown in EM FX reserves this year, which should restrain official demand in the coming months, even if the Fed does lower rates later this year. Meanwhile, we expect private demand to moderate somewhat versus the pace observed earlier this year, particularly as some of that demand was to position for Fed easing this year. Second, we raise our bank demand forecast from $25bn to $125bn: anecdotally it seems much of this demand has been on spread, and given the recent narrowing in swap spreads, we think there is room for banks to continue to add on this basis in 2H24. However, it’s notable that deposit growth is expected to slow in 2H24, as the organic upward drift we would expect will be somewhat offset by a more rapid pace of reserve declines over the balance of this year (see Interest Rate Derivatives).
Figure 36: We revise our foreign, bank and dealer demand forecasts higher, while modestly reducing our mutual fund demand for Treasuries in 2024
Annual net issuance of Treasuries versus purchases by investor types; $bn
| 2015 | 2016 | 2017 | 2018 | 2019 | 2020 | 2021 | 2022 | 2023 | 2024* | |
| UST net issuance; $bn | 687 | 717 | 557 | 1134 | 1068 | 4301 | 1607 | 1353 | 2434 | 1842 |
| Investor | ||||||||||
| Foreign Investors | 43 | -108 | 308 | 120 | 298 | 67 | 606 | 418 | 560 | 400 |
| Commercial banks | 15 | 96 | -43 | 87 | 126 | 328 | 449 | 9 | -150 | 125 |
| Pension/Insurance** | -32 | 101 | 152 | 57 | 12 | 15 | 171 | 73 | 125 | 175 |
| Broker dealers | 25 | 29 | 17 | 132 | -47 | -9 | -104 | 85 | 96 | 125 |
| Mutual funds | 144 | 79 | 160 | 63 | 144 | -8 | 343 | 19 | 1 | 250 |
| Money market funds | 46 | 321 | -95 | 189 | 178 | 1343 | -651 | -751 | 1205 | 250 |
| Fed | 0 | 2 | -9 | -214 | 81 | 2367 | 963 | -213 | -720 | -475 |
| Demand gap*** | 447 | 196 | 67 | 699 | 278 | 197 | -169 | 1713 | 1318 | 992 |
Source: J.P. Morgan
Federal Reserve
* J.P. Morgan estimates
** Includes private and state pension funds, life and property/casualty insurance companies
*** Positive number means supply exceeds estimated demand
Third, we modestly lower our forecast for asset manager demand from $300bn to $250bn. When we published our 2024 Outlook we argued that asset manager demand would be strong, supported by all-in yields near their post-GFC highs, but inflows would likely only pickup when total returns moved into more positive territory closer to the first cut. Since then, we’ve pushed back our first expected 25bp ease into 4Q24, and broad fixed income returns have been flat on the year. Thus, we reduced our expected demand to reflect the shift in these dynamics. Fourth, we significantly raise our dealer projections: as we discussed last week, primary dealer holdings have risen to record levels and, as a share of the overall Treasury market, are approaching levels seen in 2019 (see This one’s optimistic Broad improvements in Treasury market liquidity trends in 2024, 6/21/24). Given, other price sensitive investors have increased their Treasury holdings more slowly, we expect dealer positions will remain elevated for the remainder of this year.
Trade recommendations
- Maintain tactical 5-year duration shorts
- Stay short 100% risk, or $50mn notional of T 4.5% May-29s
-(US Fixed Income Markets Weekly, 6/14/24: P/L since inception: 10.7bp)
- Maintain 100:98 weighted 4.75% Feb 37s / 4.5% Aug 39s steepeners
- Stay long 100% risk, or $25mn notional of T 4.75% Feb-37s
- Stay short 98% risk, or $22mn notional of T 4.5% Aug-39s
-(US Fixed Income Markets Weekly, 6/14/24: P/L since inception: 0.3bp)
- Maintain 5s/30s steepeners
- Stay long 100% risk, or $112mn notional of T 4.875% Oct-28s
- 100% risk, or $29.9mn notional of T 4.75% Nov-53s
- (US Treasury Market Daily, 11/22/23: P/L since inception: -9.4bp)
- Maintain 75%/6% weighted 5s/10s/30s belly-cheapening butterflies
- Stay long 75% risk, or $43mn notional of T 4.625% Sep-28s
- Stay short 100% risk, or $33.3mn notional of T 3.875% Aug-33s
- Stay long 6% risk, or $1mn notional of T 4.125% Aug-53s
- (US Fixed Income Markets Weekly, 9/29/23: P/L since inception: -5.2bp)
Figure 37: Closed trades in last 12 months
P/L reported in bp of yield unless otherwise indicated
| TRADE | ENTRY | EXIT | P/L |
| Duration | |||
| 5-year duration longs | 05/19/23 | 06/29/23 | -45.8 |
| 5-year duration longs | 08/04/23 | 09/08/23 | -27.6 |
| 5-year duration longs | 10/03/23 | 11/02/23 | 14.9 |
| 7-year duration shorts | 11/03/23 | 11/22/23 | -7.9 |
| 30-year duration shorts | 12/15/23 | 01/04/24 | 10.9 |
| 5-year duration longs | 01/19/24 | 02/01/24 | 25.3 |
| 5-year duration longs | 02/09/24 | 03/07/24 | 3.3 |
| Equi-notional 2s/5s flatteners | 05/31/24 | 06/06/24 | 16.0 |
| Curve | |||
| 10s/30s steepener | 12/16/22 | 09/29/23 | 3.0 |
| 10s/30s steepener | 11/03/23 | 11/22/23 | -7.3 |
| 2s/5s flatteners | 12/08/24 | 05/17/24 | 6.0 |
| Relative value | |||
| 100:95 weighted Nov-43s/May-48s flatteners | 04/28/23 | 06/15/23 | 3.8 |
| 52:59 10s/20s/30s belly-cheapening butterflies | 07/07/23 | 07/14/23 | 4.0 |
| 97:100 weighted Aug-32s/Aug-33s steepeners | 06/09/23 | 08/03/23 | 1.6 |
| 100:96 weighted 3.5% Feb-39 / 3.75% Nov-43 flatteners | 07/28/23 | 08/16/23 | 3.2 |
| 2.75% Aug-32/ 3.5% Feb-39 steepeners | 01/10/24 | 01/26/24 | 5.2 |
| 20s/ old 30s flatteners | 02/15/24 | 05/10/24 | -2.6 |
| 100:97 weighted 3.75% Apr-26/ 4.625% Sep-26 flatteners | 04/12/24 | 05/17/24 | 2.2 |
| 100:95 weighted 4% Feb-28 / 4% Feb-30 steepeners | 02/23/24 | 05/31/24 | -6.6 |
| 50:50 weighted 3s/5s/7s belly-richening buterflies | 03/15/24 | 06/14/24 | 2.1 |
| Number of positive trades | 14 | ||
| Number of negative trades | 6 | ||
| Hit rate | 70% | ||
| Aggregate P/L | 3.7 |
Source: J.P. Morgan
Technical Analysis
- The 5s/30s curve 2022-2024 price action looks like a clear base pattern, with key resistance near 40bp. At minimum, we think the curve will challenge that pattern resistance in the second half, and we see a meaningful chance it breaks to the upside by yearend. Within that multi-quarter pattern, the curve has been basing above the 1.5bp Jul 2023 50% retrace after the 2023 and early-2024 rejections of key pattern resistance. We think a break above 16bp-21bp short-term pattern resistance can revive the steepening momentum.
- The 2-year note coils on the key 4.75% chart inflection, which has been a bifurcation zone for the front end since mid-2023. Look for short-term weakness to find material buying interest near 4.85-4.95% support. We expect an eventual extension to lower yields and test of the 4.475-4.50% resistance zone into the fall. We think the market can see a broader retracement of the 2024 bear trend by the end of the year.
- On the low-frequency monthly time frame, the 5-year note yield triggered momentum divergence buy signals late last year and as it reversed from the 5.003% cycle cheap. Historically, those signals have done a good job identifying the end of bear cycles. We expect the market to bullishly break through the Aug 2022 trend line in 2H24, the line that defines the terminal phase of the bear market.
- Look for short-term 10-year note weakness to find buying interest near 4.50% after triggering bearish signals on our short-term pattern recognition system. We expect the developing rally to be less dynamic in the intermediate sector and even more so at the long end, but we still think yields press lower in the second half of the year.
- The 30-year bond has support in the 4.60s that we think will hold if momentum-driven selling pressure continues into July. We are looking for a relatively range bound long end relative to a more dynamic rally in the belly and front end. That said, we see the prospects that the bond can reach resistance parameters in the lower 4-handles by the end of the year.
- 10-year TIPS breakevens rebound after the impulsive tightening to the lower end of the longer-term range. Key support rests at 205bp-215bp. We think the market pressures that support by the end of the year. Short-term, overhead resistance rests at 231-232. Key resistance remains in the 240s.
US
We came into the year expecting retracement to higher yield levels and some flattening of the curve after the fourth quarter steepening took the market to key pattern resistance levels. Those moves extended further than we thought and for longer, but have not derailed the broad strokes of our outlook. The yield curve looks to be trading in a two and a half year base pattern on the heels of a more than decade long flattening trend. Additionally, the low-frequency pattern based signals present on the yield charts that triggered as the calendar rolled to 2024 historically have implied a transition from bear to bull markets. While the mostly range bound price action has delayed the speed at which we thought the bull market would develop, we still view it as part of a medium-term accumulation pattern ahead of a more dynamic rally. Away from Treasury technicals, similar late-cycle signals are now present on equity charts, where we see low-frequency rally deceleration and continued narrowing leadership from already concentrated leadership readings. Additionally, cyclical foreign exchange pairs like USD/JPY have similar pattern-based signaling on the monthly time frame, which in the past also did a good job of identifying late-stage JPY bear markets. The timing of those signals also squares nicely with the expanding month count since the UST curves first inverted. The 3m/5y curve inverted 19 months ago. Historically, the US equity bull market peaked 18 months after initial inversion outside of the two cycles during the 1970s when the market peaked ahead of curve inversion. The subsequent bear markets were all eventually associated with economic contractions. As the demand data softens and inflation data normalizes, markets will have to differentiate a path to soft landing or a precursor to something more dramatic. From our technical perspective, the signaling, pattern development, and cross-market signaling points in the direction of lower yields and steeper curves. The bifurcated data path marks a difference of amplitude for those trends, in our view. Given the setup, we continue to suggest holding core steepening trade themes, and for now tactically trading duration. As the calendar rolls forward and into the Sep-Oct seasonally weak period for risky markets, we will be much more keen to enter bullish duration trades, and won’t hesitate to chase rallies if the labor data starts to soften.
Figure 38: The 5s/30s curve 2022-2024 price action looks like a clear base pattern, with key resistance near 40bp. At minimum, we think the curve will challenge that pattern resistance in the second half, and we see a meaningful chance it breaks to the upside by yearend...
5s/30s curve, weekly closes; bp
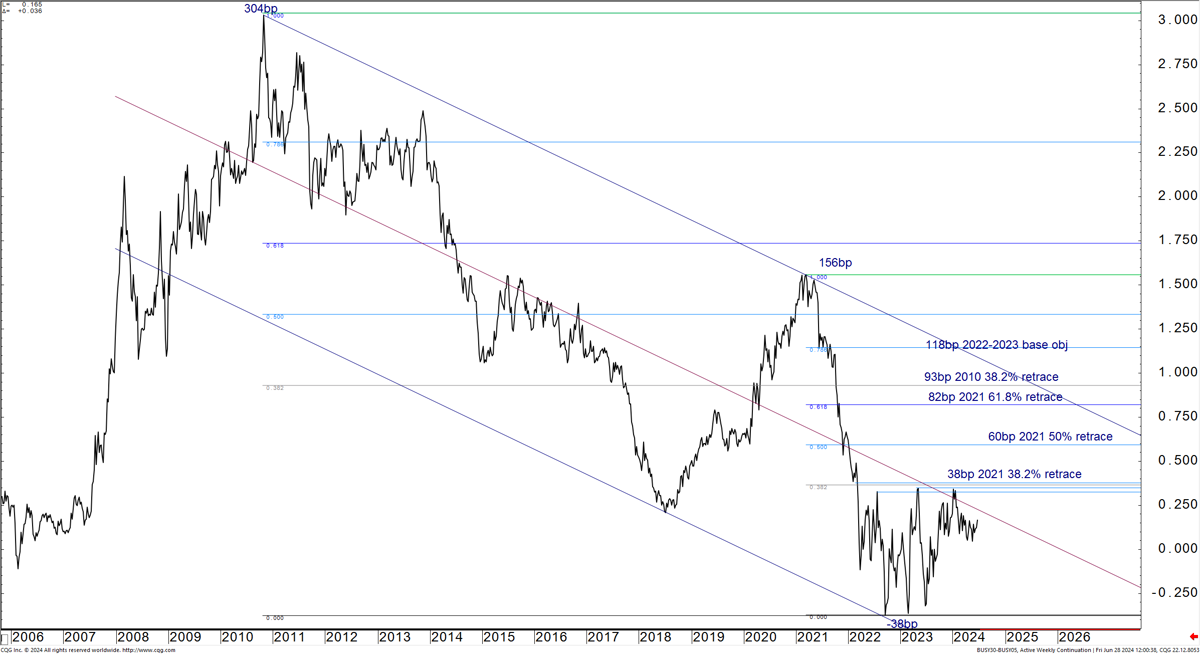
Source: J.P. Morgan, CQG
The 5s/30s curve has spent two and a half years basing above the -38bp cycle low and below the +38bp 2021 38.2% retracement level ( Figure 38). The flattening from that key resistance zone extended further than we thought it would, but managed to stay above the 1.5bp Jul 2023 50% retrace and the stop level for our suggested steepening trade that sits just through 0bp ( Figure 39). The Feb-Jun price action now looks like a potential base pattern that has formed above the noted support. A move through the 16bp local range highs and 21bp Mar 20 high could revive the steepening momentum. Other resistance rests at the 24bp Jan 61.8% retrace and 28.5bp early-Feb tactical pattern breakdown. At minimum, we expect the curve to pressure the key resistance levels overhead that include the 41.5bp Apr 2023 high. An upside breakout would seek the 60bp 2021 50% retrace, 82bp 2021 61.8% retrace, 93bp 2010 38.2% retrace, and 118bp 2022-2023 base pattern objective. An extension to those latter targets would likely coincide with a nonlinear break in the labor data. While not a base-case view for our economics team in 2H24, the steepener provides a convenient hedge for that tail risk. On the downside, a move below 0bp would turn our attention to the -7bp Jul 2023 61.8% retrace and then -19bp Sep-Mar pattern objective.
Figure 39: ...Within that multi-quarter pattern, the curve has been basing above the 1.5bp Jul 2023 50% retrace after the 2023 and early-2024 rejections of key pattern resistance. We think a break above 16bp-21bp short-term pattern resistance can revive the steepening momentum.
5s/30s curve, daily bars; bp
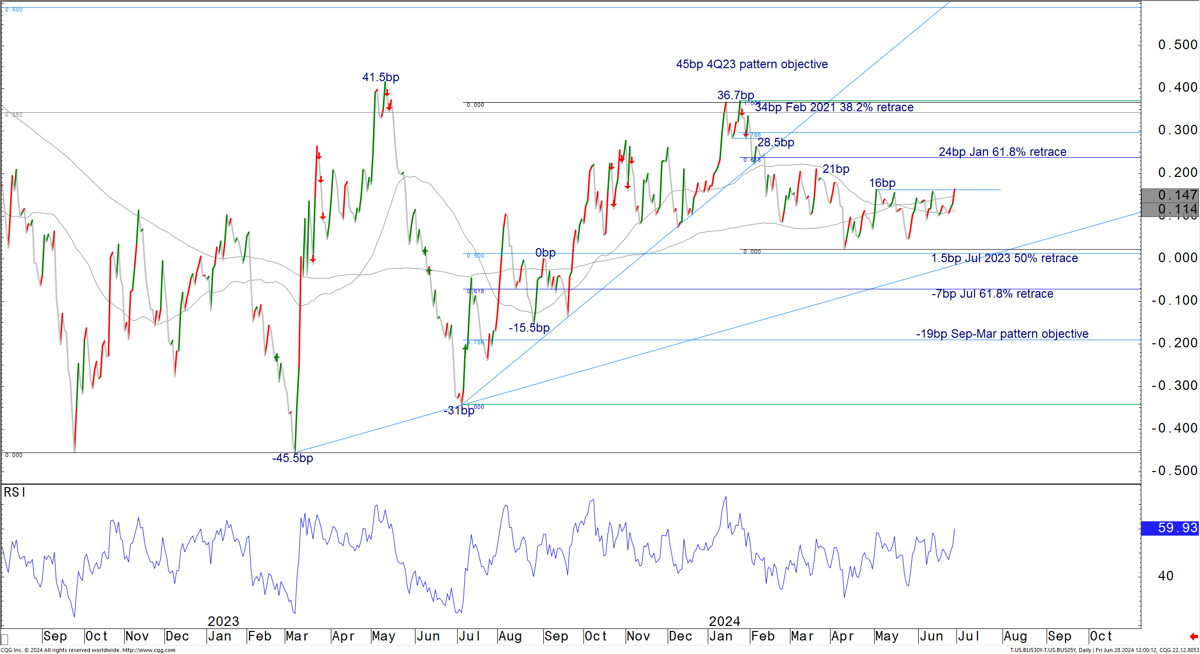
Source: J.P. Morgan, CQG
The 2-year note continues to coil right on top of 4.75%, what has been a critical chart inflection for the front end since 2023 ( Figure 40). Over that period, the zone has marked either range resistance or support, which also includes the 200-day moving average since Mar of this year. On a near-term basis, the Apr-Jun rally has stalled out at the 4.65% Apr-May equal swings objective and near the 4.62% Apr channel. A backup through 4.75% could spark a more material mean reversion to higher yields, but even then, we suspect the 4.845% 50-day moving average, 4.90% late-May yield high, and 4.955% Apr channel will cap yields. More significant support is clustered just through 5.00%, levels that held in Apr. We believe the market will extend the recent rally by the end of summer to test the next zone of resistance at the 4.50% Dec-Feb yield pattern cheaps and 4.475% Jan 61.8% retrace. As noted above, the labor data will likely dictate if that marks the initial impulse in a more dynamic trend, or a slow but steady stair-step to lower yields. In any event, the 4.205% Mar 2023 61.8% retrace continues to mark the first material layer of longer-term chart resistance, the same area the market formed a yield bottom in the Dec-Feb period.
Figure 40: The 2-year note coils on the key 4.75% chart inflection, what has been a bifurcation zone for the front end since mid-2023. Look for short-term weakness to find material buying interest near 4.85-4.95% support. We expect an eventual extension to lower yields and test of the 4.475-4.50% resistance zone into the fall. We think the market can see a broader retracement of the 2024 bear trend by the end of the year.
2-year note yield, daily bars; %
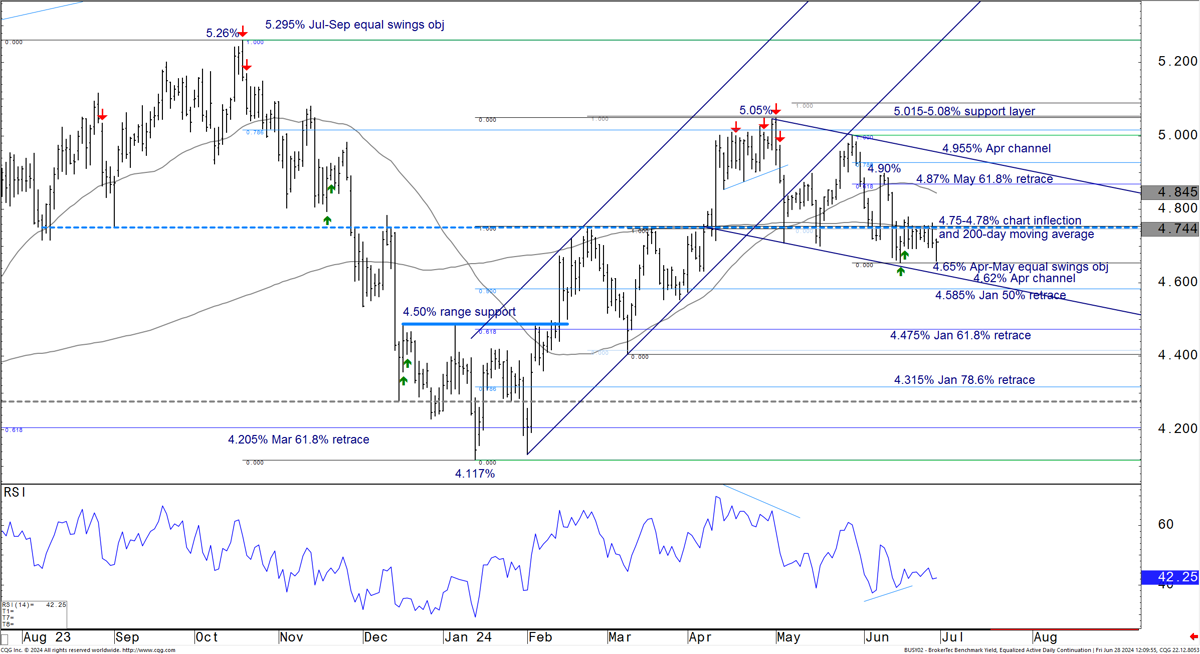
Source: J.P. Morgan, CQG
The chart we included for the belly of the curve presents the most compelling evidence to support our bullish duration view ( Figure 41). There, the red arrows on the 5-year note monthly yield chart represent our systematic momentum divergence buy signals. Those signals fired in the fourth quarter of last year and as the market reversed from the 5.003% cycle cheap. Due to the low-frequency nature of the signal at that time scale, we are unable to generate a statistical study, so are left with handful of events to provide evidence supporting our view. That said, each of the signals in recent decades have done a good job identifying the ends of bear market cycles in the Treasury market. A further rally through the two year reversal pattern trend line that now sits at 4.07% and rises to 4.20% by late-summer would add conviction to our bullish bias. Again, the data will determine the speed of the developing bull market. A convincing break through pattern resistance would turn our attention first back to the 3.745-4.00% area, where the market reversed in the Dec-Feb period. Bigger picture, the first longer-term resistance for an emerging bull market rests at the 3.35% Aug 2020 38.2% retrace and then the 3.09% 2018 cycle cheap. To higher yields, a break through the nearby 4.35% moving average confluence would open the door for a backup to the 4.46-4.50% support zone. We suspect that area will roughly cap yields through the summer. Beyond that support, the 4.755% Apr cheap held a cluster of support levels at 4.725-4.76%.
Figure 41: On the low-frequency monthly time frame, the 5-year note yield triggered momentum divergence buy signals late last year and as it reversed from the 5.003% cycle cheap. Historically, those signals have done a good job identifying the end of bear cycles. We expect the market to bullishly break through the Aug 2022 trend line in 2H24, the line that defines the terminal phase of the bear market.
5-year note yield, monthly bars; %
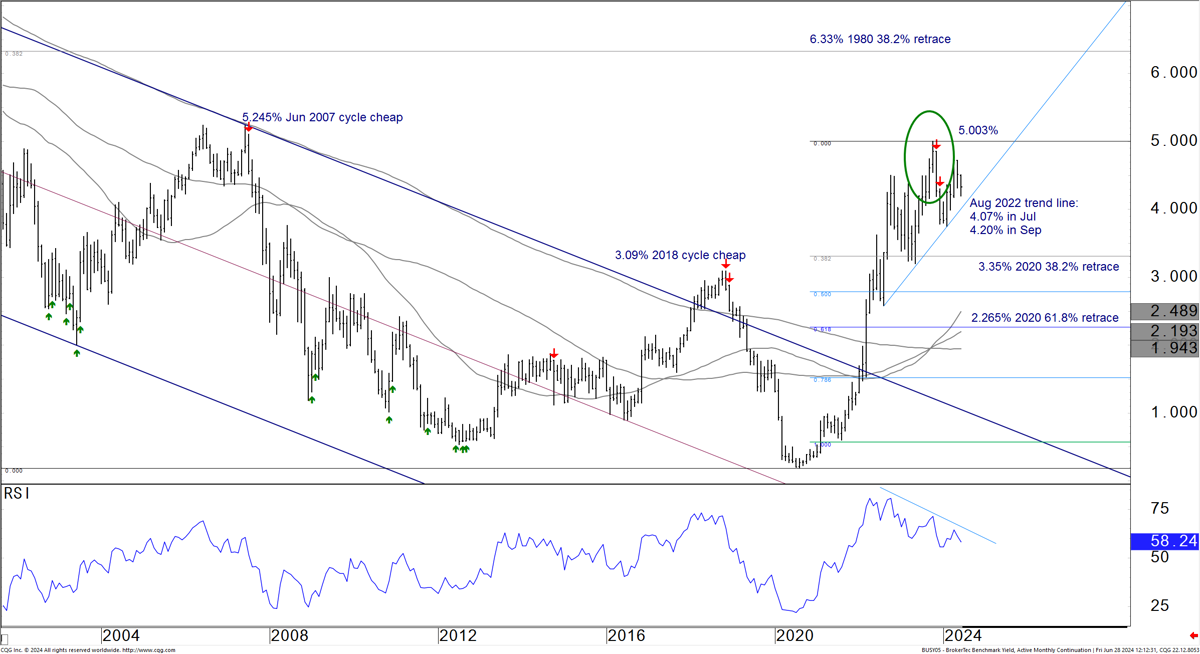
Source: J.P. Morgan, CQG
We suspect that the intermediate sector and even more so the long end will trade more range bound as compared to the belly and front end, but even there we think the pressure will be to lower yields as the year progresses. Like the belly, a 10-year note extension through the nearby 4.355% moving averages would allow for a test of support that sits at 4.465-4.54% ( Figure 42). That includes the 50-day moving average, Apr channel, and early-Jun yield high. Look for material buying interest near that support. We think the 10-year note will eventually press through the 4.15% Dec 61.8% retrace to test next resistance at the 4.02-4.035% late-winter chart inflection and 3.975% Oct-Apr .618 swing objective. We think the intermediate sector can start to get sticky near the 4.00% threshold, especially in the absence of a break in the labor data. To higher yields and beyond the levels already mentioned near 4.50%, next support rests at the 4.64% late-May cheap and then 4.755% Oct 2023 78.6% retrace, which held in Apr.
Figure 42: Look for short-term 10-year note weakness to find buying interest near 4.50% after triggering bearish signals on our short-term pattern recognition system. We expect the developing rally to be less dynamic in the intermediate sector and even more so at the long end, but we still think yields press lower in the second half of the year.
10-year note yield, daily bars; %
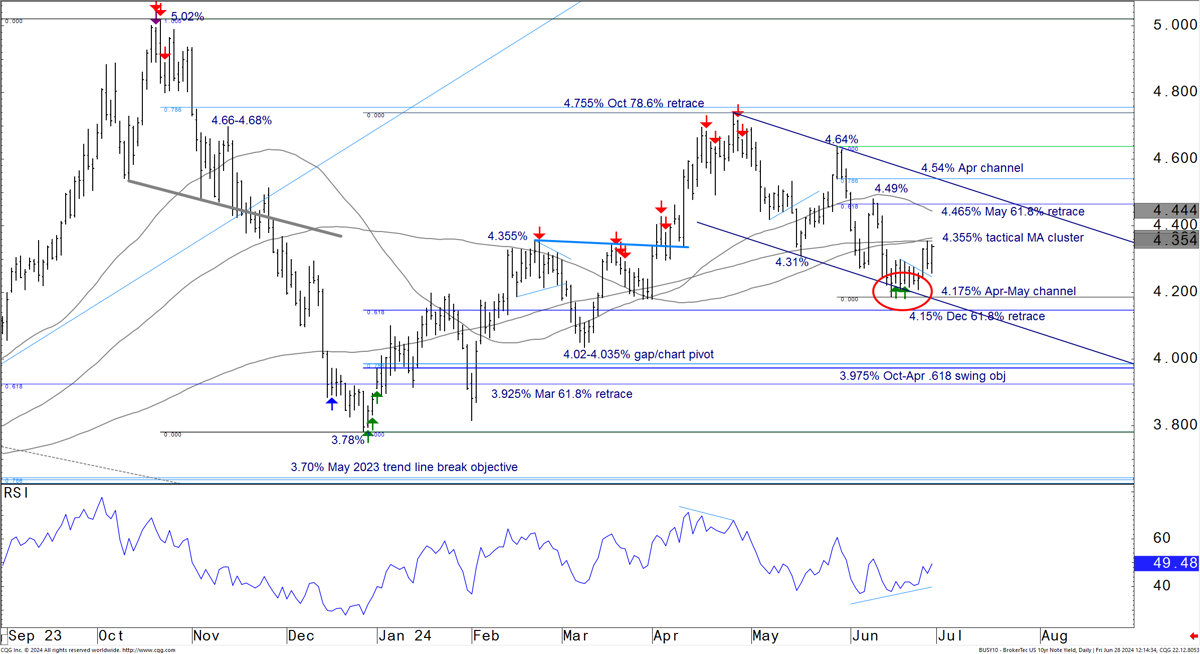
Source: J.P. Morgan, CQG
At the very long end, a 30-year bond backup through the 4.50% cluster of moving averages can drive renewed trend-following selling pressure and allow for a retest of the 4.59% internal trend line, 4.59% 50-day moving average, and 4.635% May 61.8% retrace ( Figure 43). We think the market will find footing there and the Apr trend line, that now sits at 4.69%. We are looking for the bond to trade more range bound through the summer, albeit with a slight bullish bias. Key resistance rests at the 4.285% Jan 61.8% retrace. We suspect a push through that level is more likely into the fall and when risky markets enter the seasonal weak period. Even then, look for selling pressure to emerge near the 4.135% Jan 78.6% retrace and 4.08% Oct-Apr .618 swing objective. Alternatively, an unexpected re-acceleration to higher yields through noted channel support would reseek the 4.765% late-May yield high, 4.845% Apr cheap, and 4.90% Oct 78.6% retrace.
Figure 43: The 30-year bond has support in the 4.60s that we think will hold if momentum-driven selling pressure continues into July. We are looking for a relatively range bound long end relative to a more dynamic rally in the belly and front end. That said, we see the prospects that the bond can reach resistance parameters in the lower 4-handles by the end of the year.
30-year bond, daily bars; %
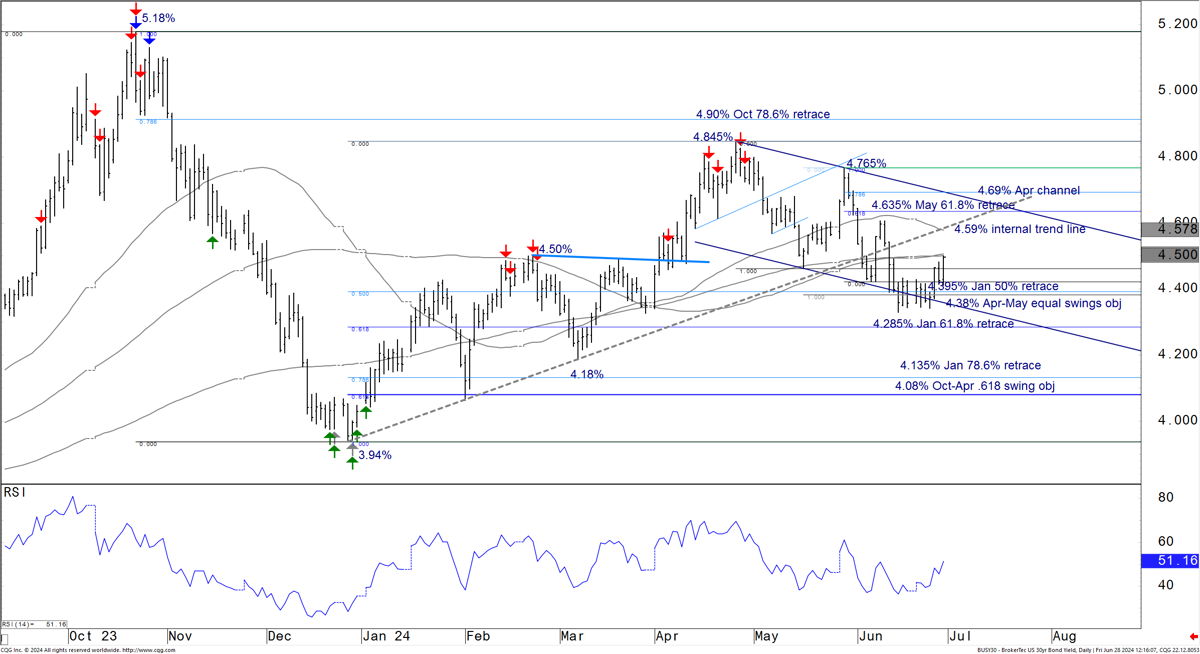
Source: J.P. Morgan, CQG
Figure 44: 10-year TIPS breakevens rebound after the impulsive tightening to the lower end of the longer-term range. Key support rests at 205bp-215bp. We think the market pressures that support by the end of the year. Short-term, overhead resistance rests at 231-232. Key resistance remains in the 240s.
10-year TIPS breakevens, daily closes; bp
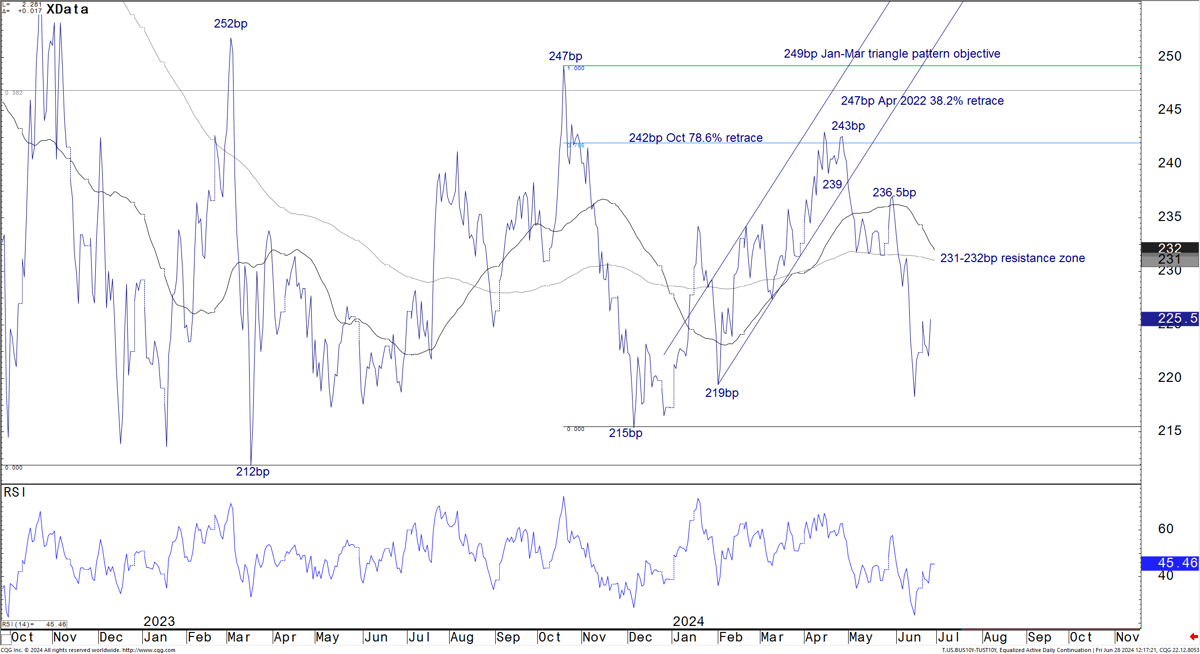
Source: J.P. Morgan, CQG
This report was excerpted from Global Fixed Income Technical, Jason Hunter, June 28, 2024
TIPS Strategy
2024 Mid-Year Outlook
- Core inflation is expected to slow gradually over coming months, with the 3-month run rate falling to 2.6% by the end of the year (from 3.3% in May), and the year-ago rate ticking down to 3.2% (from 3.4% in May). We see headline CPI inflation falling from 3.3% to 3.1% oya
- We maintain a bullish bias at the front end of the inflation curve, as we expect inflation to soften somewhat more slowly than the trajectory implied by the inflation swap curve, and election risks are likely to push near-term inflation expectations higher as we approach the fall
- The direction of travel in the fourth quarter is more uncertain, given that markets are likely to be sensitive to the outcome of the US Presidential election...
- ...Our baseline forecast assumes that breakevens revert somewhat narrower, as a further cooling in economic data allows the Fed to deliver its first rate cut and as rising non-OPEC supply and slowing demand drives a softening in energy prices. We forecast 5-, 10-, and 30-year breakevens will end the year at 230bp, 230bp, and 225bp, respectively, though we see risks skewed to the upside
- A Trump victory would raise the likelihood of sizeable additional tariffs. Trump has floated the idea of a 10% universal minimum tariff, as well as 60% tariffs on all imports from China. If both are introduced, this could have roughly a 2.4% impact on the price level
- Supply/demand technicals in the TIPS market remain mixed. Treasury has continued to leave 30-year TIPS auction sizes unchanged while focusing issuance increases in the front and intermediate sectors, where demand has been more robust
- We forecast gross TIPS issuance will total $210bn in 2024, $17bn larger than in 2023, while net TIPS issuance rises to $88bn in real principal terms
Market views
Figure 45: After adjusting for seasonality and near-term carry, breakevens are trading 9-13bp wider YTD
1-month forward seasonally-adjusted TIPS breakevens;bp
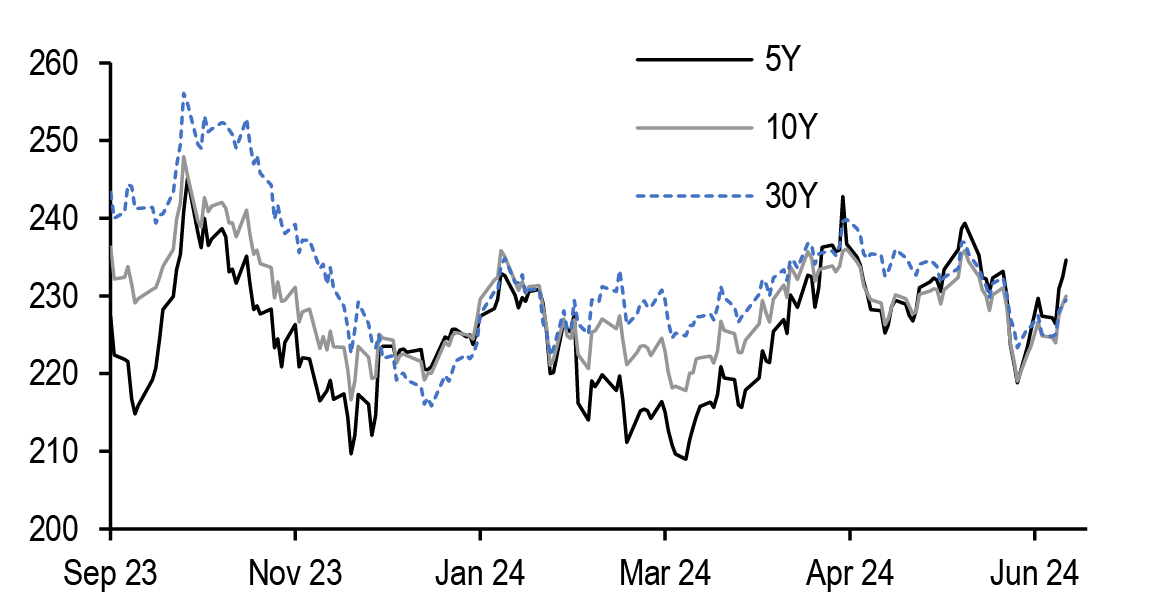
Source: J.P. Morgan
Figure 46: Our TIPS index has returned 1.2% YTD, slightly outperforming nominal Treasuries
Quarterly total return on TIPS and TIPS return outperformance*; %
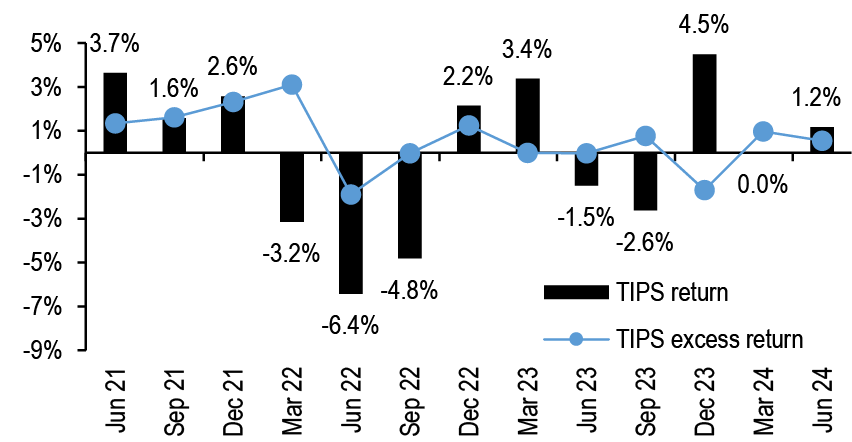
Source: J.P. Morgan
* Defined as (TIPS return)-[(TIPS index duration)/(Treasury index duration)*(Treasury return)]
Over the first three months of the year, core CPI inflation reaccelerated to a 4.5% saar pace from 3.3% in 4Q23, and energy prices rose sharply, driving TIPS breakevens wider and real yields higher. In the last two months, however, inflation news have been more benign: core CPI inflation has retreated back to a 3.3% 3m saar through May, or 3.4% oya, while headline CPI inflation is running at 3.3% oya. After adjusting for seasonality and near-term carry, benchmark breakevens have widened 9-13bp YTD and are trading near the middle of their 6-month ranges ( Figure 45). Real yields are roughly 30-40bp higher, and TIPS have accrued 1.8% of inflation return. Overall, our TIPS index has returned 1.2% YTD, slightly outperforming nominal Treasuries on a duration-adjusted basis ( Figure 46). As we look ahead, we maintain a bullish bias at the front end of the inflation curve, as we expect inflation to soften somewhat more slowly than the trajectory implied by the inflation swap curve, and election risks are likely to push near-term inflation expectations higher as we approach the fall.
2H24 Inflation outlook
Before turning to our expectations for the evolution of benchmark breakevens and real yields over the balance of the year, we first discuss our latest thoughts on the outlook for inflation over the second half of the year. As mentioned, the recent data suggests the disinflationary process that took hold in 2H23 is getting back on track, though we still see some signs of stickiness on the core services side. Within the details, the most significant reacceleration early in the year came from core services ex-rent inflation ( Figure 47). This component jumped to a 8.2% saar in the first quarter, though we have seen a sharp reversal recently, with this component running just 2.3% saar in the last two months. Where can we expect super core CPI inflation to run going forward?
Figure 47: Core services inflation accelerated over the first half of the year...
Various components of core CPI inflation; % 6m saar
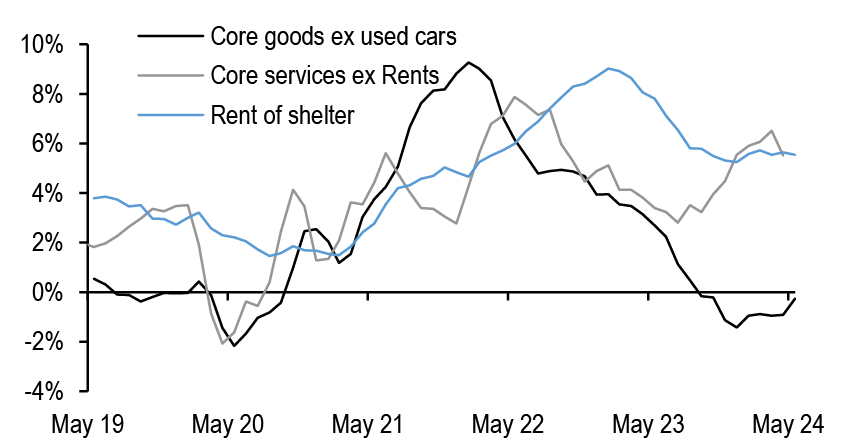
Source: BLS, J.P. Morgan
Figure 48: ...though recent data suggest the disniflationary process is getting back on track
Realized inflation rates across various components of the core CPI basket as of May 2024; units as indicated
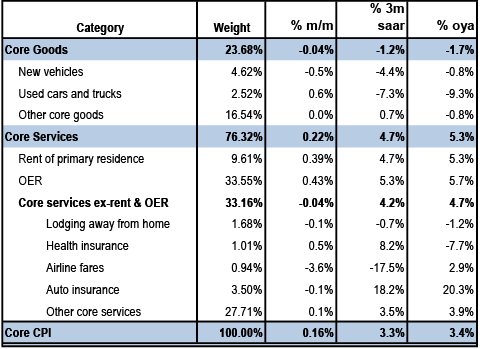
Source: BLS, J.P. Morgan
We believe much of the strength in the first quarter was idiosyncratic and unlikely to be repeated, but we are also cautious about extrapolating forward the weak readings of the last two months. Much of the recent swing lower came from travel-related components such as hotels and airfares—we have already seen jet fuel prices begin to rebound in June, and various forecasters are looking for a chart-busting summer of travel. TSA, for example, projects this summer to be the busiest in the agency’s history (see Oil Markets Weekly, Natasha Kaneva, 6/25/24). The step-down in health insurance CPI inflation in April came with BLS’s semiannual reset in source data, implying this category should run close to 5% saar for the next four months until the next reset. Lastly, we expect motor vehicle insurance should remain firm into the early fall before softening toward a mid single-digit annualized pace in the fourth quarter (see TIPS Strategy, 6/14/24). Away from some of these idiosyncratic factors, we expect core services inflation can gradually soften alongside cooler wage inflation.
Meanwhile, the strength in rent inflation has also been surprising since the start of the year, especially given that industry data, including the Zillow rent indexes for example, have pointed toward softening rent inflation for some time. Yet progress on this front has largely stalled, with these components rising 4.7% and 5.3% saar, respectively, in the three months through May ( Figure 48). As we’ve discussed recently, we believe that the pace of increases for lease renewals continues to run above the pace of increases for new leases, with the Zillow indexes and other market measures only capturing the latter (see TIPS Strategy, 4/26/24). This is particularly important in an environment of low housing mobility, which has kept demand for rental properties elevated and given landlords increased pricing power (listen to more on this topic here). While we see rent and OER CPI softening gradually over the balance of the year, it may be difficult for rent inflation to return to its pre-pandemic pace, and hence we expect these components to prove sticky near 4%.
Figure 49: Markets are still priced for a slightly softer core inflation trajectory relative to our own forecasts
CPI fixings and implied inflation rates*; units as indicated
| Month | Fixing | Implied headline % m/m sa | Implied headline % oya | Implied core % m/m sa | Implied core % oya | Core CPI % oya (forecast) |
| Jun-24 | 314.520 | 0.05% | 3.08% | 0.16% | 3.37% | 3.47% |
| Jul-24 | 315.050 | 0.18% | 3.06% | 0.14% | 3.29% | 3.48% |
| Aug-24 | 315.580 | 0.24% | 2.79% | 0.08% | 3.13% | 3.48% |
| Sep-24 | 315.940 | 0.22% | 2.65% | 0.22% | 3.03% | 3.39% |
| Oct-24 | 316.000 | 0.14% | 2.71% | 0.24% | 3.04% | 3.37% |
| Nov-24 | 315.660 | 0.25% | 2.80% | 0.30% | 3.03% | 3.28% |
| Dec-24 | 315.670 | 0.34% | 2.91% | 0.18% | 2.94% | 3.21% |
| Jan-25 | 317.000 | 0.18% | 2.78% | 0.29% | 2.83% | 3.02% |
| Feb-25 | 318.270 | 0.22% | 2.56% | 0.26% | 2.72% | 2.86% |
Source: J.P Morgan
* To derive market-implied core inflation rates, J.P. Morgan forecasts for food and energy CPI are used
Lastly, turning to goods, vehicle prices have continued to fall, with used car prices in particular 4.7% lower since the start of the year and running -7.3% saar in the three months through May. A continued steady increase in new vehicle supply has seen inventories rise from ~900k in September 2021 to ~2.7mn more recently, close to levels observed prior to the chip shortage that emerged in 2021. We expect both new and used vehicle prices will continue to decline gradually, though the pace of declines should moderate over the second half. Meanwhile, core goods prices excluding used cars have been roughly stable since the start of the year, running -0.5% saar in the last three months, generally in line with our expectations. Looking ahead, we expect core goods prices (ex vehicles) to remain close to flat. We believe that excess capacity in China played an important role in the goods price deflation experienced late last year, but this impulse is fading: notably, China PPI deflation eased to -1.4% oya in May, compared to -5.4% a year ago. Meanwhile, shipping costs have continued higher again over the last couple of months, amid ongoing crisis in the Red Sea, and rising concerns around the potential introduction of additional tariffs following the US election (see Transportation & Logistics, B. Ossenbeck, 5/24/24). Overall, we forecast core CPI inflation will soften toward a 2.6% 3m saar pace in 4Q24, with the oya rate falling to 3.2%, a slower pace of disinflation than implied by the inflation swap market ( Figure 49).
Combining this with our forecasts for food and energy CPI, headline CPI inflation should fall gradually over the course of the year from 3.3% oya in May to 3.1% by year-end. Meanwhile, core PCE inflation is running 2.6% oya and 2.7% 3m saar in May, and we see core services inflation in the PCE index also cooling gradually alongside CPI. However, base effects will be more challenging later this year as the weak readings in late 2023 fall out of the 12 month window, which should push the year-ago rate of core PCE back up toward 2.8% by year-end, and drive a narrowing in the core CPI-PCE wedge.
Maintain a bullish bias on front-end breakevens
Given this outlook, we think breakevens are likely to remain reasonably well supported over the next few months, despite the richening observed over the last couple of weeks. Notably, breakevens now appear in line with our fair value estimates, even at the front end of the curve, where breakevens had appeared cheap versus this framework for much of the last four months ( Figure 50). Recall that our fair value framework regresses 1-month forward seasonally-adjusted benchmark breakevens on our J.P. Morgan commodity curve index (JPMCCI) as well as the shape of the 3m3m/15m3m OIS curve—a macro risk proxy, with breakevens covarying positively with both factors. Notably, these two factors alone explain 88-93% of the variability in benchmark breakevens over the last 7 years.
As we look ahead, our commodity strategists forecast a 10% appreciation in broad commodity prices by year-end, and they target Brent oil at $90/bbl by September. Meanwhile, the shape of the money market curve is priced for a pace of rate cuts roughly in line with our own forecasts. These factors imply front-end breakevens to lead the way wider in the third quarter, while longer-run forwards remain anchored and the breakeven curve flattens. In addition to these broad macro drivers, US elections are coming into focus, and are likely to remain an important driver of inflation markets in the coming months, as investors consider the potential effects of policy proposals that have been floated by each candidate. Importantly, we think the potential for increased tariffs in the case of a Trump victory likely poses the most significant inflationary risk, which should drive outperformance of the front end of the curve ahead of the election.
The direction of travel in the fourth quarter is more uncertain, given that markets are likely to be sensitive to the election outcome. Our baseline forecast assumes that breakevens revert somewhat narrower, as a further cooling in economic data allows the Fed to deliver its first rate cut and as rising non-OPEC supply and slowing demand drives a softening in energy prices. Five-year breakevens should optically widen as the benchmark rolls to the October maturity. After accounting for this as well as seasonally negative carry later this year, we forecast 5-, 10-, and 30-year breakevens will end the year at 230bp, 230bp, and 225bp, respectively, although we acknowledge risks around this forecast likely skew to the upside. Overall, this forecast reflects an outlook in which breakevens continue to trade in the upper end of the range they have held over the last few months. Combined with our nominal yield targets, we think real yields will trade rangebound over 2H24, before declining more materially in 1H25 ( Figure 51).
Figure 50: 5- and 10-year breakevens appear in line with our fair value estimates after trading cheap for much of the last four months
Residual on 5- and 10-year TIPS breakeven fair value model*; bp
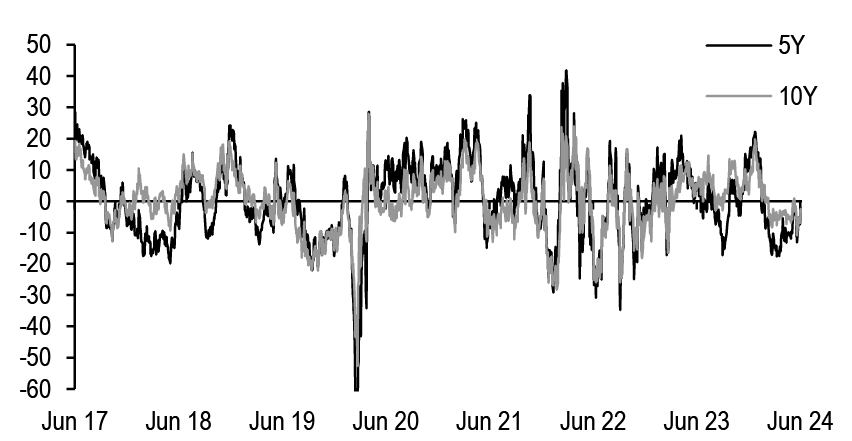
Source: J.P. Morgan
* Model regresses seasonally-adjusted breakevens (bp) against JPMCCI, JPMCCI-squared, and 3m3m/15m3m OIS curve (bp)
5Y model R2=93%; SE=13bp; 10y model R2=93%; SE=10bp
Figure 51: We maintain a bullish bias on front-end inflation. Look for rangebound real yields in 2H24
Breakevens and real yields, breakeven targets, and real yield and curve levels based on those targets*; units as indicated
| Actual | 3Q24 | 4Q24 | 1Q25 | 2Q25 | |
| 27-Jun-24 | 30-Sep-24 | 31-Dec-24 | 31-Mar-25 | 30-Jun-25 | |
| Breakevens (bp) | |||||
| 5Y | 224 | 235 | 230 | 230 | 215 |
| 10Y | 227 | 230 | 230 | 225 | 220 |
| 30Y | 229 | 230 | 225 | 225 | 220 |
| Real yields (%) | |||||
| 5Y | 2.07 | 2.05 | 1.95 | 1.70 | 1.65 |
| 10Y | 2.02 | 2.20 | 2.10 | 1.95 | 1.80 |
| 30Y | 2.14 | 2.35 | 2.35 | 2.25 | 2.15 |
Source: J.P. Morgan
* Targets for real yields are based on our nominal yield forecasts and breakeven targets
Given these forecasts, we maintain a near-term bullish bias on breakevens. With tariff risks largely concentrated in the next couple of years, we prefer to hold exposure around the 2-year sector. It is also worth noting that cash breakevens have outperformed versus inflation swaps recently, especially in the front end to intermediate sectors, with IOTAs in these sectors trading at their tightest levels in nearly two years. Thus, we think inflation swaps are relatively more attractive than cash breakevens for investors looking to add inflation protection in the current environment, and we maintain longs in 1Yx1Y inflation swaps (see TIPS Strategy, 6/14/24).
US elections could be an important driver of inflation markets in 2H24
In considering the potential market reaction to a Trump or Biden victory in November, it is useful, as a starting point, to look back at how the inflation curve responded in the immediate aftermath of the 2016 and 2020 elections. Figure 52 shows that in the week following former President Trump’s victory in 2016, 2Yx3Y and 5Yx5Y inflation swaps rose 16-18bp, while inflation markets were virtually unchanged in the week following President Biden’s victory in 2016. This is a crude exercise as a breakthrough in the COVID vaccine was also announced the day after the election on November 9, 2020, so it’s hard to disentangle the election impact, but consistent with these observations, we believe inflation markets would respond more bullishly to a Trump victory in 2024, with the reaction most pronounced at the front end of the curve — perhaps even shorter on the curve relative to 2016.
Importantly, we think the primary risk for inflation markets is the potential for sizeable additional tariffs. We think the election is most likely to result in a divided government, with the Senate likely to flip to Republican control, while the Democrats take the majority in the House of Representatives. Thus, we see less scope for transformative fiscal policies relative to the last two election cycles. Under either administration, we would expect fiscal policy to turn more restrictive after 2025, when the 2017 tax cuts are due to expire. Meanwhile, the risk of a meaningful increase in trade tensions with China remains elevated, as trade policy is one of the few issues garnering bipartisan support in a polarized US political environment. Importantly, Biden has taken steps to restrict US investments in China and defend against China’s anticompetitive practices. Tariffs inherited from the prior administration have largely remained in place ( Figure 53), and last month, Biden announced new tariffs on Chinese EVs, chips, steel, and other imports. Still, Former President Trump is likely to take a harder line on foreign policy, particularly with China, through a greater use of Executive Orders (see 2024 US Election Watch, J. Chang, et al, 4/25/24). He has floated the idea of a blanket 10% tariff on US imports from all countries, well above the current average tariff rate of 3% on countries excluding China, and has also discussed increasing tariffs to 60% or more on all imports from China. In 2023, the US imported $3.1tn of goods, with roughly 14% coming from China.
Figure 52: Inflation swaps rose sharply in the immediate aftermath of the 2016 US Presidential election
Changes in 1Y1Y, 2Y3Y, 5y5Y, and 10Y20Y inflation swaps in the 1 and 2 weeks following the 2016 and 2020 US Presidential elections; bp
| 1Y1Y | 2Y3Y | 5Y5Y | 10Y20Y | ||
| 2020 | 1 week | 4 | 0 | -1 | 1 |
| 2 week | -6 | -7 | -4 | -6 | |
| 2016 | 1 week | 7 | 16 | 18 | 11 |
| 2 week | 11 | 22 | 24 | 21 |
Source: J.P. Morgan
Figure 53: A blanket 10% global tariff and a 60% tariff on all imports from China have been floated, which could have a significant short-term impact on inflation
Effective tariff rate estimates; %
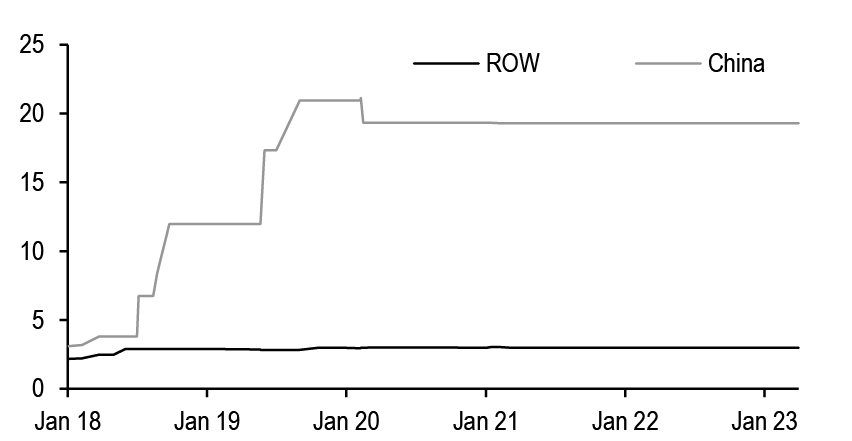
Source: PIIE
Evidence from the Trump 1.0 tariffs suggests there was less than complete pass-through to consumer prices, though there is also some evidence that domestic producers used some of the increase in market power to push through higher prices. We think 0.3% is a reasonable estimate of the price level effect of those tariffs. Additionally, the impact was relatively short-lived, as the tariffs drove substantial redirection of trade. The share of imported goods coming from China has fallen sharply over the last 5 years from above 21% in early 2018, with trade diverting toward other countries, including Mexico, which could have limited the impact on consumer price inflation.4 If Trump proceeds with the tariffs that have been floated, our economists estimate a 1.1% increase in the gdp price deflator from a 60% tariff on China and a 1.5% increase in price level coming from the 10% universal tariff (see US: Economic policy implications of the election, Michael Feroli, 6/28/24). If both are introduced, this could result in a 2.4% price level increase. Of course there are other second order effects that also need to be considered—as our FX colleagues discuss in detail, tariff hikes are likely to have bullish implications for the dollar. Specifically, they estimate a 10% blanket tariff could drive 4-6% USD appreciation, all else equal (see US Elections & FX, P. Locke, 11/27/23). Overall, while this channel is unlikely to drive longer-run inflation expectations materially higher, we think upside risk is currently highest at the front end of the inflation curve, around the 2-year sector.
TIPS supply and demand outlook
Consistent with our view for relatively rangebound breakevens, we think supply/demand technicals in the TIPS market remain mixed. Treasury has continued to leave 30-year TIPS auction sizes unchanged while focusing issuance increases in the short and intermediate sectors, reflecting the trends we’ve observed in demand. Figure 54 shows that on average, end-user demand at 5-year TIPS auctions YTD has risen to new all-time highs, while long-end demand has declined. More granularly, auction allotment data reveal that foreign investor demand has increased in the short- and intermediate-sectors, while declining to its lowest level since 2021 at the longend. It’s hard to know where this demand emanated from, since data on foreign holdings of TIPS are released with a substantial lag, but we suspect increased demand for front-end TIPS YTD has largely been driven by foreign private investors.
Recall that in the year through June 2023, foreign official holdings declined for the fourth consecutive year and now only comprise 16% of the total TIPS market, down from 36% a decade ago, alongside a general reduction in the foreign reserve manager footprint within the Treasury market ( Figure 55). Regionally, TIC data indicate that investors domiciled in the United Kingdom were the largest buyer of TIPS last year, while Euro area demand weakened. Looking ahead, we expectdemand from Euro area investors to remain fairly weak, as the relative attractiveness of US CPI inflation markets relative to Euro area HICP in the intermediate and long-end sectors has faded since reaching historically cheap levels late last summer. (see TIPS Strategy, 5/3/24).
Figure 54: End-user demand at auction has continued higher for 5-year TIPS but declined at the long end
Allocation of TIPS auctions to total end users, investment managers, and foreign investors, averaged by calendar year; %
| End-user demand | Investment manager | Foreign | |||||||
| Year | 5y | 10y | 30y | 5y | 10y | 30y | 5y | 10y | 30y |
| 2017 | 81.6 | 76.6 | 79.3 | 66.6 | 59.4 | 62.0 | 14.1 | 16.4 | 15.9 |
| 2018 | 81.7 | 79.0 | 79.8 | 71.7 | 56.8 | 54.6 | 9.0 | 21.6 | 23.7 |
| 2019 | 86.0 | 83.7 | 87.2 | 76.0 | 70.4 | 77.0 | 9.1 | 12.2 | 6.8 |
| 2020 | 84.6 | 80.2 | 81.6 | 69.1 | 68.5 | 64.3 | 11.6 | 10.6 | 15.2 |
| 2021 | 90.5 | 86.5 | 85.0 | 78.9 | 75.3 | 69.2 | 11.1 | 10.5 | 13.7 |
| 2022 | 92.7 | 87.2 | 84.3 | 74.1 | 73.3 | 65.3 | 16.9 | 12.7 | 17.7 |
| 2023 | 92.6 | 92.0 | 92.9 | 79.4 | 75.1 | 69.0 | 12.6 | 16.0 | 18.8 |
| 2024 | 96.9 | 90.3 | 91.0 | 78.8 | 71.9 | 73.2 | 16.5 | 17.8 | 16.9 |
Source: US Treasury, J.P. Morgan
Turning to retail demand, outflows from inflation-protected bond funds have continued, though we have seen these outflows moderate in recent months; TIPS-focused funds witnessed $370mn of outflows YTD through May, compared to $12.2bn of outflows by this point last year. Notably outflows have been primarily focused in all-maturity funds, whereas the AUMs of funds benchmarked to short-term TIPS have been relatively more stable ( Figure 56). However, we have found using both an empirical regression-based attribution model as well as security-level holdings data that active TIPS funds have turned further underweight TIPS relative to their benchmark, instead choosing to reach out of index to other fixed income products (see The inflation fund landscape: Reviewing trends in flows, composition, and positioning, 5/28/24). Looking ahead, demand for inflation-protected bonds tends to be momentum driven, and we would not expect inflows into TIPS funds to pickup materially until TIPS returns turn more sustainably positive.
Figure 55: Foreign official holdings of TIPS have declined for their fourth consecutive year, through June 2023
Foreign official share of TIPS and nominal Treasuries outstanding; %
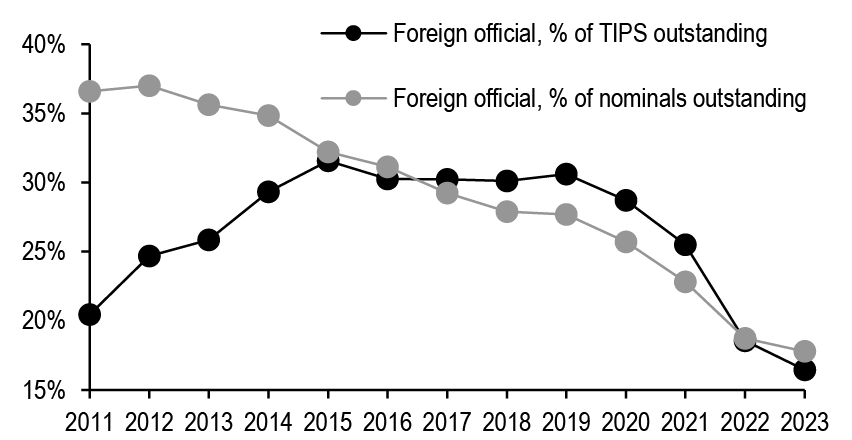
Source: Treasury International Capital System, J.P. Morgan
Figure 56: Since 2021, outflows have primarily come from all-maturity funds, while short-term inflation fund AUMs have been more stable
Cumulative net inflows for short-term inflation funds (benchmarked to 0-5Y or 1-5Y TIPS Index) versus all-maturity and other benchmark funds; $bn
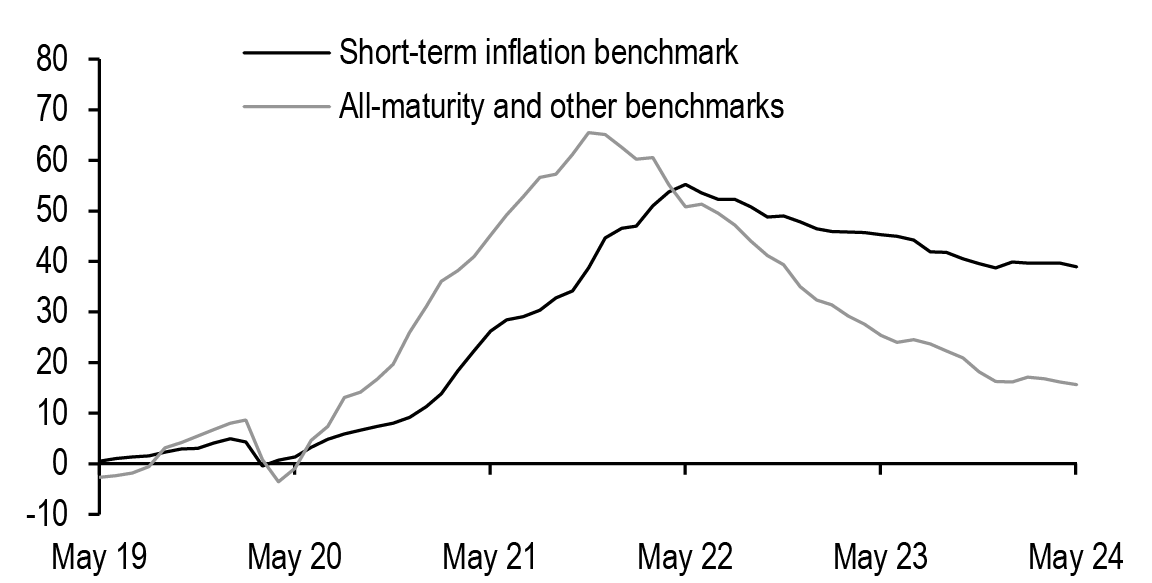
Source: EPFR, J.P. Morgan
Against this backdrop, Treasury has adjusted TIPS issuance only gradually. At the May refunding, Treasury increased the June 5-year TIPS reopening auction size and the July 10-year TIPS new-issue auction size each by $1bn to $21bn and $19bn, respectively. Treasury again stated that it believes “it would be prudent to continue with incremental increases to TIPS auction sizes in order to maintain a stable share of TIPS as a percentage of total marketable debt outstanding.” Thus, we expect another $1bn increase to the October 5-year TIPS auction will be announced next quarter ( Figure 57). This would leave annual gross TIPS issuance at $210bn, $17bn larger than in 2023, while net TIPS issuance rises to $88bn in real principal terms ( Figure 58).
Figure 57: We look for $210bn of gross TIPS issuance over the course of 2024, concentrated in the 5- and 10-year sectors...
Monthly gross TIPS issuance*; Reopenings in grey; $bn
| 5y TIPS | 10y TIPS | 30y TIPS | Subtotal | |
| Jan 24 | 18 | |||
| Feb 24 | 9 | |||
| Mar 24 | 16 | 43 | ||
| Apr 24 | 23 | |||
| May 24 | 16 | |||
| Jun 24 | 21 | 60 | ||
| Jul 24 | 19 | |||
| Aug 24 | 8 | |||
| Sep 24 | 17 | 44 | ||
| Oct 24 | 24 | |||
| Nov 24 | 17 | |||
| Dec 24 | 22 | 63 | ||
| Total | 90 | 103 | 17 | 210 |
| 2023 | 82 | 94 | 17 | 193 |
| Diff. | 8 | 9 | 0 | 17 |
Source: US Treasury, J.P. Morgan
*August 2024 onward represent J.P. Morgan forecasts
Figure 58: ...and forecast $88bn of net TIPS issuance this year in real principal terms
Historical annual net issuance (left axis; $bn of real principal) and TIPS outstanding as a percentage of total Treasury debt outstanding (right axis; %) and our forecasts for 2024
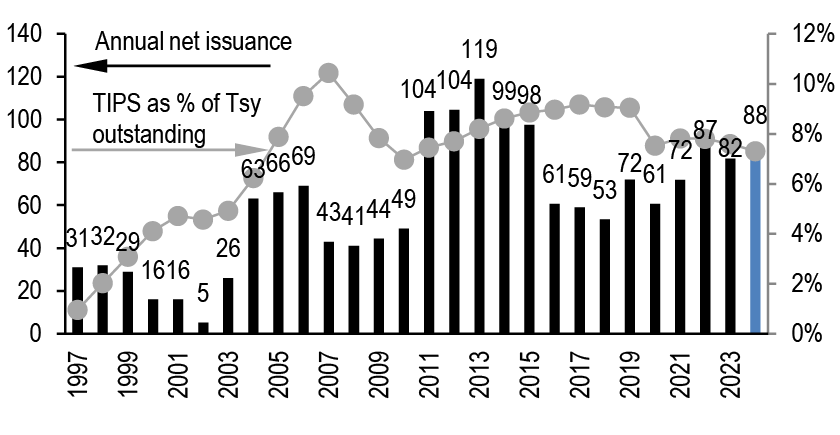
Source: US Treasury, J.P. Morgan
Away from near-term issuance plans, one of the TBAC charge questions asked about the likely costs and benefits of “potential new Treasury products that might assist Treasury in...ways to minimize borrowing costs, better manage its liability profile, enhance market liquidity, and expand the investor base in Treasury securities.” On the short list of products Treasury highlighted as worthy of further exploration was 3-year TIPS. Importantly, adding a new TIPS maturity point could help Treasury maintain its commitment to keep TIPS in the recommended 7-9% share of total outstanding debt, without putting undue strain on increasing the size of existing tenors. Such an addition would be long overdue, as Treasury has maintained 3 TIPS benchmark tenors since the introduction of the product nearly thirty years ago while at the same time expanding the suite of nominal products. Looking ahead, we could see Treasury explore this option further. However, we think Treasury would first prioritize a 1-year SOFR FRN. Moreover, considering the amount of further study and engagement with market participants that would need to take place, with respect to considerations around demand, sizing, and the potential placement of any new benchmark within the TIPS auction schedule, we think the earliest timing of any introduction is likely at least a year away (see TIPS Strategy, 5/3/2024).
Trade recommendations
- Hold 1Y1Y inflation swap longs
- Stay long 100% risk, or $125mn notional of 1Yx1Y inflation swap (swap start: 6/17/25, swap end: 6/17/26).
(TIPS Strategy, 6/14/23). P/L since inception: +13.9bp.
Figure 59: Trade performance over the past 12 months
P/L reported in bp of yield unless otherwise indicated
| TRADE | ENTRY | EXIT | P/L | |
| Jul 24/Jul 25 BE wideners | 5/10/2024 | 5/28/2024 | 11.7 | |
| 10Yx20Y breakeven wideners | 4/12/2024 | 4/26/2024 | 4.7 | |
| Long 5Y TIPS | 3/20/2024 | 4/25/2024 | -31.0 | |
| 6mx1Y breakeven wideners | 4/5/2024 | 4/19/2024 | 7.3 | |
| Old 10s/30s breakeven curve steepeners | 2/23/2024 | 4/12/2024 | -5.6 | |
| Long 1Y inflation swaps (hedged) | 3/8/2024 | 4/5/2024 | 7.0 | |
| 5-year TIPS longs | 2/9/2024 | 3/7/2024 | 9.9 | |
| 10-year energy-hedged BE narrowers | 1/19/2024 | 1/30/2024 | 7.5 | |
| 30-year breakeven narrowers | 11/9/2023 | 12/7/2023 | 21.7 | |
| 5Yx5Y inflation swap shorts | 9/29/2023 | 10/13/2023 | 2.8 | |
| 3Yx2Y breakeven narrowers | 7/28/2023 | 9/12/2023 | 5.3 | |
| Beta-weighted 5Y breakeven wideners | 6/9/2023 | 7/13/2023 | 5.1 | |
| 2Yx3Y breakeven narrowers | 5/11/2023 | 6/1/2023 | 9.6 | |
| AGGREGATE: | ||||
| Number of trades | 13 | |||
| Number of winners | 11 | |||
| Hit ratio | 85% | |||
Source: J.P. Morgan
Interest Rate Derivatives
2024 Mid-Year Outlook
- The year so far has brought wide trading ranges and a significant repricing of Fed expectations. Forward OIS rates at a YE24 horizon have risen by over 100bp and are now priced to much less easing, even as other central banks like the ECB and BoC have initiated rate cuts. Swap yield curves and even swap spreads have exhibited correspondingly wide trading ranges this year
- Looking ahead, we anticipate a continued steepening in yield curves going into year-end, but much of this is already priced into current forwards, except for curves anchored in longer maturities and forward curves. Thus, outright curve steepening positions premised upon upcoming Fed easing are unlikely to deliver much gratification in coming months
- Fed expectations are also coalescing around a path of moderate rate cuts and tails are thinning, which likely implies reduced jump risk in markets going forward. This, together with the fact that forwards are over-pricing rate cuts in coming months, makes yield curve carry trades attractive as a theme. We continue to advocate for well-hedged carry trades that mitigate directional curve exposure while enhancing carry-to-risk ratios
- Term funding premium will likely continue to drift higher by ~0.5-0.6bp/year over the course of 2H24, in large part because of QT, which we think can continue all year at the now-tapered pace. Growth in bond fund AUMs is a possible offsetting factor, but we see such growth as unlikely to emerge in coming months as it is typically back-loaded in an easing cycle. Rising term funding premium will thus likely pressure swap spread curves flatter
- At the same time, zero-duration spreads are likely biased wider from here, in part due to the upward drift in term funding premium. Taking this into account along with our outlook for term funding premium, we see maturity matched swap spreads as biased significantly wider in the front end of the curve by year-end, modestly wider in the belly and mostly flat at the long end
- The reduction of dispersion in Fed expectations brings reduced jump risk going forward, which implies broadly supportive conditions for short gamma strategies. That said, implied volatility levels are close to fair value and will likely stay stable in 2H24. This means outright short gamma exposure, although likely to be profitable on average, may not offer attractive risk-reward characteristics due to the lack of a convincing downward bias in implieds, and gamma strategies will likely need to be actively managed in coming months
- Alternatively, investors can consider finessing volatility exposure by selling the volatility of individual principal components that characterize yield curve moves. We describe a novel approach to designing such trades, which opens the door to a new class of relative value trades in the options market. In particular, selling the volatility of the second principal component appears likely to offer better returns relative to various metrics of risk
Waiting for someone or something to show you the way
The year so far has been one of wide trading ranges in US Rates markets. Forward OIS rates at a year-end 2024 horizon are sharply higher over the course of the first half, and are only recently exhibiting some stability after trading in a 100bp range in 1Q24. The dollar is ~5% higher, but in relatively steady fashion in part due to greatly lowered easing expectations in the US, even as other central banks such as the ECB and the BoC have delivered their first rate cuts. Even swap spreads have exhibited wide trading ranges, with (for instance) 2-year spreads moving a band that was over 10bp wide in 1Q as well as 2Q. Amidst all this, credit markets have fared quite well, with the JULI index spread tighter as well as more stable (Figure 1).
The main driver of such wide ranges in US rates has been ever-shifting expectations surrounding the path of policy rates. Not only are year-end OIS rates higher, implying diminished easing expectations, but the dispersion surrounding such expectations is also now lower. Forward OIS rates are averages over a market-implied distribution, and the width of that distribution and the fatness of the tails is an important determinant of jump risk in markets. Our preferred way of characterizing this has been to decompose the implied distribution of YE24 OIS rates (inferred from the Dec 2024 SOFR futures options market) into a weighed sum of scenario specific Normal distributions, each of which can be associated with a certain policy outcome (e.g., 3 cuts by year end). Details of this approach can be found elsewhere (see What’s the rush?), but what is noteworthy here is that expectations have steadily been coalescing around what one might call a shallow path - the weights associated with scenarios spanning zero to 3 cuts have risen in total, while the weights on other scenarios has fallen. Most important of all, the weight on a 1-hike-by-year-end scenario, which rose considerably in April and May, is back near zero thanks to soft inflation data as well as Chair Powell's comments signaling that additional hikes were not in anyone's baseline view (Figure 2).
Figure 1: The year so far has been one of wide trading ranges in US Rates markets
YE23, 1Q24, and current levels for selected US rates market variables, equity indices, and credit spreads; units as indicated, current values as of 6/26/2024
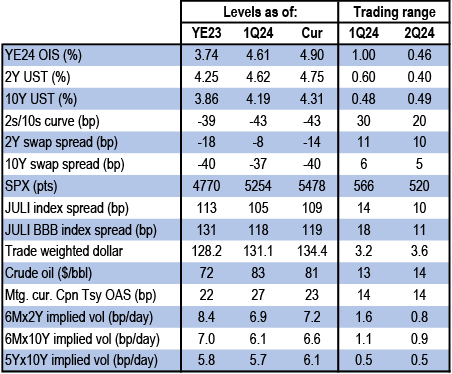
Source: J.P. Morgan.
Figure 2: Following softer inflation data as well as Chair Powell’s post-meeting comments, market expectations have coalesced around a moderate easing path
Total weights on year-end policy rate scenarios representing 1 hike, Shallow Cuts*, and Deep Cuts*, as calculated from a decomposition of the implied probability distribution associated with Dec 2024 SOFR futures**; Dec 2023 - Current
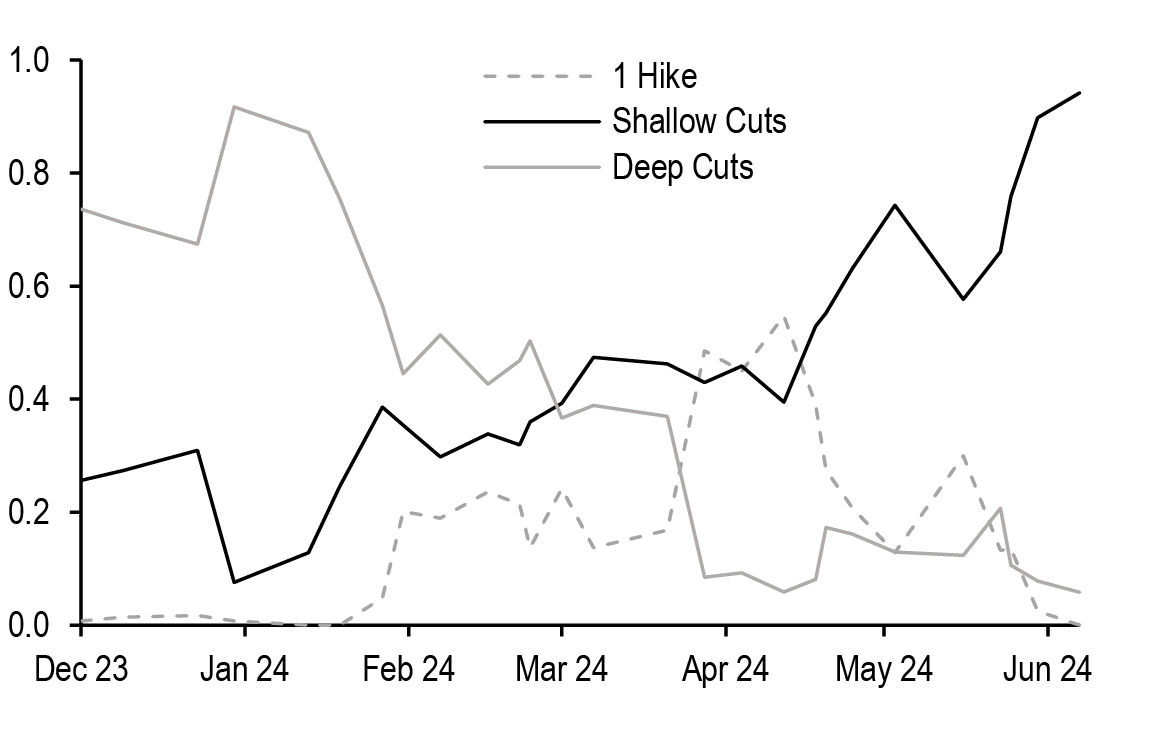
Source: J.P. Morgan., CME
* Shallow Cuts correspond to the total weights on the 0 Cut,1 Cut, 2 Cuts, and 3 Cuts scenarios. Deep Cuts correspond to the total weights on the >3 Cuts scenarios. Scenarios outlined in Figure 2 of What’s the rush?.
** We enumerate a list of scenario-specific Normal distributions with fixed standard deviations and means that are separated by 25bp, and then require the implied distribution to be a weighted combination of these individual distributions. The weights are then solved for, by fitting to the observed prices of calls and puts at various different strikes. For more details of our approach, see What’s the rush?
In addition to policy rates, there is also quantitative tightening or Fed balance sheet reduction to consider, which has been ongoing and is likely to continue for the rest of the year. Our projections for the Fed's balance sheet size, as well as the major liability components, are shown in Figure 3. We expect that QT can continue at the now-tapered pace for the remainder of the year before O/N RRP balances will decline to below $300bn, at which point we expect balance sheet runoff to halt. This is because a reasonably sized RRP facility is likely necessary as a buffer against stress in funding markets, given that the marginal propensity of RRP investors to lend in response to spikes in repo rates is higher than the marginal propensity of banks to do the same. Therefore, even though Reserves are projected to remain at over $3Tn by year end, which would have been considered ample a few years ago, the Fed will likely need to halt QT around year end or thereabouts.
Figure 3: We estimate that Quantitative Tightening can continue over the remainder of the year at the now-tapered pace
Current* and projected** values for Fed balance sheet assets, RRP, TGA, Reserves, and Commercial bank deposits*** through 2024, $bn
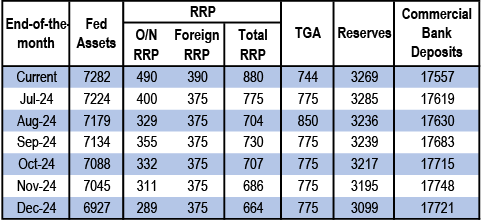
Source: J.P. Morgan., FRED, Federal Reserve H.4.1, Federal Reserve H.8
* Current as of 6/27/2024 Fed H.4. release
** July runoff accounts for the additional portion of Treasury runoff that will occur at June month end
*** Deposits as of 6/21/2024 Fed H.8. release
What does all this mean for our views on the markets going forward? We discuss this in the sections that follow in greater detail. But to summarize, our themes in the rates markets stem from four underlying observations. First, we do expect the Fed to begin easing in November (followed by additional cuts at a 25bp/quarter pace), but forwards are currently pricing in more cuts than will likely occur in the future. Second, markets will likely remain more stable and exhibit much less jump risk in the months ahead, in comparison with the first half of this year. Taken together, these two observations lead us to favor carry trades in coming months (see Swap Yield Curve). Third, our expectation for continuing QT over 2H24 is a driver of our view that term funding premium will likely be biased higher over 2H24. This, together with our outlook for a widening in zero-duration spreads, causes us to favor swap spread wideners at the front end and in the belly, while leaving us neutral over the medium term in the long end of the curve (see The Outlook for Swap spreads in 2H24). The upcoming US Presidential elections add some upside risk to term funding premium and an additional flattening bias to spread curves. This is because baseline expectations call for divided government (with the Senate likely in Republican control and the House in Democratic hands), but either a Blue or a Red sweep is likely to result in larger deficits (albeit of different magnitudes). While this is likely to become a growing risk, particularly to positions in longer maturity sectors, it is longer term in nature and unlikely to significantly influence swap spreads over the remainder of this year. In the options market, our expectations for benign conditions and low jump risk in the months ahead is supportive of short gamma carry strategies. But given that swaption market implied volatility levels are fairly close to fair value and will likely remain rangebound in 2H24 around our year-end projections, active two-sided management of volatility risk will likely be necessary over the remainder of the year (see Options) . Finally, we discuss a new approach to improving upon the performance of outright short gamma strategies by trading the volatility of individual principal components that describe moves in yields across the curve. While Principal Component Analysis has been used for a variety of purposes in the markets, to our knowledge it has never been used to unbundle the total volatility of yields into volatility of principal components and trade them individually. This widens the relative value opportunity set by opening up a new class of trades; we discuss how to construct such trades, as well as why options market investors should consider such strategies (see Trading Principal Component Volatility).
The Outlook for Swap spreads in 2H24
As we noted earlier, the first half has seen yields trade in a considerably wide range, thanks to dramatic shifts in Fed expectations. At the start of the year, expectations for policy rates over the course of the year were pretty much concentrated in scenarios involving deep cuts (5 or more by year end). As inflation data proved stickier than expected early on, these expectations reversed course, to the extent where a not-insignificant weighting was put on scenarios involving additional hikes in April and May. But a softer inflation print in June, followed by Fed Chair Powell’s comments all helped to mitigate the tail risk of further hikes. More recently, market expectations have coalesced around a moderate easing path that involves somewhere between zero and three cuts by year end (Figure 2). Through it all, the range in yields has been significant, with front end yields trading in a ~100bp range and long end yields trading in a ~75bp range. The range in maturity matched swap spreads has also been significant, at about 10% of the range in yields (Figure 1). But the wide ranges in swap spreads are not because of correlation with yield levels - indeed, the beta between 5-year maturity matched swap spreads and 5-year Treasury yields has been essentially zero over the past three months. Rather, it reflects the swings in macro factors that impact the entire term structure of swap spreads.
Figure 4: Over the course of 1H24, zero-duration spreads and term funding premium have traded in especially wide ranges
Zero duration spreads* (bp, left) and Term funding premium* (bp/year, right), 12/27/2023 - 6/26/2024
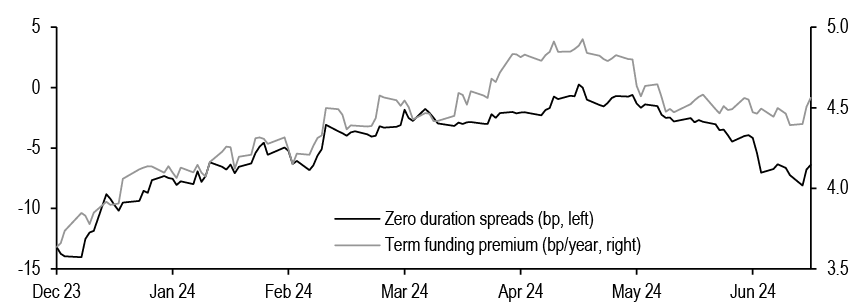
Source: J.P. Morgan.
* For details on our methodology for calculating Term funding premium and Zero-duration swap spreads, see Term Funding Premium and the Term Structure of SOFR Swap Spreads
As we described in detail a few months ago, the term structure of swap spreads is best understood by examining the slope, which is the negative of a measure of term funding premium, and the intercept, which we call zero duration swap spreads because it can be interpreted as the swap spread of a near-zero duration UST. Over the course of 1H24, zero-duration spreads have traded in an especially wide range, varying from -15bp at the start of the year to near zero in late April - it now stands near -7bp. Term funding premium, which can be defined as the incremental compensation demanded by Treasury investors for each additional year of modified duration after hedging interest rate risk, has also varied from as low as 3.5bp/year to a high of nearly 5bp/year - this now stands near 4.5bp/year (Figure 4).
To contemplate the outlook for swap spreads over the remainder of the year, we begin by first projecting the outlook for term funding premium and zero-duration spreads (i.e., the parameters used in our parametric representation of the spread curve). We have discussed our model for these market variables elsewhere in detail (see Term Funding Premium and the Term Structure of SOFR Swap Spreads). But Figure 5 contains a brief statistical description of our model for term funding premium (with recently refreshed coefficients), and shows a factor-based attribution of the change seen in 1H24, as well as our projections for term funding premium over 2H24. We make two observations from this exhibit. First, the 1H24 rise in term funding premium was largely due to a reduction in the Fed's balance sheet, partially offset by the decline in RRP balances. Second, supply side effects were smaller- the increase in UST duration supply accounted for a ~0.2bp/year increase in term funding premium. Looking ahead to 2H24, these are the same factors likely to be at play. QT is expected to continue over the remainder of the year albeit at a tapered pace, and is likely to produce a ~$350bn reduction in the size of the Fed's balance sheet (Figure 3). Even with a small offset from the expected ~$150bn reduction in RRP balances, we see term funding premium rising by ~0.5-0.6bp/year from current levels by year-end.
Figure 5: We look for term funding premium to rise in 2H24, largely on the back of continuing QT
Statistics from regressing* term funding premium (TFP)** versus its drivers (units as indicated), and YE23, current (6/26/2024, except RRP as of 6/19), and YE24 projected values for drivers of term funding premium, factor level attribution of change in 1H24 ***, and 2H24 projections
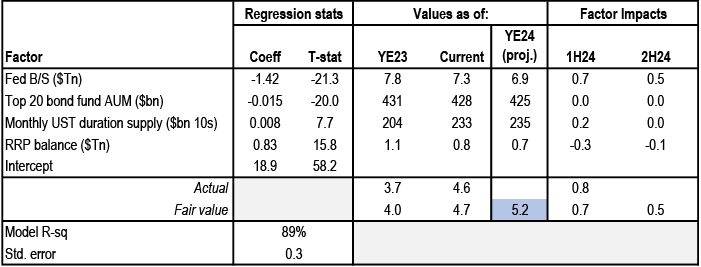
Source: J.P. Morgan.
* Regression period from Apr 2021 - Jun 2024
** Term Funding Premium is defined in Figure 2 of Term Funding Premium and the Term Structure of SOFR Swap Spreads
*** Factor impact is defined as the change in each driver multiplied by the drivers coefficient.
There is one possible offsetting factor that could emerge over the course of the remainder of the year, and that is a revival of AUM growth at bond funds. Rising AUM at bond funds tends to produce passive demand for USTs across the curve (because these funds typically manage to an index), which therefore results in a decrease in term funding premium. Based on the coefficients shown in Figure 5, we can see that a ~10% increase in AUMs would suffice to fully offset the projected increase in term funding premium stemming from the other drivers. But how likely is such an increase in AUMs? Bond fund AUM growth has been lackluster, in part because of the inverted yield curve, and any pickup in AUM growth will likely be backloaded and only occur when easing is underway. Therefore, in a practical sense, we think much of the next half is likely to be characterized by an upward drift in term funding premium. All else equal, this implies a flattening bias on spread curves going forward.
There is likely additional upside risk to term funding premium from the upcoming US Presidential elections in November. Our baseline projections for the remainder of the year assume current consensus election outcomes, which call for divided government with a Republican Senate and a Democratic House. In such an event, any significant fiscal expansion is unlikely. But a potential Blue or Red sweep would make deficit expansion more likely (see Treasuries). Finally, any market impacts stemming from such fiscal expansion would depend on not just budget deficits but also shifts in the growth outlook. Given the uncertainties involved, and also given that the modal outcome appears to be divided government, we expect election concerns to not materially influence swap spreads over 2H24. That said, this certainly bears watching, especially as the political landscape becomes clearer closer to the election.
What about zero-duration spreads? All else equal, this factor points to a widening bias. A brief summary of our model for zero duration spreads, a factor-level attribution of changes seen in 1H24, and our projected change over 2H24 are all shown in Figure 6. As can be seen, a likely increase in term funding premium as well as our outlook for lower short rates by year end both point to a widening in zero-duration spreads by year end. In particular, we see zero-duration spreads going from their current level of ~minus 6bp to ~plus 2bp by year's end.
Figure 6: Zero-duration spreads are likely biased wider in 2H24, mainly because of an anticipated rise in term funding premium
Statistics from regressing* zero duration swap spreads** versus its drivers (units as indicated), YE23, current (6/26/2024, except RRP as of 6/19), and YE24 projected values for drivers of zero duration swap spreads, factor level attribution of change in 1H24 ***, and 2H24 projected value for zero duration spreads
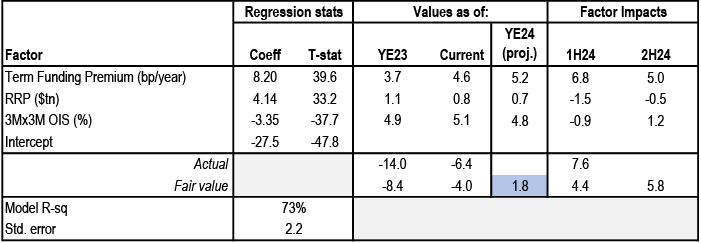
Source: J.P. Morgan.
* Regression period from Apr 2021 - Jun 2024
** Zero-duration swap spread is defined in Figure 6 of Term Funding Premium and the Term Structure of SOFR Swap Spreads
*** Factor impact is defined as the change in each driver multiplied by the drivers partial beta from the regression in the previous figure.
Mechanically, our widening bias on zero-duration spreads implies wider spreads in all sectors of the curve, all else equal. But of course, these impacts must be netted against the impact of rising term funding premium, which pressures swap spreads narrower and spread curves flatter. The combined effect is likely to be a pronounced widening bias at the front end, more modest widening pressure further out the curve, and a spread curve flattening bias overall.
Before synthesizing all of this into our swap spread forecasts for YE24, it must be said that there are of course additional sector specific drivers of swap spreads in each sector, as we also noted in our recent note on this topic. While those drivers can all be tactically important, they are unlikely to drift significantly over the medium term and are thus unlikely to materially alter our spread outlook. Indeed, swap spread deviations from the term structure baseline in the 2- to 10-year maturity sectors have been steadily converging towards zero, and have mostly been noisy in recent months (Figure 7). Even in the 20-year sector, they have been mostly stable and mean-reverting around levels cheaper than the baseline would imply, but they experienced a brief episode of richening in late May which has since retraced (Figure 8).
Figure 7: Swap spread deviations from the term structure baseline in the 2- to 10-year maturity sectors have been mostly converging towards zero
2Y, 3Y, 5Y, 7Y, and 10Y swap spread deviations* relative to the term structure of swap spreads, 3/20/2024 - 6/26/2024; bp
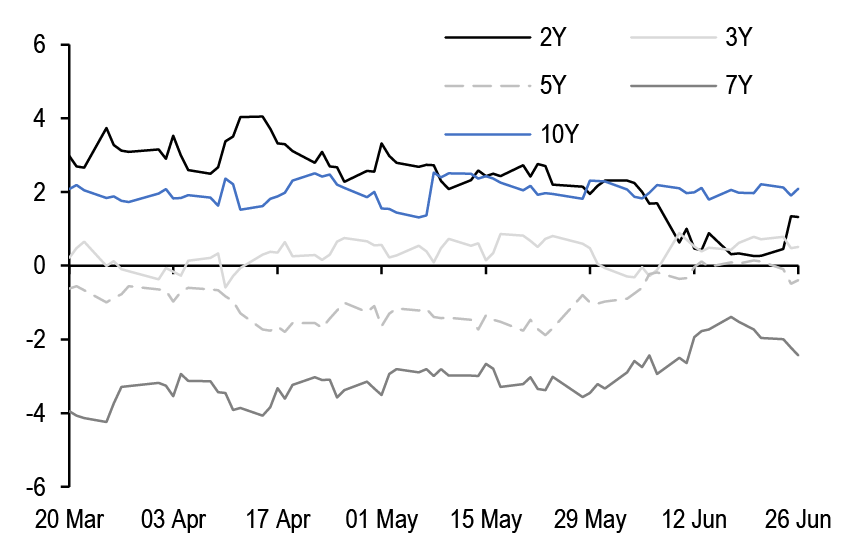
Source: J.P. Morgan.
* For each tenor, a baseline value is calculated as TFP * -1 * modified duration, plus zero-duration swap spread, where TFP refers to term funding premium as of that date. Deviation is calculated as actual maturity matched swap spread minus the baseline value for that tenor. For more details, see Term Funding Premium and the Term Structure of SOFR Swap Spreads
Figure 8: In the 20-year sector, deviations have been mostly stable and mean-reverting around levels cheaper than the baseline would imply, aside from a brief episode of richening in late May which has since retraced
20Y swap spread deviation* relative to the term structure of swap spreads, 3/20/2024 - 6/26/2024; bp
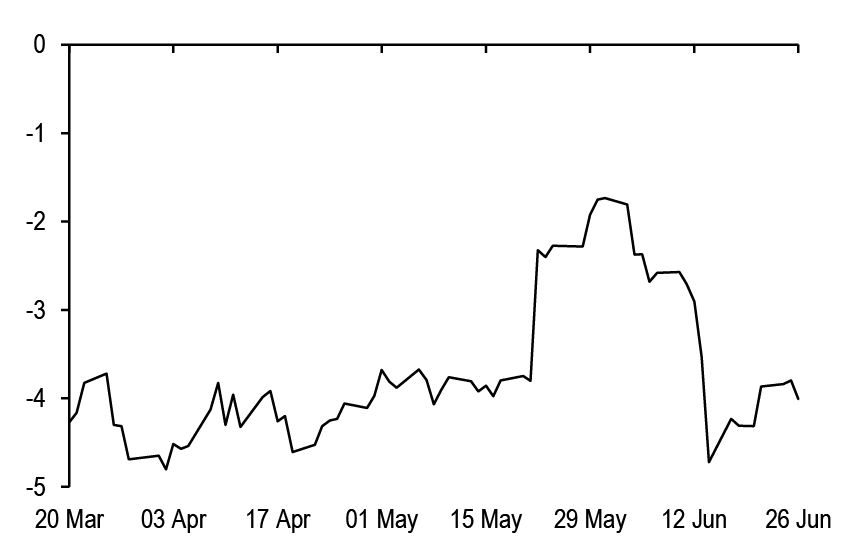
Source: J.P. Morgan.
* For each tenor, a baseline value is calculated as TFP * -1 * modified duration, plus zero-duration swap spread, where TFP refers to term funding premium as of that date. Deviation is calculated as actual maturity matched swap spread minus the baseline value for that tenor. For more details, see Term Funding Premium and the Term Structure of SOFR Swap Spreads
Thus, we really do not see deviations from the term structure becoming significant drivers of spreads in coming months, and instead we simply assume that recent average deviations will continue to persist in coming months. The one exception is the 30-year sector, where swap spread deviations from the term structure baseline have exhibited a systematic correlation to the Fed's balance sheet size - this is likely because the 30-year sector is even more sensitive to the Fed's balance sheet size than is captured through term funding premium. Here, we expect the Fed's balance sheet reduction over 2H24 to contribute modest additional narrowing pressure on 30-year swap spreads. Putting all these together, our swap spread forecasts for year-end are shown in Figure 9. As we noted, we expect the widening pressure to be felt mostly in the front end and in the belly of the curve, with 2-year swap spreads ending the year nearly 10bp wider than current levels. We expect the 20-year and 30-year sector to remain mostly flat through year-end, and the spread curve to flatten.
Figure 9: Our forecast for maturity matched swap spreads at various tenors
Current (6/26/2024) maturity matched swap spread and YE24 projection* of maturity matched swap spreads in various sectors; bp
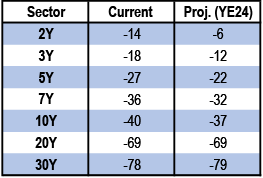
Source: J.P. Morgan.
* Fair value model forecast methodology is detailed in Term Funding Premium and the Term Structure of SOFR Swap Spreads . Projections are calculated using the projections for Term Funding Premium and Zero Duration Spreads as detailed in the above figures and assuming deviation from term structure in each sector is the near-term average
Figure 10: Long term considerations - monthly UST duration supply could increase from its current level of ~230bn 10s to over 300bn 10s in 2028
Monthly UST duration supply, current 2024 levels and quarterly projections through 2028, $bn of 10Y equivalents
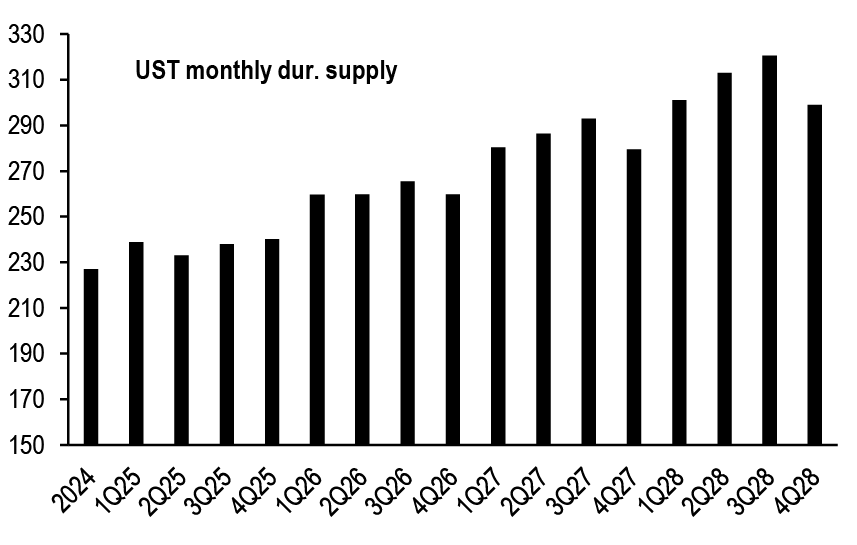
Source: J.P. Morgan.
Lastly, even though the natural horizon for this mid-year outlook piece is the second half of the year, it is worth contemplating the factors that may be at play over an even longer horizon that includes 2025 and beyond, for instance. Over such a long term horizon, one key factor that will be at play is of course Treasury supply. As our UST strategists have noted recently (see Wait till next year, J. Barry, 5/24/2024), current auction sizes are likely insufficient to meeting Treasury's financing needs in the future, and coupon auction sizes will likely need to rise beginning in 2H25 and beyond. Should those future auction size projections come to fruition, monthly UST duration supply will likely increase from its current level of ~$230bn 10s to over $300bn 10s in 2028 (Figure 10). All else equal, this would translate into a term funding premium increase of about 0.65bp/year. In turn, this could narrow 10- and 30-year spreads by 5bp and 11bp, respectively, all else equal. As with the upcoming elections, we see this more as a source of long term risk to spreads rather than as a factor that might play a significant role in 2H24.
Swap Yield Curve
As with yield levels, swap yield curves have traded in fairly wide ranges so far this year despite a Fed that has been on hold. For instance, the 2s/30s and 5s/30s swap curves have traded in 40-50bp ranges this year, while even the 1s/2s curve has traded in a nearly 40bp range (Figure 11). These changes of course reflect the policy uncertainty that has characterized the first half - as we noted earlier, markets began the year pricing in expectations of considerable rate cuts this year, but erased nearly all of that until recently, before softer data more recently has helped policy expectations converge around expectations for moderate cuts (3-4 cuts by year end).
Figure 11: Swap yield curves have traded in fairly wide ranges in 1H24 despite a Fed that has been on hold all year
Selected statistics for benchmark swap yield curves, 1/2/2024 - 6/26/2024; bp
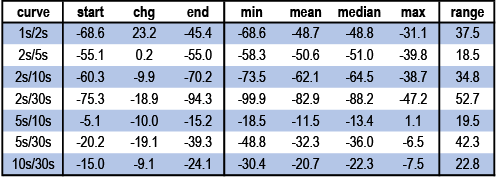
Source: J.P. Morgan.
Reassuringly, through it all, our empirical fair value model for various spot and forward swap curves has held up nicely in terms of accounting for moves. As readers may recall, we use a common set of five factors to explain spot and forward swap curves. These are the level of the short rates (3Mx3M forward OIS), Fed expectations (the 3Mx3M / 15Mx3M OIS curve), the size of the Fed's balance sheet (to account for QE / QT), short term inflation (2Y inflation swap yield) and long term inflation expectations (5Yx5Y inflation swap yield). Because we estimate the model over relatively long history (10-years), we include a control variable to account for the Fed's policy rate guidance, which it has used as a tool in the past. But as we look ahead over the remainder of the year, we make one minor tweak to this fair value model, to account for the observation that yield curves appear to have steeper equilibrium levels when the Fed is on hold, after accounting for all these factors. In other words, the experience of the past nine months since the last hike suggests that the intercept has likely been shifted up in each sector. To incorporate this, we re-estimate our model over ten years of history, but allowing for an intercept shift after November 2023. Details of this model are shown in Figure 12.
Figure 12: Our empirical fair value model uses a handful of market factors to explain a variety of different spot and forward yield curves …
Statistics from regressing* various spot and forward curves against 7 drivers**, model T-stats, R-squared, Standard error, current yield curve level, and current fair value/residual; current value as of 6/26/2024

Source: J.P. Morgan., Federal Reserve H.4.
* Regression from June 2014 to June 2024
** Underlying drivers are: Forward Guidance (number of years of forward policy commitment by the Fed), 3Mx3M OIS rate (%), Fed expectations curve (15Mx3M - 3Mx3M OIS curve as a proxy), size of the Fed balance sheet ($tn), 5Yx5Y inflation swap yield (%), 2Y inflation swap yield (%), intercept shift (0s before 11/1/2023, 1s after)
Before looking ahead to 2H24, we first use our fair value model to understand the relative impacts of the various factors so far this year. When one examines the moves in each driver together with the coefficients shown above, it becomes clear that the bulk of the move in swap yield curves is really due to the move in short rates and Fed expectations, and the impact of each of the other factors has been fairly minor in comparison. Moreover, the actual change in curves has been pretty much in line with expected moves that one might calculate given the move in the underlying drivers, as seen in Figure 13.
Figure 13: … and such a model has worked well in 1H24, as indicated by the fact that the actual change in numerous curves has been mostly in line with model expectations
Actual change in swap yield curves (Y-axis) versus expected change in swap yield curves curves due to underlying drivers* (X-axis) over the period 1/12/2024 - 6/18/2024; %
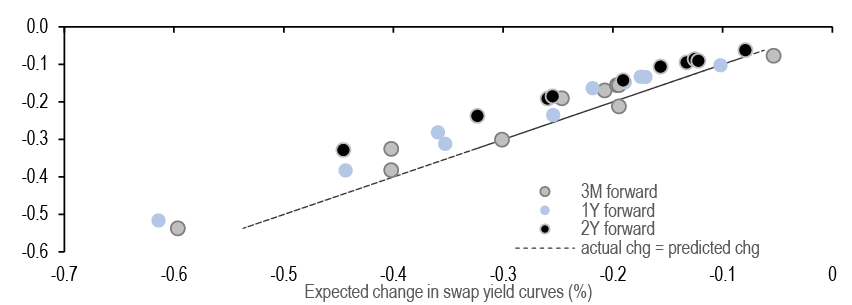
Source: J.P. Morgan.
* Fair value model drivers are shown in the above Figure, and expected change is calculated as the change in the underlying drivers times the coefficients from our fair value framework
As we look ahead to the remainder of the year, we begin by projecting the likely YE24 levels of the drivers in our empirical yield curve model. Given our economists’ Fed funds forecasts, we estimate that 3Mx3M OIS rates would likely trade near ~4.75% by year end, or about 40bp lower from current levels. This in turn is consistent with a minus 100bp value for the 3Mx3M / 15Mx3M curve, based on recent empirical relationships between the two. Using these, as well as our inflation strategists' forecasts for short term and long term inflation swap yields, we arrive at our projections for the various spot and forward yield curves, at a YE24 horizon. This is shown in Figure 14, along with the values for these curves as priced into current forwards. From this, we can make several observations. First, all these curves are likely to steepen by year end; the 2s/10s and 5s/30s curves, for instance, are likely to end the year 15-20bp steeper than current levels. But of course, this alone is not enough to argue for steepeners, and we must examine how much of this is already priced into current forwards. In this regard, as Figure 14 also shows, for yield curves anchored in the front end much of the anticipated steepening is already priced into current forwards. As can be seen, over 100% of the anticipated steepening in the 2s/5s and 2s/10s swap yield curves is already priced into spot and near-spot yield curve forwards. This means a flattening bias remains attractive in these sectors for now. This is less true for 2Y forward curves and/or yield curves anchored in the back end. For instance, spot 5s/30s and 10s/30s yield curve steepeners, as well as yield curve steepeners constructed using 2Y forward starting swaps are all likely to be profitable, over the remainder of the year. But given the relatively moderate nature of anticipated easing, and given how much is priced into forwards, the best yield curve strategies in 2H24 will likely involve less outright directional trades and more valuation-dependent and nuanced trade constructions.
Beyond outright macro curve trades, we expect positive carry trades on the yield curve to be profitable going forward. With the Fed likely to remain on hold for several more months and begin easing only at a moderate pace late this year, the environment should remain favorable for yield curve carry trades. Indeed, such positive carry yield curve trades have indeed become profitable since the Fed went on hold last year. One way to see this is to examine a measure we refer to as the "carry beta". This is calculated by assuming the construction of a cross section of swap curve butterfly trades each day that will be unwound in a month, and calculating the beta between the realized P/L on those trades versus the ex-ante carry on those trades. We associate this carry beta with the date on which the hypothetical trades are initiated. As seen in Figure 15, carry trades were already profitable during the later stages of the hiking cycle, but have become more so since the last hike in July of last year. We expect this to remain the case in coming months. Thus, we expect that our yield curve trading strategy in coming months will continue to revolve around positive carry. But, given the earlier discussion about curve trades needing to be less directional and more nuanced, we continue to advocate for the construction of well hedged carry trades that mitigate directional risk while enhancing carry-to-risk ratios. While this sounds repetitive, given the many times in recent months that we have advocated such a theme, it also remains the case that such trades do work, and we view this as the appropriate way to approach yield curve trading in the current regime.
Figure 14: Swap yield curves are likely to steepen in 2H24, but this is fully priced in except for spot and forward curves anchored in the belly and longer tenors
Current and YE24 projected curve levels, projected change in curves*, YE24 forward curve levels, projected YE24 curve level minus YE24 forward curve levels, and % steepening priced into current forwards**, current as of 6/26/2024; %
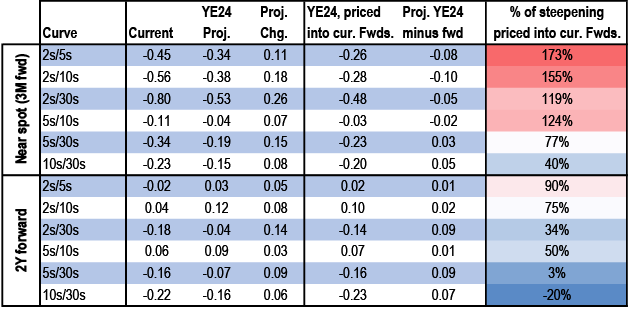
Source: J.P. Morgan.
* Projected change is calculated as the sum of the projected change in each variable times the partial beta of each variable from our Fair Value model
** Calculated as the difference between the forward and the current swap yield curve divided by the projected change
Figure 15: Carry trades were already profitable during the later stages of the hiking cycle, but have become more so since the last hike in September of last year
Average carry beta* over each of the specified periods in the current hiking cycle, 3/1/2022 - 5/20/2024; unit-less
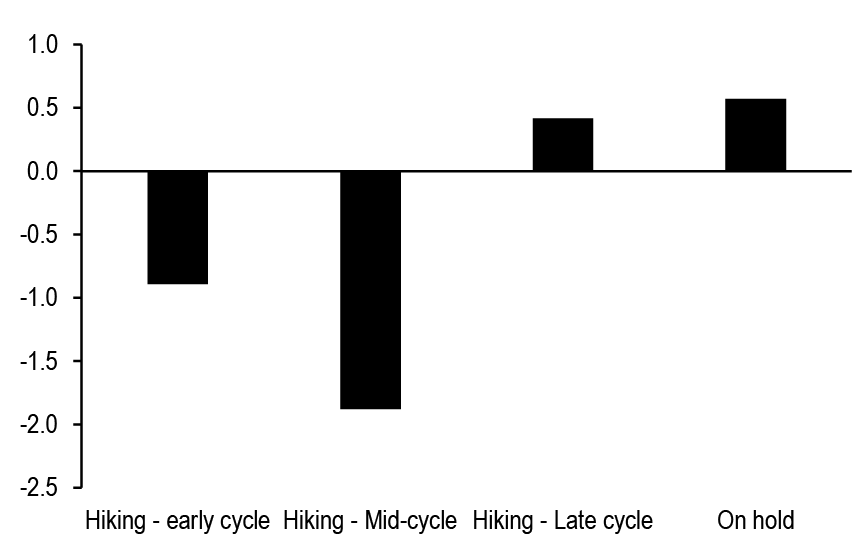
Source: J.P. Morgan.
* Carry beta calculated for each date, between 01/2003 – 05/2024. Beta defined as the regression beta between P/L on 11 different butterflies initiated on that date, and the carry on the trades as of that date. Trades are assumed to be held for 1M. Butterflies included are 2/3/5, 3/5/7, 5/7/10, 10/20/30, 2/5/10, 3/7/10, 5/10/20, 5/10/30, 7/10/20, 7/20/30, and 10/20/30.
Options
As with swap yield curves, implied volatility itself has traded within a wide range year-to-date, ultimately declining across much of the surface. Short expiry and short tail structures have declined the most, with 6Mx2Y implied volatility lower by ~1.2 bp/day while 2Yx30Y implied volatility is higher by ~0.2bp/day (Figure 16).
Figure 16: Implied volatility has traded within a wide range year-to-date, ultimately declining across much of the surface
Selected statistics for various SOFR swaption structures, 1/2/2024 - 6/26/2024; bp/day

Source: J.P. Morgan.
Looking ahead, there are reasons to be bearish on gamma in the near term. After many months of significant policy uncertainty where the future cone of possible policy paths was wide enough to span deep cuts as well as further hikes, softer data is finally helping market expectations to coalesce around moderate cuts by year end (see Figure 2). This is also broadly in line with our own expectations - we look for the Fed to be patient in the near term, waiting for several months of corroboration in the data before eventually easing. The tightening of implied distributions and the thinning of the tails will likely be helpful in moderating jump risk and delivered volatility in the markets. In other words, 2H24 is shaping up to be favorable for short gamma carry strategies.
Of course, entry levels matter and we need a suitable model to decide whether entry levels are favorable or not. In addition, we also need a way to assess value across the entire vol surface including longer expiries. We have utilized an empirical fair value framework for implied volatility for this purpose. But we now make minor tweaks to our framework to adapt it slightly for use in a Fed-on-hold environment.
As readers may recall, our fair value framework is a two-step process, where we first start by modeling the percent-yield-vol versus rate relationship assuming the form yvol = a*exp(-by) + c, where y denotes the ATMF yield level and yvol denotes implied percent yield vol. We then estimate the parameters of this model using a cross-sectional fit, using 10-years of historical data on percent-yield vols on ATMF swaptions with several different tails and expiries. We translate our yield vol backbone to a bp vol backbone, which forms the foundation of our empirical fair value model.
We then model the deviations from this fitted curve, since implied volatility is not determined purely by yield levels. To account for the various other influences on volatility, we use a common set of variables (yield levels, market depth, real rates and monetary policy variables) to model the deviations for each structure. Details of our original model can be found in our Interest Rate Derivatives 2024 Outlook. But we make a few minor changes here, chiefly so that we can better capture the structural down-shift in equilibrium implied vol levels that can come about when the Fed is on hold. The tweaks to our fair value model are as follows. One, we remove the magnitude of Fed expectations as a variable, as it has become less significant. Two, we expand the historical window of our regression fit to go back to June 2018, to capture the behavior in the late stages of that hiking cycle. Three, as noted above, we recognize that a Fed-on-hold regime can bring different vol equilibrium levels and therefore allow for a shift in the intercept after Nov 2023 (which marked the second meeting where the Fed kept rates unchanged). This is very similar to the tweak we described earlier to our empirical model for the yield curve. Our updated empirical model for implied vol differentials from the backbone based on these factors is shown in Figure 17.
Figure 17: Our empirical model for modeling deviations of normal bp volatility from the fitted backbone
Statistics from regressing* deviations of normal bp volatility from reference** volatility against yields (%), natural log of duration weighted market depth*** ($mn), 2Y real rates (2Y swap rates minus 2Y inflation swap) (%), Fed balance sheet size ($tn), and forward guidance (in # of months), current residual (bp/day) as of 6/26/2024
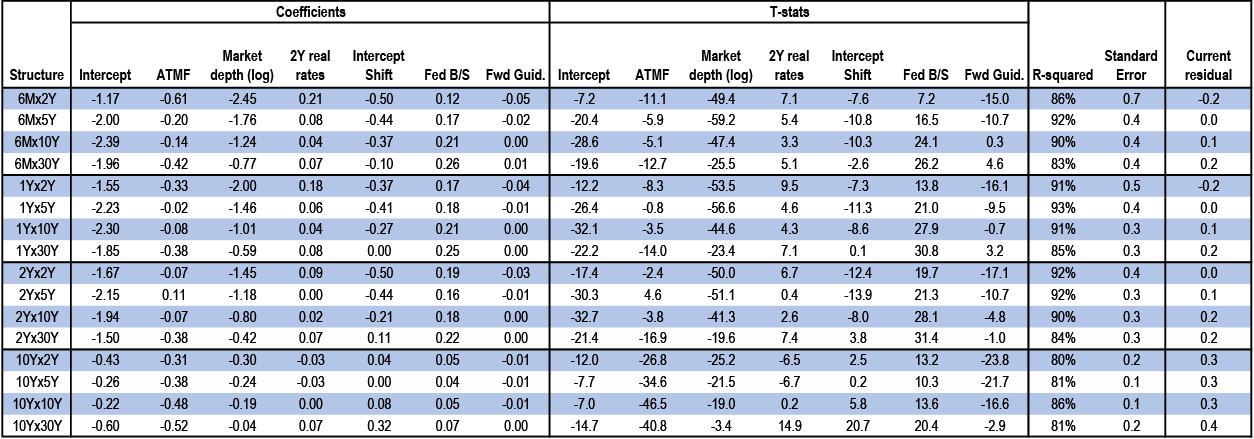
Source: J.P. Morgan., BrokerTec, Federal Reserve H.4.
* Regression from June 2018 - June 2024, excluding March - June 2020
** Reference volatility calculated as yield vol times yields divided by square root of 251. Yield vol is modeled as 24.6 plus 124.9 times exponential of minus 1.1 times yields. The fit is done over 10 years using 3M, 6M, 9M, 1Y, 2Y, 3Y, 5Y, 10Y expiry and 2Y, 3Y, 5Y, 7Y, 10Y and 30Y tails.
*** Market depth is the size of the top 3 bids and offers by queue position, averaged between 8:30 - 10:30am daily. Duration weighted market depth refers to the weighted sum of market depth in 2s, 5s, 10s, and 30s using weights of 0.25, 0.5, 1 and 2, respectively.
Armed with this adapted empirical fair value framework, we can turn to projecting our outlook for implieds across the vol surface. But first we need to project the drivers themselves. We project the ATMF yields in each sector by leveraging empirical relationships between those ATMF yield levels and Treasury rates, and applying that to our UST strategists' rate forecasts. In a similar vein, we additionally use our inflation strategists' forecasts to project real yields in coming months. These forecasts call for roughly unchanged nominal yield levels and slightly higher real yields in coming months. In addition, we assume that the Fed balance sheet will continue to decline throughout 2024, as we noted earlier.
Finally, we also assume residuals will converge by year end, although the fact that current residuals are small means this impact is relatively minor. All in all, we expect implieds to decline rather modestly from current levels by YE24 (Exhibit 18). For instance, we look for 6Mx10Y swaption implied volatility to end the year near 6.4 bp/day which is 0.2 bp/day lower, and 2Yx10Y swaption implied volatility to end the year near 6.4 bp/day, which is modestly lower from current levels. We also look for the expiry curve (defined as 1Yx1Y minus 10Yx1Y implied vol differential) and the tail curve (defined as the 1Yx1Y minus 1Yx10Y implied vol differential) to go towards 1.5bp/day and 0.9bp/day respectively (versus current levels of 1.6bp/day and 1bp/day). These are all modest changes, meaning that much like with the swap yield curve, simple directional long or short vol trades are unlikely to be the best risk-reward trades in the options market in 2H24. Rather, 2-sided trading strategies that actively rely on notions of fair value are likely to prove to be important in the months ahead.
Figure 18: The outlook for implied volatility in 2H24 is one of stability
Current swaption implied volatility and YE24 projected fair value* of implied volatilities for various swaption structures, current as of 6/26; bp/day

Source: J.P. Morgan.
* Projected fair value is calculated using the fair value framework from the previous exhibit and by projecting ATMF yields using 2Y, 5Y, 10Y, and 30Y USTs and our UST Strategists projections, assuming market depth improves modestly, 2Y real rates increase in line with our inflation strategists projections, and that the Fed balance sheet declines to $6.9tn. 100% residual convergence is assumed in the projection for YE24.
Trading Principal Component Volatility
As we noted earlier, we think the backdrop is broadly supportive for short gamma carry strategies, but the fact that implieds are both close-to-fair and likely to be stable means that more nuanced volatility trading strategies are called for. Simply maintaining an outright short gamma bias is likely to produce positive returns on average in our view, but may not be attractive relative to risk, given the lack of a compelling downward bias in implieds.
One way to enhance performance in such an environment is to fine-tune fair value assessments and actively manage volatility positions from the long as well as short side, based on deviations from fair value. Other approaches involve trading volatility of one tail versus another (e.g., 6Mx2Y volatility versus 6Mx10Y) or even broader implied volatility differentials by taking fair-value views on those spreads. Indeed, in our research publications, we routinely strive to find trades of all of these types, as and when opportunities present themselves.
But it is worth asking - is there yet another way that hasn’t yet been fully explored? In this section, we open the door to an entirely new class of relative value trades, that is based on a decomposition of volatility in any given forward rate into portions that stem from the volatility of each principal component driving rate moves.
Principal component analysis is widely understood and used in financial markets. For instance, it is common to express changes in yield levels across different tenors as the sum of (i) changes stemming from moves in a “level” factor or the first principal component, (ii) additional changes stemming from a “curve” factor or the second principal component, and (iii) so on. This is illustrated in Figure 19. The benefit of such a decomposition is that moves in each factor are designed to be uncorrelated to moves in other factors. PCA can be very useful in understanding the relative movements of highly correlated market variables, in constructing hedge ratios, and more. It is of course widely used for all of these purposes. Also, while PCA is typically computed using historical data, which makes it backward looking, we have described a way to calculate forward-looking or implied principal components by using data from the options market and the yield curve spread options market (see i-PCA: Implied Principal Component Analysis).
Figure 19: Using principal components to decompose one day’s change in yields across the curve - an illustration
An illustration of the decomposition of actual yield changes in benchmark swap yields in the 2-, 5-, 10- and 30-year sectors, as a weighted combination of a level factor (PC1), a curve factor (PC2), and higher order factors (PC3 and PC4).

Source: J.P. Morgan.
* For each principal component, we define its loadings on the 2Y, 5Y, 10Y and 30Y sector to be the impact of a 1-sigma move in that component on 2Y, 5Y, 10Y and 30Y rates respectively. For a more detailed explanation, see i-PCA: Implied Principal Component Analysis (12/6/2022). The weights may be thought of as random variables, whose realized values were 3.4, 1.6, 0.1 and 0.7 on the particular day shown above. In the scaling of principal components shown above, each weight is designed to have an implied standard deviation of 1. The implied PC1 volatility, in this example, would be square root of (6.9 2 + 7.2 2 + 6.4 2 + 5.1 2). Ex post realized PC1 volatility may be calculated similarly, by using an ex post historical estimation of principal components
PCA has even been used to characterize moves in ATMF implied volatility at various points on the vol surface, and in constructing relative value switch trades between different points on the vol surface. But as far as we are aware, the trading of the volatility of principal components remains an unexplored area. Thus, what we discuss here is different from all of these applications of PCA. Specifically, we address two questions:
- How can an investor trade the volatility of (say) just the first principal component, as opposed to (say) trading the total volatility of 10Y swap yields?
- Why might an options market participant consider such a strategy?
To elaborate upon this a little further here, Figure 19 illustrates the idea that moves in 5Y yields, or moves in 10Y yields, can be expressed as a weighted sum of moves in PC1, PC2, and so on, each of which is uncorrelated to the other. In other words, instead of thinking of yield changes in 5s or 10s as being random variables with their own volatility, we may instead think of the weights w1, w2, w3 and w4 as random variables with some volatility. (As an aside, empirically only the first and second principal components are usually significant in US Rates markets, and we ignore the third component and beyond for ease of exposition). Thus, as a direct consequence of the decomposition illustrated in Figure 19, it follows that the squared volatility of 10Y rates (or 5Y rates) can be expressed as a weighted sum of the squared volatility of each principal component. In other words, the total volatility of 10Y yields (say) can be unbundled into a portion that comes from the first principal component, and another portion that comes from the second principal component. (Technically, it is the square of the volatility that can be undbundled, but we take liberties with the language here to enhance readability).
The same would of course be true for a different point on the curve - the volatility of 5Y rates also can be similarly unbundled into portions that come from PC1 and PC2, but the relative proportions will likely be different. For instance, 5Y rates appear relatively unimpacted by swings in PC2, given the small loading for PC2 in the 5Y sector. Thus, the volatility of 5Y tails likely stems mostly from the volatility of PC1. This is not true for other points on the curve, such as 2s or 30s, for instance.
Logically, then, we ought to be able to combine a (say) 6Mx10Y straddle (which gives exposure to the volatility of PC1 as well as PC2), versus selling a carefully chosen amount of 6Mx5Y straddles (which mostly carries exposure to the volatility of PC1 given the small loading for PC2 in the 5Y tenor), to isolate exposure to the volatility of the first principal component. More generally, by combining volatility positions on different tails using carefully constructed hedge ratios, we can isolate long or short exposure to the volatility of any desired principal component.
There is one more technical detail to mention here. As one can guess from the above discussion, the calculation of the appropriate hedge ratio to isolate exposure to the volatility of principal components will depend on the estimation of the principal components and their loadings on each tenor. But how should one estimate the principal components? Should one use implied PCA or historical PCA estimates, in which case there is the follow-on question of how much history to use. In our analysis, we use implied principal components. By choosing this, we are effectively constructing trades at entry levels that may be thought of as representing implied principal component volatility, with the P/L on such trades ultimately depending on what the realized principal component volatility is in the future.
Does this work? In other words, are the returns from such a strategy in fact correlated to ex-post realized factor volatility minus the ex-ante implied factor volatility? Figure 20 demonstrates that this is indeed the case. Rolling 3M returns on such a strategy that used 6Mx5Y and 6Mx30Y swaption volatility to isolate long exposure to volatility of the first principal component has indeed closely tracked the differential between realized PC1 volatility and implied PC1 volatility at inception.
But why might an investor want to do this? Ultimately, the hope in trading unbundled components of volatility is that there is an edge to be had in buying / selling principal component volatility vis a vis outright straddles. There is some evidence that this is in fact the case. Figure 21 shows statistics regarding rolling 3M returns from 5 different delta hedged short volatility strategies over the past three years - (i) selling PC1 volatility using 6Mx5Y and 6Mx30Y as the two legs, (ii) selling PC2 volatility using the same two legs, (iii) selling 6Mx5Y straddles, (iv) selling 6Mx10Y swaption straddles, and (iv) selling 6Mx30Y swaption straddles. All returns have been scaled by their respective standard deviations, so as to make them directly comparable across strategies. As can be seen, selling component vol can be a worthwhile endeavor. For instance, a strategy of selling PC2 volatility over the past three years has produced rolling quarterly returns that are (a) better on average, (b) have a smaller 10th percentile loss, and (c) have a better 90th percentile profit. This suggests that there may be a systematic edge to be had in focusing on the volatility of principal components, as one more avenue to generate outperformance in the options markets.
Figure 20: Returns from a strategy designed to isolate long exposure to PC1 volatility are indeed explained by the differential between ex-post PC1 realized volatility and the ex ante implied PC1 volatility
Rolling 3M returns from a long PC1 volatility position constructed using 6Mx5Y and 6Mx30Y swaption straddles* (left, bp/notional), versus the difference between historical and ex-ante implied PC1 volatility (right, bp/day)
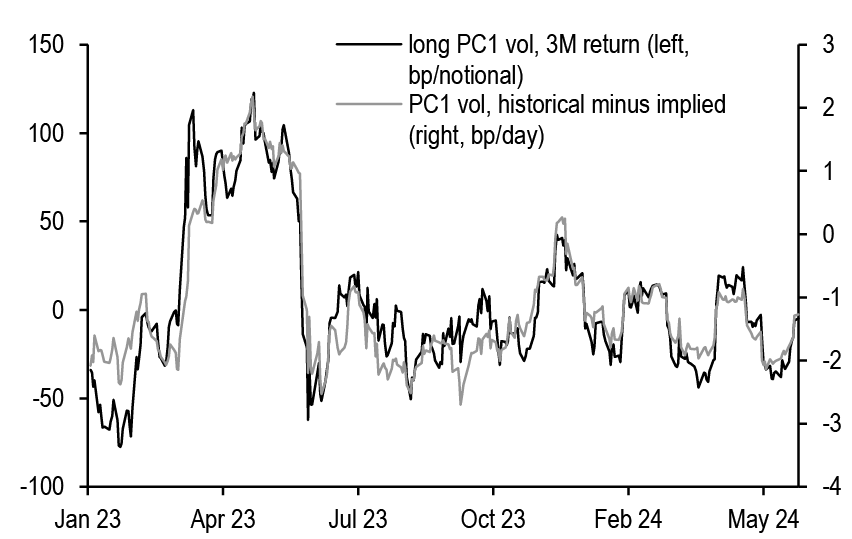
Source: J.P. Morgan.
* Weights on 6Mx5Y and 6Mx30Y straddles are chosen to isolate exposure to PC1 while hedging exposure to PC2.
Figure 21: Selling principal component volatility can be a worthwhile endeavor, as return characteristics suggest
Selected statistics* regarding rolling 3M returns from 5 different delta hedged short volatility strategies**, 6/15/2021 - 6/14/2024; bp/notional
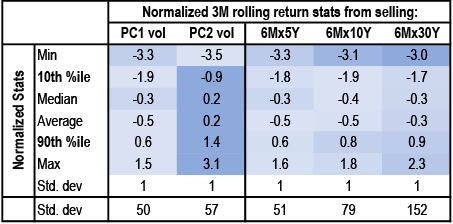
Source: J.P. Morgan.
* Values shown have been normalized by dividing by each strategy’s rolling returns by its standard deviation over the past three years, so as to facilitate comparison across strategies. The standard deviation is shown separately for completeness** Strategies designed to isolate exposure to PC1 and PC2 volatility use 6Mx5Y and 6Mx30Y swaption straddles as the two legs. All strategies assume daily delta hedging and monthly rolling of the options.
Trading Recommendations
- Stay short 6Mx10Y swaption straddles on a delta hedged basis, paired with a short position in Greens
P/L on this trade is currently 1.4abp. For original trade write up, see Fixed Income Markets Weekly 2024-06-14. - Continue to receive in 3Mx3Y and 3Mx5Y swaps versus paying in 3Yx1Y and 12Mx3M swaps
P/L on this trade is currently -0.8bp. For original trade write up, see Fixed Income Markets Weekly 2024-06-14. - Continue to pay in Feb 2037 maturity matched swap spreads versus receiving in USU4 invoice spreads
P/L on this trade is currently -0.2bp. For original trade write up, see Fixed Income Markets Weekly 2024-06-14. - Stay long Feb 37s versus selling USU4 Futures
P/L on this trade is currently 2.9bp. For original trade write up, see Fixed Income Markets Weekly 2024-06-14. - Maintain 3M forward 10s/30s steepeners (1:1.5 risk weighted) paired with M5/Z5 3M SOFR futures flatteners
P/L on this trade is currently -5.8bp. For original trade write up, see Fixed Income Markets Weekly 2024-06-07. - Maintain TU/TY invoice spread curve flatteners (1:0.35 weighted)
P/L on this trade is currently -4.4bp. For original trade write up, see Fixed Income Markets Weekly 2024-06-07. - Continue to Pay-fixed in 4.625% Feb ‘26 maturity matched swap spreads
P/L on this trade is currently -3.2bp. For original trade write up, see Fixed Income Markets Weekly 2024-05-31. - Maintain 1:0.75 risk weighted 7s/10s maturity matched swap spread curve steepeners
P/L on this trade is currently -0.8bp. For original trade write up, see Fixed Income Markets Weekly 2024-05-31. - Continue to Pay-fixed in 4.375% Aug ‘28 maturity matched swap spreads
P/L on this trade is currently -1.5bp. For original trade write up, see Fixed Income Markets Weekly 2024-05-31. - Continue to pay-fixed in 4% Feb 2034 maturity matched swap spreads
P/L on this trade is currently -3.2bp. For original trade write up, see Fixed Income Markets Weekly 2024-05-17. - Maintain 15Mx3M / 1YX1Y forward swap curve flatteners, paired with 20% of the risk in a long in 18Mx3M and a 24% risk weighted short in 3Mx5Y forward swaps
P/L on this trade is currently -2.1bp. For original trade write up, see Fixed Income Markets Weekly 2024-05-03. - Maintain 5s/30s spread curve flatteners
P/L on this trade is currently -0.2bp. For original trade write up, see Fixed Income Markets Weekly 2024-05-03. - Continue to overweight 1Yx10Y straddles versus a gamma-neutral amount of 1Yx15Y straddles
P/L on this trade is currently -1.1abp. For original trade write up, see Fixed Income Markets Weekly 2024-05-03. - Maintain 3M forward 10s/15s swap curve steepeners paired with 25% risk in 3M forward 3s/7s flatteners
P/L on this trade is currently 1.3bp. For original trade write up, see Fixed Income Markets Weekly 2024-04-26. - Continue to pay in 1.875% Feb 2027 maturity matched swap spreads
P/L on this trade is currently -4.7bp. For original trade write up, see Fixed Income Markets Weekly 2024-04-26. - Stay long A+100 1Yx5Y payer swaptions versus selling A-100 1Yx5Y receiver swaptions, delta-hedged daily, to position for a correction in skew
P/L on this trade is currently -3.7abp. For original trade write up, see Fixed Income Markets Weekly 2024-04-19.
- Maintain long 65% risk weighted 1Yx10Y swaption volatility versus selling 1Y forward 2Yx10Y swaption volatility, synthetically constructed via suitably weighted 1Yx10Y and 3Yx10Y swaptions
P/L on this trade is currently -3abp. For original trade write up, see Fixed Income Markets Weekly 2024-04-12. - Continue to overweight 6Mx5Y and 6Mx30Y swaption volatility (vega weights of 0.32 and 0.76, respectively) versus selling 6Mx10Y swaption volatility
P/L on this trade is currently -3.9abp. For original trade write up, see Fixed Income Markets Weekly 2024-04-05. - Maintain 7s/10s swap spread curve steepeners paired with 25% risk in a 7s/10s UST curve steepener
P/L on this trade is currently -0.2bp. For original trade write up, see Fixed Income Markets Weekly 2024-03-22. - Maintain conditional exposure to a steeper 10s/20s swap yield curve in a selloff using 9M expiry payer swaptions
P/L on this trade is currently 1.1bp. For original trade write up, see Fixed Income Markets Weekly 2024-03-15. - Stay long 1Yx30Y volatility versus 1Y forward 1Yx30Y volatility, synthetically constructed via suitably weighted 2Yx30Y and 1Yx30Y swaptions
P/L on this trade is currently -2.8abp. For original trade write up, see Fixed Income Markets Weekly 2024-03-15. - Maintain 5s/10s off-the-run swap spread curve steepeners (100:60 weighted)
P/L on this trade is currently -1.8bp. For original trade write up, see Fixed Income Markets Weekly 2024-03-08. - Maintain shorts in 3Yx30Y straddles with less frequent delta hedging
P/L on this trade is currently -4.5abp. For original trade write up, see Fixed Income Markets Weekly 2024-03-08.
- Maintain Z5/U6 SOFR futures flatteners paired with H6/Z6 SOFR futures steepeners (0.85:1 risk weighted)
P/L on this trade is currently 0bp. For original trade write up, see Fixed Income Markets Weekly 2024-03-01.
Closed trades over the past 12 months
P/L reported in bp of yield for swap spread, yield curve and misc. trades, and in annualized bp of volatility for option trades, unless otherwise specified
Note: trades reflect Wednesday COB levels
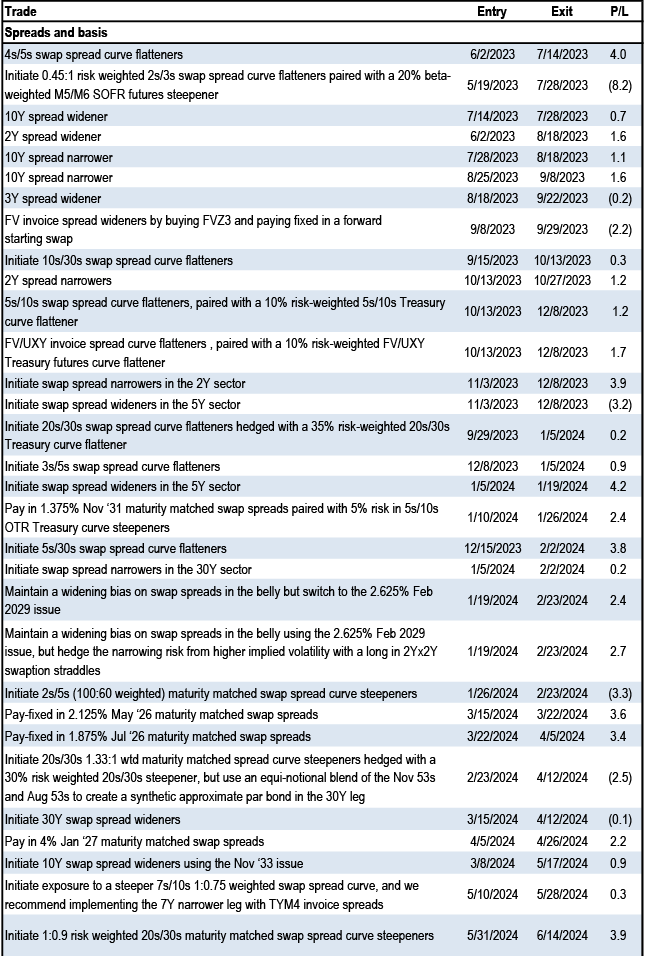
| Duration and curve | Entry | Exit | P/L |
| Initiate 6M forward 10s/30s flatteners, paired with 25% long in 6Mx2Y | 05/12/23 | 07/07/23 | 1.5 |
| Position for a cheaper 47:55 weighted 7s/10s/20s swap butterfly in a selloff | 05/19/23 | 07/07/23 | 2.6 |
| Initiate conditional 10s/30s flattener in a selloff constructed with 3M expiry payer swaptions, financed by selling 17% of the forward DV01 risk in 3Mx3Y payer swaptions to make the package premium neutral | 06/02/23 | 07/07/23 | 5.7 |
| Conditional richening of the belly of a 1s/5s/20s swap butterfly in a rally using 6M expiry receiver swaptions | 01/20/23 | 07/14/23 | 0.1 |
| Initiate 2Y forward 5s/30s steepeners hedged with a 15% weighted long in U3 3M SOFR futures and a 35% weighted short in U43M SOFRfutures | 07/07/23 | 07/14/23 | 12.2 |
| Initiate 10s/15s swap curve flatteners hedged with a 15% risk-weighted long in the 7Y sector | 06/09/23 | 08/04/23 | (6.8) |
| Initiate UXY / US treasury futures curve flatteners hedged with a 15% risk-weighted long in the TY sector | 06/09/23 | 08/04/23 | (28.0) |
| 2Yx1Y / 3Mx15Y flattener, plus 58% long in 2Yx1Y and 8% short in 6Mx6M | 07/14/23 | 08/18/23 | (26.3) |
| Initiate 6M fwd 1s/20s flatteners paired with 20% risk weighted longs in 3Mx6Mand 60% risk-weighted longs in Reds | 07/28/23 | 08/18/23 | (35.7) |
| Initiate conditional exposure to a flatter 1s/10s swap yield curve in a selloff using 3M expiry receiver swaptions | 07/28/23 | 08/18/23 | (6.2) |
| Initiate 3M forward 2s/7s swap curve flatteners hedged with a 35% risk weighted long in the 1Yx1Y sector | 08/04/23 | 08/18/23 | (13.9) |
| Initiate 3M forward 3s/5s flattener hedged with a 15% risk weighted long in the 5th 3M SOFR futures contract | 08/04/23 | 08/18/23 | (7.7) |
| Initiate 2Y forward 1s/10s swap curve steepeners paired with equal risk in a 3M forward 3s/15s swap curve flattener | 08/18/23 | 08/25/23 | 4.7 |
| Sell the belly of the U4/H5/U5 3M SOFR futures butterfly (-0.43:1:-0.64 risk weighted) | 09/08/23 | 09/22/23 | 2.3 |
| Initiate 3M forward 2s/10s swap curve steepeners paired with 110% of the risk in Reds/Greens flatteners | 09/15/23 | 09/22/23 | 4.9 |
| Initiate 3Y forward 2s/10s swap curve steepeners, paired with 1Y forward 1s/5s swap curve flatteners (33% risk weighted) | 09/22/23 | 09/29/23 | 5.0 |
| Initiate 2Y forward 2s/30s swap curve steepeners paired with equal risk in a 3M forward 2s/30s swap curve flattener | 08/25/23 | 10/20/23 | (32.1) |
| Initiate 3Y forward 3s/30s swap curve steepeners paired with 63% risk in a 3M forward 5s/30s swap curve flattener | 09/08/23 | 10/20/23 | (18.3) |
| Initiate M4/Z4 SOFR futures curve steepeners paired with 55% of the risk in H4/Z5 3M SOFR futures curve flatteners | 09/22/23 | 10/20/23 | (9.9) |
| Initiate conditional exposure to a flatter 2s/10s swap yield curve in a rally using 6M expiry receiver swaptions | 09/29/23 | 11/03/23 | (9.2) |
| Initiate 3M fwd 5s/10s swap curve flatteners paired with 2Y fwd 5s/10s swap curve steepeners (50:100 risk weighted) | 10/27/23 | 11/03/23 | 4.6 |
| Initiate conditional exposure to a flatter 5s/10s swap yield curve in a rally using 3M expiry receiver swaptions | 10/27/23 | 11/03/23 | 0.8 |
| Initiate 2Y fwd 2s/5s curve flatteners paired with 25% risk in a 1st/5th SOFR futures curve flattener | 11/03/23 | 11/22/23 | 5.8 |
| Initiate 6M fwd 5s/15s curve flatteners paired with equal risk in 3Y fwd 2s/15s steepeners | 11/03/23 | 11/22/23 | 4.6 |
| Buy the belly of a 40:65 weighted Z4/Z5/Z6 3M SOFR futures butterfly | 11/03/23 | 11/22/23 | 5.6 |
| Initiate 9M fwd 1s/10s flatteners paired with a 50% risk weighted long in March 2025 3M SOFR futures | 11/09/23 | 11/22/23 | 15.8 |
| Initiate 3Mx1Y / Greens weighted flattener (1:0.8 weighted) paired with 80% risk in a 3M forward 2s/10s swap curve steepener | 01/05/24 | 01/26/24 | 2.9 |
| Initiate U5/M6 SOFR futures curve flatteners paired with 110% of the risk in Z5/U6 3M SOFR futures curve steepeners | 12/15/23 | 02/02/24 | 1.6 |
| Buy the belly of a 35:65 weighted H5/H6/Z6 3M SOFR futures butterfly | 12/15/23 | 02/02/24 | 1.9 |
| Initiate 1Yx2Y / 3Mx30Y swap yield curve steepeners paired with 65% risk in a Reds / 10Yx5Y swap yield curve flattener | 01/19/24 | 02/02/24 | 1.1 |
| Receive fixed in the belly of a 6M forward 2s/7s/30s swap butterfly (40:69 weighted) | 01/19/24 | 02/02/24 | 0.1 |
| Initiate conditional exposure to a composite flattener in a selloff by buying 3Mx2Y payer swaptions (100% risk) versus selling 3Mx5Y and 3Mx30Y payer swaptions (24% and 100% risk respectively) | 02/02/24 | 02/23/24 | 14.3 |
| Buy H5 and Z5 3M SOFR futures contracts (30:100 weighted) versus selling U4 3M SOFR futures contracts (100% risk weight) and pay-fixed in 6M forward 10Y swaps (40% risk weight) | 02/09/24 | 02/23/24 | 5.8 |
| Initiate exposure to rising term premium by selling the belly of a 35/65 weighted 3M forward 5s/10s/15s butterfly | 12/08/23 | 03/08/24 | (1.5) |
| Initiate SFRM5 / Blues flatteners paired with a 110% risk weighted 3M forward 2s/10s steepener | 03/01/24 | 03/22/24 | 3.3 |
| Initiate 3M forward 3s/20s swap curve steepeners, paired with 85% of the risk in a SFRM5 / 3Mx10Y curve flattener | 03/08/24 | 04/05/24 | 3.2 |
| Initiate 2Y forward 2s/5s swap curve steepeners paired with 40% risk in 3M forward 2s/5s flatteners | 01/26/24 | 04/12/24 | (11.4) |
| Initiate conditional exposure to a flatter 2s/5s swap yield curve in a selloff using 3M expiry payer swaptions | 03/22/24 | 04/12/24 | 5.2 |
| Initiate conditional exposure to a flatter 18M/5Y swap yield curve in a selloff using 6M expiry payer swaptions | 04/05/24 | 04/12/24 | 3.1 |
| Initiate conditional exposure to a flatter 1s/5s swap yield curve in a selloff using 3M expiry payer swaptions | 02/23/24 | 04/26/24 | (9.4) |
| Initiate 1Y forward 2s/5s swap curve flatteners, paired with weighted longs in H5 and H6 3M SOFR futures (20% and 10% respectively) | 03/22/24 | 04/26/24 | (9.5) |
| Initiate SFRM5 / 3Mx5Y flattener, hedged with a 20% risk weighted long in Reds | 04/05/24 | 04/26/24 | (5.0) |
| Initiate 5th/9th SOFR futures curve flatteners hedged with a risk weighted amount 2Y forward 2s/5s swap curve steepeners | 04/12/24 | 05/03/24 | 3.0 |
| Receive in the belly of a 0.625/1.0/0.375 weighted 3M forward 2s/7s/20s swap butterfly, with an additional 15% risk weighted long in June 2024 3M SOFR futures | 02/23/24 | 05/17/24 | 2.7 |
| Initiate 3M forward 2s/3s swap curve flatteners hedged with a 14% risk weighted long in the M4 3M SOFR futures | 02/23/24 | 05/17/24 | 0.4 |
| Initiate 3M forward 5s/15s swap curve flatteners paired with 70% risk in a 2Y forward 2s/20s swap curve steepener | 03/22/24 | 05/17/24 | 2.8 |
| Buy the belly of a 2s/5s/15s weighted swap butterfly (50:50 weighted) | 04/12/24 | 05/17/24 | 2.4 |
| Initiate 3M forward 1s/3s swap curve flatteners, hedged with a 65% risk weighted long in the 3Mx3M sector and a 25% risk weighted short in the 15Mx3M sector | 05/03/24 | 05/17/24 | 2.1 |
| Buy the belly of a U5/M6/H7 SOFR Futures butterfly (-0.37:1:-0.63 risk weighted) | 03/01/24 | 05/31/24 | (0.7) |
| Initiate a Greens/Blues steepener paired with 55% of the risk in a SFRM5 / 3Mx5Y swap curve flattener | 03/15/24 | 05/31/24 | 2.2 |
| Buy the belly of a Z5/U6/H7 3M SOFR futures butterfly (-0.33:1.0:-0.67 risk weighted) | 04/19/24 | 05/31/24 | 1.8 |
| Initiate 12Mx3M / 3Mx10Y flatteners, paired with 33% risk in a 3Mx2Y receive fixed swap | 05/17/24 | 06/06/24 | 5.7 |
| Initiate 3M fwd 3s/15s flatteners paired with 85% risk in 2Y fwd 3s/30s steepeners | 05/17/24 | 06/06/24 | 4.5 |
| Initiate 3Mx1Y / 2Yx1Y forward swap curve flatteners as a bullish proxy | 05/31/24 | 06/06/24 | 11.5 |
| Initiate 3Mx1Y / 2Yx1Y swap curve flatteners paired with 45% risk-weighted pay-fixed positions in 3Mx5Y swaps | 05/31/24 | 06/06/24 | 0.0 |
| Initiate conditional exposure to a flatter 1s/2s swap yield curve in a rally using 1Y expiry receiver swaptions | 04/05/24 | 06/14/24 | 4.0 |
| Options | Entry | Exit | P/L |
| Buy 6Mx5Y swaption straddles, versus weighted longs in S&P futures | 06/09/23 | 07/07/23 | 12.8 |
| Sell 1Yx10Y 50bp OTM receiver swaptions versus buying 50bp OTM payer swaptions | 04/21/23 | 07/07/23 | 1.1 |
| Buy 6Mx30Y swaption straddles versus selling a vega-neutral amount of 1Yx30Y swaption straddles | 06/02/23 | 08/04/23 | (2.7) |
| Overweight 6Mx10Y swaption straddles versus vega-neutral amount of 1Yx10Y swaption straddles | 07/07/23 | 08/04/23 | 1.0 |
| Sell 5Yx10Y straddles vs 9Mx30Y straddles | 07/14/23 | 08/04/23 | 5.9 |
| Overweight volatility in 5Y tails versus 15Y tails using 9M expiry swaptions | 07/28/23 | 08/18/23 | (7.9) |
| Sell volatility on 5-year tails paired with a pay-fixed swap overlay | 08/18/23 | 08/25/23 | 6.2 |
| Sell 6Mx30Y swaption straddles versus buying 6Mx10Y and selling 6Mx2Y straddles on a suitably weighted and delta hedged basis | 08/04/23 | 09/08/23 | 0.0 |
| Sell 9M expiry single-look YCSO straddles on the 5s/30s curve, versus buying 35% vega-weighted amount of 9Mx2Y swaption straddles | 06/02/23 | 09/08/23 | 2.3 |
| Sell volatility on 30-year tails paired with a pay-fixed swap overlay | 08/25/23 | 09/15/23 | 8.6 |
| Sell 2Yx5Y swaption straddles versus buying 10Yx10Y swaption straddles | 08/25/23 | 09/15/23 | 5.3 |
| Buy 10Yx10Y straddles | 03/17/23 | 09/22/23 | 1.9 |
| Sell 2Yx2Y swaption straddles versus buying a vega-neutral amount of 1Yx10Y swaption straddles | 08/25/23 | 09/29/23 | 3.4 |
| Buy 1Yx10Y straddles versus selling 140% of the vega risk in 1Yx5Y straddles and buying 50% of the risk in 1Yx2Y swaption straddles | 08/25/23 | 10/13/23 | 3.2 |
| Sell 2Yx30Y swaption straddles versus buying a vega-neutral amount of 10Yx10Y swaption straddles | 09/08/23 | 10/13/23 | (4.5) |
| Sell 2Yx2Y swaption straddles versus buying a vega-neutral amount of 7Yx10Y swaption straddles | 09/15/23 | 10/13/23 | 3.0 |
| Sell 6Mx30Y swaption straddles with a pay fixed swap overlay | 09/22/23 | 10/13/23 | (11.6) |
| Sell 1Yx30Y swaptions straddles versus buying a vega-neutral amount of 5Yx30Y swaption straddles, paired with a 1Yx30Y pay-fix swap | 09/22/23 | 10/13/23 | (1.5) |
| Overweight 6Mx7Y swaption volatility versus a vega-neutral amount of 1Yx10Y swaption volatility | 10/13/23 | 11/03/23 | 3.5 |
| Buy 1Yx10Y swaption straddles paired with a receive-fixed swap overlay to hedge against a decrease in implieds due to lower yields | 10/27/23 | 11/03/23 | (1.1) |
| Initiate short gamma exposure in the 6Mx30Y sector | 11/03/23 | 12/08/23 | 7.9 |
| Sell 6Mx30Y swaption straddles versus buying a vega-neutral amount of 1Yx30Y swaption straddles | 11/03/23 | 12/08/23 | 0.4 |
| Initiate long gamma exposure in the 1Yx10Y sector | 12/08/23 | 02/23/24 | (2.1) |
| Initiate long exposure to 2Yx2Y volatility with a suitably weighted short in July Fed funds futures to hedge the downside risk from a fall in Fed-easing expectations | 01/05/24 | 02/23/24 | 2.6 |
| Overweight 2Yx2Y swaption straddles versus a vega-neutral amount of 5Yx5Y swaption straddles | 01/19/24 | 02/23/24 | 3.2 |
| Overweight 6Mx10Y swaption straddles versus selling 110% of the vega risk in 1Yx10Y swaption straddles | 01/26/24 | 02/23/24 | 1.3 |
| Buy 6Mx10Y straddles | 03/01/24 | 03/08/24 | (6.6) |
| Initiate longs in 6Mx10Y swaption implied volatility, delta hedged daily | 03/15/24 | 03/22/24 | (5.1) |
| Overweight 6Mx2Y swaption straddles versus a theta-neutral amount of 6Mx5Y swaption straddles | 01/19/24 | 04/12/24 | (8.8) |
| Sell 2Yx30Y swaption volatility versus buying 50% of the vega risk in 2Yx2Y swaption volatility , and pay fixed in 2Yx 10Y swaps to neutralize the bullish bias in this trade | 02/23/24 | 04/12/24 | 1.5 |
| Buy 6Mx10Y volatility versus 6M forward 6Mx10Y volatility, synthetically constructed via suitably weighted 1Yx10Y and 6Mx10Y swaptions | 04/05/24 | 04/12/24 | 3.2 |
| Buy 2Yx5Y swaption straddles on a delta hedged basis | 04/12/24 | 04/19/24 | 1.0 |
| Sell 6Mx10Y straddles on a delta hedged basis | 04/26/24 | 05/03/24 | 3.1 |
| Sell 6Mx15Y straddles on a delta hedged basis | 05/03/24 | 05/10/24 | (1.6) |
| Sell 1Yx2Y volatility versus buying a theta neutral amount of 1Yx5Y volatility | 05/17/24 | 06/06/24 | 0.6 |
| Initiate Fronts/Green curve flatteners, paired with delta hedged long volatility positions in the 1Yx10Y swaption sector | 05/31/24 | 06/06/24 | 5.6 |
| Initiate exposure to long curve volatility by buying 6Mx2Y and 6Mx10Y straddles (41:60 vega weighted) versus selling 6Mx5Y straddles | 12/08/23 | 06/07/24 | 1.1 |
| Buy 2Yx5Y swaption straddles on a delta hedged basis, versus 6Mx1Y / 18Mx1Y flatteners | 06/07/24 | 06/14/24 | 3.6 |
| Others | Entry | Exit | P/L |
| TU calendar spread narrowers | 8/18/2023 | 8/25/2023 | 0.5 |
| WN calendar spread wideners | 8/18/2023 | 8/25/2023 | (3.5) |
| Position for a widening in WN calendar spreads | 11/9/2023 | 11/22/2023 | 1.8 |
| Buy the USZ3/USH4 weighted calendar spread hedged with USZ3/WNZ3 Treasury futures curve flatteners | 11/9/2023 | 11/22/2023 | 0.2 |
| Position for a narrowing in FV calendar spreads | 11/9/2023 | 11/22/2023 | 0.3 |
| WN calendar spreads narrowers | 2/13/2024 | 2/23/2024 | (0.7) |
| UXY calendar spreads narrowers | 2/13/2024 | 2/23/2024 | (0.8) |
| TU calendar spreads narrowers | 2/13/2024 | 2/23/2024 | (0.3) |
| Sell the 4.75% Nov 2053 WNM4 basis, versus buying payer swaptions | 3/8/2024 | 4/12/2024 | 1.0 |
| Initiate calendar spread wideners in US Futures | 5/17/2024 | 5/28/2024 | (3.0) |
| Initiate calendar spread narrowers in UXY Futures | 5/17/2024 | 5/28/2024 | 0.4 |
| Initiate calendar spread narrowers in FV futures | 5/17/2024 | 5/28/2024 | 1.0 |
| Total number of trades | 137 | ||
| Number of winners | 97 | ||
| Hit rate | 71% |
| Annual Outlooks |
|
| 21-Nov-23 | Interest Rate Derivatives 2024 Outlook: Goodbye Hard Times, Hello Great Expectations? |
| 23-Jun-23 | Interest Rate Derivatives: 2023 Mid-Year Outlook |
| Recent Special Topic Pieces |
|
| 15-May-24 | US bond futures rollover outlook: June 2024 / September 2024 |
| 29-Apr-24 | Term Funding Premium and the Term Structure of SOFR Swap Spreads |
| 13-Feb-24 | US bond futures rollover outlook: March 2024 / June 2024 |
| 9-Nov-23 | Death cab for QT |
| 8-Nov-23 | US bond futures rollover outlook: December 2023 / March 2024 |
| 10-Aug-23 | US bond futures rollover outlook: September 2023 / December 2023 |
Short-Term Fixed Income
- In 2H24, funding conditions will continue to be relatively benign, though we acknowledge there are risks that liquidity investors will have to grapple with in the coming months, such as continuation of QT, Treasury’s funding needs, and MMF reform
- Still, liquidity should remain abundant, particularly as a moderate path of Fed easing is expected, thus continuing to attract cash into MMFs and the front-end. This should limit any impact on EFFR/SOFR, T-bills/OIS, and CP/OIS spreads
- MMF reform is looming, though we continue to believe this should not have any outsized impact on credit spreads in the money markets
- Treasury repo clearing remains a work in progress, though concerns about readiness are emerging. MMFs are further along, while hedge funds face particular challenges given uncertainty as to how the structure of the repo markets will evolve to comply with clearing
- Total money market supply (ex-Fed) should increase by $546bn in 2H24, driven largely by Treasury bills and dealer repo. We see credit supply increasing by $190bn, mainly from credit bonds rolling into the money markets and slightly higher CP/CD net issuance
- Near-term catalysts: May JOLTS (7/2), June FOMC minutes (7/3), June employment (7/5), June CPI (7/11)
Smooth sailing with caution
A key call in our money markets outlook this year is that MMFs will remain an attractive asset class, with overall AUMs staying flat year-over-year. In the event, flows into MMFs have proven even stronger than anticipated, up $182bn YTD to $6.35tn, thanks to stickier inflation and stronger-than-expected economic growth that have led to a significant delay in Fed easing expectations ( Figure 60).
These inflows underscore the abundance of liquidity still in the financial system, most of which seemed to be sitting in the front-end. To that end, concerns that the banking system would be rapidly approaching reserve scarcity in 1H24 ultimately proved unfounded. EFFR was steadfastly stable at 5.33%, while SOFR traded in a 1bp range around 5.31%, outside of quarter-ends and tax-related payment dates. In fact, even when bank reserve balances dropped by over $300bn to $3.27tn in the second half of April, SOFR barely made a blip. At the same time, bank CP/CD spreads narrowed to nearly a post-QT low at the start of the year, only cheapening slightly as liquidity investors turned more defensive heading into March quarter-end and April tax day, before spreads began to tighten again. Furthermore, drainage at the Fed’s ON RRP slowed materially compared to last year, with balances rangebound between $300bn and $500bn, in response to a more moderate pace of net T-bill issuance so far this year ( Figure 61).
Figure 60: Flows into MMFs have proven even stronger than anticipated, up $182bn YTD to $6.35tn, thanks to stickier inflation and stronger-than-expected economic growth that have led to a significant delay in Fed easing expectations
Cumulative YTD change in taxable MMF AUMs ($bn)
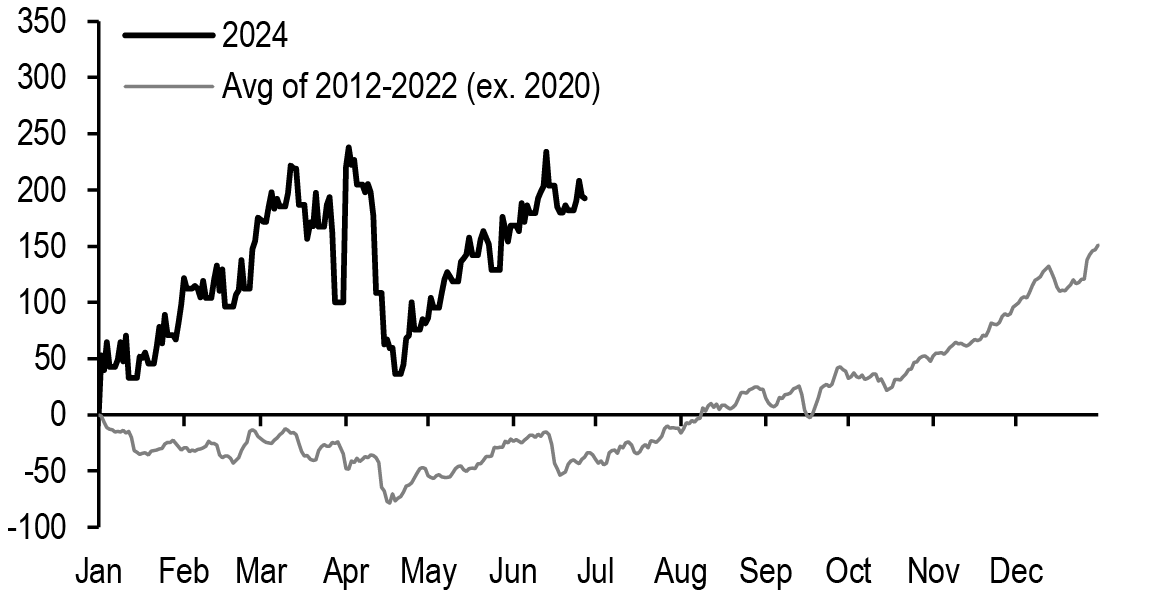
Source: Crane Data, iMoneyNet, J.P. Morgan
Figure 61: Drainage at the Fed’s ON RRP slowed materially compared to last year, in response to a more moderate pace of net T-bill issuance this year
T-bill outstandings (lhs, $bn) vs. Fed ON RRP balances (inverted rhs, $bn)
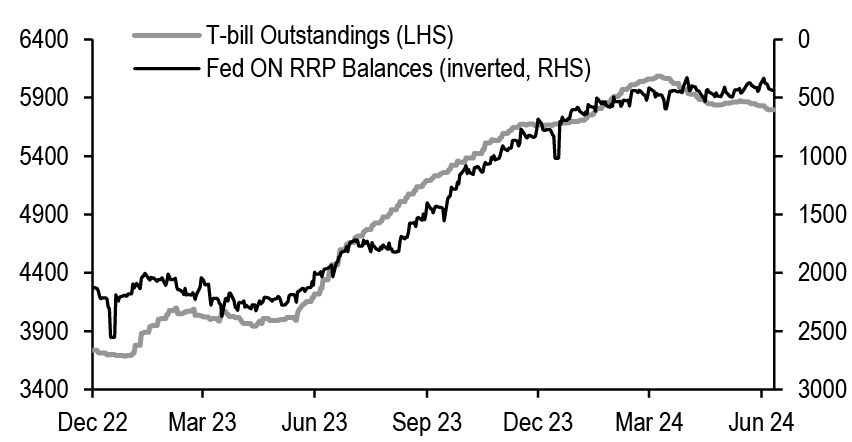
Source: J.P. Morgan
In 2H24, we believe funding conditions will continue to be relatively benign, though acknowledge there are a variety of risks that liquidity investors will have to grapple with in the coming months. Even with QT taper, the Fed’s balance sheet is still shrinking, albeit at a slower pace, which means reserves are still coming closer to approaching scarcity. As of the time of writing, reserve balances registered $3.4tn. Market expectations have largely coalesced around $3.0-3.1tn as the lowest comfortable level of reserves (LCLoR), and while our Fed balance sheet expectations call for reserve balances to remain comfortably above $3tn during 2H24, signs of reserve scarcity could start to emerge towards year-end as we come closer to approaching LCLoR ( Figure 62). The good news is that we also project ON RRP balances to remain near $400bn for at least a few months and over/near $300bn for the remainder of the year, which will help to offset any funding pressures arising from balance sheet normalization.
Treasury’s funding needs also remain a concern given expectations of wider deficits over the coming years. In light of CBO’s latest 10-year projections, our Treasury strategists now expect that any additional financing needs over the balance of 2024 will be met primarily with T-bills. Additionally, there is a risk that Treasury could begin another round of coupon auction size increases sometime in mid-2025, slightly earlier than anticipated (see CBO’s 10-year budget projections: less than meets the eye?, J. Barry, 6/18/24). Upcoming US elections could further widen the deficit if the 2017 Tax Cut and Jobs Act were to be extended in some form (see US: Economic policy implications of the election, M. Feroli, 6/28/24).
Against this backdrop, with Treasury debt outstanding and primary dealer inventories already at record highs, we have already seen markets taking a bit more time to digest Treasury supply, particularly when the supply settles on statement dates. That said, given the abundance of liquidity still in the front-end (indeed, MMFs’ AUMs, dealer repo, and T-bill balances have grown by $1.3tn, $1.0tn, and $1.45tn respectively since YE22, Figure 63) and the potential growth in demand for Treasuries from other structural buyers, this should help alleviate any funding pressures over the near-to-medium term (see Yes, T-bill demand should remain robust, T. Ho, 5/30/24).
Figure 62: Our Fed balance sheet expectations for reserve balances to remain comfortably above $3tn during 2H24
Current* and projected total Fed balance sheet assets, RRP, TGA, Reserves, and Commercial bank deposits** through 2024 ($bn)
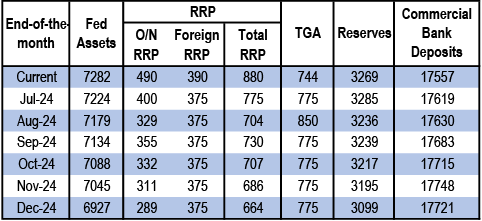
Source: J.P. Morgan., FRED, Federal Reserve H.4.1, Federal Reserve H.8
* Current as of 6/27/2024 Fed H.4. release
** Deposits as of 6/21/2024 Fed H.8. release
Figure 63: MMFs’ AUMs, dealer repo, and T-bill balances have grown by $1.3tn, $1tn, and $1.45tn respectively since YE22
MMFs’ holdings of dealer repo and T-bills (lhs, $bn) vs. MMFs’ AUMs (rhs, $bn)
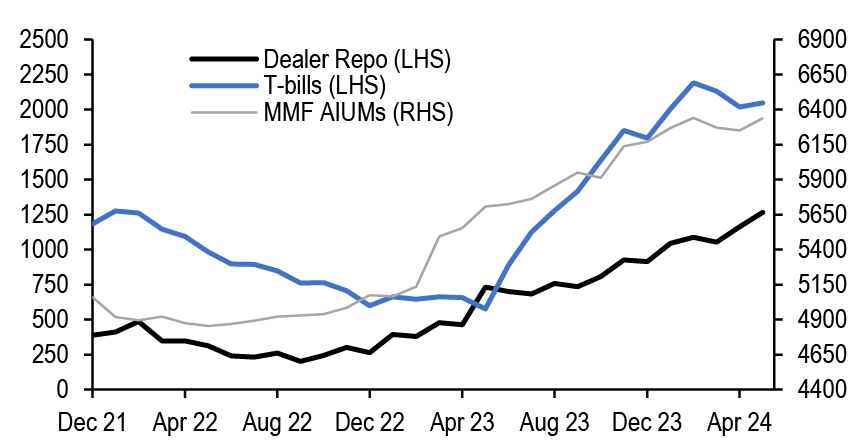
Source: Crane Data, J.P. Morgan
With respect to the credit side of the money markets, MMF reform is top of mind, though as we discuss in more detail below, the impact on credit spreads should be minimal, unlike what we saw in 2016. What happens to credit spreads in July will be telling to the extent remaining institutional prime funds (i.e., those that have not announced conversions or liquidations) turn even more defensive to shore up liquidity heading into October. Even if spreads do cheapen however, we suspect other liquidity buyers will jump in to take advantage of the spread backup, thus limiting its widening.
Net, despite some emerging risks in 2H, we see liquidity remaining abundant in the front-end. Based on SOFR future options, market expectations have coalesced around a more moderate path of easing, to the tune of somewhere between zero and three cuts by YE24 (our economists are calling for one 25bp cut in November), which should continue to attract cash into MMFs and the front-end more broadly, all else equal. Thus, this should limit any impact on EFFR/SOFR, T-bills/OIS, and CP/OIS spreads over the coming months.
Regulation: what’s clear, and what’s unclear(ed)
Two regulations loom large among liquidity participants in 2H. First, as part of MMF reform, institutional prime MMFs will have to implement mandatory liquidity fees come this October (see A closer look at MMF reforms: Are liquidity fees swing pricing in disguise?, T. Ho, 8/7/23). To date, and largely as expected, two large internal funds and several smaller fund providers have announced their decision to exit the institutional prime market, with those funds totaling around $240bn in AUMs and comprising ~38% of the institutional prime market or ~17% of the total prime space ( Figure 64). Some are liquidating the institutional prime funds entirely, others are converting the funds to government funds, and one provider is converting to a retail prime fund.
As we have noted previously, we do not think upcoming reforms will have any outsized impact on credit spreads in the money markets (see MMF reform spotlight: Not the same as 2016, T. Ho, 5/3/24). Indeed, among the set of funds that announced either liquidations or conversions, exposure to credit was only about $7bn as of May month-end ( Figure 65). Meanwhile, of the remaining ~$390bn of institutional prime funds, CP/CD exposure totaled ~$200bn, which we estimate comprises only about 10% of the CP/CD market. While a shift towards a more rates-concentrated portfolio to shore up liquidity in the run up to October across the remaining funds could prompt spreads to widen, we note that the buyer base for money market credit is much more diversified now, with MMFs comprising less than 25% of the CP market now versus over 40% at YE15. Along with the vast and growing retail prime MMFs (up $114bn to $775bn in AUMs YTD), other liquidity investors such as LGIPs, regional asset managers, and corporates could easily step in to fill the gap in credit demand resulting from reforms (see One step at a time, T. Ho, 6/14/24). Not to mention, with spread levels remaining tight, any backup will likely be quickly absorbed, thus limiting any sort of spread widening in the near-term.
Figure 64: Two large internal funds and several smaller fund providers have announced their decision to exit the institutional prime market, totaling around $240bn in AUMs
List institutional prime MMFs that will covert to a government fund or liquidate ($bn)

Source: Bloomberg Finance L.P., J.P. Morgan
Note: AUMs are as of May-end
Figure 65: The 40% of institutional prime MMFs that are converting or liquidating held only ~$7bn in credit as of May month-end
Asset allocation breakdown of retail prime MMFs, institutional prime MMFs that are converting or liquidating, and remaining institutional prime MMFs, as of 5/31/24 ($bn)
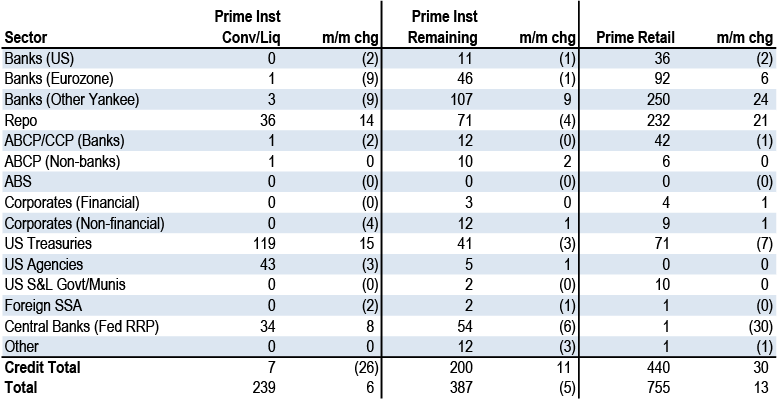
Source: Crane Data, J.P. Morgan
Meanwhile, the implementation date of the SEC’s Treasury clearing mandate for repos (finalized in December 2023) sits a bit farther out on June 30, 2026, but concerns about readiness are already surfacing. Recall this mandate will require covered clearing agencies to have direct participants submit all eligible repo and cash trades for central clearing. With only about 28% of the Treasury repo market currently cleared, this mandate is a big deal, as most of the remaining ~$3.4tn would need to be migrated over to central clearing ( Figure 66).
In many respects, market participants are still trying to figure out the available models through which they will get access to central clearing in time to comply. MMFs are further along given that many already have access to sponsored repo, though there are some key details (e.g., counterparty risk exposure) that still need to be hammered out. Meanwhile, hedge funds face particular challenges in their adoption given the uncertainty as to whether they can engage in portfolio margining or whether they can engage in repo in a “done-away” model, both of which are available in the derivatives market but not in the repo market. If not, this could meaningfully raise the costs of transacting in repo. Considering all that still needs to be addressed operationally in the central clearing market, particularly with regards to access and overall plumbing, two years could be a tight timeline to address all the outstanding issues and uncertainties in the new regulatory environment. In fact, over the last month, both ISDA Chief Executive Scott O’Malia and SIFMA managing director William Thum stressed the brevity of the 2-year timeline. All in all, as the market continues to figure out different access models and the economics of engaging in those various access models, depending on how this transition unfolds, SOFR could potentially be biased upwards down the line (see Get in the clear: FAQs on Treasury repo clearing, T. Ho, 4/25/24).
Figure 66: Based on Fed data, only about 28% of the Treasury repo market is currently cleared
Gross uncleared and cleared Treasury (incl. TIPS) repo volumes ($bn)
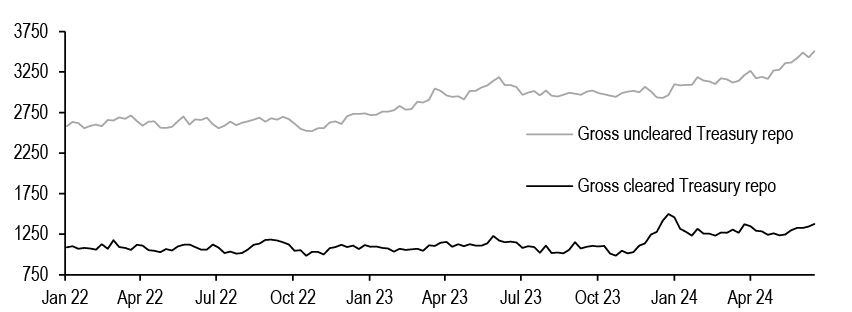
Source: Federal Reserve Bank of New York, J.P. Morgan
Money market supply outlook
Total money market supply (ex-Fed) increased by approximately $557bn in 1H24, driven primarily by dealer repo and T-bills ( Figure 67). Bonds less than 1y also witnessed a meaningful increase of $123bn as corporate bonds rolled down the curve, and credit in the form of CP and CDs increased by $62bn YTD. Overall agency supply in the money markets was flat, with increases in discount notes and FRNs offset by decreases in coupon supply thus far this year.
In 2H24, we expect money market Treasuries (ex-SOMA) supply to increase by $385bn, mostly coming from T-bills ($274bn). Currently, the T-bill share of total outstanding Treasury debt sits above the top end of the 15-20% range, and could remain above 20% until late 2026. With Treasury likely keeping nominal coupon auction sizes unchanged over the next several quarters, our Treasury strategists expect that additional financing needs over the balance of the year will be met primarily with T-bill issuance (see Treasuries).
Figure 67: Total money market supply (ex-Fed) increased by approximately $557bn in 1H24, driven primarily by dealer repo and T-bills
Total money market supply ($bn)
| Dec 23 | Jun 24 | Dec 24* | 1H Chg | 2H Chg* | YoY Chg* | |
| Dealer Repo** | 3151 | 3478 | 3579 | 327 | 101 | 428 |
| Treasuries (ex-SOMA) | 9054 | 9128 | 9513 | 74 | 385 | 459 |
| Treasury Bills (ex-SOMA) | 5454 | 5587 | 5861 | 133 | 274 | 407 |
| Treasury Coupons (ex-SOMA) | 3029 | 2971 | 3022 | (58) | 51 | (7) |
| Treasury FRNs (ex-SOMA) | 571 | 570 | 630 | (1) | 60 | 59 |
| Agencies | 1035 | 1039 | 910 | 4 | (129) | (125) |
| Agency Discos | 313 | 344 | 288 | 31 | (56) | (25) |
| Agency Coupons | 425 | 277 | 325 | (148) | 48 | (100) |
| Agency FRNs | 297 | 419 | 297 | 122 | (122) | 0 |
| Financials | 1313 | 1312 | 1349 | (1) | 37 | 36 |
| Yankee CDs | 727 | 741 | 748 | 14 | 7 | 21 |
| Foreign Financial CP | 519 | 491 | 504 | (28) | 13 | (15) |
| Domestic Financial CP | 68 | 81 | 98 | 13 | 17 | 30 |
| ABCP | 337 | 335 | 345 | (2) | 10 | 8 |
| Non-Financial CP** | 280 | 311 | 320 | 31 | 9 | 40 |
| Bonds <1y | 831 | 953 | 1088 | 123 | 134 | 257 |
| Total (ex-Fed) | 16000 | 16558 | 17104 | 557 | 546 | 1103 |
| Total (ex-Fed, ex-Treasuries) | 6947 | 7430 | 7591 | 483 | 161 | 644 |
Source: J.P. Morgan, Bloomberg Finance L.P., Federal Reserve Bank of New York
* J.P. Morgan forecasts
** 4-week rolling average
Note: June 2024 figures are as of mid-month or later
Furthermore, we expect dealer repo balances to increase by $101bn in 2H24 as net supply of Treasuries continues to move higher throughout the remainder of this year, at a time when primary dealer Treasury inventories have grown meaningfully. Indeed, in 1H24, primary dealers’ exposure to Treasuries surpassed their highest levels in terms of total positions ( Figure 68).
With respect to Agencies, net issuance (discos, coupons, and FRNs) in 2H24 should decline by around $130bn. While total year-end supply is unchanged from the previous forecast, the composition of supply will look different in the second half. Notably, FRNs should decrease by ~$120bn and coupons should come up by ~$50bn given the hawkish evolution of monetary policy expectations and its consequences to front-end rates (see Agencies and $-SSAs).
In short-term credit, we forecast year-end total financial CP/CD outstandings to be $1349bn, a slight increase of $37bn in 2H24. Further reserves drainage will likely persist in the second half due to QT, albeit at a slower pace, which could increase bank funding needs. We forecast non-financial CP outstandings to be $320bn, same as our previous year-end target. YTD, net issuance is up by $31bn, mainly from Tier 1 issuers and concentrated in the Health Care sector (see A deep dive into non-financial CP, T. Ho, 6/5/24). We expect total outstandings to be close to unchanged from current levels in 2H24. For the ABCP market, our year-end target is $345bn, mostly flat from YE23 levels.
Figure 68: In 1H24, primary dealers’ exposure to Treasuries surpassed their highest levels in terms of total positions
Primary dealers’ net U.S. Treasury positions ($bn)
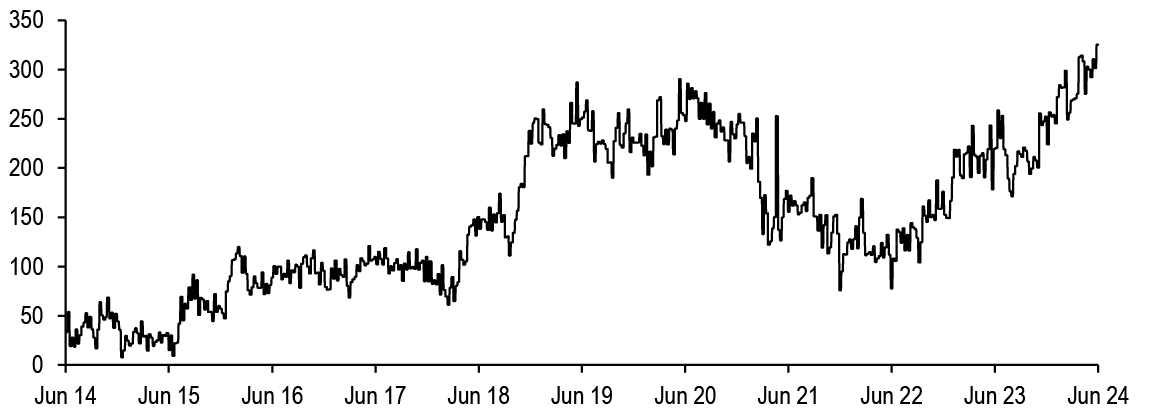
Source: Federal Reserve Bank of New York, J.P. Morgan
Excerpted from Short-Term Market Outlook and Strategy, Teresa Ho, June 28, 2024
US Agencies and $-SSAs
2024 Mid-Year Outlook
- The first half of 2024 has been relatively uneventful for US Agencies. Both DN spreads to T-bills and FRN DMs have remained within tight ranges and benchmark issuance has stayed very light
- $-SSA spreads remain are near the middle their recent ranges but remain slightly wide to their fundamental drivers. Tighter Bobl/UST spreads are supportive of narrower spreads in 2H24. We maintain our overweight stance on $-SSAs
- Net issuance from the GSEs is slightly up YTD, driven by the FHLBs. However, FHLB net issuance in the first five months of the year was less than half the increase in Fed funds volumes. This is consistent with negative net demand for advances
- We continue to expect negative Agency issuance in 2024, driven by the FHLBs. However, we make changes to our issuance forecasts at the product level: we now look for more floater and less callable supply, as a delayed and more gradual easing cycle impact demand dynamics
- We now look for $93bn of bellwether issuance across the six SSAs we cover. This implies issuance should moderate in the second half of the year
Market views
Figure 69: DN spreads to T-bills remain range-bound…
FHLB discount note/ T-bill spread; bp
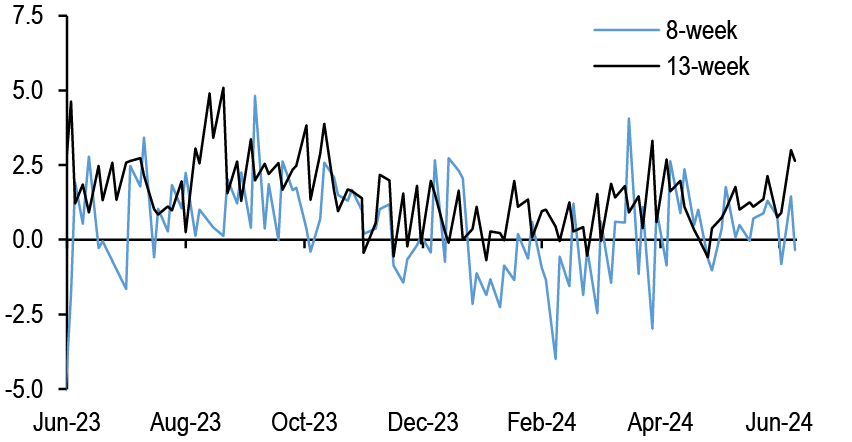
Source: J.P. Morgan, FHLB
Figure 70: ...and FRN spreads have also remained within tight ranges
Spreads to ON SOFR on newly-issued FHLB FRNs by maturity; bp
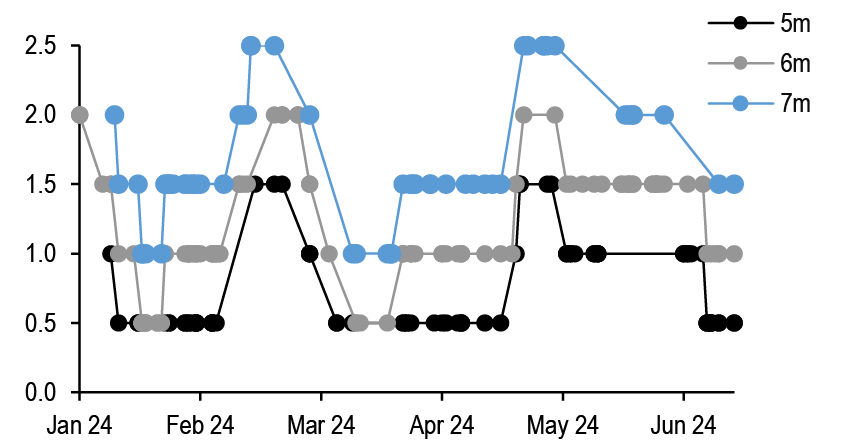
Source: FHLB
The first half of 2024 was decidedly less eventful for US Agency supply and spreads than the same period in 2023. Starting at the front end, DN spreads to T-bills have remained very range-bound despite a pickup in issuance; as we’ve argued this borrowing has been opportunistic given that T-bill issuance has been negative for most of the last 3 months (see Figure 69 and US Agencies and $-SSAs, 5/28/24). Turning to FRNs, a product that has attracted more demand in recent months, valuations have also remained relatively range-bound, with spreads on newly-issued 5-to 7-month FRNs trading between 0.5-2.5bp ( Figure 70). Lastly, benchmark bullet supply has remained very light, with only two FHLB issues YTD, both 3-year maturities, with $1bn in size.
Turning to $-denominated SSAs, spreads are near the middle of their recent ranges ( Figure 71). Further, spreads continue to appear slightly wide to their fundamental drivers. Looking ahead, while we now look for more range-bound Treasury yields and HG spreads, we continue to see tighter Bobl/UST spreads through year-end, which should support tighter $-SSA spreads as well, all else being equal. In aggregate, these factors suggest somewhat narrower $-SSA spreads over the second half of the year and therefore we hold our overweight stance ( Figure 72).
Figure 71: $-SSA spreads are near the middle of recent averages...
5-year average EIB/KfW and IADB/IBRD versus 5-year Treasuries matched-maturity SOFR spread of spreads; bp
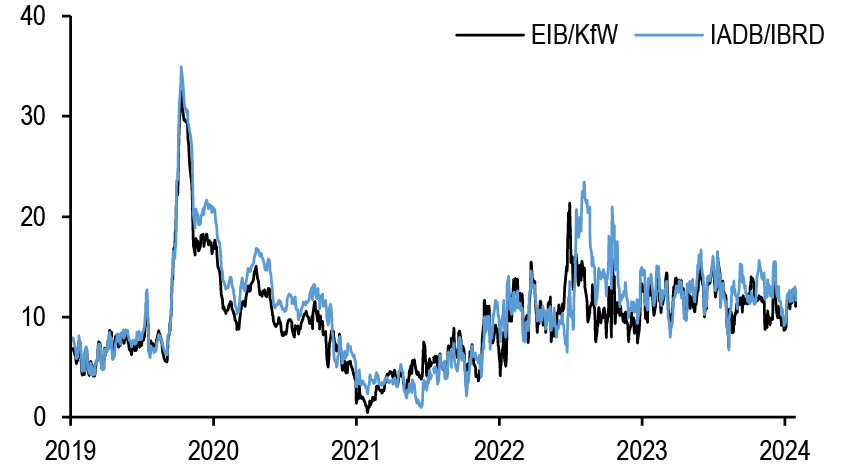
Source: J.P. Morgan
Figure 72: …but remain wide relative to their historical drivers
J.P. Morgan 5-year $-SSA spreads to Treasuries fair value model*; bp
| Current value | Coeff. | T-stat. | |
| Intercept | -5.12 | -9.9 | |
| JULI spread; bp | 109 | 0.12 | 50.4 |
| 5-year UST yield; % | 4.30 | 1.85 | 31.0 |
| 5y Bobl/ UST spread; bp | -186 | 0.04 | 17.6 |
| Current residual | 3 | ||
| R-squared; % | 73.2% | ||
| Standard Error; bp | 3 |
Source: J.P. Morgan*Regression of average of 5-year EIB, KfW, IBRD, and IADB spreads to Treasuries over the last 5 years; bp
Agency supply
Net issuance from the three GSEs we cover has totaled $6bn in the first five months of the year, on the back of $18bn in net issuance from the FHLBs and $9bn and $3bn in paydowns from Fannie Mae and Freddie Mac, respectively. More interestingly, the composition of FHLB debt outstanding has shifted away from callables and into floaters, with also a small uptick in discos outstanding ( Figure 73). Importantly, while the increase in debt outstanding YTD has been somewhat surprising, we’d note that Fed fund volumes rose $40bn in the first 5 months of the year, more than double the increase in debt outstanding during the period. As a reminder, the FHLBs are the primary lender in this market; hence, this is consistent with slightly negative net advance demand YTD, which is more in line with our expectations ( Figure 74).
Figure 73: FHLBs net issuance of FRNs has been positive YTD, at the expense of callables...
YTD* FHLB net issuance by product; $bn
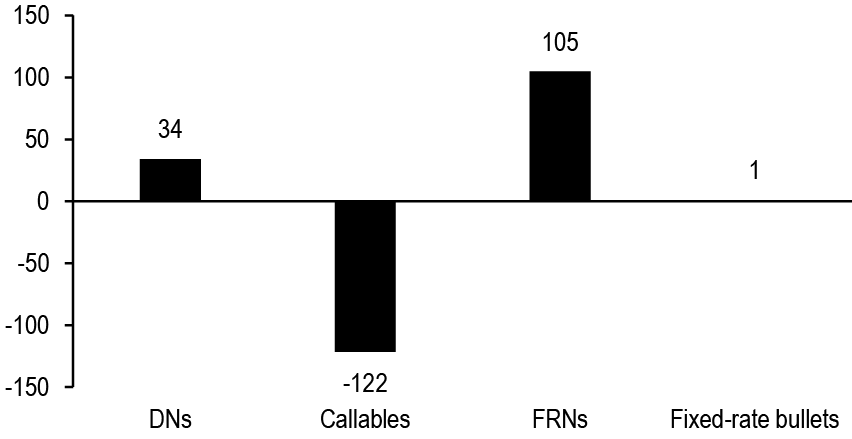
Source: FHLB
*through May 31, 2024
Figure 74: …But Fed funds volumes have risen by more than twice as much in the same period
Quarterly FHLB net issuance versus changes in Fed funds volumes; $bn
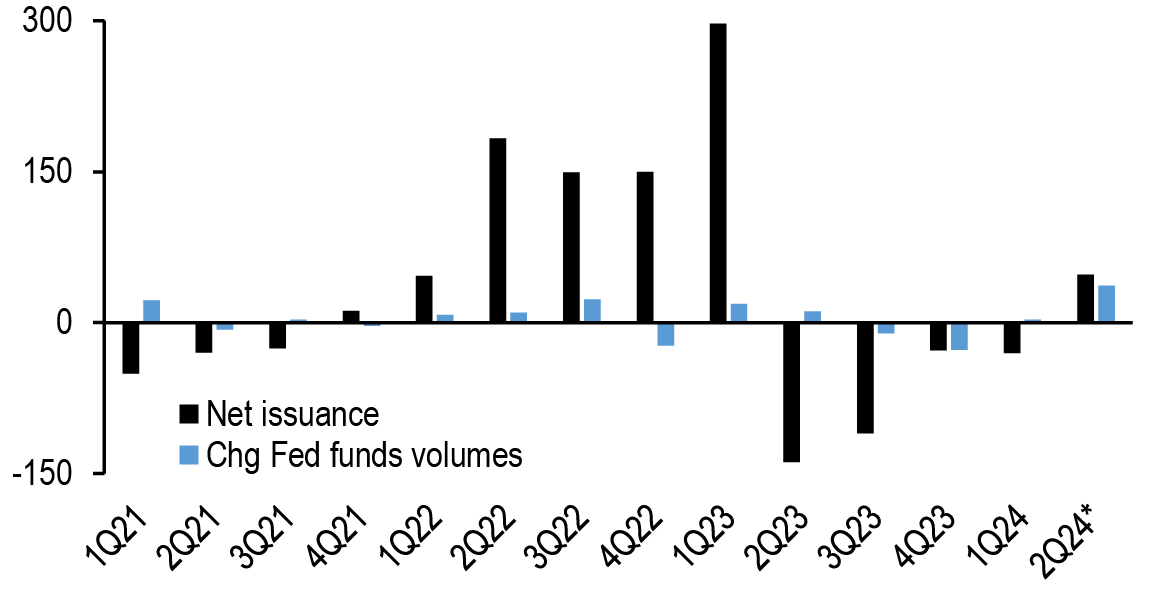
Source: FHLB, Federal Reserve
*2Q24 is through May 31, 2024
Looking ahead, we continue to think our overall Agency supply forecasts are appropriate. In particular, we expect -$100bn in FHLB net supply this year as banks reduce their reliance on advances as part of their liquidity plans, deposit growth remains weak, and home price growth remains modestly positive (2024 RMBS Credit Midyear Outlook, 6/28/24, John Sim). However, we now expect a different composition of supply, given the hawkish evolution of monetary policy expectations and its consequences for demand by product type.
Starting with bullets, net issuance has been very positive YTD, primarily in the form of floaters. Indeed, as Figure 75 shows, after dropping at the end of 2023 when markets priced in an aggressively dovish path for the Fed this year, the FRN share of total FHLB debt rose to 31.3% at the end of May the highest since the end of 2020. This evolution shouldn’t be surprising: with the timing of the first Fed ease getting delayed following upside inflation surprises earlier this year, it makes sense for front-end investors to continue to favor floating-rate instruments. Indeed, as our colleagues in Short Term Fixed Income research discussed earlier this month, MMFs holdings of Agency floaters have risen $103bn YTD to $477bn at the end of May (see Short-Term Fixed Income, U.S. Fixed Income Markets Weekly, 6/14/24). As we look ahead, we continue to think this community will gradually extend out of floaters as we approach the first Fed ease later this year, which should drive more negative FRN issuance through the remainder of the year.
Figure 75: Demand for floaters has recovered and they now make up a larger share of FHLB debt outstanding than callables
FRN and callable shares of total FHLB debt outstanding; %
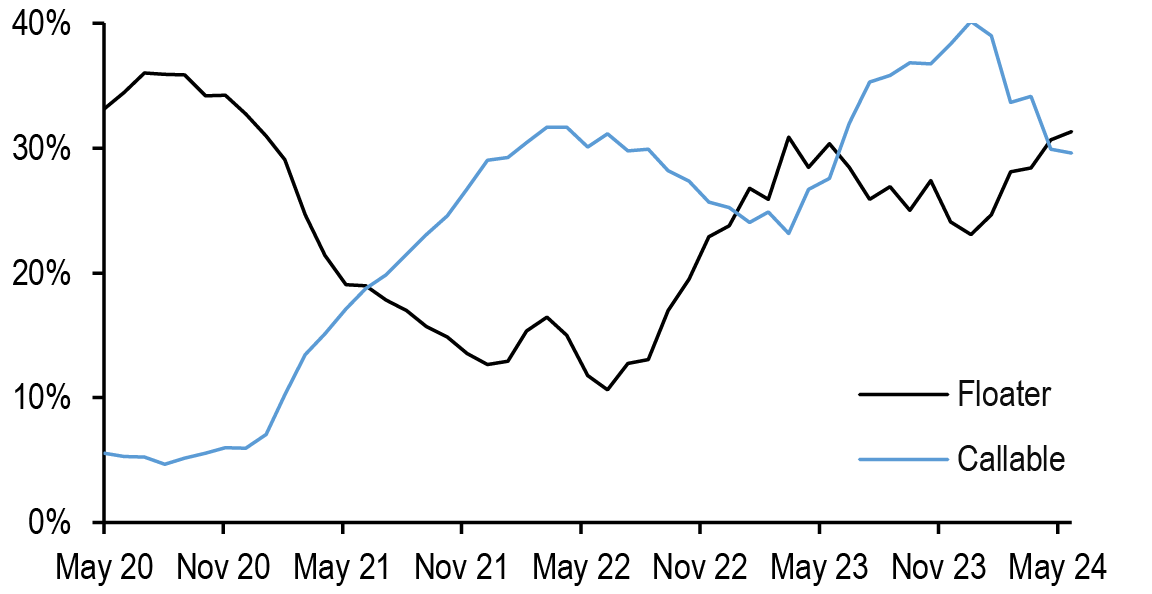
Source: FHLB
Figure 76: Our revised issuance forecasts now look for less callable and more bullet supply over 2024
J.P. Morgan projected 2024 net debt issuance by issuer and product type; $bn
| Discos | Bullets | Callables | Long-term | Total | |
| FNMA | 0 | -15 | 5 | -10 | -10 |
| FHLMC | 0 | -10 | 0 | -10 | -10 |
| FHLB | -25 | 25 | -100 | -75 | -100 |
| Total | -25 | 0 | -95 | -95 | -120 |
Source: J.P. Morgan
Turning to callables, issuance has been negative YTD and we only see room for modest recovery from here. As we’ve discussed in the past, a more inverted 2s/5s curve reduces the attractiveness of callables, all else being equal. For reference, we came into the year expecting the Fed would start easing policy this summer, with a pace of 25bp per meeting until Fed funds dropped to 3.5%, allowing the 2s/5s curve to steepen to 5bp by year-end (see Treasuries 2024 Outlook, 11/21/23). However, after hawkish revisions to our Fed call, with the first cut in November and a gradual pace expected thereafter, we now expect this curve to stay inverted, at -35bp by YE24 (see Treasuries, U.S. Fixed Income Markets Weekly, 6/7/24). As a reminder, demand for callables traditionally rises when the yield curve is steep, as high call probabilities give investors comfort selling volatility to enhance returns. Further, implied volatility has come down, alongside greater policy clarity and a reduction in tail risks, making callables somewhat less attractive. Putting these pieces together, Figure 76 shows our updated forecasts for net debt issuance in 2024 by issuer and product, showing less callable and more bullet supply relative to our prior forecasts.
$-SSA supply
Last month, we adjusted our $-SSA supply forecasts, by raising EIB issuance by $4bn to $22bn. Following this revision, we now look for $93bn of bellwether issuance across the six agencies we cover. These forecasts suggest supply should moderate in the second half of the year ( Figure 77). Importantly, we believe our full-year issuance forecasts remain appropriate, given both the guidance from the individual agencies, as well as the traditional seasonality of supply over the course of the year ( Figure 78).
Figure 77: We look for $93bn in gross bellwether $-SSA supply this year…
KfW, EIB, IBRD, IFC, IADB, and ADB gross USD-denominated bellwether issuance as of 6/28/2024; $bn
| Year | KfW | EIB | IBRD | IFC | IADB | ADB | Total |
| 2015 | 30 | 26 | 21 | 2 | 10 | 11 | 101 |
| 2016 | 36 | 25 | 35 | 3 | 10 | 11 | 119 |
| 2017 | 29 | 18 | 15 | 1 | 12 | 19 | 94 |
| 2018 | 24 | 22 | 9 | 4 | 11 | 10 | 79 |
| 2019 | 23 | 14 | 15 | 2 | 8 | 12 | 74 |
| 2020 | 17 | 22 | 42 | 4 | 17 | 24 | 126 |
| 2021 | 24 | 19 | 24 | 2 | 15 | 20 | 103 |
| 2022 | 17 | 15 | 11 | 2 | 9 | 20 | 73 |
| 2023 | 26 | 18 | 20 | 4 | 11 | 17 | 95 |
| 2024 YTD | 16 | 18 | 11 | 2 | 4 | 12 | 63 |
| 2024 E | 23 | 22 | 17 | 3 | 11 | 17 | 93 |
| % of 2024E | 70% | 82% | 65% | 67% | 36% | 71% | 68% |
Source: KfW, EIB, IBRD, IFC, IADB, ADB, J.P. Morgan
Figure 78: …With the pace of issuance likely to moderate in the second half of the year
Gross $-denominated SSA bellwether issuance by month, 5-year average vs YTD*; $bn
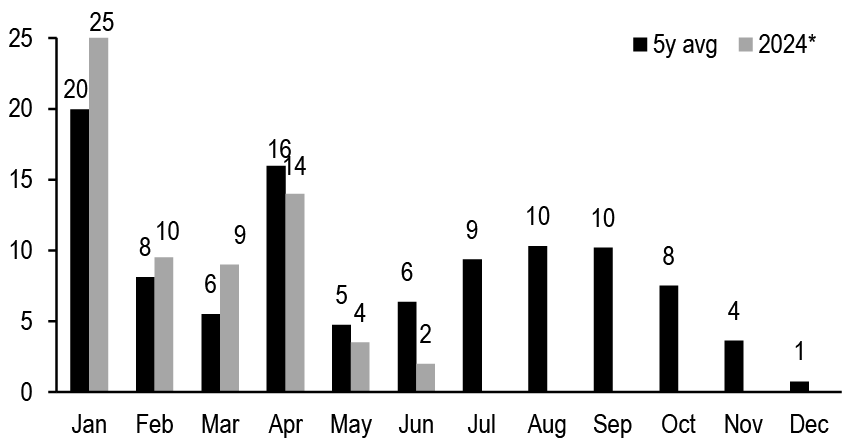
Source: KfW, EIB, ADB, IBRD, IFC, IADB, J.P. Morgan*2024 is through June 28, 2024
Agency MBS Midyear Outlook
Slow and Steady
- We head into the second half of the year with mortgage OASs looking a bit snug, ZVs still historically wide, and the supply/demand picture looking manageable, though perhaps not overly supportive of the basis
- Year-to-date, higher coupons have generally outperformed Treasuries, thanks to a combination of carry and spread tightening; discounts have lagged on the back of technical pressures from bank portfolio reallocations
- If our house rate forecast of a single cut this year is realized, higher coupons should again outperform in the second half of the year
- Our supply forecast is unchanged for Fed runoff and net issuance, and on the demand side we’d slightly upgrade our expectation for bank demand while acknowledging that foreign buying has underwhelmed; money managers will still be the linchpin, and a combination of inflows to active managers and a continued overweight to MBS should be supportive
- Locally, mortgage and corporate spreads have exhibited strong (and opposite) correlation with rate moves, but it’s not clear those relationships would persist if we were to break out of the range
- We explore recession scenario analysis and the break-even spread widening that would make IG price changes equivalent to those on similar duration (but negatively convex) MBS into sharp rallies
- We enumerate many of the reasons proposed to explain flat conventional s-curves (points paid, low media spend, fewer appraisal waivers, originator layoffs, FICO inflation, etc.) but caution that most would be less binding into a larger rally
- Discount prints have now been very well predicted by seasonal patterns and daycount for the better part of a year, giving us (and the low coupon IO investor) more confidence in the accuracy of model valuations
- Ginnie peaks are the sole point of true excitement in prepay space; interestingly, after the “mesa” profile from January speeds reverted to the typical peak/post-peak relationship, post-peaks have somewhat underwhelmed (relative to peaks) vs. historicals, perhaps indicating that even Ginnie borrowers are harder to motivate in the current environment
- We review relative value in the FN 30 spec space; lower coupon loan balance and seasoned pools stand out with sizable OAS and ZV pickups from the improved carry profile. Lower payup stories like TX and FL provide some OAS pickup at minimal cost to ZV across the stack, while low FICO pools in the belly and high LTV pools in higher coupons provide a similar effect
Views
- Continue to trade the range with the Fed on hold and the technical backdrop mostly unchanged; mortgages are a bit snug, but not terribly so
- In specs, prefer seasoning in lower coupons and lower payup stories up the stack; it’s debatable whether the duration of high payup premiums will be as stable as just moving down to the belly
We head into the second half of the year with mortgage OASs looking a bit snug, ZVs still historically wide, and the supply/demand picture looking manageable, though perhaps not overly supportive of the basis. Year-to-date, higher coupons have generally outperformed Treasuries, thanks to a combination of carry and spread tightening; discounts have lagged on the back of technical pressures from bank portfolio reallocations ( Figure 79). If our house rate forecast of a single cut this year is realized, higher coupons should again outperform in the second half of the year. Thinking more probabilistically, lower coupons remain a viable alternative to Treasuries (though bank portfolio sales are a risk), while higher coupons can provide an alternative to corporates (more on that later). But with OASs in the 20-30bp range and the marginal buyers fairly spread sensitive, we think excess returns will need to be driven by earned spread rather than tightening.
Figure 79: Higher coupons have outperformed Treasuries due to carry and spread tightening, and lower coupons lagged due to technical pressures
YTD (through 6/26) US Bloomberg Agg total and excess returns (%), and JPM 2023 model OAS (bp). We use the 2023 model levels to show OAS changes independent of model adjustments.
| Returns | JPM TBA OAS | |||||
| Total | Excess | 2024 Start | 2024 End | 2024 Chg | ||
| UMBS 30 | 1.5 | -2.0% | -0.35% | 31 | 35 | 4 |
| 2.0 | -1.7% | -0.24% | 24 | 30 | 6 | |
| 2.5 | -1.4% | -0.15% | 28 | 32 | 4 | |
| 3.0 | -0.7% | 0.09% | 29 | 31 | 2 | |
| 3.5 | -0.8% | -0.17% | 26 | 26 | 0 | |
| 4.0 | -0.6% | -0.27% | 27 | 26 | -1 | |
| 4.5 | 0.0% | 0.06% | 28 | 23 | -6 | |
| 5.0 | 0.6% | 0.21% | 29 | 20 | -10 | |
| 5.5 | 1.1% | 0.23% | 30 | 24 | -6 | |
| 6.0 | 1.7% | 0.53% | 30 | 24 | -6 | |
| 6.5 | 2.4% | 0.95% | 29 | 18 | -11 | |
| 7.0 | 2.8% | 1.10% | 42 | 23 | -19 | |
| UMBS 15 | 1.5 | 0.1% | 0.29% | 24 | 19 | -6 |
| 2.0 | 0.5% | 0.47% | 18 | 12 | -6 | |
| 2.5 | 0.8% | 0.29% | 9 | 4 | -5 | |
| 3.0 | 1.2% | 0.45% | 9 | 2 | -7 | |
| 3.5 | 0.9% | 0.29% | 7 | -2 | -9 | |
| 4.0 | 0.4% | -0.10% | 3 | -1 | -5 | |
| 4.5 | 0.8% | 0.16% | 5 | 0 | -5 | |
| 5.0 | 1.0% | 0.11% | 10 | 0 | -11 | |
| 5.5 | 1.4% | 0.43% | 12 | 8 | -4 | |
| 6.0 | 1.7% | 0.69% | 12 | 13 | 2 | |
| G2 30 | 2.0 | -2.0% | -0.82% | 15 | 33 | 18 |
| 2.5 | -1.5% | -0.51% | 16 | 27 | 12 | |
| 3.0 | -1.2% | -0.46% | 17 | 25 | 9 | |
| 3.5 | -1.0% | -0.47% | 19 | 28 | 9 | |
| 4.0 | -0.5% | -0.21% | 25 | 26 | 1 | |
| 4.5 | 0.2% | 0.04% | 26 | 18 | -8 | |
| 5.0 | 0.8% | 0.13% | 26 | 18 | -8 | |
| 5.5 | 1.5% | 0.49% | 30 | 17 | -13 | |
| 6.0 | 1.8% | 0.57% | 34 | 30 | -4 | |
| 6.5 | 2.0% | 0.47% | 39 | 42 | 3 | |
| 7.0 | 2.4% | 0.67% | 34 | 42 | 8 | |
Source: J.P. Morgan, Bloomberg Finance L.P.
We’ll dive into the supply/demand dynamics for the second half of the year in more detail, but at a high level, the picture ( Figure 80) looks fairly similar to what we’d come up with when we were writing our year-ahead outlook last fall. While we still expect money managers to be the most important source of MBS demand this year, we have slightly upgraded our expectation for bank buying (from -25bn to +25bn) given the stronger than expected buying in the first half. Foreign investment, on the other hand, has been underwhelming (per TIC data), and so we’re reducing our forecast (from +125bn to +100bn). Dealers have continued to grow their pool and CMO holdings, though given that they net those against TBA hedges, ‘demand’ from dealers is likely passed along to money managers as well. Our expectations for Fed runoff and net issuance remain unchanged.
Figure 80: Supply looks largely the same, and demand has only evolved slightly from our year-ahead outlook projection
Sources of agency MBS net supply and demand, $bn
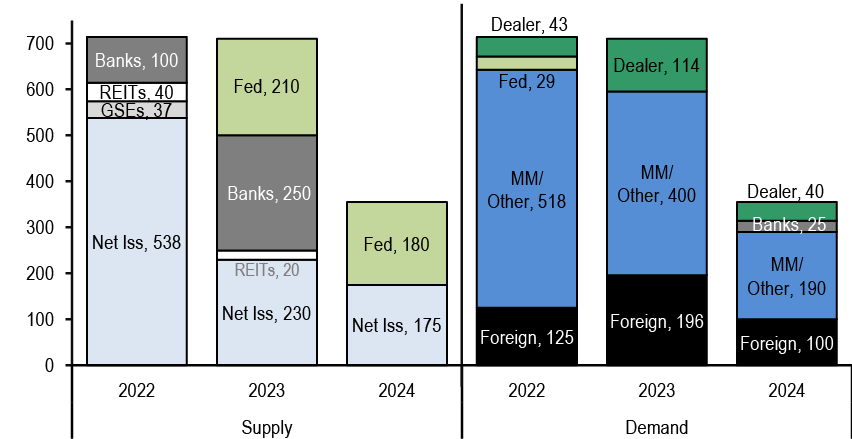
Source: J.P. Morgan
One interesting trend that has emerged is that demand for Ginnies and conventionals can almost be thought of as operating on parallel tracks. Banks have a strong preference for Ginnies, and money managers have maintained a heavy overweight to higher coupon conventionals. With net issuance coming solely in those products, that’s been enough to make the picture balance; 15yrs and other refi products are steadily shrinking as a share of outstandings, given the curve inversion and lack of refi activity.
In the rest of this piece, we’ll look at mortgage spreads relative to corporates in larger rate shocks, estimating the break-even spread widening required on the IG end to net out against the negative convexity of MBS. We also consolidate the myriad reasons for why conventional s-curves remain quite flat; most would recede in importance into a sharp rally. We also look at how seasonals and daycount are largely modulating deep discount prints, implying that we aren’t seeing any significant trend drift that would lead to model recalibrations. Ginnie peak/post peak relationships also look better behaved than in prior years, even if they are well above conventional speeds. Finally, we review the spec landscape, looking at tradeoffs vs. TBA on the OAS and ZV front.
Demand
U.S. commercial banks: Bank buying in AFS/HTM has been tricky to estimate this year. Though the H.8 data showed surprisingly robust numbers to start the first quarter (+$44bn), it turned out that the first week’s reading of +$12.5bn most likely settled in late 2023, and that around $26bn came from commercial bank trading accounts (which we think represent less durable buying associated with rolls). The quarterly call reports indicated that bank MBS holdings were +$8.5bn in the first quarter, which roughly tied out with the adjusted H.8 tally of +$5.6bn.
Bank portfolio repositioning in the second quarter knocked the year-to-date total down by $26bn in one week, though it has subsequently rebounded. Currently, net buying in Q2 comes to +$5.2bn, and netting all of these factors together, YTD buying looks like +10.8bn. We’re going to put banks in for $25bn of buying for the full year, with some potential upside.
Deposit growth has been relatively muted (see Figure 81), though the same can be said for loan growth ( Figure 82); banks have been generally letting their lower yielding fixed rates burn off and replacing them with Ginnie floaters (CMOs or asset swapped fixed rates). Wherever they can find ways to raise capital, they seem to be taking the opportunity to speed the runoff of discounts with outright sales. It is very hard to project the timing and size of this activity, but we think that it will continue to be a theme for the MBS market, partially offsetting otherwise positive demand for mortgages.
Figure 81: Deposit growth has been relatively muted...
Change in Domestic Commercial bank Borrowings and Deposits, $bn
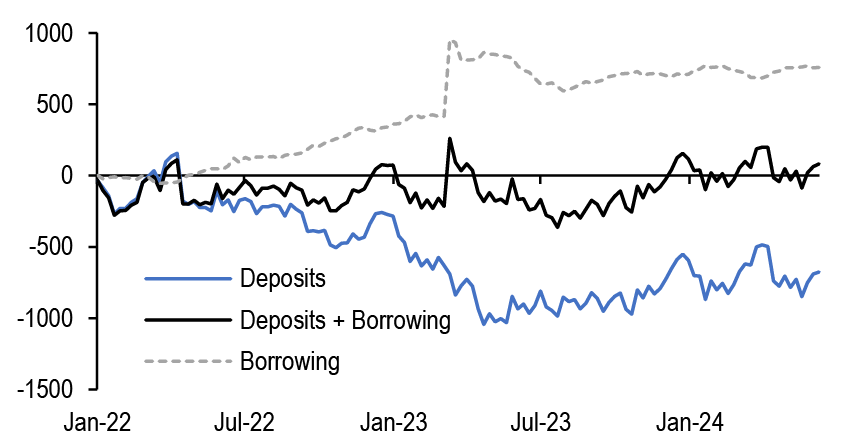
Source: J.P. Morgan, Federal Reserve
Figure 82: … as have been the changes on the asset side
Change in Domestic commercial Bank Holdings of Loans, Securities, and Cash, $bn
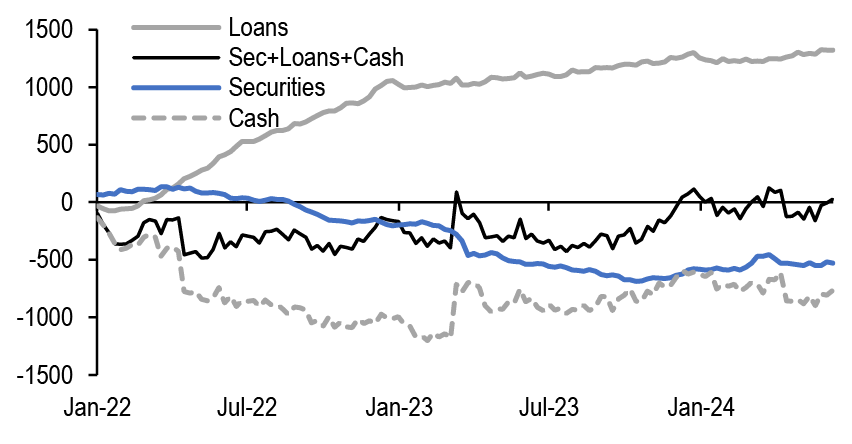
Source: J.P. Morgan, Federal Reserve
One wildcard for banks is what happens with Basel 3 Endgame. A recent news story suggested that the proposal had been scaled back such that the total required capital build might only be 5% (vs. the originally required 16% increase). This would likely mean that banks would be able to build to their required risk capital levels faster, and thus be less constrained by RWA over the medium term.
Most of the capital increase in the original B3e proposal comes from operational capital, rather than changes to asset risk weights, but the knock-on effects would still be felt in securities investment. When risk capital is the binding constraint, on the margin banks want to buy low RWA assets to improve their capital/RWA ratio. That means more 0% risk weight Treasuries and Ginnies (vs. higher RWA loans, or even 20% risk weight conventionals). In the very near term, banks are likely still risk capital constrained (regardless of what happens with B3e), and so they’ll continue to prefer Ginnies. But over the medium term, that regulatory-driven preference may fade sooner than previously anticipated, if these changes are finalized.
It also remains to be seen whether regulators choose to reduce mortgage loan risk weights (and put them more in line with the European B3e proposal). Doing so might could nudge the securitization rate down, on the margin, as loans could look more attractive to banks.
Money managers: We think money managers have been responsible for most of the net buying to start the year, but have done so without the active managers significantly increasing their overweights ( Figure 83). Instead, robust inflows on both the active and passive side have helped them to take down many forms of spread product ( Figure 84). The heavy overweight in higher coupon conventional 30yrs by some of the managers who have seen the largest inflows has been particularly supportive, since it has helped the market digest net supply in GSE 30yrs. With corporate spreads just modestly off their recent tights, and YTD excess returns on higher coupons giving a little more credence to the mortgage vs. corporate trade, we think that money managers can maintain their current allocations given the yields available in mortgage space.
Figure 83: Money managers have been buying MBS this year without increasing their overweights …
MBS and Corp weightings of large money managers versus the MBS and Corp weightings of the Bloomberg Agg, %
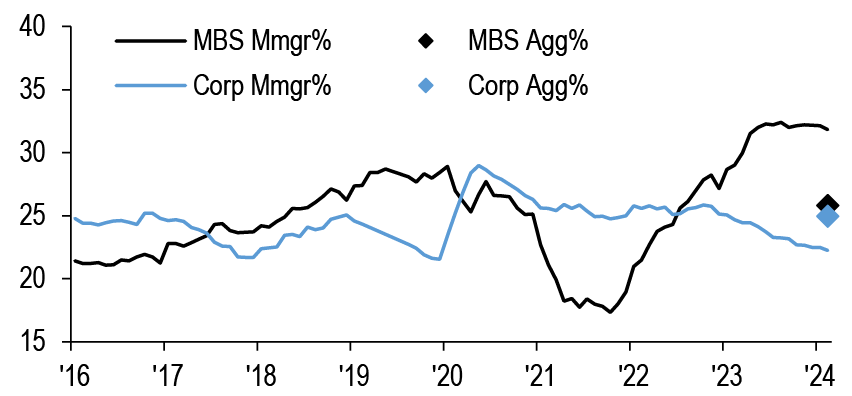
Source: J.P. Morgan, MorningstarDirect
Figure 84: … as both active and passive inflows have helped them take down many forms of spread product.
Monthly fixed income bond inflows to passive and active funds, $bn
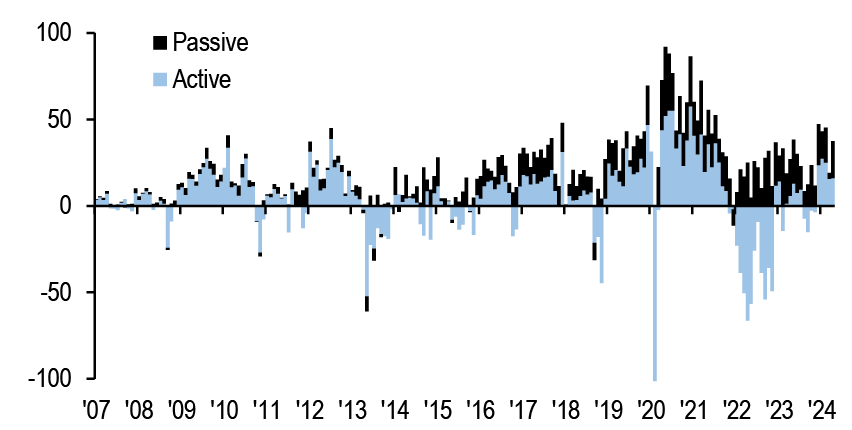
Source: J.P. Morgan, EPFR
Inflows will remain the key consideration—they’ve been strong enough to help mortgages weather the seasonal upswing in forward origination sales, but the outlook is somewhat weaker as trailing returns on the Bloomberg Agg have softened a bit ( Figure 85). That may be a headwind in the near term, though as the year progresses and the trailing returns window shifts, 6m returns on the Agg should start to look better; that should again be supportive of inflows.
Figure 85: Trailing returns on the Bloomberg Agg have softened slightly
Trailing 6 month U.S. Bloomberg Agg returns, with projections based on a 5.07% YTW assumption, %
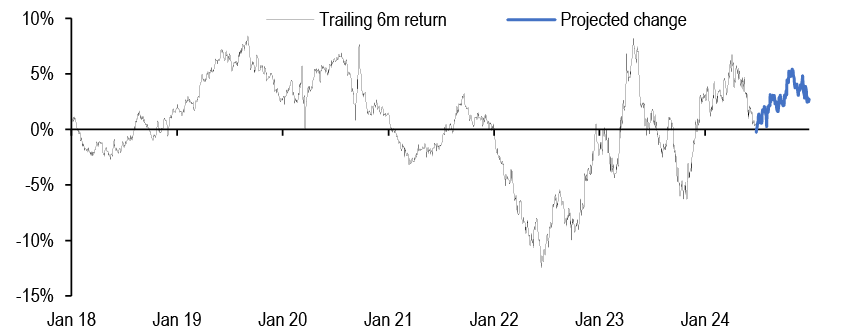
Source: J.P. Morgan, Bloomberg L.P.
We lump insurance into the same bucket as money managers (our ‘plug’ in the supply/demand equation). It's harder to get timely stats on their buying, but anecdotally they’ve been adding, particularly in some of the longer CMO cashflows.
Foreign demand: Through April, TIC data indicates that foreign demand has been muted ( Figure 86). The Fed’s agency custody holdings series has also trended downward since November of last year ( Figure 87). The Japanese MoF data on flows into US long term debt shows that the strong start to the year may have faded more recently ( Figure 88). With the Fed on hold, currency hedged yields are still unappealing vs. local currency bonds.
Figure 86: Year-to-date foreign demand has been muted so far this year …
YTD purchases of MBS by foreign investors, manually price-adjusted with the index through January 2023, and adjusted using TIC-provided mark to market changes from February 2023 onwards, $bn
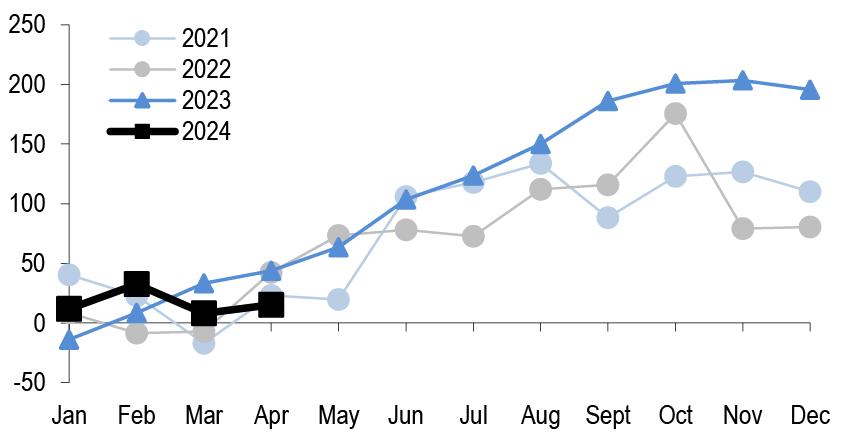
Source: J.P. Morgan, TIC
Figure 87: … and foreign official U.S. agency custody holdings
U.S. Federal Agency Securities held in foreign official accounts, $bn
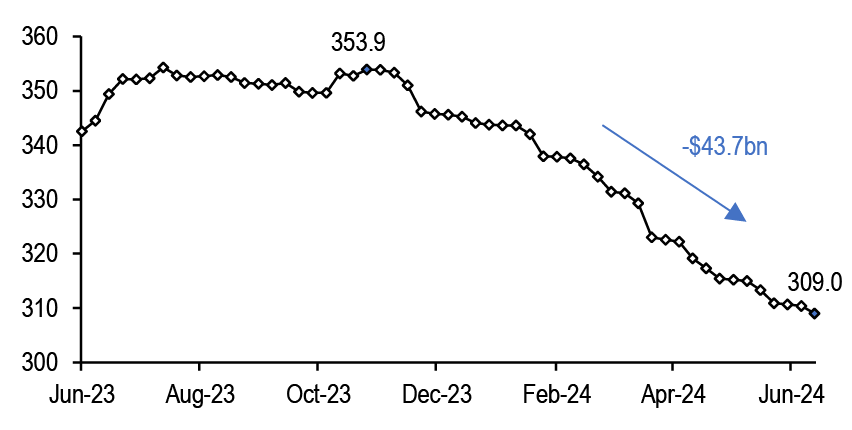
Source: J.P. Morgan, Federal Reserve
Figure 88: Japanese US long term debt flows have faded recently
Japanese ministry of finance net flows of U.S. long-term debt securities, adjusted for monthly average USDJPY exchange rates, $bn

Source: J.P. Morgan, Ministry of Finance
There’s been some concern that Japanese banks are joining their American counterparts in looking for ways to unload low coupon MBS. Disclosures for the large Japanese banks lack the same detail that’s available for US institutions, so it’s very hard to quantify how much banks hold of the $242bn that TIC links to Japanese holders. That being said, the large banks do report their mark-to-market gains/losses on foreign bonds, and in aggregate the largest Japanese banks had significant losses at the end of the 2023 fiscal year. It remains to be seen whether there will be any significant net selling.
So why do we have $100bn still penciled in for the second half? We do think that as we get closer to a Fed cut, some of the traditional foreign players may be more tempted to come back into the space. Additionally, last year, the non-traditional buying localities (think Ireland, Canada, the UK) seemed to have accelerated their buying just as spreads enticed US money managers to become more active. If that trend persists this year, we’d expect to see more buying. Admittedly, our confidence in this estimate is not particularly high, however, and there’s a chance that foreign buying continues to underwhelm. That would put more burden on banks and money managers, potentially biasing spreads wider.
Supply
Our view on organic net supply remains unchanged since we wrote our 2024 Outlook late last year. While rates have provided plenty of shocks, they have done so at high enough absolute levels that it hasn’t mattered for additional cash-out activity and the purchase market remains constrained by inventory. On that front, our initial projections called for no change in the number of sales/HPI, but as the year has developed it looks more likely that sales will be depressed relative to last year by 5-10% while our non-agency team has increased their call for HPA to +5.5%. Putting these thoughts together with the first five months of issuance, we feel $175bn remains reasonable for organic net in 2024. Figure 89 shows our rough month-by-month view and how net should be backloaded in this mostly purchase-driven environment. If our forecast has a tilt to it, it would be just slightly to the higher side, depending on housing activity through the rest of the summer.
Figure 89: We’re sticking with our $175bn net call for 2024
Monthly Agency MBS net issuance in 2023 and 2024, and our 2024 projections as of 6/28/2024, $bn

Source: J.P. Morgan, Fannie Mae, Freddie Mac, Ginnie Mae
Looking by product, Figure 90 shows the net issuance split for conventional 30yr/conventional “other” (refi products with shorter terms, mostly, like 15yrs) / Ginnies. Issuance outside of 30yrs remains extremely limited and runoff continues at a pace similar to where it moved to in mid-2022. The split of gross issuance between Ginnies and conventionals continues to slowly shift towards Ginnies, now at 40% versus last year’s 37.5%. In Figure 91 we use the current split along with our expectations for the full year’s net to project 2024 issuance by product. This year, its possible that 93% of net will come in Ginnies thanks to their greater share of purchase origination and the continued drag from conventional refi products.
Figure 90: Net has started to pick up thanks to seasonal trends, with growth in 30yr purchase products…
Net issuance by agency / term / product, by issuance month, $bn

Source: J.P. Morgan, Fannie Mae, Freddie Mac, Ginnie Mae
Figure 91: …while it looks like Ginnie net issuance could overtake conventional 30yrs for the first time in over a decade
Breaking out Conv 30/Conv “other”/G2 30 gross and net issuance projections for 2024 based on an assumption around the Ginnie share
| Gross | Net | |||||
| Conv 30 | Conv Other | Ginnie | Conv 30 | Conv Other | Ginnie | |
| 2024 Through May | 216 | 12 | 152 | 46 | -53 | 59 |
| 2024 Full Year | 555 | 31 | 389 | 140 | -128 | 163 |
| Ginnie Share | 40% | 93% | ||||
Source: J.P. Morgan, Fannie Mae, Freddie Mac, Ginnie Mae
Relative value—vs. Treasuries and IG
As has been the case for a few years now, the question “are mortgages cheap” is still very much a question about which mortgages you’re talking about, and what you’re comparing them to. As Figure 92 shows, the coupon difference between the index and the par bond remains at historically elevated levels, with today’s 240bp spread in the 5th percentile (by absolute difference) since 2000. In Table NaN Figure 93, we plot out a histogram of these differences over the same period just to highlight how abnormal this period is—and that’s even after the index coupon has drifted up ~60bp from its early 2022 low.
Figure 92: Even as the index coupon has drifted up 60bp from the early 2022 low…
Current coupon and index coupon (%, left) and CC-index coupon (bp, right)
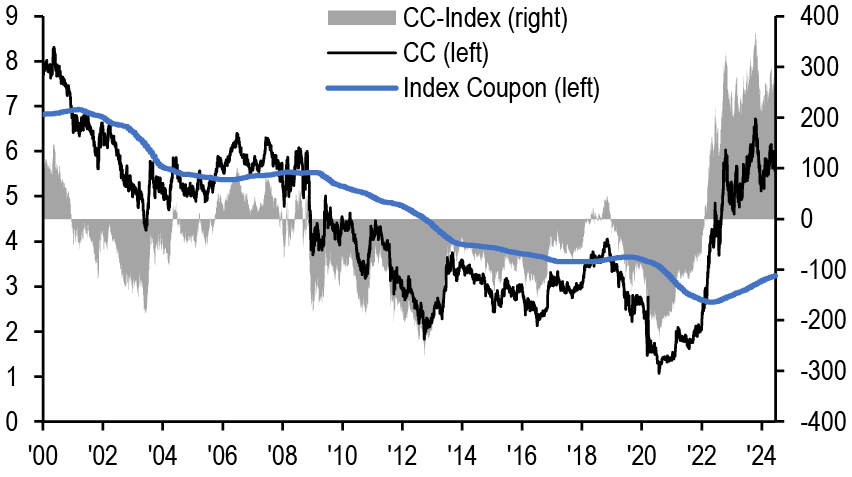
Source: J.P. Morgan
Figure 93: …the current coupon / index coupon difference remains a historical outlier
Histogram of daily difference between FN 30yr current coupon and index coupon, bp
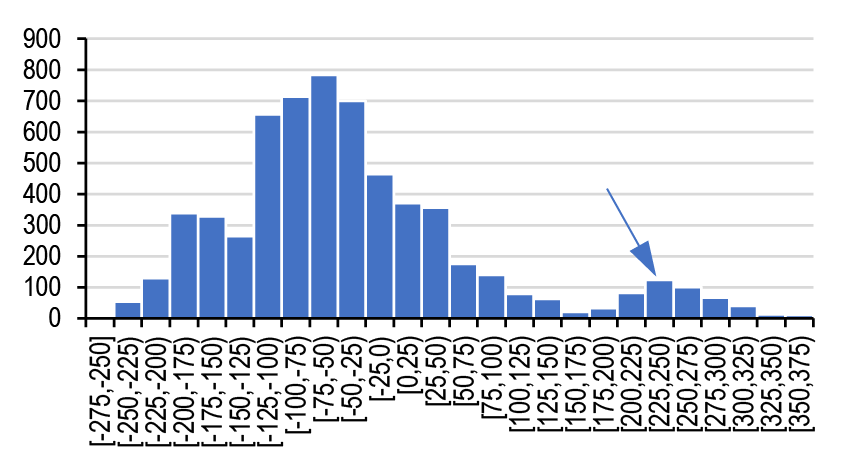
Source: J.P. Morgan
That being said, the floats in higher coupons are thickening as production remains focused on 5s-7s, and bank portfolio rebalancing activity continues to unlock specs in deep discounts. This has left the conventional 30yr stack with 10-12 tradeable coupons, depending on your definition of liquidity. The wings of the stack still have markedly different characteristics, with deep discounts offering 40-50bp ZV picks against Treasuries (and positive convexity), and production coupons offering 125bp ZV, at the expense of much less cashflow certainty. The belly offers a gradient somewhere in between.
Figure 94: OASs across the stack have settled into a tighter range
Current, 1m, and 6m treasury OAS ranges across the TBA stack in the research beta model. The black dots represent the current OAS, the blue boxes represent the 1m range, and the black lines represent the 6m range (as of 6/26/2024)
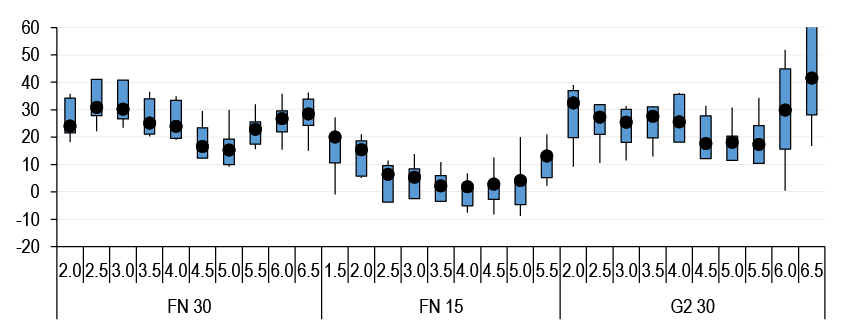
Source: J.P. Morgan
Figure 95: Current coupon OAS sits around its 2015-2018 range...
Current coupon historical treasury OAS and latest level (bp)
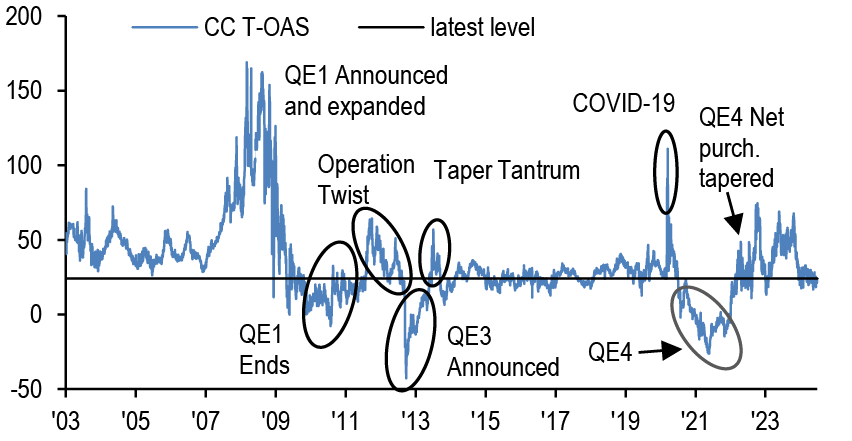
Source: J.P. Morgan
Figure 96: … but ZV spreads are still historically wide, thanks to the inverted curve and higher implied vol
Current coupon historical treasury ZV spread and latest level (bp)
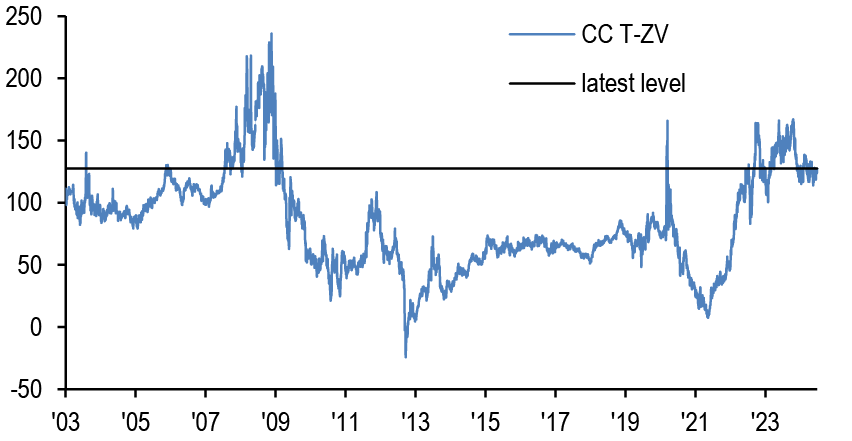
Source: J.P. Morgan
None of this, of course, is new—but OASs across the stack have settled into a tighter range (see Figure 94). That makes the question of how one is using mortgages perhaps more important when determining which mortgages to buy. Broadly speaking, lower coupons remain compelling 5-7yr Treasury proxies, while higher coupons are a way to pick carry, fade vol, and arguably shed some exposure to historically tight IG corporate spreads.
On that front, there’s still no commonly agreed on way to compare mortgages and corporates. Current coupon mortgages pick ZV spread vs. similar duration corporates, but OAS doesn’t look particularly cheap vs. the bond/CDS basis (see Figure 97 and Figure 98). It may be that boiling down either of the key risks to each of the two products—that is, default risk for corporates and rate risk for mortgages—may be impossible without a ‘theory of everything’ OAS approach that simulates economic conditions and rate paths jointly. When we solve that, we’ll probably be able to retire shortly thereafter.
Figure 97: Current coupon still looks cheap to similar duration corporates on a ZV basis ...
JULI 3-5y Treasury spread, FN 30yr cc ZV spread, and difference (bp)
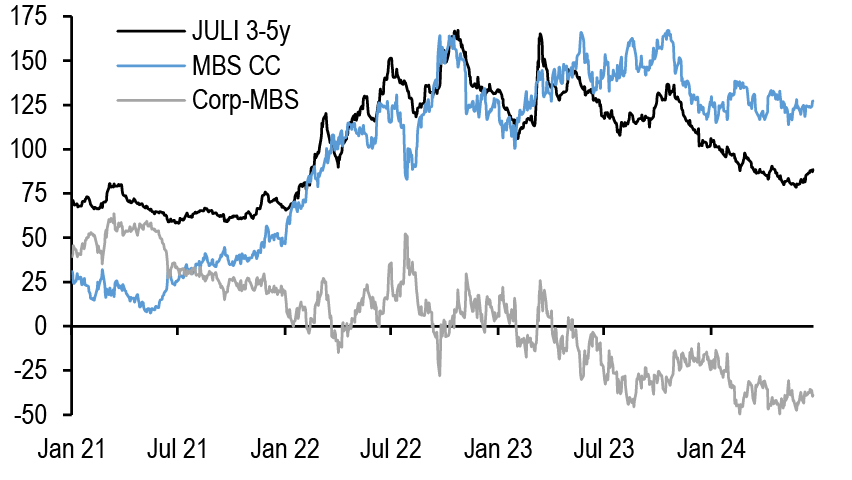
Source: J.P. Morgan
Figure 98: … but OAS doesn’t look particularly cheap vs. the bond/CDS basis
JULI Index Treasury spread – CDS basis and MBS Index Treasury OAS (bp)
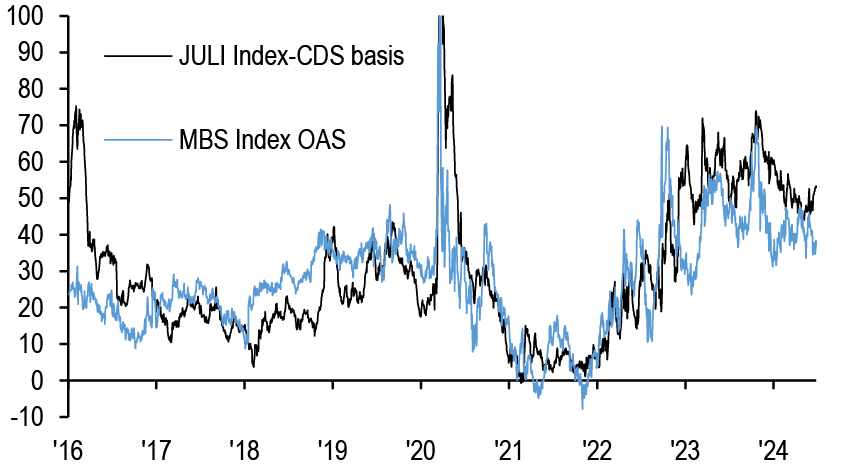
Source: J.P. Morgan
Until then, we’re still looking for other ways to compare the two, and one possibility is running a break-even analysis in rate shocks. Locally, mortgages and corporates have exhibited some rate directionality (though with opposite signs). Corporate buyers frequently have yield bogies, and thus IG spreads have compressed as all-in yields have gone higher—at least to a certain point (~4.50% on 5s). Mortgages, in contrast, have tended to widen into rate selloffs, as technical factors (money manager inflows and bank deposit growth) are perceived to weaken into selloffs.
Figure 99: Locally, corps and MBS have experienced rate/spread directionality of the opposite sign
FN 2 OAS (left, bp) vs. 5yr UST yield (%) and JULI Index Treasury Spread (right, bp) vs. 5yr UST yield (%), observed daily in 2024
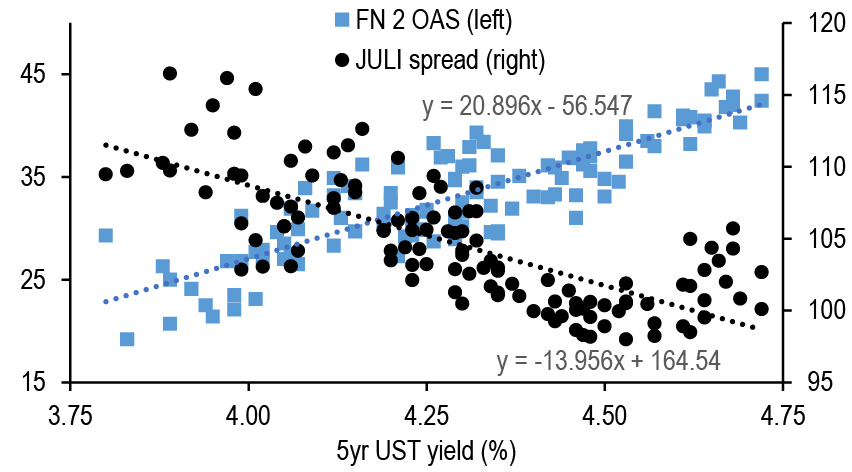
Source: J.P. Morgan
That’s locally, however—these relationships probably wouldn’t hold so tightly in larger rate moves. For example, many investors are overweight MBS (and underweight IG) because they’re worried about a recession. In that world, mortgages could stay on spread (OAS), while IG risk premium could increase. But in that world, rates are also likely to sharply rally, bringing the negative convexity of MBS into play.
MBS investors have an agreed upon framework for simulating prices in rate shock—even OAS pricing—and arguably mortgages won’t go too much tighter in OAS terms, unless the Fed’s actively involved in the market again. For IGs, it’s simple enough to compute the price impact purely attributable to rate shifts and discounting, in a vacuum. But any rates strategist will tell you that a 300bp rally doesn’t happen in a vacuum. Most investors would agree that IG corporate spreads would likely go wider into a sharp rally, because that rally would be precipitated by a shift to a weaker economy.
If we take the price changes in rate shocks in Figure 100 (which assume no move in spreads), we can then estimate how much less MBS go up in price than comparable duration corporates into large rallies. Then, using the duration of the corporates, we can estimate how much IG spreads would have to widen to have the corporates only go up in price as much as the MBS ( Figure 101). For example, we compare duration matched corporates and mortgages (using our JULI 3-5yr bucket and a blend of FN 5s/5.5s). Into a 300bp rally, the MBS gain 6pts in price, while the corporates increase 11.2pts. For the corporates to only have gone up 6pts, they would need to have widened by 139bp.
Figure 100: Into large rate moves, mortgages underperform if spreads don’t move…
Price moves of JULI 3-5yr IGs and duration matched MBS (FN 5s/5.5s), assuming parallel rate shocks and no spread changes, points per $100 of notional
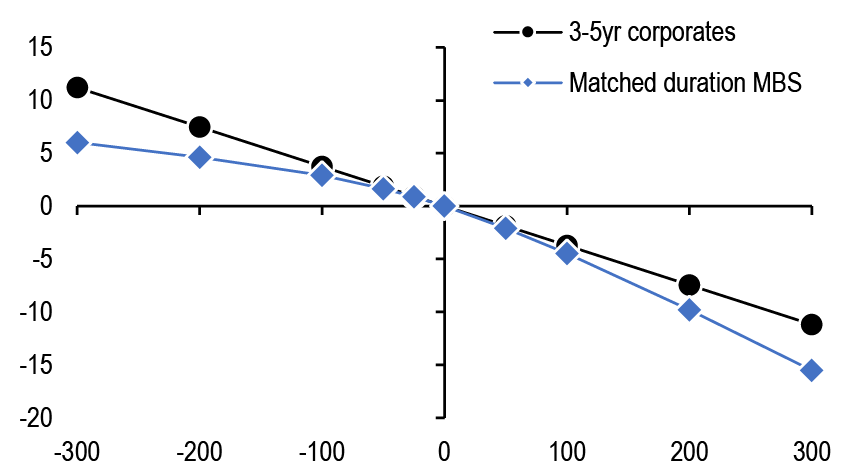
Source: J.P. Morgan
Figure 101: … from which we can compute ‘break-even’ IG widening amounts to make corporates experience the same price move as MBS
Amount of spread widening on 3-5yr IGs to make their price move equivalent to an even duration blend of FN 5s/5.5s in different rate rallies, bp
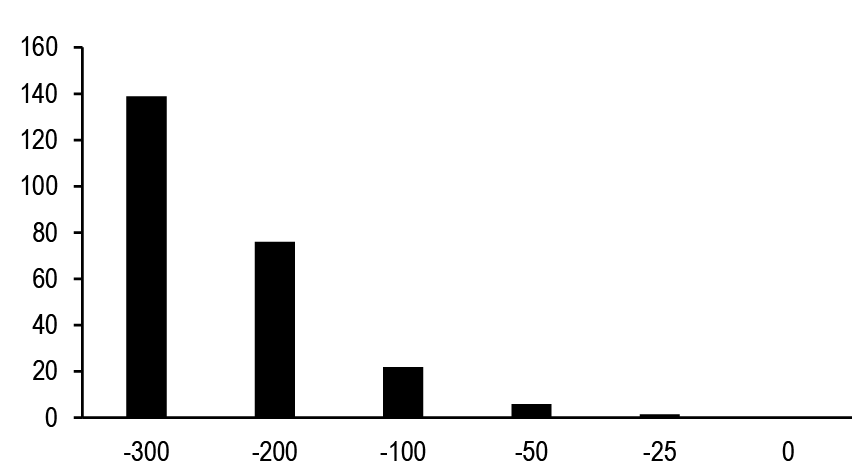
Source: J.P. Morgan
There’s no doubt that this framework is overly simplistic— what happens if the rate shift isn’t parallel? What if vol moves? As mentioned earlier, the ability to simulate economic scenarios across rate paths would be more complete, but lacking that, this approach does benefit from its simplicity. In a sense, it boils down to this question: if shorter duration mortgages offer competitive yields vs. corporates today (see Figure 102), is the break-even spread widening on IGs in a recession scenario priced well? For longer duration, lower yielding mortgages like FN 2s, a similar analysis can be performed—but the positive convexity of those cashflows means that they can hold their own against corporates in rallies even without spread widening. Thinking of low coupon mortgages more like Treasuries with some additional spread pickup is probably the more appropriate comparison.
Figure 102: FN 4.5s and up outyield similar duration corporates, while lower coupons remain tighter
Yields on FN 30yrs (by coupon) and IG corporates (by JULI duration bucket) vs. duration, %
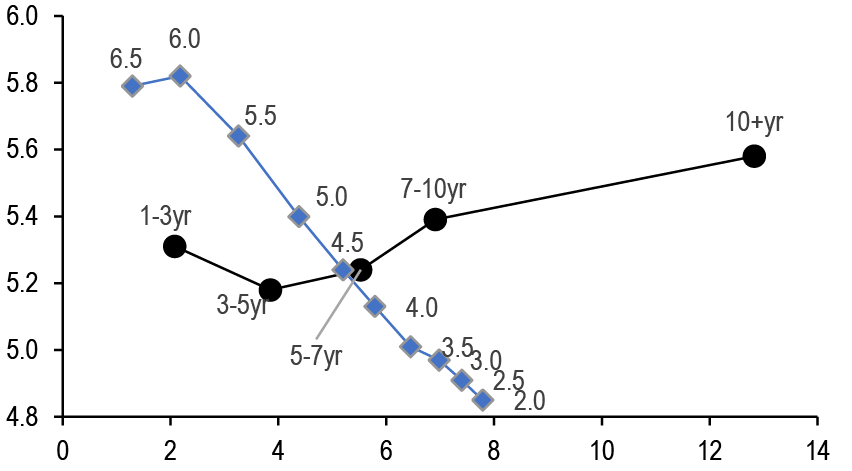
Source: J.P. Morgan
Prepayments
A few themes have stood out in 2024 prepayments looking back from the midpoint of the year. The first is the split reaction to the over 1% drop in mortgage rates early on that saw well-behaved prints in conventionals versus a more aggressive refi reaction in Ginnies. Below, we’ll go through a list of reasons why we think conventionals prepayments have been muted versus prior periods. Second, on the discount side, there has certainly been noise and excitement month-to-month (like February acceleration), but from a wider lens, 2s and 2.5s have paid close to what we would expect from normal seasonal patterns over the past year. Third, we’ll consider recent developments in Ginnies since the dramatic prepayments in Jan/Feb. While refi rates have been more aggressive in Ginnies, the behavior of post-peak pools in recent months hints towards the s-curve also being flatter on the government guaranteed side. These themes remain similar to what we saw heading into the year with the early test of speeds confirming the flatter GSE s-curve into at least “shallow” rallies.
To set the stage, Figure 103 gives perspective on what type of rates it would take to get more conventional borrowers into the refi window. Only 4% have rates of 7% or above, though a sizeable group is starting to build up just below that level. For those loans that have experienced any incentive, the conventional s-curve looks almost as flat as it did this year versus last. Figure 104 and Figure 105 show how the flatness of 2024 stacks up against refi waves years as well as other years (like 2018) where speeds were also muted. Figure 103
Figure 103: Only a sliver of conventional loans are near the refi window
Outstanding conventional 30-year loans by WAC and vintage, $bn

Source: J.P. Morgan, Fannie Mae, Freddie Mac
Figure 104: The 2024 YTD s-curve looks as flat as last year’s when compared to “refi waves” years...
1m CPR by incentive across various observation periods, conventional 30yrs ≥ 6 WALA, versus rate incentive (x-axis)
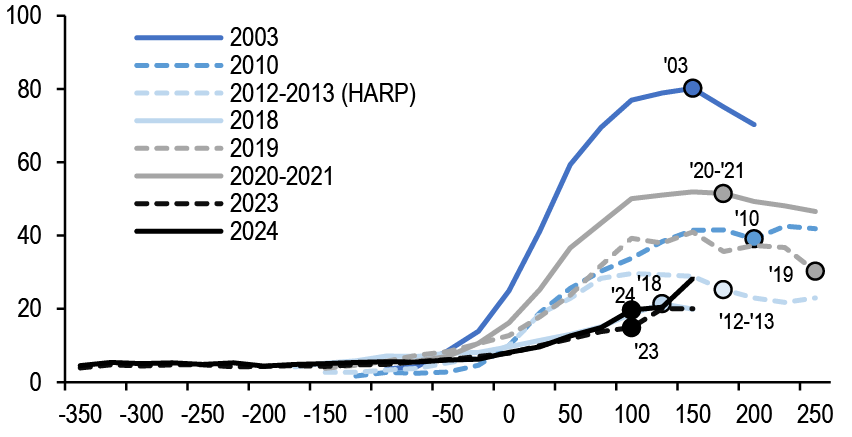
Source: J.P. Morgan, Fannie Mae, Freddie Mac
Figure 105: … and even falls near the bottom of pile when compared to “refi duds”
1m CPR by incentive across various observation periods, conventional 30yrs ≥ 6 WALA, versus rate incentive (x-axis)
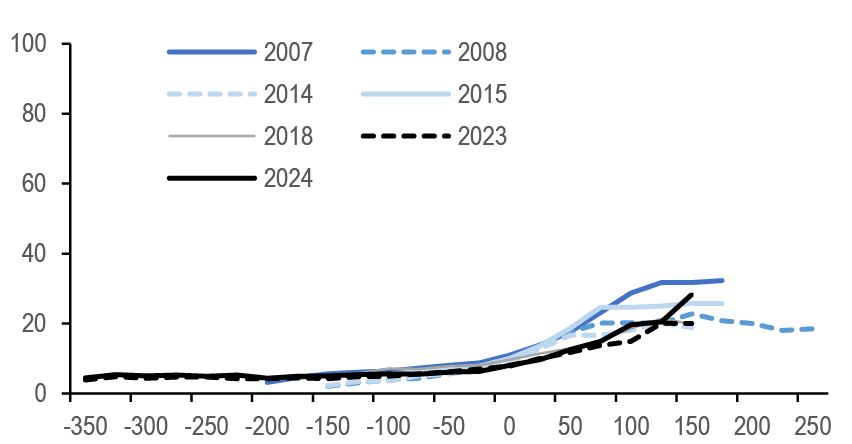
Source: J.P. Morgan, Fannie Mae, Freddie Mac
The flat conventional s-curve
How do we explain the calm of 2024? Here is a list of key factors that we think have each contributed to flat conventional s-curves. The list is by no means exhaustive, and we’re constantly adding to it. One thing that stands out to us is that many of these factors would cease to be relevant into a large enough rally—but it’s hard to precisely say how big that rally would need to be.
Points paid: We wrote a few months ago about Freddie’s data release showing significantly more borrowers paying points, and paying more of them on average, since 2022 ( Figure 106 & Figure 107). This can impact prepayments in a few ways, one of which is not having cash reserves on hand to pay for another refinance. Additionally, it could impose a psychological hurdle to a near-term refi for only a marginal savings, as it would seem to “waste” the money spent on getting a better rate. Time since origination should erode both of these impacts and a larger rally would make no-cost refis viable.
Figure 106: The share of borrowers paying points surged after 2021...
Share of borrowers who paid points by product type, Freddie 30yrs
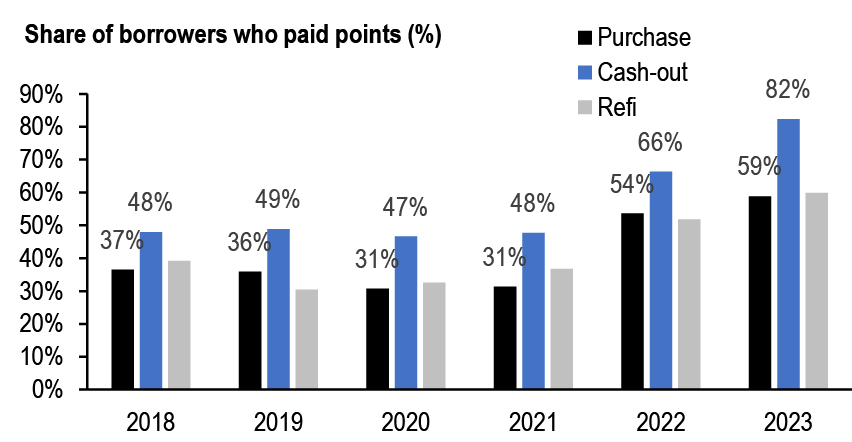
Source: J.P. Morgan, Freddie Mac
Figure 107: ...and the amount of points they are paying is also higher
Average points paid by product type, Freddie 30yrs
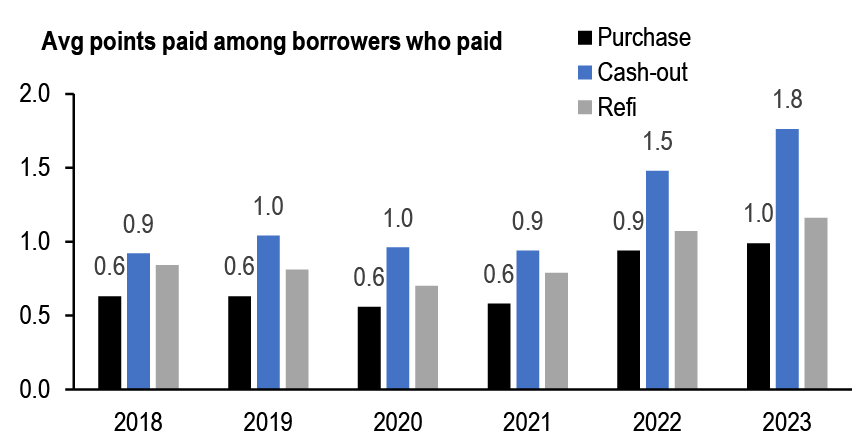
Source: J.P. Morgan, Freddie Mac
Originator Layoffs: One of the biggest mysteries of 2023 was the seeming glut of mortgage industry employees relative to volumes, which was cleared up by a massive revision in the BLS data. The revised dataset showed employment closer to the “right” level given issuance ( Figure 108). However, a 30%+ drop in employment can’t happen without friction, and it is plausible that many borrowers no longer have contact with their initial loan officer, making it more difficult to pitch refis through established personal connections.
Figure 108: The fast pace of originator layoffs means that many borrowers have lost contact with their original loan officer
Mortgage employment (k) vs. MBS issuance ($bn)
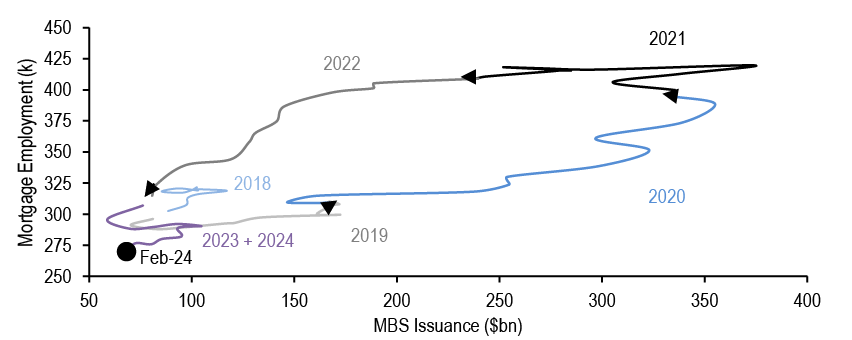
Source: J.P. Morgan, Fannie Mae, Freddie Mac, Ginnie Mae, BLS
FICO inflation: One surprising result of the pandemic and subsequent government programs was an upward drift in credit scores as delinquencies shifted lower. This Fed note goes over the details and how it has impacted delinquency rates of late on lower credit score borrowers. For mortgages, FICO tends to impact the steepness of s-curves, in addition to the elbow shift that comes from differences in LLPAs. So a model trained to earlier periods with “lower” FICOs might overestimate what speeds look like on today’s “inflated” FICOs. There is some evidence of this drift on FICOs more applicable to the major pools (720+) from MPL ABS delinquencies. Our ABS team has seen delinquencies for 720+ borrowers trend higher at a much faster rate on the unsecured loans originated through the Fintech ecosystem ( Figure 109). According to a recent FICO blog, the degree of drift since pre-pandemic is in the range of 15-20bp (https://www.fico.com/blogs/average-us-fico-score-718), so the 740 borrower of today might prepay more like the 725 of yesteryear.
Figure 109: FICO drift can be seen in the faster pace of 720+ loans going delinquent in MPL ABS
30+ delinquencies by origination quarter for loans >=720 FICO across MPL ABS pools
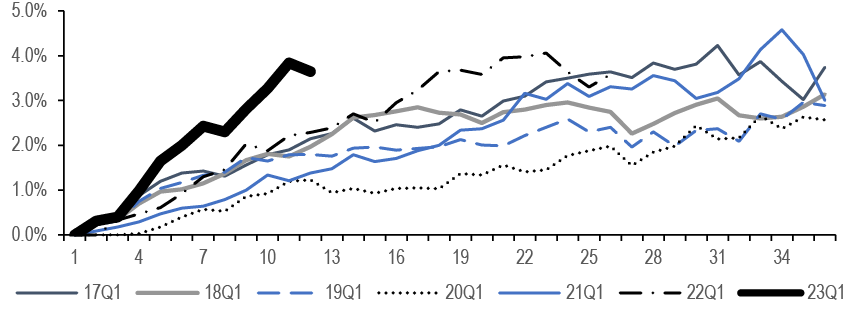
Source: J.P. Morgan, dv01
SATO Borrowers and the case of the missing re-lock: The greater dispersion in rates that borrowers are getting has been a fact of life since the major sell-off in 2022. As a result, more borrowers than ever our getting rates well above the average for their time of origination ( Figure 110). Some part of that dispersion can be chalked up to SATO, but another factor is the volatility of rates within a given month. That factor also says something about borrower mentality. Why didn’t these borrowers relock their loan or go to another lender when rates moved significantly lower? It is hard to measure the impact here but its another bit of supporting evidence that the borrowers’ with the highest rates are those that are least reactive to lower driving rates.
Figure 110: During these turbulent times in rates, many loans are getting originated at rates well above the average from their origination month
Share of loans originated at different removes from the average for a month, based on origination date, for conventional 30yr loans in worst-to-deliver pools with FICO >=740 and LTV ≤ 80

Source: J.P. Morgan, Fannie Mae, Freddie Mac
Media Spending Down: Using the filings of public nonbanks as a guide, it is no surprise that the amount spent on advertising has gone down significantly since early 2022 ( Figure 111), making mortgage rates less front of mind for homeowners.
Figure 111: Spending on ads is well below the 2021 highs
Non-bank quarterly marketing / advertising expenses, $mm

Source: J.P. Morgan, company filings
Lack of Media Effect/Targeting: On the conventional side, it remains the case that rallies like the one in early 2024 are not driving any excitement in refi activity. In comparison, Ginnie originators have had to be more aggressive in their offerings to retain borrowers (and their MSR). One way to see the divide is in comparable refinance rates. Since October 2022, VA rates have been up to as much as a percentage point lower, while FHA rates have been 50bp lower of late ( Figure 112)
Figure 112: Rate/term refi WACs have been particularly low relative to GSE purchase rates for VA and FHA loans
Orig. WACs by issue month, split into GSE, FHA, and VA purchase and rate/term, %s
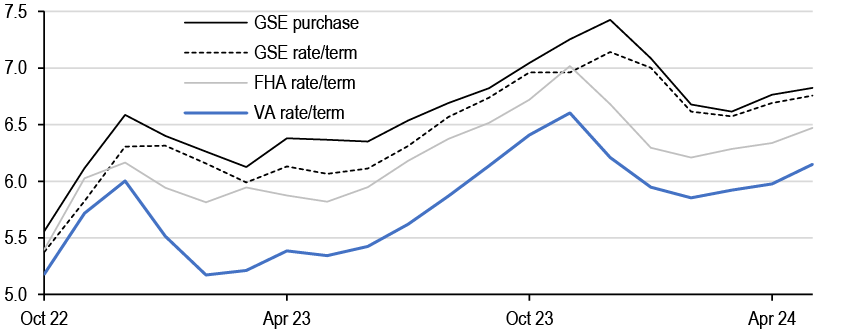
Source: J.P. Morgan, Fannie Mae, Freddie Mac, Ginnie Mae
Fewer appraisal waivers: There are a few factors that influence the granting of appraisal waivers, chief among them likely being the GSEs confidence in the accuracy of their automated valuation models. Looking just at the issuance data, the granting of waivers has declined substantially since 2019 for the few rate/term refis getting created, another potential friction relative to the latest refi wave ( Figure 113)
Figure 113: Appraisal waivers on refis are down relative to 2019, not just the pandemic era
Share of loans in worst-to-deliver pools, <=80LTV, that were given an appraisal waiver, by purpose

Source: J.P. Morgan, Fannie Mae, Freddie Mac
Shorter terms offer little rate solace: The inverted curve makes it that much more difficult to give better rates on common refi products like 15yrs and 20yrs. Using the issuance data, its easy to see the connection between curve slope and term of refis ( Figure 114). As a result, if there are any borrowers out there who refuse to extend their term with refis (and require a certain amount of rate savings), they are likely sitting on the sidelines during bouts of moderately lower rates. This would contribute to a flatter GSE s-curve today versus periods like 2020-2021.
Figure 114: Borrowers who do refi are almost exclusively going into a 30yr term
Comparing the share of 30yr rate/term refis against all product types (left, %) and 2yr Treasury minus 10yr Treasury rate (right, %)

Source: J.P. Morgan, Fannie Mae, Freddie Mac
This list of factors hopefully conveys our view that conventional s-curves aren’t flatter today for one single reason but a host of factors that can (and likely have) ebb and wane in influence over the rest of the year. Some of them are tied to the buyers who are seeing incentive (like SATO/relocking) and others to the origination environment (layoffs/ad spending/ curve shape). Together, they can continue to keep speeds contained into modest rallies though some of these hurdles would disappear into a larger drop in rates.
Discounts
For discount speeds, changes in trend tend to happen over years rather than months, moving in tune with demographics and the macro economy rather than near-term moves in rates. Still, monthly surprises tend to raise eyebrows. As we discussed at length a few weeks ago, the changes from month-to-month should largely be impacted by daycount and seasonal trends in EHS. Since those seasonals aren’t set in stone by month, and are influential, any rearrangement in them can cause misses in discount forecasts that are rectified over the next month or two.
We can look at this phenomenon more directly using recent results as a guide. Consider 2s and 2.5s from 2021 to avoid most aging ramp interference. We can see the “implied” seasonal change for each month by looking at the daycount adjusted move in SMM (100% = no change in SMM). This can be compared to our view of “normal” seasonal factors informed by past years. Figure 115 shows the comparison. In Feb. 24, for example, the empirically measured change was 123%, while normally we would only expect an increase of 106%. The next month, however, the implied change of 117% was well below our expected 131% increase, supporting an argument for rearranged speeds rather than a level shift higher.
Approaching this experiment from the other angle, Figure 116 shows the actual accumulation of daycount adjusted SMM starting from June 2023 against what our seasonal factors would have implied. Over the course of the year, the two measures diverged by just 0.1% SMM (a less than 2% difference) as actual speeds started slightly slower before moving slightly faster during 2024.
Figure 115: Seasonal factors are a rough guide and can shift by a month or two in any given year...
The change in SMM m/m post-daycount (x-axis) against our assumed seaonal factors (y-axis) over the past year
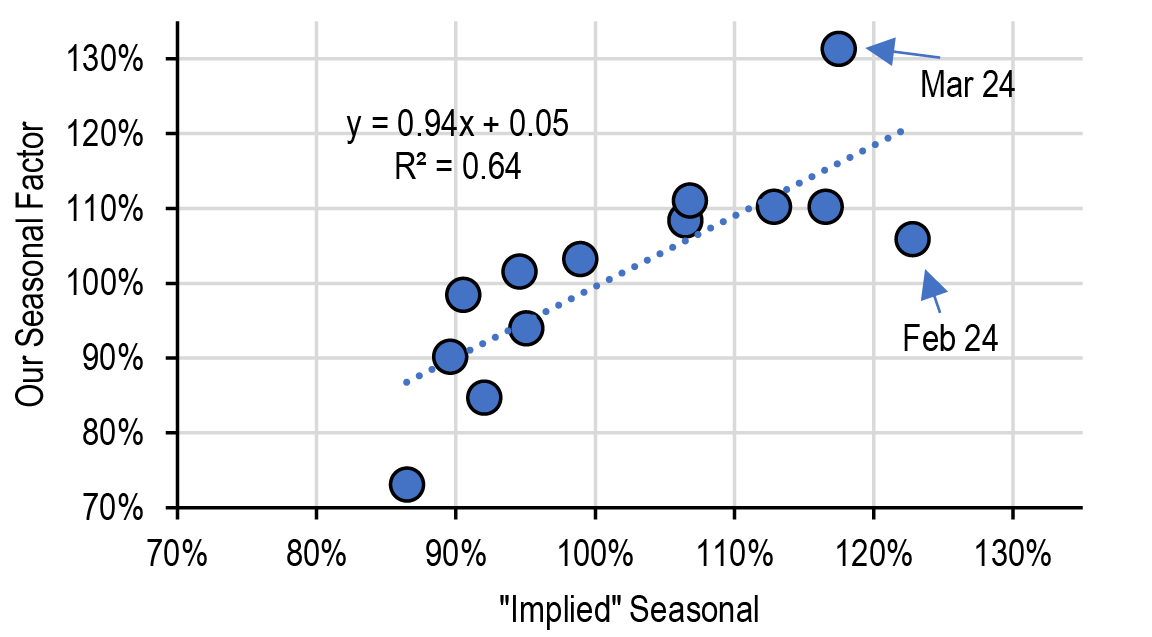
Source: J.P. Morgan, Fannie Mae, Freddie Mac
Figure 116: ...which should even out over a long time period if there isn’t a fundamental change in level
Cumulative change in SMM based on actual speeds (left, blue) versus what seasonal factors alone would predict (gray, left) and the difference (right)
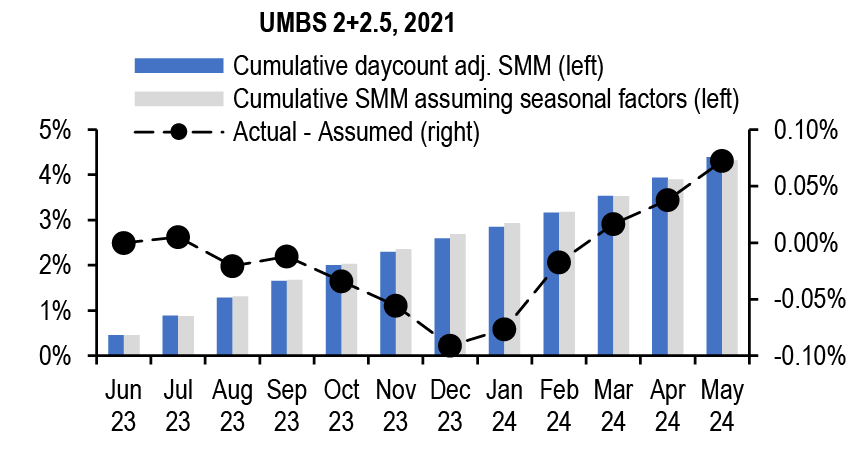
Source: J.P. Morgan, Fannie Mae, Freddie Mac
In derivs, valuations on 2s IO have moved in accordance with a cashflow that is becoming more predictable. Since the wides in October 2023, our index of 2020 2s IO bonds has tightened nearly 200bp in our model ( Figure 117). Beyond more certainty around the cashflow, a lack of new supply and updates to the YieldBook model likely contributed to the tighter spread level. It’s hard to argue for additional tightening from here on out, but these IOs still yield 6.4% with minimal duration concerns.
Figure 117: 2s IO has tightened in recent months, pointing to the predictably of the cashflow among other factors
2020 2s IO index Tsy OAS, bp

Source: J.P. Morgan
The most recent development impacting discount speeds is the surprise ruling from FHFA to allow Freddie to purchase closed-end second liens in only a limited trial with a cap of $2.5bn over eighteen months . When the proposal was first announced, there were concerns that cashouts would evaporate completely from lower coupons. The limited scope should alleviate those fears on the pool side. Of late, GSE total cashout volume has been running at nearly $5bn a month. Assuming 1/3 of that is new equity, it would take just three months to use up the capacity in GSE second lien, ignoring the additional limitation of the loan cap at under $80k ( Figure 118).
Figure 118: It would only take three months or so to use up the $2.5bn per program capacity of second liens at today’s rate of origination
Issuance of cashout loans by month, $bn
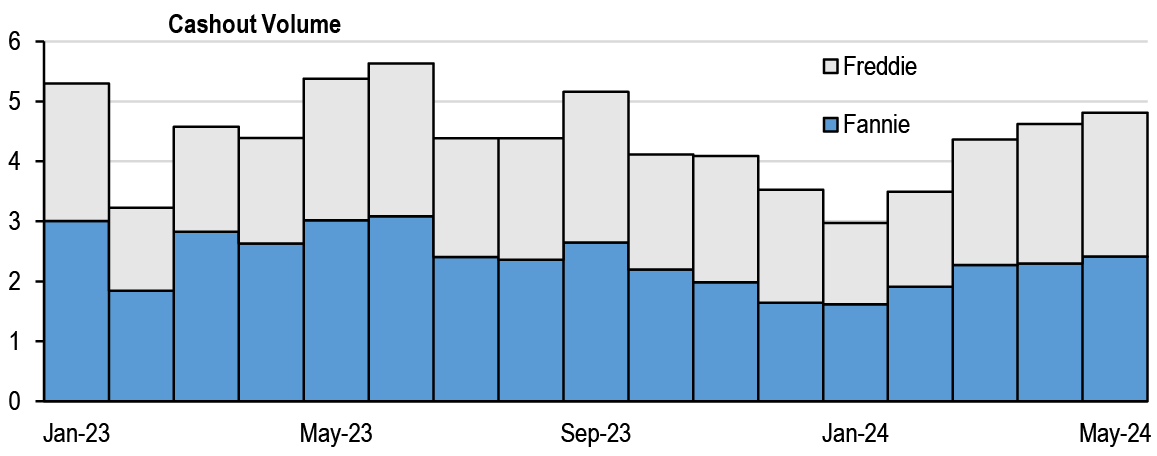
Source: J.P. Morgan, Fannie Mae, Freddie Mac
Ginnies
The rate path of 2023 put Ginnies in an interesting spot where the typical “peak” pool behavior was interrupted by prohibitively high rates, depending on the coupon. This was notable in 6.5s, where a decent amount were made towards the end of 2022 at near 7% WAC, but rates were near or above that level and trending in the wrong direction when they were first eligible to refinance. The rally heading into 2024 gave lenders a chance to refi borrowers in many of the pools that missed their peak month in January and February, leading to a plateau rather than a mountain in speeds. Figure 119 shows that plateau in table form, and also shows how those in-the-money pools have paid in the three months afterwards, typically averaging in the high 20s.
Figure 119: After the “plateau” in the first two months of the year, post-peak 6.5s have been averaging in the high 20s CPR
| G2 6.5 MA pools measured in 2024 | ||||||
| Prepay Month-> Issue Date |
Jan-24 | Feb-24 | Mar-24 | Apr-24 | May-24 | Mar-Apr 24 Avg |
| Nov-22 | 64 | 51 | 33 | 30 | 21 | 28 |
| Dec-22 | 69 | 60 | 35 | 25 | 20 | 27 |
| Jan-23 | 67 | 59 | 38 | 26 | 20 | 28 |
| Feb-23 | 65 | 56 | 30 | 35 | 23 | 29 |
| Mar-23 | 60 | 48 | 31 | 27 | 31 | 30 |
| Apr-23 | 65 | 53 | 34 | 27 | 20 | 27 |
| May-23 | 65 | 66 | 32 | 28 | 25 | 29 |
| Jun-23 | 23 | 75 | 39 | 30 | 27 | 32 |
| Jul-23 | 8 | 30 | 64 | 34 | 26 | |
| Aug-23 | 4 | 10 | 23 | 50 | 27 | |
| Sep-23 | 3 | 4 | 8 | 20 | 50 | |
Source: J.P. Morgan, Ginnie Mae
How do those speeds compare to other periods? One way to see it is to take a coupon with similar moneyness (or peak speeds) and see its post-peak prepays. 2.5s in 2021 are a decent comparison, printing in the mid-50s after the early 2021 backup in rates ( Figure 120). During the second half of 2021, 2.5 multi-issuer pools paid in the high 30s to low 40s. As a result, its fair to say that the Ginnie s-curve also seems less aggressive than it was during the most recent refi wave, even if that behavior is sometimes obscured by the initially high peaks.
Figure 120: Back in 2021, 2.5 pools paid in the high 30s/low 40s in the three months after their peak
| G2 2.5 MA Pools measured in 2021 | |||||||||||||
| Prepay Month-> Issue Date |
Jan-21 | Feb-21 | Mar-21 | Apr-21 | May-21 | Jun-21 | Jul-21 | Aug-21 | Sep-21 | Oct-21 | Nov-21 | Dec-21 | Avg 3m post-peak |
| May-20 | 74 | 64 | 59 | 35 | 33 | 39 | 37 | 39 | 40 | 39 | 32 | 29 | 53 |
| Jun-20 | 20 | 80 | 61 | 37 | 34 | 37 | 39 | 41 | 40 | 37 | 32 | 29 | 44 |
| Jul-20 | 5 | 21 | 79 | 39 | 35 | 33 | 39 | 43 | 40 | 39 | 32 | 28 | 35 |
| Aug-20 | 4 | 7 | 28 | 59 | 42 | 33 | 36 | 44 | 42 | 39 | 32 | 28 | 37 |
| Sep-20 | 3 | 4 | 9 | 18 | 52 | 35 | 35 | 40 | 42 | 38 | 32 | 28 | 36 |
| Oct-20 | 3 | 4 | 6 | 8 | 21 | 50 | 42 | 41 | 40 | 40 | 33 | 26 | 41 |
| Nov-20 | 2 | 3 | 5 | 8 | 10 | 21 | 56 | 44 | 42 | 41 | 33 | 29 | 42 |
| Dec-20 | 1 | 2 | 5 | 6 | 8 | 13 | 26 | 52 | 42 | 44 | 35 | 30 | 40 |
| Jan-21 | 1 | 2 | 3 | 5 | 6 | 11 | 14 | 25 | 52 | 37 | 32 | 28 | 32 |
Source: J.P. Morgan, Ginnie Mae
Relative value in FN 30 specs
There are opportunities for sizable OAS pickup across the spec space, although many options come with a heavy cost to ZV/carry. In Figure 121 and Figure 122, we show the OAS and ZV pickups across all coupons/specs, respectively, and circle the ones that provide a pickup in both (or a negligible ZV hit). The OAS gain/ZV loss tradeoff is most acute on higher coupons loan bals, where OAS pickups reach about 20bp on LLBs but come with a 40bp hit to ZV on 5.5s and 6s. Given that FN 5.5 and 6 TBA have ZV in the 120-130bp range, a 40bp hit leaves them with about as much as a belly FN 4.5/5, though with higher OAS as a baseline in addition to the significant pickup from loan balance convexity.
However, there is uncertainty around how durable the loan size prepayment protection will prove into rate rally scenarios. Generally, originators target bigger loans into refi opportunities, which helps protect smaller loan size collateral. This queuing effect may be less impactful now though because originators have excess capacity and balances on the higher coupons are not large enough to overwhelm this capacity. For investors that want to fade model risk, lower payup options like Texas and high LTV pools make sense. While they provide a smaller OAS pickup (~10bp), they do not come with any hit to ZV.
Figure 121: OAS pickups on FN 30 specs
Difference in Treasury OAS over corresponding TBA in OASis (research beta model), as of 6/26/2024 (bp)
| OAS Pickup | 2.0 | 2.5 | 3.0 | 3.5 | 4.0 | 4.5 | 5.0 | 5.5 | 6.0 | 6.5 |
| LLB | 34 | 18 | 23 | 18 | 15 | 13 | 20 | 17 | 19 | 30 |
| MLB | 24 | 12 | 15 | 13 | 11 | 8 | 15 | 13 | 17 | 30 |
| M125 | 22 | 15 | 16 | 12 | 11 | 6 | 14 | 13 | 16 | 25 |
| HLB | 21 | 13 | 14 | 9 | 8 | 2 | 10 | 10 | 12 | 21 |
| M175 | 20 | 11 | 12 | 9 | 6 | 1 | 9 | 7 | 10 | 21 |
| M200 | 15 | 7 | 10 | 9 | 6 | 0 | 6 | 5 | 10 | 14 |
| M225 | 12 | 8 | 11 | 8 | 4 | -3 | 5 | 4 | 8 | 14 |
| NY | -21 | -21 | -13 | -9 | -6 | -10 | 0 | 1 | 9 | 21 |
| FL | 7 | 4 | 7 | 6 | 5 | 1 | 5 | 2 | 5 | 9 |
| TX | 13 | 11 | 16 | 12 | 9 | 3 | 9 | 9 | 9 | 13 |
| INV | -9 | -7 | 0 | 4 | 6 | -1 | 4 | -1 | -1 | -1 |
| FICO | 0 | 2 | 11 | 13 | 11 | 3 | 9 | 8 | 12 | 22 |
| LTV95 | -2 | -6 | -1 | -3 | -3 | -7 | 0 | 4 | 14 | 25 |
Source: J.P. Morgan
Figure 122: ZV pickups on FN 30 specs
Difference in Treasury ZV spread over corresponding TBA in OASis (research beta model), as of 6/26/2024 (bp)
| ZV Pickup | 2.0 | 2.5 | 3.0 | 3.5 | 4.0 | 4.5 | 5.0 | 5.5 | 6.0 | 6.5 |
| LLB | 27 | 7 | 7 | -5 | -16 | -21 | -26 | -40 | -43 | -21 |
| MLB | 18 | 3 | 1 | -7 | -16 | -20 | -23 | -34 | -36 | -13 |
| M125 | 17 | 6 | 2 | -7 | -15 | -19 | -20 | -29 | -31 | -12 |
| HLB | 16 | 5 | 2 | -8 | -14 | -18 | -19 | -26 | -28 | -10 |
| M175 | 15 | 4 | 2 | -6 | -13 | -15 | -16 | -22 | -23 | -3 |
| M200 | 11 | 1 | 2 | -4 | -10 | -14 | -14 | -19 | -17 | -5 |
| M225 | 9 | 2 | 4 | -3 | -9 | -13 | -12 | -16 | -14 | -1 |
| NY | -24 | -28 | -23 | -22 | -20 | -17 | -15 | -19 | -12 | 11 |
| FL | 5 | 1 | 2 | -1 | -2 | -4 | -4 | -6 | -3 | 6 |
| TX | 12 | 8 | 12 | 6 | 2 | -2 | 0 | -1 | -4 | -1 |
| INV | -10 | -9 | -2 | 0 | -2 | -5 | -5 | -9 | -10 | -7 |
| FICO | -1 | 0 | 7 | 6 | 2 | -3 | -4 | -6 | -7 | 6 |
| LTV95 | -3 | -7 | -4 | -7 | -8 | -8 | -5 | -2 | 6 | 21 |
Source: J.P. Morgan
The lower coupon loan bals offer greater OAS pickup than the belly and well as positive ZV pickup, on account of faster built-in speeds making up for the payup. These seem like better overall value propositions than the belly loan bals. Our model sees wider OASs on lower coupons vs. the belly as a baseline, and the ZV cost on belly loan bals means that their ZV advantage is minimal (ZVs ~ 60bp across FN 2-3.5 loan bals and ~65 on FN 4-4.5 loan bals). Texas, Florida, and low FICO pools seem like better options in the belly, still providing an OAS pickup without the cost to ZV.
On the seasoned pool front, some OAS and ZV pickup can be gained on the lower coupons by buying 2020 and 2021 vintage ( Figure 123 and Figure 124). Then across the belly there are opportunities for sizable OAS pickup by buying 2019 and earlier vintage collateral, at the price of some ZV spread. These pools make sense for investors that want long-term exposure to the belly of the stack. The OAS pickups are quite large (up to ~35bp on certain vintages and coupons), and should manifest in outperformance over TBA into most rate scenarios.
Recommendations
1. Seasoned and loan bal in lower coupons (sizable pickup)
2. FL/TX across the stack (mild payup/mild pickup)
3. Low FICO pools in the belly, high LTV in higher coupons (mild payup, mild pickup)
Figure 123: OAS pickups on FN 30 seasoned non-spec collateral
Difference in Treasury OAS over corresponding TBA in the OASis (research beta model), as of 6/26/2024 (bp)
| OAS Pickup | 2.0 | 2.5 | 3.0 | 3.5 | 4.0 | 4.5 | 5.0 | 5.5 | 6.0 |
| 2023 | 11 | 12 | |||||||
| 2022 | 5 | 5 | 6 | 9 | 7 | 14 | 20 | 22 | 25 |
| 2021 | 16 | 16 | 19 | 29 | |||||
| 2020 | 20 | 17 | 11 | 18 | 21 | ||||
| 2019 | 14 | 8 | 13 | 16 | 27 | ||||
| 2018 | 12 | 14 | 25 | 28 | |||||
| 2017 | 11 | 12 | 19 | 25 | |||||
| 2016 | 15 | 15 | 23 | ||||||
| 2015 | 17 | 15 | 20 | ||||||
| 2014 | 19 | 20 | |||||||
| 2013 | 31 | 27 | 22 | ||||||
| 2012 | 34 | 32 | 26 | ||||||
| 2011 | 36 | 26 | 27 | ||||||
| 2010 | 28 | 27 | |||||||
| 2009 | 30 | 27 |
Source: J.P. Morgan
Figure 124: ZV pickups on FN 30 seasoned non-spec collateral
Difference in Treasury ZV spread over corresponding TBA in OASis (research beta model), as of 6/26/2024 (bp)
| ZV Pickup | 2.0 | 2.5 | 3.0 | 3.5 | 4.0 | 4.5 | 5.0 | 5.5 | 6.0 |
| 2023 | -2 | -2 | |||||||
| 2022 | 2 | 1 | -1 | 0 | -3 | 2 | -3 | -5 | 2 |
| 2021 | 11 | 8 | 6 | 12 | |||||
| 2020 | 15 | 10 | -1 | -3 | -8 | ||||
| 2019 | 8 | -4 | -7 | -13 | -14 | ||||
| 2018 | -10 | -16 | -18 | -31 | |||||
| 2017 | -5 | -11 | -16 | -21 | |||||
| 2016 | -2 | -11 | -15 | ||||||
| 2015 | -2 | -13 | -19 | ||||||
| 2014 | -10 | -21 | |||||||
| 2013 | 7 | -6 | -21 | ||||||
| 2012 | 9 | -2 | -20 | ||||||
| 2011 | 0 | -21 | -33 | ||||||
| 2010 | -21 | -34 | |||||||
| 2009 | -20 | -35 |
Source: J.P. Morgan
Week in Review
- MBA Weekly Survey: For the week ending June 21, the purchase application index rose 0.2% w/w and was 13.1% lower than year ago levels, while the refinance index fell 0.1% w/w and was 11.9% higher than the 3-month trailing level (daycount-adjusted, not seasonally-adjusted) ( Figure 125 & Figure 126)
- Freddie Enhanced Primary Survey: For the week prior to June 27, 2024, 30-year conventional conforming fixed-rate mortgages averaged 6.86%, down 1bp from the previous week ( Figure 127).
- Primary dealer specified pool positions rose to $414.7bn (-$4.9bn w/w) as-of close trading June 19. Including TBA positions of -$355.3bn, dealers were long $59.4bn (+$0.5bn w/w) pass-throughs. Other agency MBS holdings rose $1.3bn to $29.2bn.
- Fixed-rate agency gross and net issuances were $88.9bn and $14.6bn, respectively, in May. June gross supply currently stands at $94.1bn ( Figure 128).
- Our OAS optimized portfolio favors FNCL 1.5s-2s, FNCI 1.5s, and G2 2s, while reducing exposure to FNCL 2.5s-3s & 4s-6.5s and G2 2.5s & 4.5s-5.5s. Our optimized portfolio achieves an OAS of 40 with an OAD of 5.58 versus the index’s OAS of 37 with OAD of 5.37. Cohort weights are limited to 40% redistributions in our optimized portfolio, while duration cannot change by more than 1 year and convexity can be no worse than the index ( Figure 129 & Figure 130).
Figure 125: MBA Purchase Index, calendar year overlay with daycount adjustments
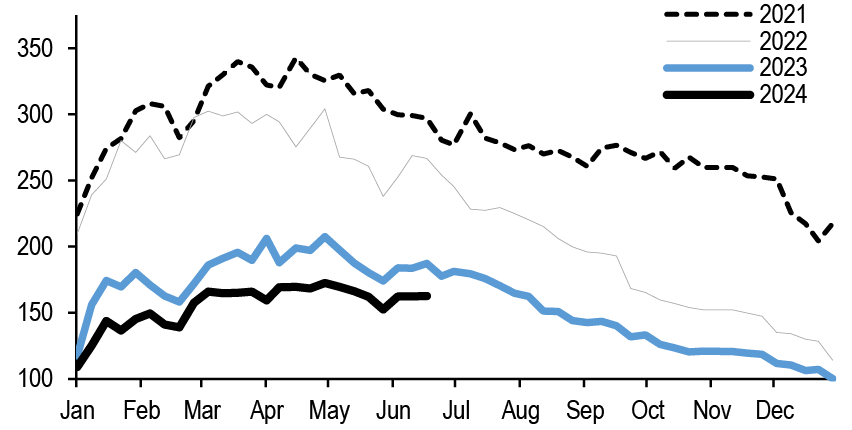
Source: J.P. Morgan, MBA
Figure 126: MBA Refi Indices, seasonally adjusted
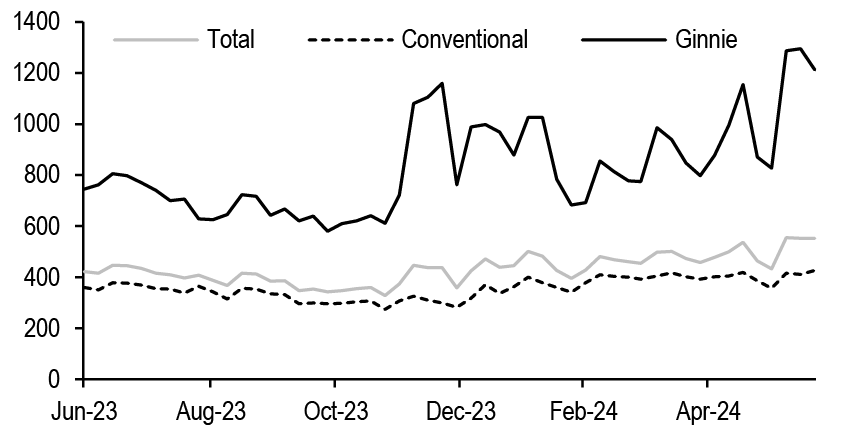
Source: J.P. Morgan, MBA
Figure 127: Primary mortgage rates, %
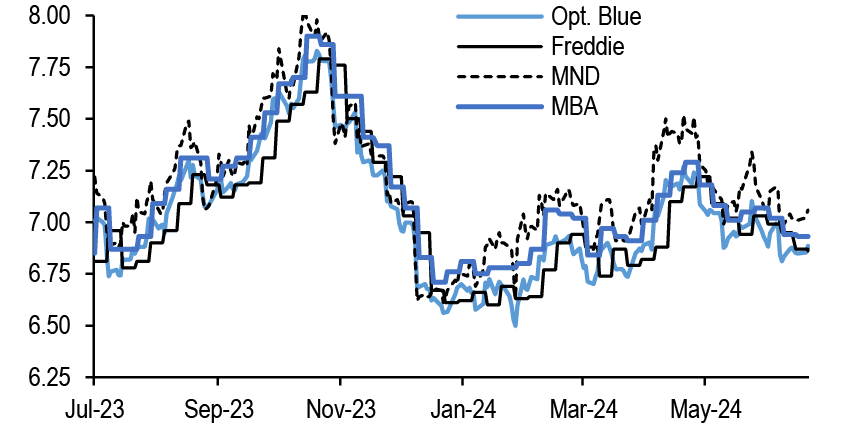
Source: J.P. Morgan, Optimal Blue, Freddie Mac, Mortgage News Daily, MBA
Figure 128: Gross and net fixed-rate MBS monthly issuance, $bn
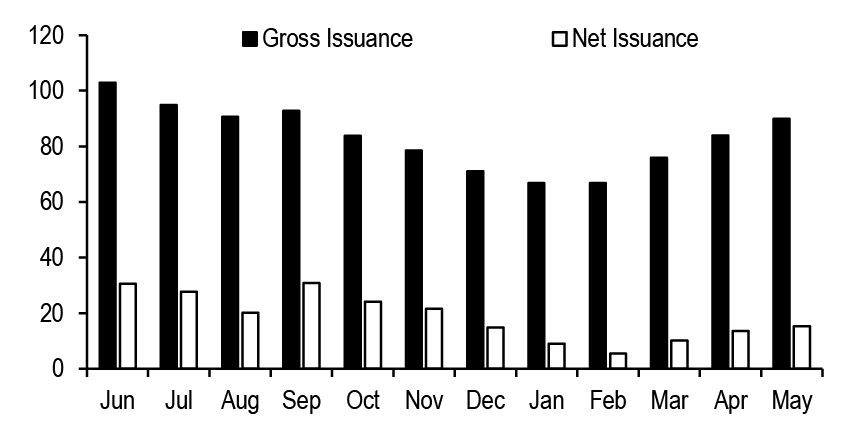
Source: J.P. Morgan
Figure 129: Weights of the actual index and an OAS optimized portfolio
Weight distribution by coupon and product as for an OAS optimized portfolio as of 6/26/2024. Weights of each cohort are allowed to be shifted by at most 40%.

Source: J.P. Morgan
Figure 130: Weight redistribution for the OAS optimized portfolio
Difference between optimal and actual weights by coupon and product for an OAS optimized portfolio as of 6/26/2024. Weights of each cohort are allowed to be shifted by at most 40%.

Source: J.P. Morgan
2024 RMBS Credit Midyear Outlook
Unwinding the first half?
- Mortgage credit spreads are already retracing wider from their tightest levels this year. We expect further widening into year-end as we enter a slower GDP-growth and election period, although a possible Fed rate cut could help
- 2.0 supply picked up as execution improved and banks became less competitive on loans. Expect supply to remain elevated and PT price spreads to widen to 1-12bk by year-end
- Non-QM has been shaped by insurance demand for loans and securities. Agency MBS 7% coupon nominal spreads hover around 120-125bp, which is where AAA non-QM has priced. Expect to see AAAs widen out to 150-175bp
- Strong housing fundamentals look fully priced into CRT spreads as well. Expect spreads to be tied to labor market strength, but limited supply could keep spreads firmer than at the top of the capital stack
- ‘21/‘22 vintage CRT B2 spreads are cheap to new issue collateral, while spreads are more in line with duration for B1s
- Delinquencies have been increasing in recent vintage non-QM and CRT, although they have moderated slightly over the last few months. We do not anticipate material losses from the recently revised Flex Mod in CRT subs
- We revise our home price forecast higher to 5.5%. The narrative remains low supply, although new home inventory is piling up as affordability remains a challenge
- We look for $110bn of gross supply for 2024, up from $97bn previously
Figure 131: RMBS credit issuance to date...
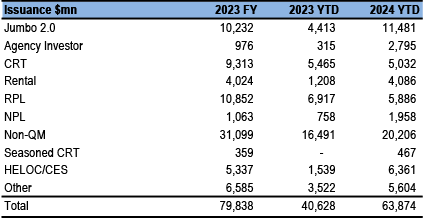
Source: J.P. Morgan, Bloomberg Finance L.P.
Figure 132: ...and spreads
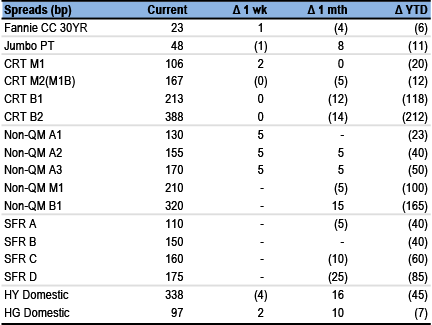
Source: J.P. Morgan
Note: Includes our on-the-run indices. Jumbo is TOAS, non-QM and SFR are spread to treasuries. CRT is SOFR DM@10CPR. HG/HY are spread to treasuries.
Market Commentary - Credit curve flattening to stall in second half
While 2023 was a year of significant spread curve flattening, we continued to see tighter spreads in 1H24. Spreads across securitized products shifted from cheap/fair to rich. Not much sits in the positive z-score space anymore ( Figure 133). It shouldn’t be a surprise then that spreads are already retracing wider from their tightest levels this year. Could this just be a quarter-end head fake or a real shift wider? We think interest levels at the tights of this year were waning. Jumbo 2.0 price spreads went inside of a point back but have now jumped wider to $1-04 back. Recent deal pricing showed less interest in LCF paper, where spreads widened to 190bp (Tsy@15c). This, in turn, likely moved the pass-through wider. We expect 2.0 pass-through price spreads to soften to $1-12 back, which is more aligned with a 200bp LCF (based on a two year regression of price spreads with LCF spreads). This would put the jumbo pass-through TOAS back into the 70s, a level where investors had a much easier time deciding whether to add (picking up 35-40bp over agency MBS).
There are some major factors to consider with our spread targets. Our targets are wider for year-end. This is, in part, linked to the belief that spreads are just too tight and hard to support. Moreover, we are heading into a period where GDP growth is expected to slow. This is typically a spread widening event. We also have an election (more volatility) and perhaps Fed rate cuts, which have opposing effects. We feel much better setting a price target for October and leaving November/December as a wildcard. The good news is that the consumer remains strong and home prices should remain resilient, despite lofty levels.
Figure 133: Securitized products shifted from cheap/fair to rich in 1H24
Z-score - number of standard deviations rich/cheap to 5yr spread average (3yr average for CRT)
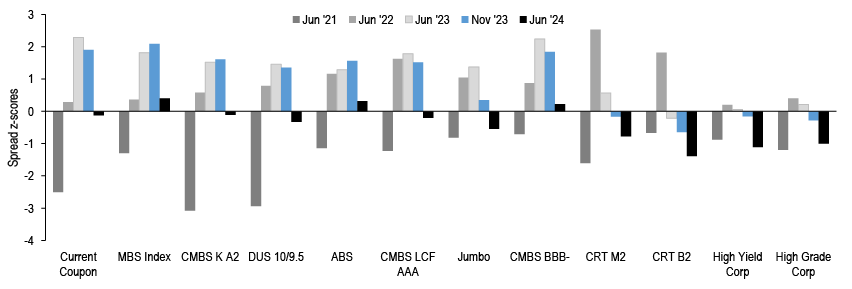
Source: J.P. Morgan
Non-QM spreads are also tight, led, in part, by consistent insurance buying in loans and securities. Anecdotally, demand has slowed and this could pressure spreads a bit. Interestingly, agency MBS 7% coupon nominal spreads hover around 120-125bp. At current rates, model long-term speeds for 7s are roughly 25-30c. These are a reasonable comparison for non-QM paper, albeit absent an issuer call option and lower coupon/carry. New issue non-QM gross WACs haven been roughly 8.5% with 6.5% coupons. Spreads tightened from 150-160 (25c/call) in January to 120-125bp now, depending on the deal. Regardless, this is right on top of TBA 7s ( Figure 134). Running non-QM to full maturity gets you another 40bp, and the spread pick-up is more compelling. However, we need to look at this from an OAS perspective. Our recently developed non-QM prepayment model gives a solid advantage to non-QM. For example, we see OAS as 107bp (to modelled call) with 7s OAS as 23bp. However, this is a lot for investors to get comfortable with when very few prepay models for non-QM exist. Investors buy in to slower empirical s-curves and no call scenarios ( Figure 135). Perhaps investors won’t believe all of that OAS, and in fact, most are likely not using an OAS framework at all, yet. Moreover, the models haven’t been tested into a rate rally and when investor loans exit the prepayment penalty window. Consequently, we expect to see non-QM spreads widen back out to 150-175bp area. This would put model OAS closer to 120bp and leave plenty of room for model error.
Figure 134: New issue non-QM spreads to maturity pick under 60bp nominally to TBA 7s, but only 20bp to call
Non-QM 2023 vintage AAA A1 spreads to treasury 25c/mty and 25c/call vs. FN 7s spread to treasury (bp, to model speeds of ~30c)
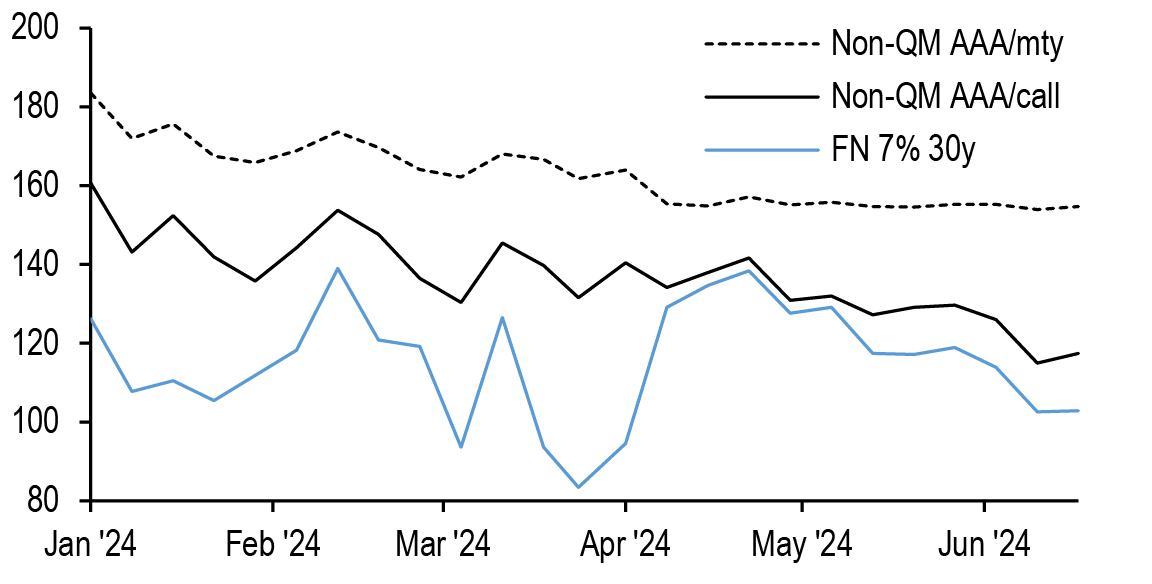
Source: J.P. Morgan
Figure 135: Agency mortgages are broadly more callable than non-QM collateral
S-curves for agency MBS and non-QM by documentation type, for 6-36 WALA, 2021-present period (non-QM still in prepayment penalty window)
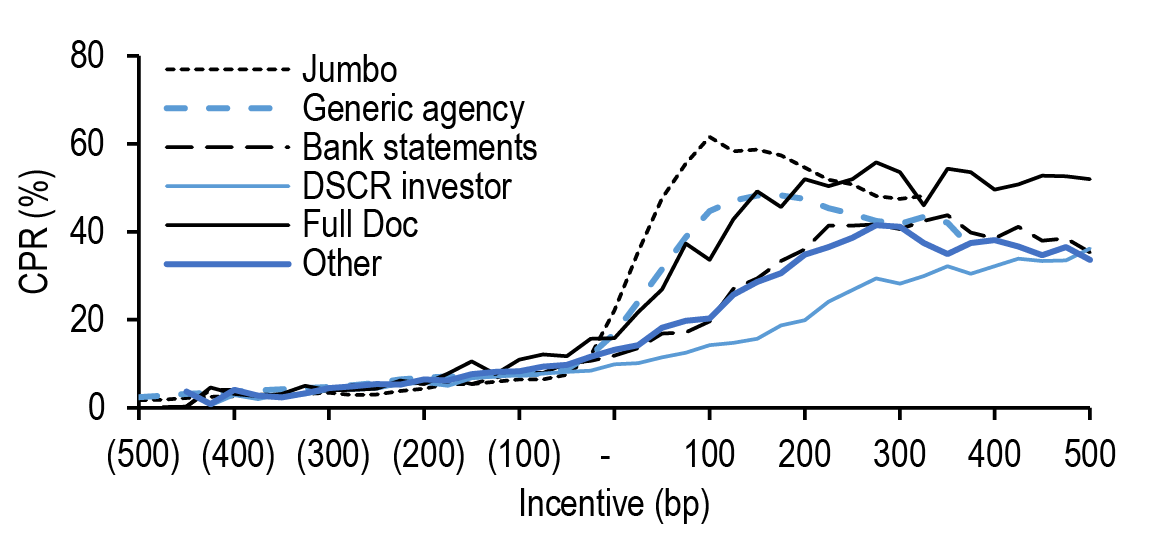
Source: J.P. Morgan, Fannie Mae, Freddie Mac, Black Knight, CoreLogic
Figure 136: Non-QM picks over 80bp OAS to agency MBS and 60bp OAS to 2.0. However, models are new and investors are not likely to buy-in fully to the results yet. More comfort will form as we see non-QM exit prepayment penalty windows and into a rate rally
OAS analysis comparing agency MBS, jumbo and non-QM

Source: J.P. Morgan
At this point, strong housing fundamentals look fully priced in. We expect mortgage credit spreads to be more rangebound and tied to labor market strength and the potential for Fed rate cuts later this year. While the top of the capital structure appears to have room to widen, technicals in the form of a limited supply of mortgage credit (e.g. PLS subordinates and CRT) could keep spreads a bit firmer. Calls and tenders in CRT have most investors looking at the bonds as having a 5yr (or shorter) maturity. We continue to see ‘21/‘22 vintage CRT B2 spreads cheap to new issue collateral ( Figure 138). Investors seem to prefer the increased credit enhancement of recent issue deals (recall B2 enhancement was increased to 1% from 30-70bp in earlier vintages). We think the extra home price appreciation and call/tender potential of ‘21/‘22 vintages makes them cheap to ‘24. However, for B1s, spreads appear to be a bit more in line with seasoning as credit enhancement is less in focus ( Figure 137).
Figure 137: Spreads are more in line with duration for CRT B1s, with new issue looking cheap-to-fair...
CRT B1 current DM@10c to call vs. WAL by vintage (bp)
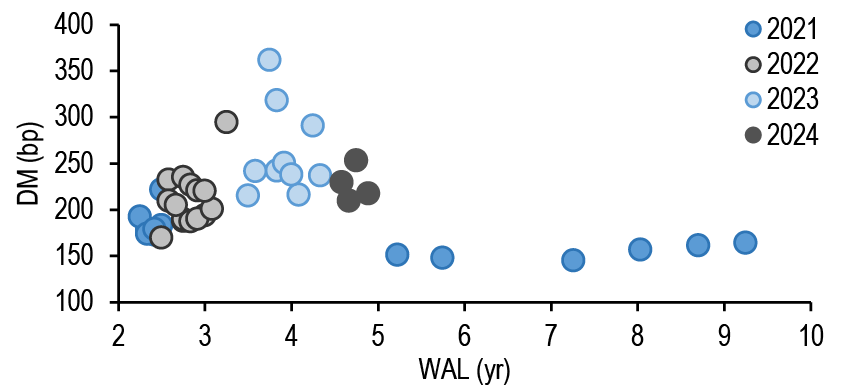
Source: J.P. Morgan
Figure 138: ...whereas new issue B2s looks a bit more expensive relative to 21/22 vintages. Investors are paying for higher CE, despite the shorter profile and accumulated equity of more seasoned paper
CRT B2 current DM@10c to call vs. WAL by vintage (bp)
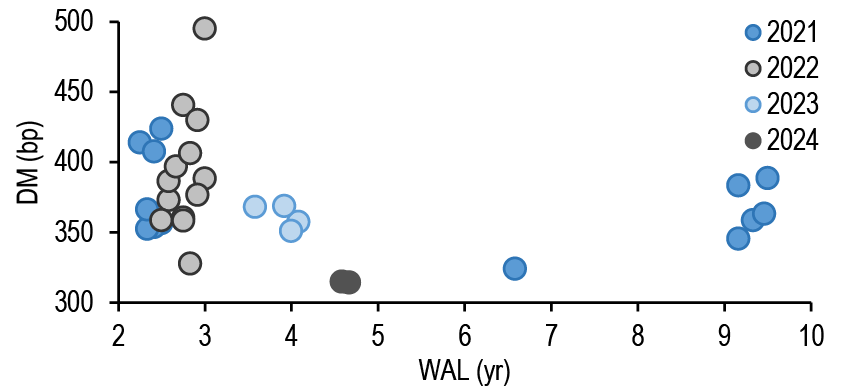
Source: J.P. Morgan
We revise our home price forecast higher to 5.5% for 2024. YTD home prices, through May, are 3.3% ( Figure 139). With seven months remaining and the stronger summer months still to come, our forecast may still be too low. The narrative remains low supply. However, new home inventory is piling up as affordability remains a challenge. Currently, about 100k new homes are being delivered/month ( Figure 140), with about 52k being sold (New Home Sales is running at 619k/year or 52k/month). If current delivery remains the same and demand holds, excess supply would grow at about 580k homes/year. Builders are already pulling back on forward builds (housing starts are declining) to mitigate but if rates remain at elevated levels well into 2025, home prices and builders are likely to suffer. Pace will be key, given that we continue to argue that the U.S. has underbuilt by about 3.5 million units since 2015 (household formation has been outpacing net delivered homes).
Figure 139: Expect home prices to be up 5.5% in 2024
Historical and projected home price growth for the Case-Shiller HPI Index

Source: J.P. Morgan
Figure 140: Months of supply of new homes is running high. Completions are adding about 100k per month. This can be a source of supply pressure, but builders are already pulling back and homes under construction/not started can be moderated
New Home Inventory (Completed, Under Construction and Not Started, in 000s, monthly SAAR, lhs), months of supply of new homes (rhs)
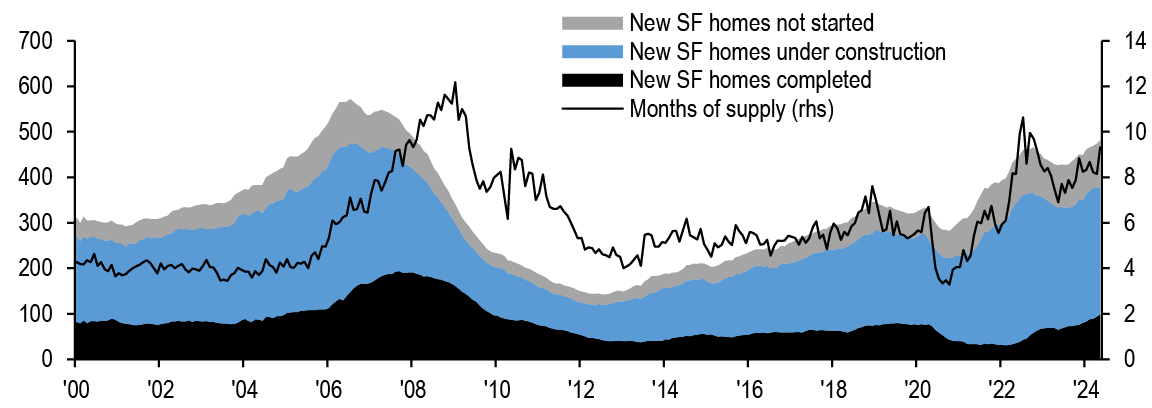
Source: J.P. Morgan, U.S. Census
Jumbo: More supply on the way
Jumbo 2.0 supply picked up in the first half of this year, with YTD prime jumbo issuance totaling $10.3bn, just over last year’s total of $10.2bn. Agency investor issuance stands at $2.7bn, surpassing last year’s total of just under $1bn. Rates below 2023’s peak and tighter spreads have made for more favorable execution levels in 2.0. Furthermore, banks have been less competitive on loans, adding to the securitization supply. The increase in bank holdings has tapered; banks added $53bn in residential loans YoY, far lower than the $204bn added the previous year ( Figure 141). As such, we are raising our 2.0 issuance forecast slightly to $24bn for 2024.
Figure 141: The increase in bank holdings has tapered; banks added fewer residential loans YoY than the previous year
Commercial bank holdings of residential real estate loans, not seasonally adjusted ($bn)
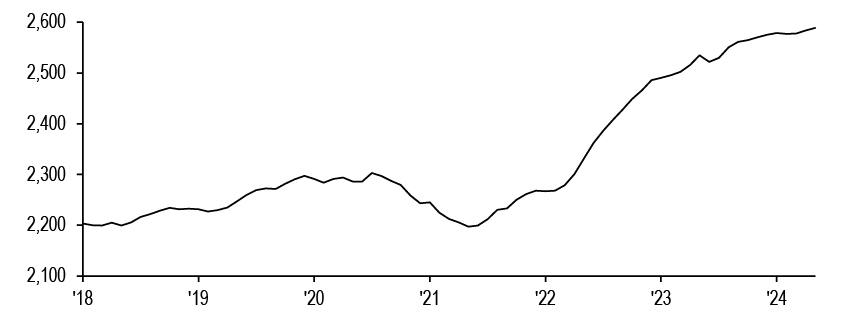
Source: J.P. Morgan, FRED
As background, banks increasing retail loan holdings have historically driven the retail rate lower than the correspondent and broker rate. This is clear in Black Knight’s non-conforming jumbo rate, which largely captures retail loans ( Figure 142 and Figure 143). Meanwhile, Optimal Blue’s jumbo and conforming rates largely reflect correspondent and broker channels. While the retail rate continues to be lower than the broker/correspondent rate, the spread between the two has decreased. The spread now stands at 80bp versus the last peak of 155bp in Oct ‘22 and 112bp in Nov ‘23, pointing to lower bank demand as of late. As banks remain on the sidelines for now, we expect 2.0 securitization volumes to remain steadily higher than last year. That said, the strong insurance bid on whole loans is still likely to limit supply, especially for agency investor.
Figure 142: Black Knight’s non-conforming jumbo rate largely captures retail loans
Optimal Blue jumbo and conforming rates vs. non-conforming jumbo rates from Black Knight’s McDash database (%)
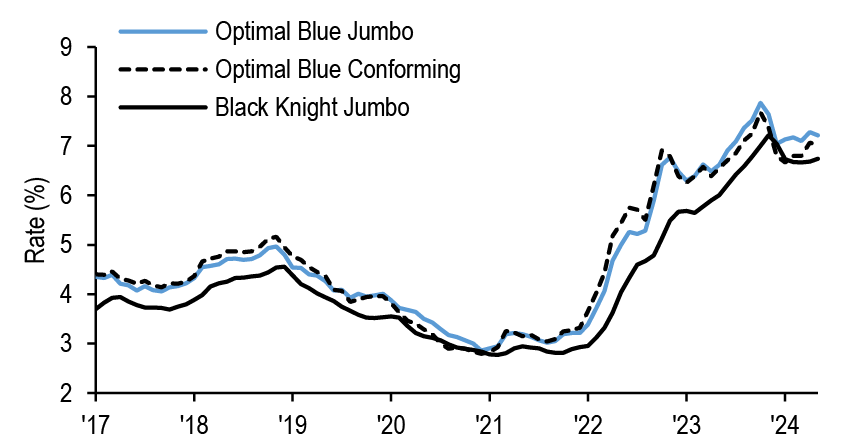
Source: J.P. Morgan, Optimal Blue, Black Knight
Figure 143: The spread between retail and correspondent/broker has decreased, pointing to lower bank demand
Non-conforming jumbo rates by origination channel (%)
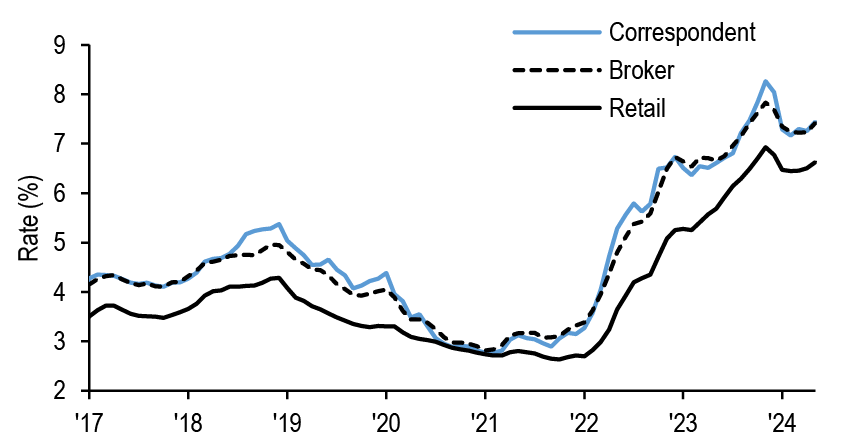
Source: J.P. Morgan, Black Knight
Better execution for PLS 2.0 versus the GSEs has led to a higher percentage of conforming jumbo collateral in recently issued deals ( Figure 144). With the increase in loan limits in 2024 and the median home price continuing to reach new highs (Apr ‘24 saw an all-time high of $389k), we have also seen an increase in the average original loan size of pools ( Figure 145). This could imply more convexity, and potentially faster speeds if we see a rate rally; non-conforming jumbo convexity has been marginally worse than conforming jumbo over the last year.
Figure 144: We have seen a higher percentage of conforming jumbo collateral in recently issued deals
% conforming jumbo by deal issue date. Each dot represents a prime jumbo deal
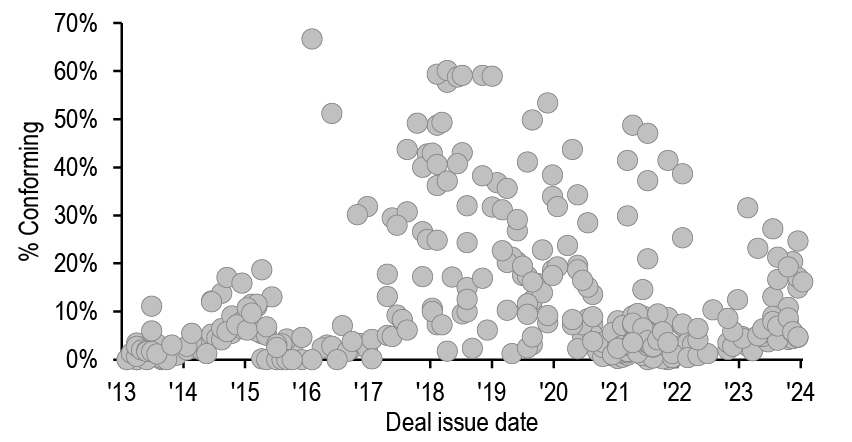
Source: J.P. Morgan, CoreLogic
Figure 145: We have also seen an increase in the average original loan size of pools
Average original loan size ($) in prime jumbo collateral by origination date
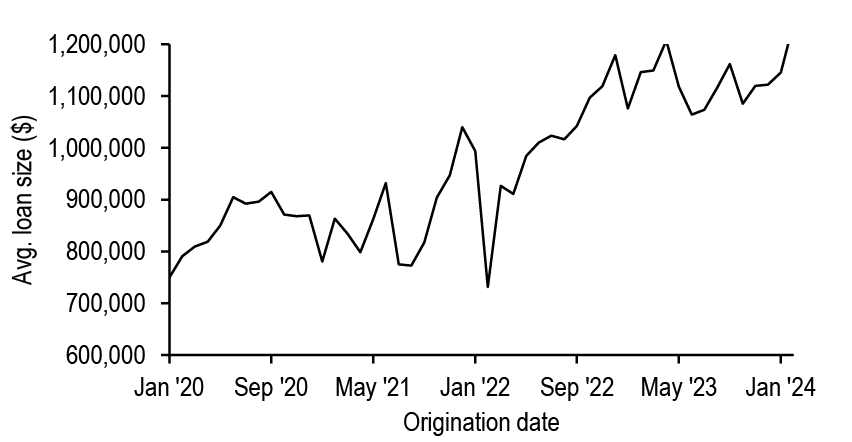
Source: J.P. Morgan, CoreLogic
For now, higher coupon jumbos are less reactive to incentives in rates, with lower negative convexity in the 2023-24 performance period than in prior years ( Figure 146). At the same incentive levels, deeply out-of-the-money jumbo pays marginally faster than in the 2021-22 period, while 50bp in-the-money jumbo pays roughly 25c versus 40c in prior years.
Figure 146: For now, higher coupon jumbos are less reactive to incentives in rates
S-curves for securitized prime jumbo, split by performance year
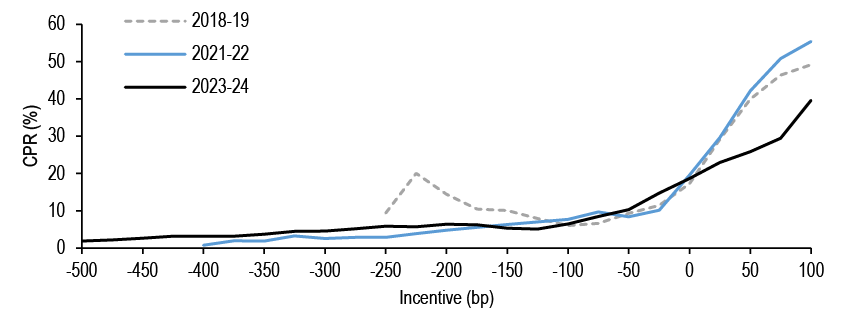
Source: J.P. Morgan, CoreLogic, Optimal Blue
Meanwhile, jumbo spreads have widened out relative to May’s tights, with higher coupon PTs at roughly a point back of TBA. PTs continue to offer 25-40bp of TOAS pick-up relative to same coupon agency MBS ( Figure 147). Still, this spread is at the lower end of historicals. Our on-the-run jumbo PT index shows that the spread between jumbo PT and same coupon TBA TOAS last peaked at 52bp in Jan ‘24, wider than today’s 24bp for 6cpn PTs. As mentioned, we expect some softening in the space as investor interest declines and see the PT widening to 1-12bk. This should push the TOAS closer to 70, a more attractive level relative to agencies.
Figure 147: Jumbo PTs continue to offer 20-40bps of OAS pick-up relative to same coupon agency MBS, although this spread is at the lower end of historicals
Jumbo vs. agency model runs by coupon

Source: J.P. Morgan
Non-QM: The models are coming
Primary non-QM rapidly rebounded this year with $20bn issued YTD. Over the last two years, the sector has been shaped by insurance demand for loans. The securitization share dropped from 67% in 2022 to 54% last year. Insurance demand has been strong, however, the collateral in securitizations has not materially changed from 2023. Bank statement and DSCR investor loans still make up roughly a third of monthly originations, with ‘other’ doc programs contributing another third ( Figure 148). The share of purchase loans, which have, on average, 10%-pts in higher LTVs than cash-out refis, has increased. Meanwhile, the share of low FICO (<700) collateral has dropped. Borrower FICO scores have, in fact, increased to 740. Additionally, DSCR ratios have not seen further decreases this year and the share of no ratio loans have held steady at 10-15%. Non-QM loans have significant reserve requirements. Reserves have been decreasing since 2021, but the average reserve account for purchase loans is still relatively high at $300k.
Figure 148: Bank statement and DSCR investor loans still make up roughly a third of monthly originations, with ‘other’ doc programs contributing another third
Origination ($bn) by doc type
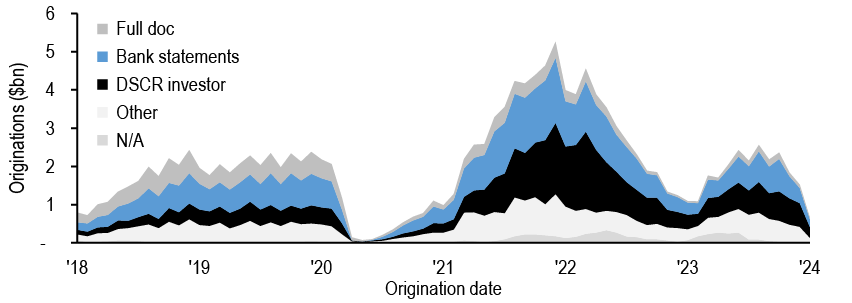
Source: J.P. Morgan, CoreLogic
Non-QM delinquencies have been increasing since mid-2022. Recent vintages have been underperforming versus seasoned vintages at the same loan age. Generally, this has been evident across all FICO bands, but low credit borrowers have seen the highest rise in DQ rates. ‘Other’ doc types also tend to have the highest DQ rates, followed by bank statement and DSCR investor loans. Some have attributed rising DQs to insurance portfolios absorbing significant a supply of whole loans. Insurance portfolios tend to have a cleaner credit box than the broader securitization market, but it is tough to prove that adverse selection is happening in deals as we do not have access to insurance loan portfolios and the credit profile in non-QM deals has not materially worsened. Along with rising DQs, foreclosures have also been increasing. Loans are typically reported as 90+ DQ for 2-3 months before being referred to foreclosure, and roughly 1% of ‘21 and ‘22 vintage loans were reported to be in foreclosure as of the June remit ( Figure 149). The average FICO of borrowers in foreclosure is 700, and loans stay in foreclosure for about 2-5 months.
Figure 149: Foreclosures have also seen an increase, with 1% of ‘21 and ‘22 vintage loans reported in foreclosure as of the June remit
Delinquency status of outstanding 2021 to 2023 vintage non-QM loans
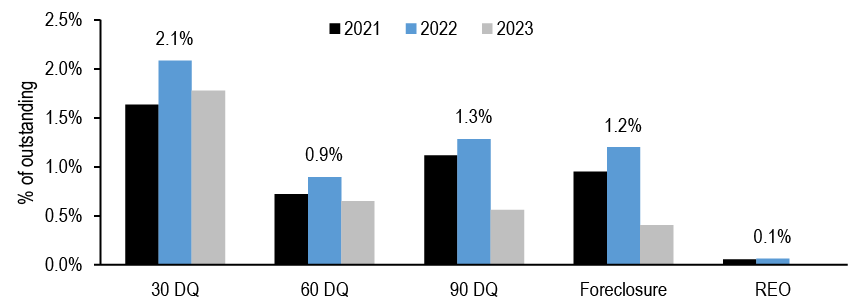
Source: J.P. Morgan, CoreLogic
While delinquencies have been increasing, investors have not been particularly concerned about losses. Figure 150 shows the share of ever 60+ DQ loans paid off by loan origination year. A vast majority of ever 60+ DQ loans paid off without a severity. We have identified only ~250 loans that liquidated with a loss in non-QM since 2015. Average severities have been 10-15%. We do not anticipate current DQs to translate into losses, but we look out for any pro-rata deals potentially failing the DQ trigger, which would result in classes below AAA turning sequential. Deals fail the DQ trigger when 6m average of 60+ DQs and past 12 months of mods, combined, exceed 10-20%. This threshold increases over time. At this point, no deal is close to the DQ trigger failure threshold.
Figure 150: A vast majority of ever 60+ DQ loans paid off without a severity. We have identified only ~250 loans that liquidated with a loss in non-QM since 2015
% of loans which paid off w/ and w/o severity
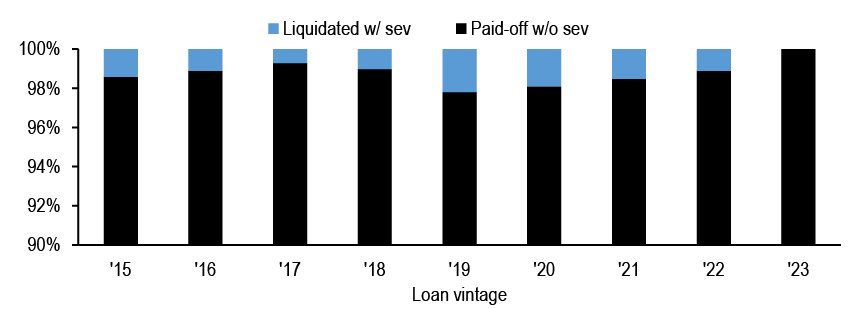
Source: J.P. Morgan, CoreLogic
Prepayment s-curves have significantly flattened in non-QM. Borrowers with high coupons have not been as reactive to incentive as historical performance might have suggested. Higher coupons have been printing less than the pricing assumption of 25 CPR while lower coupons have been slower than what investors have priced in. Discount ‘22 vintages have been paying under 8 CPR. We notice less of a difference in prepays among doc type in ‘22 vintage loans ( Figure 151). Meanwhile, DSCR investor loans are paying a few CPR slower in the recent ‘23 vintage ( Figure 152).
Figure 151: We notice less of a difference in prepays among doc type in ‘22 vintage loans
2022 vintage S-curves in the 2023-2024 period with incentive calculated over the conforming rate
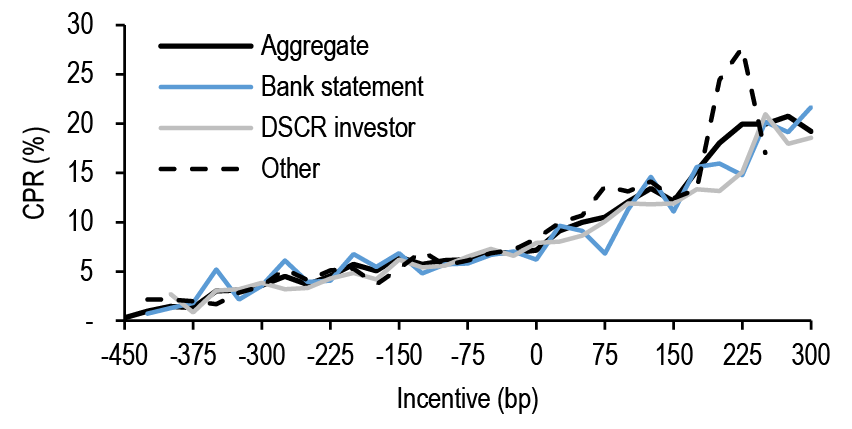
Source: J.P. Morgan, CoreLogic
Figure 152: Meanwhile, DSCR investor loans are paying a few CPR slower in the recent ‘23 vintage
2023 vintage s-curves in the 2023-2024 period with incentive calculated over the conforming rate
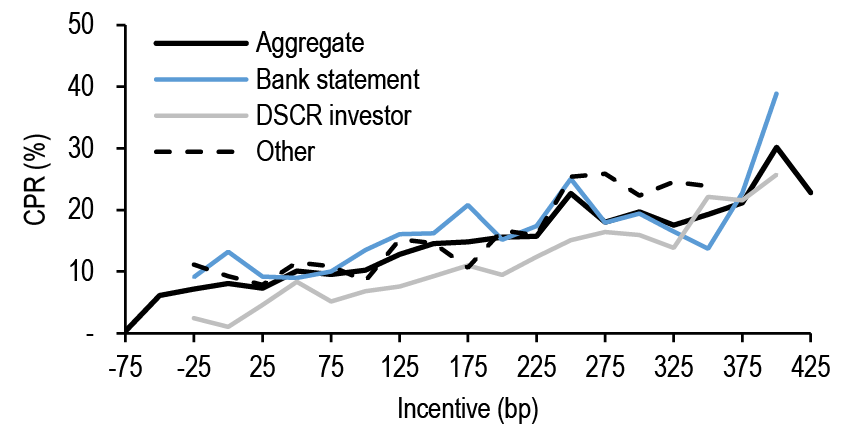
Source: J.P. Morgan, CoreLogic
Prepayment and call assumptions have significantly varied across the investor base as models are not as robust here as in agency MBS or jumbo 2.0 given the short history of the sector. We have been working on a non-QM prepayment model (with our Quantitative Research team) over the past several months. Figure 153 shows preliminary results of our model across the coupon stack. The model structure is similar to our other prepayment models where rate incentives are combined with pool level credit characteristics to generate prepayment, default, and severity vectors. The model is calibrated on non-QM performance since 2015.
In higher coupons, the model is projecting slower prepays than the pricing assumption. AAAs in 9% WAC deals show ZVs at 150bp area vs. 100bp of OAS to the modeled call scenario. Lower coupons, meanwhile, show slower prepays than the market assumption of 8 CPR with 30-60bp of OAS, but these deals do not carry much call option cost. Our model prefers mid-stack 5-6% WAC deals that offer low to mid-100bp of OAS to the modeled call scenario. Note that these are still preliminary model results, subject to minor adjustments.
Figure 153: Preliminary results of our non-QM model show mid-stack 5-6% WAC deals offering low to mid-100bp of OAS to the modeled call scenario
Using J.P. Morgan non-QM prepayment model

Source: J.P. Morgan
CRT: Tenders and calls limit supply
CRT issuance has reached $5bn YTD. We anticipate the GSEs selling another $4bn by year-end, bring total supply in line with 2023. The GSEs have continued to tender bonds that do not provide any capital benefit - Freddie conducted two tender offers this year, while Fannie has done one. We anticipate a couple more rounds of tenders by year-end, which should result in marginally positive net supply for the sector.
CRT collateral in the second half of the year should look largely the same as earlier this year. Purchase loans, which have higher LTV and DTI ratios, still account for the majority of agency originations ( Figure 154). LTV and DTI ratios have seen only a marginal decline ( Figure 155), while the share of >40 DTI loans is still near an all-time high. Interestingly, new origination credit scores, which had gradually declined from pandemic highs, continued to increase and are now close to 760. Additionally, WACs will continue to increase in deals. While collateral remains largely unchanged from earlier in the year, the GSEs brought a structural change to both programs with the introduction of the bullet-like A1 note. This change better aligns the CRT structure with the GSE capital rule.
Figure 154: Purchase loans, which have higher LTV...
Weighted avg. FICO and LTV for CRT eligible collateral in agency MBS
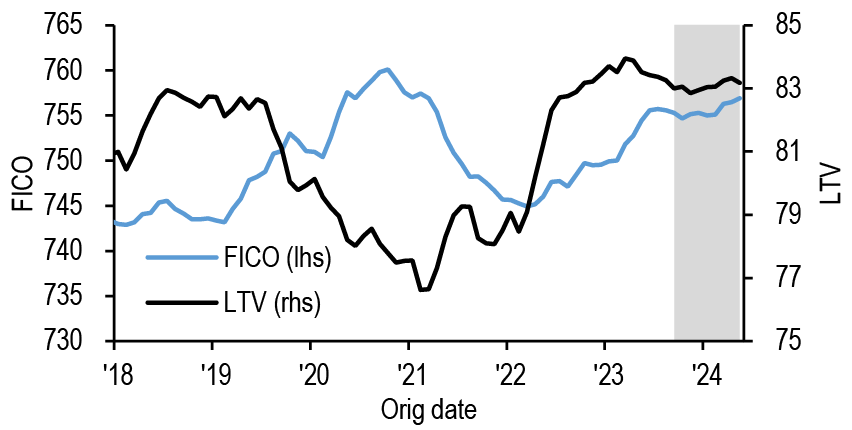
Source: J.P. Morgan, Freddie Mac, Fannie Mae
Figure 155: ...and DTI ratios, still account for the majority of agency originations, which will be referenced in CRT in 2H24
Weighted avg. DTI and % affordable programs for CRT eligible collateral in agency MBS
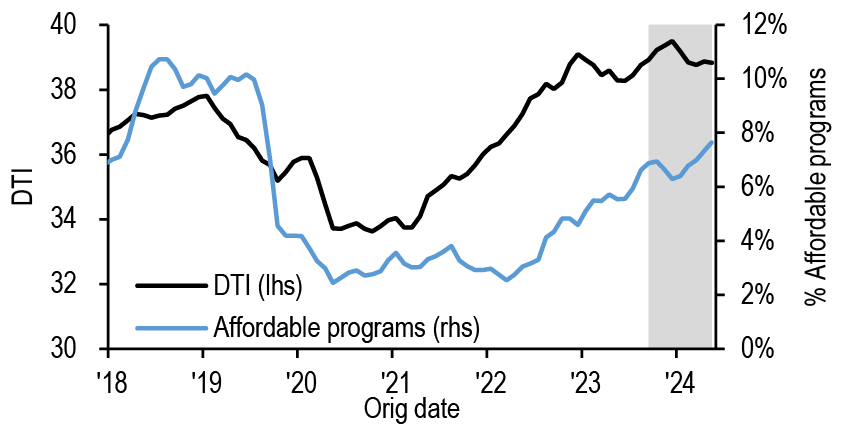
Source: J.P. Morgan, Freddie Mac, Fannie Mae
As with non-QM, delinquencies have been increasing in CRT. 2022 vintage loans have underperformed, driven by weakness in low FICO and cash-out borrowers, but we have seen DQs slowly decrease or moderate slightly over the last few months ( Figure 156). Our view on CRT credit remains unchanged. The GSEs have robust delinquency workout options, which should support borrowers in distress; the recently revised Flex Modification waterfall will offer a more uniform 20% reduction in payment. We do not anticipate material losses from changes in the modification waterfall since term extension - the first step in the waterfall and not a loss to CRT - achieves the targeted reduction in payment for the majority of currently delinquent borrowers ( Figure 157).
Figure 156: 2022 vintage loans have underperformed, driven by weakness in low FICO and cash-out borrowers, but we have seen DQs slowly decrease or moderate slightly over the last few months
STACR 30+ DQ (%) by loan vintage
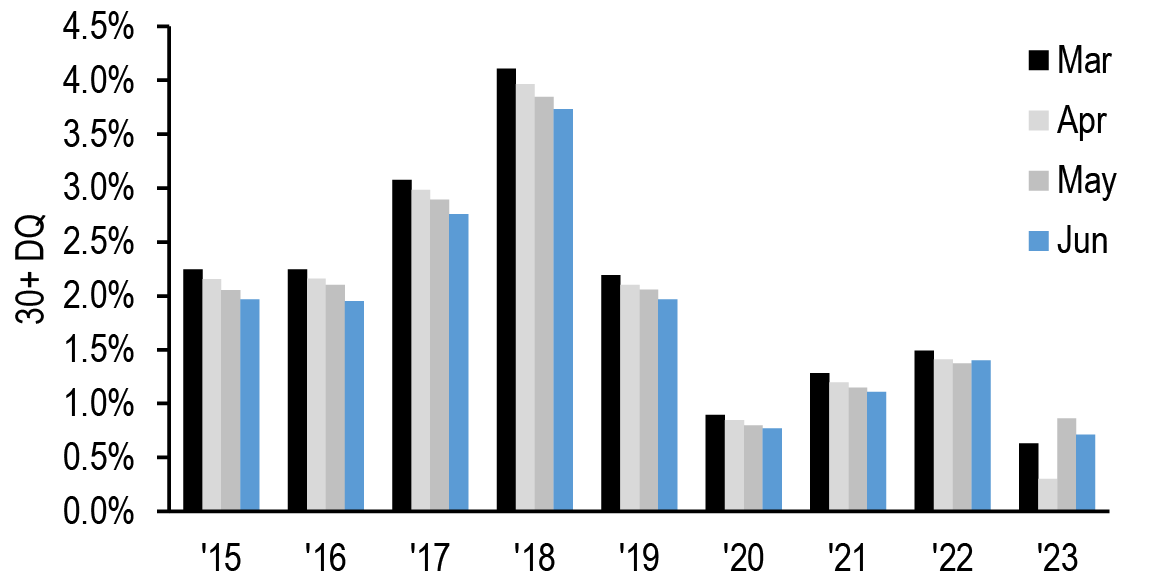
Source: J.P. Morgan, Freddie Mac
Figure 157: We do not anticipate material losses from changes in the modification waterfall
Annualized modification losses (%) assuming 100% of currently 30+ delinquent loans are modified
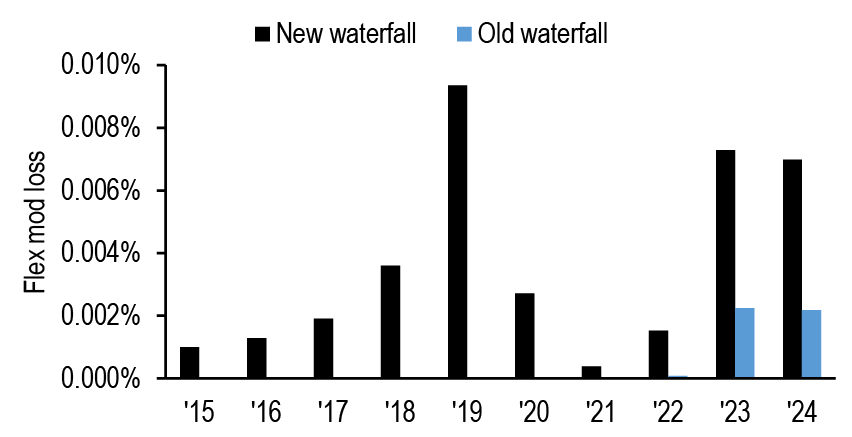
Source: J.P. Morgan, Freddie Mac
FHFA approves limited closed-end second lien pilot program
The FHFA has approved the Freddie proposal for closed-end second liens, but the program will have a significantly smaller footprint than initially anticipated. Freddie can buy $2.5bn of closed-end second liens over the next 18 months. Fannie has not made any announcements yet, but is likely to follow Freddie’s lead. The FHFA received significant pushback on the proposal from industry participants who cited concerns for expanded landing, inflationary pressures and the GSEs pushing out private market with the introduction of a second lien program. This makes sense, as a limited GSE footprint in closed-end seconds is supportive for PLS. As it is, issuance of HELOC and CES deals has already exceeded last year’s total at $6.4bn YTD ( Figure 158). New issuers like Pimco’s BRAVO, Vista Point and Goldman, have entered the space this year, and we anticipate more to come in 2H24. More closed-end second lien deals than HELOCs have been securitized thus far versus last year ( Figure 159). We maintain our forecast of $10bn.
Figure 158: New issuers like Pimco’s BRAVO, Vista Point and Goldman, have entered the space this year, and we anticipate more to come in 2H24
Original balance ($bn) of HELOC and CES securitization by shelf and year
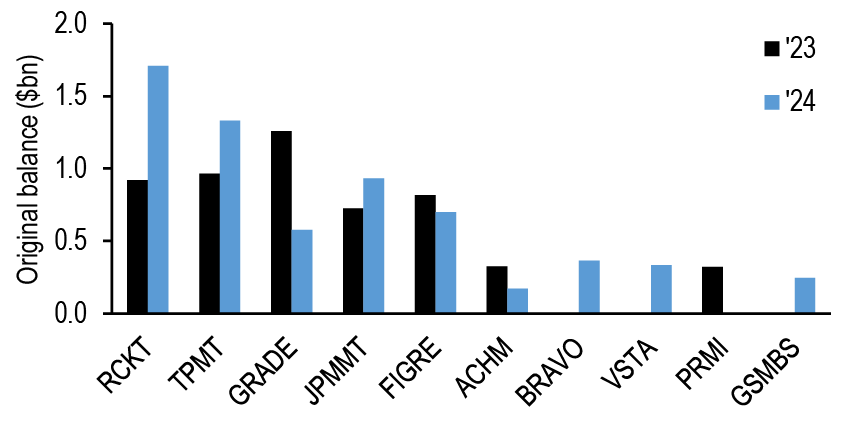
Source: J.P. Morgan, Bloomberg Finance L.P.
Figure 159: More closed-end second lien deals have been securitized thus far versus last year
Original balance ($bn) of HELOC and CES deals by collateral type and year
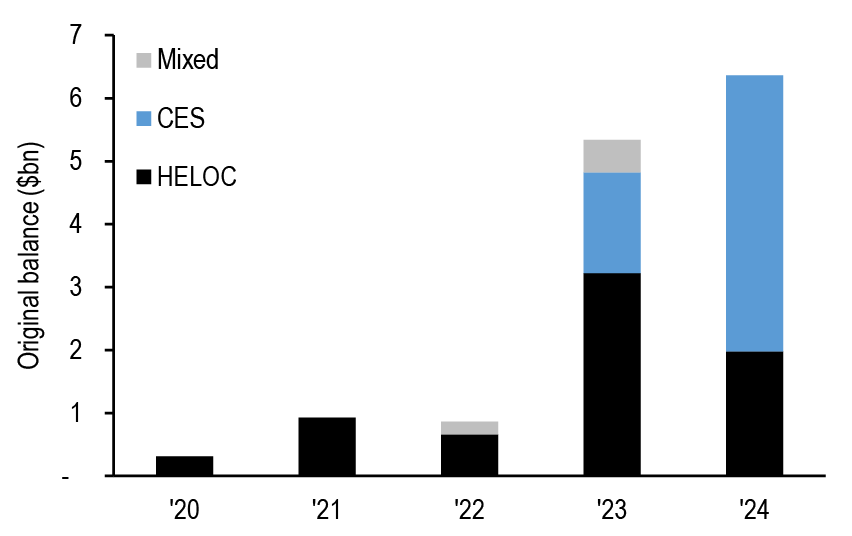
Source: J.P. Morgan, Bloomberg Finance L.P.
Issuance: We look for $110bn of gross supply for 2024
We have seen $61bn of gross issuance YTD, with the bulk of supply coming from RMBS 2.0 and non-QM. We raise our issuance forecast to $110bn for 2024, slightly higher versus the $97bn we had previously ( Figure 160). This means an additional $48bn of supply through the rest of the year.
Figure 160: We raise our issuance forecast to $110bn for 2024
Issuance with FY 2024 projections across mortgage credit ($bn)

Source: J.P. Morgan, Bloomberg Finance L.P.
RMBS 2.0 issuance came in higher than expected in 1H24, particularly in agency investor. Better execution versus GSE delivery, coupled with a pull back from banks, helped add to the securitization supply. That said, supply will continue to be limited by low origination volumes and the strong insurance bid for whole loans. We raise our 2.0 forecast $3bn to $24bn. Non-QM has driven the bulk of supply YTD. Spreads have tightened meaningfully over the last few months, and we expect the pace of issuance to continue. We raise our non-QM forecast $5bn to $35bn. In CRT, Freddie and Fannie have each issued 3-4 deals YTD, in line with their issuance calendar, and both have modified their deal structures to include the bullet-like A1 class to better align with the ERCF. There have been no MI CRT deals issued so far. We keep our issuance forecast the same and expect another $4bn through year-end. In SFR, we have seen several refi deals issued YTD, driving supply up. Issuers also continue to work through their pipeline of properties acquired in ‘22, pointing to sufficient supply remaining for a steady pace of securitizations. We raise our forecast to $7bn. Home equity continues to be an area of focus. We have seen $6bn issued YTD, already exceeding the ‘23 total of $5bn, and the addition of new shelves to the sector. We keep our forecast at $10bn. Lastly, we keep our RPL forecast the same at $12bn and raise our NPL forecast slightly to $3bn.
2024 CMBS Midyear Outlook
At the doorstep of the acceptance phase
- CRE transaction cap rate expansion has been muted year-to-date through May, remaining about flat versus 2023 year-end. Levered return on equity (ignoring NOI growth and exit cap rates) has remained low as borrowing rates have remained high while LTV expansion has been limited, suggesting financing remains less accretive to returns relative to the past and this, in turn, has kept transaction activity low. We are still looking for marginal cap rate expansion to 7% by 2024 year-end, driven by more seller capitulation
- The muted transaction activity and lack of a more meaningful cap rate expansion is due to borrowers being able to ‘kick the can’ on maturing debt. Looking at private label CMBS, we see that payoff rates by original maturity dates have sunk to historical lows. The majority of loans that were originally scheduled to mature in 2023 and 2024 (through May) remain outstanding either through servicer mods/extensions or optional extensions that were exercised by borrowers. As such, most of the outstanding loans remain performing with delinquencies still muted though rising
- We see little reason for a material change in the modification/extension dynamic for the remainder of the year. However, as we look past 2024, extended loans re-defaulting remains a risk, particularly for office, where buying time may not have worked to heal wounds
- What about CMBS valuations? Broadly speaking, CMBS is no longer a ‘cheap’ asset class and spreads across the stack appear full, particularly at the top of the stack. Seasoned deals, however, do offer value for investors willing to do the credit legwork including post-mod deals (even office) where a basis reset through paydowns/cash-ins may have delevered the structures
- As for our benchmark on-the-run spread forecasts, at J+99, 10yr conduit CMBS LCF AAAs are unlikely to hit our mid-year target of J+90. Our year-end target was J+85. We revise our year-end 10yr conduit CMBS LCF AAA spread target to J+95. For 10yr Freddie K A2, we keep our year-end spread target of J+48 (J+49 currently). For conduit BBB-s, we also keep our year-end spread target of J+550-600
- The refi success rate for conduit CMBS loans scheduled to mature this year was just 63%. which is about 11pts lower than the refi success rate for 2023 maturities. However, 31% of these loans were refinanced prior to 2024. In fact, most of these prepaid loans were refinanced in 2022 and 2023 as interest rates were increasing
- The vast majority of floating-rate SASB loans that were scheduled to mature this year either exercised embedded extension options or were extended through servicer modifications. We continue to think the extension success rate for floating-rate SASB loans will remain high if sponsor continue to show commitment to the underlying properties.
- During the May remit period, the serious delinquency rate for private label CMBS reached 4.3%, representing a nearly 40bp increase since the end of last year. Office loans have continued to be the marginal driver of the rise in serious delinquencies for private label CMBS loans. Office loan delinquency rates increased by 100bp since the end of the last year to reach 6.7%
- The loan modification rate for private label CMBS has increased significantly since the start of the year to 10.5% due largely to multifamily and office loans
- Almost two years ago, we developed a set of office-related stresses for our CMBS credit model in which we ran discrete but gradual occupancy shocks to estimate loss impact on CMBS office loans. Going into 2023, in our year-ahead Outlook, we turned our 10pt occupancy shock scenario into our Base Case. Since we first crafted these scenarios, we’ve accumulated nearly two years of data on the office market and while the sector is not out of the woods yet, we think we can start to refine our stresses to cater to more local metro area stresses that are playing out. We focus on these differences for refining our office shocks for our revised loss projections
- Here is what we like for the remainder of the year: Front pay conduit CMBS A1s versus short corporates and ABS, FRESB A10Fs versus 10yr Freddie K A2s, Freddie MLs versus comparable muni Housing Finance Agency bonds, CRE CLO AAAs and floating SASB AAAs versus BSL CLO AAAs
Figure 161: CMBS spread summary
| This Week | Change | |||
| 1w | 1m | YTD | ||
| Conduit New Issue (UST) | ||||
| 5yr Super-Senior LCF AAA | 108 | 3 | N/A | N/A |
| 10yr Super-Senior LCF AAA | 100 | 1 | 0 | -25 |
| 10yr AS | 140 | 9 | 10 | -55 |
| 10yr AA | 170 | 12 | 10 | -63 |
| 10yr A | 210 | 10 | -2 | -155 |
| Pre-COVID BBB- | 612 | 2 | -23 | -231 |
| 10yr BBB- | 625 | 0 | -25 | -253 |
| 10yr XA | 134 | 14 | -4 | -91 |
| Agency CMBS (UST) | ||||
| Freddie K A1 (10yr) | 49 | 0 | 2 | -9 |
| Freddie K A2 (10yr) | 49 | 0 | 1 | -11 |
| Freddie K Floater (10yr) | 56 | 1 | 2 | -14 |
| Freddie K X1 | 150 | 0 | 0 | -30 |
| Freddie K X3 | 340 | 0 | 0 | -85 |
| FRESB A5H | 115 | 0 | 0 | -10 |
| FRESB A10F | 81 | 0 | -6 | -14 |
| FNA DUS 10/9.5 TBA | 54 | 1 | 2 | -13 |
| FNA DUS SARM | 60 | 0 | 0 | -13 |
| GNR Project Loan (3.5yr) | 135 | 0 | 0 | -20 |
Source: J.P. Morgan
Figure 162: Summary of CMBS issuance and dealer holdings
| YTD Issuance ($bn) | 2024 | 2023 | % Diff. |
| Conduit | 12.2 | 7.8 | 56% |
| SASB | 30.6 | 6.6 | 360% |
| CRE CLO | 2.2 | 2.1 | 5% |
| Other | 0.0 | 0.3 | -100% |
| Total Private Label | 45.0 | 16.9 | 166% |
| Freddie K | 12.3 | 13.4 | -8% |
| Freddie Multi PC | 7.0 | 7.1 | -1% |
| FRESB | 0.8 | 0.5 | 39% |
| Fannie MBS | 15.5 | 19.4 | -20% |
| GNR PL | 4.3 | 4.6 | -7% |
| Freddie Other | 1.4 | 0.8 | 79% |
| Agency CMBS | 41.4 | 45.9 | -10% |
| Total CMBS | 86.4 | 62.8 | 38% |
| YTD Issuance ($bn) | 2024 | 2023 | % Diff. |
| Private Label Fixed | 19.0 | 14.3 | 32% |
| Private Label Floating | 26.1 | 4.6 | 464% |
| Agency Fixed | 39.5 | 46.4 | -15% |
| Agency Floating | 2.1 | 8.7 | -76% |
| Dealer Holdings ($bn) | 6/19/24 | 6/12/24 | 5/22/24 |
| Private Label | 5.80 | 5.61 | 4.98 |
| Agency CMBS | 14.03 | 14.29 | 13.53 |
Source: J.P. Morgan, Commercial Mortgage Alert, Federal Reserve Bank of New York, Fannie DUS Disclose
Note: Dealer holdings reported with a 1-week lag
Overview and trading themes
CRE transaction cap rate expansion has been muted year-to-date through May, remaining about flat versus 2023 year-end with blended cap rates across the major property types sitting at roughly 6.5%. Levered return on equity (ignoring NOI growth and exit cap rates) has remained low as borrowing rates have remained high while LTV expansion has been limited, suggesting financing remains less accretive to returns relative to the past and this, in turn, has kept transaction activity low ( Figure 163). There is little reason to believe this dynamic changes for the remainder of this year with less Fed cuts expected relative to the start of this year. We are still looking for marginal cap rate expansion to 7% by 2024 year-end, driven by more seller capitulation. As high for longer persists, seller capitulation on fundamentally impaired assets is an inevitability as risks and opportunity costs mount.
Figure 163: Transaction cap rates have not moved much this year and transaction volumes remain muted as high for longer persists. When will more sellers capitulate?
US commercial real estate and multifamily blended cap rates versus levered return on equity (%) and transaction volumes ($bn)
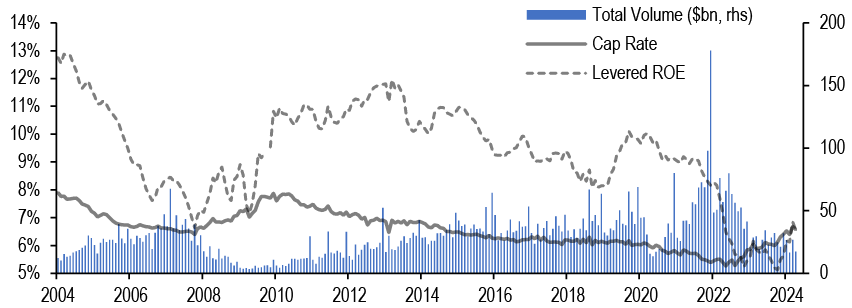
Source: J.P. Morgan, MSCI Real AssetsNote: Levered ROE = 1/(1-LTV) * (Cap Rate – (LTV*Mortgage Rate)). Does not consider future NOI growth or exit cap rates.
The muted transaction activity and lack of a more meaningful cap rate expansion is due to borrowers being able to ‘kick the can’ on maturing debt. Looking at private label CMBS (conduit, SASB, CRE CLOs), we see that payoff rates by original maturity dates have sunk to historical lows ( Figure 164). The majority of loans that were originally scheduled to mature in 2023 and 2024 (through May) remain outstanding either through servicer mods/extensions or optional extensions that were exercised by borrowers. As such, most of the outstanding loans remain performing with delinquencies still muted though rising (see CMBS credit fundamentals outlook). Even lower are actual liquidations of defaulted loans. We see little reason for a material change in the modification/extension dynamic for the remainder of the year. However, as we look past 2024, extended loans re-defaulting remains a risk, particularly for office, where buying time may not have worked to heal wounds. As Figure 165 shows, we saw a substantial portion of CMBS office loans that received modifications post-GFC re-default and ultimately liquidate for losses. A similar dynamic can play out as we step into 2025 and beyond.
Figure 164: The CMBS market is in the middle of an extension wave...
Percentage of private label CMBS loans paid off, outstanding, and liquidated by original maturity year

Source: J.P. Morgan, Trepp
Figure 165: …if the post-GFC modification wave tells us anything, there is substantial re-default risk in office loans that have been extended. This risk emerges as we step into 2025 and beyond
Conduit CMBS office loan cumulative modification rates and percentage of modified loans that are outstanding, paid off, or liquidated post-mod by deal vintage (%)
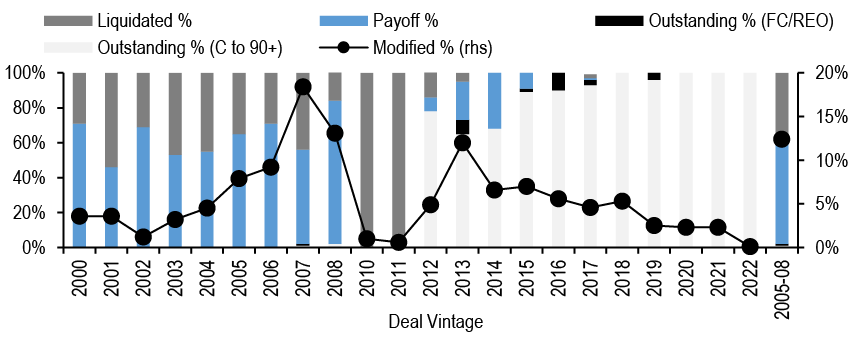
Source: J.P. Morgan, Trepp
What about CMBS valuations? Broadly speaking, CMBS is no longer a ‘cheap’ asset class and spreads across the stack appear full, particularly at the top of the stack ( Figure 166). The top of the conduit CMBS stack should largely avoid meaningful extensions in the medium term as refinance success rates remain high enough but spreads no longer look compelling to single-A corporates. The middle part of the stack (AAs and single-As) is more exposed to extension risks and has closed in on similar duration REIT bonds in recent months ( Figure 167). Conduit BBB-s remain optically wide to high yield CRE REIT bonds but with good reason. These bonds have thin enhancements and real money does not seem convinced of their relative value, meaning hedge funds and private credit remain the anchor investors for this portion of the capital stack ( Figure 168). We think new participants are needed for these cohorts for lower IG mezz spreads to move materially tighter from this point forward. Seasoned deals, however, do offer value for investors willing to do the credit legwork including post-mod deals (even office) where a basis reset through paydowns/cash-ins may have delevered the structures.
Figure 166: Valuations of high quality benchmark CMBS bonds look full
Spreads to Treasuries (bp)

Source: J.P. Morgan
Figure 167: Conduit AS to single-As have compressed materially as well. The relative value to IG REIT bonds is less interesting
Spreads to Treasuries (bp)
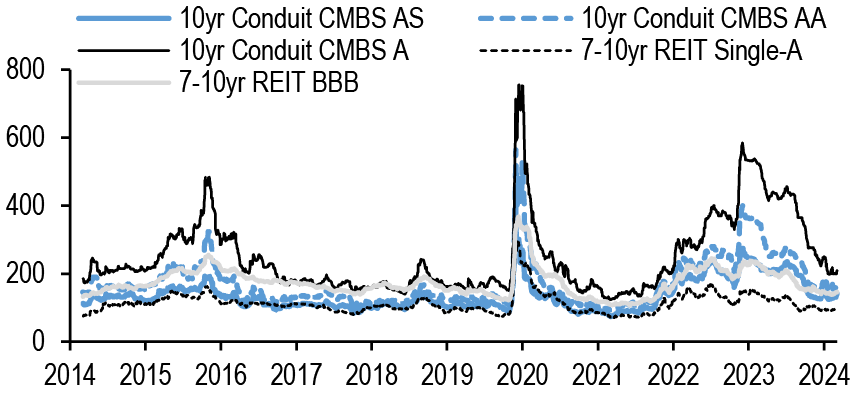
Source: J.P. Morgan
Figure 168: While conduit CMBS BBB-s have arguably been the best performer this year in the CMBS complex, they remain wide to high yield CRE REITs but with good reason
Spreads to Treasuries (bp)
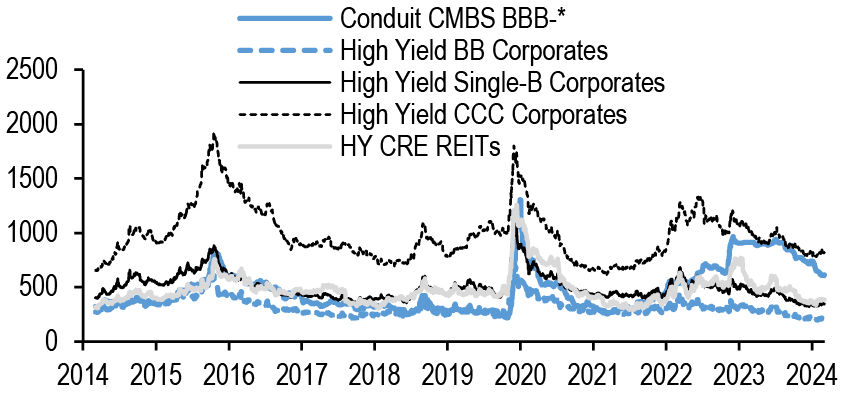
Source: J.P. Morgan
As for our benchmark on-the-run spread forecasts, at J+99, 10yr conduit CMBS LCF AAAs are unlikely to hit our mid-year target of J+90. Our year-end target was J+85. We revise our year-end 10yr conduit CMBS LCF AAA spread target to J+95. For 10yr Freddie K A2, we keep our year-end spread target of J+48 (J+49 currently). For conduit BBB-s, we also keep our year-end spread target of J+550-600.
Here is what we like for the remainder of the year:
- Front pay conduit CMBS A1s versus short corporates and ABS. At J+92, the conduit CMBS A1s are compelling relative to 1-3yr corporates (I+71) or 3yr consumer ABS AAAs (I+48-66). These bonds have no appreciable risk of being extended, let alone taking writedowns. Tranches are small, however, so can be difficult to source.
- FRESB A10Fs versus 10yr Freddie K A2s. Voluntary prepayment speeds have slowed a lot for the FRESB market and older vintages are exposed to NYC rent regulated stories that are troubled. However, on-the-runs at J+81 offer 32bp spread pickup to its bigger brother 10yr Freddie K A2s currently at J+49. Like Freddie K A2s, FRESB A10Fs have 10yr legal hard finals so cannot extend. The program is smaller so lacks the kind of secondary liquidity that Freddie Ks enjoy but the spread pickup is hard to ignore.
- Freddie MLs versus comparable muni Housing Finance Agency bonds. Freddie Mac’s multifamily Tax Exempt program is a growing one that offers tax exemption benefits to more traditional municipal bond investors as well as those that can benefit from tax exemption. While new issue pricing has moved substantially tighter in the last few deals, they can still offer some yield pickup to comparable municipal Housing Finance Agency bonds. See here for our municipal strategists discussion and here for our primer.
- CRE CLO AAAs and floating SASB AAAs versus BSL CLO AAAs. At 1m term SOFR + 175bp+ on tier 1 CRE CLO AAAs and new issue SASB AAAs, spreads are attractive to BSL CLO AAAs pricing at 3m term SOFR + 142 at new issue. CRE CLO credit issues are real but AAAs should not experience losses although servicer extensions are a real possibility. The risk is bad headlines can cause spread widening. We would view those as buying opportunities. Well sponsored floating SASB has weathered rate volatility better than most expected with high optional extension success rates. New issue offers higher coupons and fundamentally sound collateral for the most part with a lot of new issue supply to pick from. We think this is a good time to add.
CRE sector outlooks
We recently hosted our periodic J.P. Morgan Commercial Real Estate Update call (replay here and accompanying slides here) in which our J.P. Morgan Asset Management colleague, Luigi Cerreta, did a great job of providing views on real estate fundamentals across the major property sectors. We largely agree with his views, so we recommend our readers to listen to the replay of our call.
CMBS credit fundamentals outlook
Refi success rates
Through the first five months of the year, the refi success rate for conduit CMBS loans scheduled to mature this year (excluding defeased loans) was 63%, which is about 11pts lower than the refi success rate for 2023 maturities ( Figure 169). By far the worst performing sector in the conduit CMBS space has been office, as just 36% of office loans scheduled to mature this year have successfully refinanced ( Figure 170). The refinance success rate for fixed rate SASB loans scheduled to mature this year is currently 37%, which is on par with the refinance success rate for 2023 maturities but much lower than the historical average. However, it is important to note that more than half of the fixed rate SASB loans that were originally scheduled to mature this year are performing loans that have been modified with maturity date extensions. As far as floating rate SASB and CRE CLO loans, the refinance success rate remains low, but these loans have embedded extension options, which have been heavily utilized. For a detailed breakout of loan resolutions for the private label CMBS market, please refer to Figure 189in our appendix.
Figure 169: The year-to-date refi success rate for conduit CMBS loans is 11pts lower than the 2023 full-year rate
Refinance success rates by CMBS product type, as of May 2024
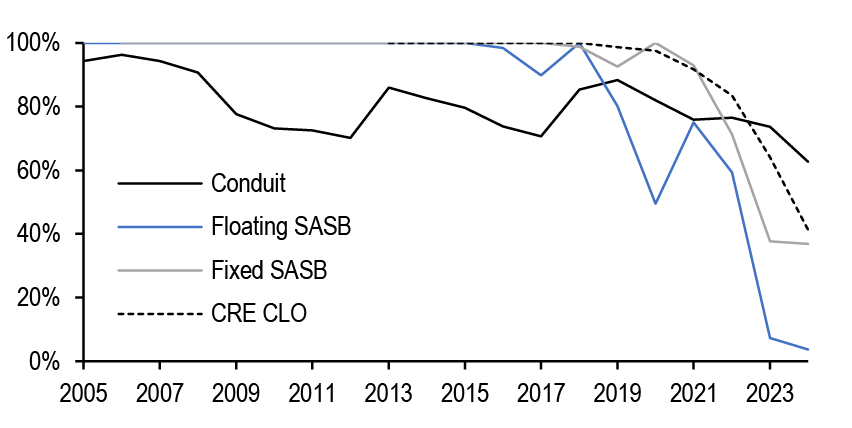
Source: J.P. Morgan, Trepp
Figure 170: Unsurprisingly, the office loan refi success rate continued to underperform that of all other property types
Refinance success rates for conduit CMBS by property type, as of May 2024
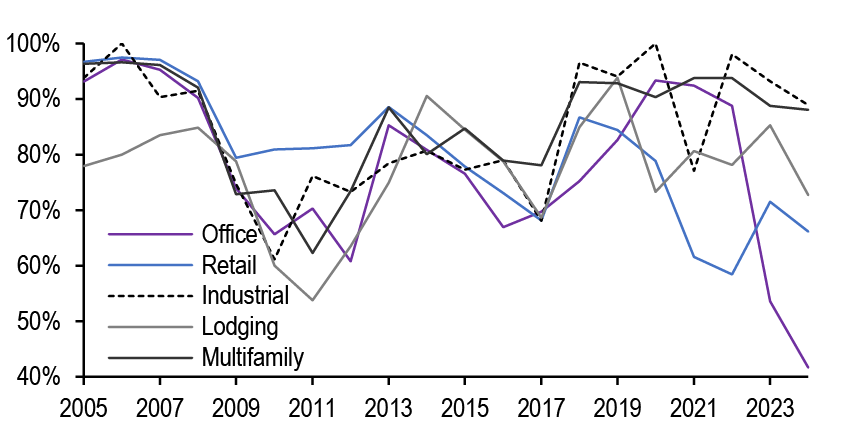
Source: J.P. Morgan, Trepp
While the overall refi success rate for conduit CMBS loans maturing in 2024 is currently at a historically low level, it is important that we understand the timing of the refinancings that have already occurred. As Figure 171 highlights, 31%, or $4.7bn, of conduit CMBS loans that were scheduled to mature through the first five months of the year were paid off prior to 2024. When we dig deeper into this specific cohort of loans, we notice that nearly 68% of them were refinanced as interest rates were increasing in 2022 and 2023 ( Figure 172). Borrowers who refinanced during this period likely experienced enough property price appreciation on their investments in the years prior that they were still incentivized to refinance even as rates were increasing. However, when looking by property type, there has been a relatively limited amount of early office refinancings during this period, highlighting how limited the refinancing prospects have been for office loans given the sector’s ongoing fundamental challenges.
Figure 171: 31%, or $4.7bn, of conduit CMBS loans that were scheduled to mature through the first five months of the year were retired prior to 2024
Timing of refinancing for conduit CMBS loans by maturity year, as of May 2024
| Orig. Mat. Period | Before Maturity Yr | Maturity Yr | After Maturity Yr | Total | Secur. Bal ($bn) |
| 2005 | 42% | 51% | 2% | 94% | 5.3 |
| 2006 | 59% | 36% | 2% | 96% | 8.6 |
| 2007 | 56% | 37% | 2% | 94% | 16.4 |
| 2008 | 34% | 54% | 3% | 91% | 31.4 |
| 2009 | 18% | 41% | 19% | 78% | 23.4 |
| 2010 | 15% | 39% | 19% | 73% | 36.6 |
| 2011 | 12% | 47% | 14% | 72% | 45.3 |
| 2012 | 11% | 47% | 12% | 70% | 56.5 |
| 2013 | 20% | 64% | 2% | 86% | 38.9 |
| 2014 | 19% | 59% | 4% | 83% | 46.4 |
| 2015 | 13% | 64% | 2% | 80% | 83.7 |
| 2016 | 20% | 51% | 3% | 74% | 121.2 |
| 2017 | 22% | 46% | 3% | 71% | 121.8 |
| 2018 | 39% | 46% | 1% | 85% | 12.0 |
| 2019 | 31% | 55% | 2% | 88% | 7.5 |
| 2020 | 24% | 44% | 14% | 82% | 10.4 |
| 2021 | 23% | 47% | 6% | 76% | 17.3 |
| 2022 | 23% | 52% | 2% | 77% | 24.6 |
| 2023 | 29% | 43% | 2% | 74% | 34.4 |
| 2024 | 31% | 33% | 0% | 63% | 15.0 |
Source: J.P. Morgan, Trepp
Figure 172: About 68%of loans that were scheduled to mature this year and were prepaid were paid off in 2022 and 2023 when interest rates were increasing
Percentage of prepaid loans that were scheduled to mature in 2022, 2023, and 2024 by payment year
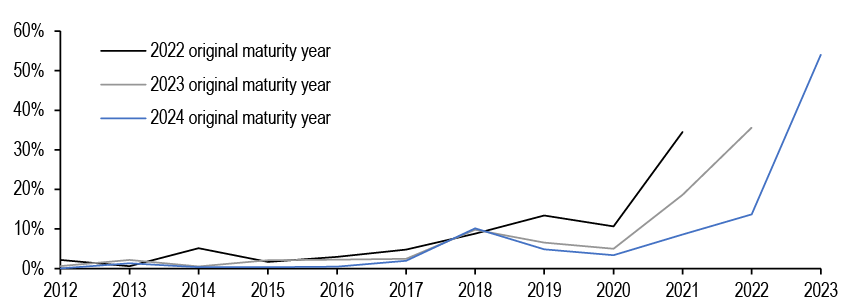
Source: J.P. Morgan, Trepp
There is also a clear delineation in debt yields based on when the loans are refinanced. Private label CMBS loans that were refinanced prior and during the year that they were scheduled to mature, generally have a higher debt yield than those that were refinanced in the years following their original maturity year ( Figure 173). This has been a consistent trend going back to 2013. During this period, debt yields on loans that were prepaid have been 423bp greater, on average, than the debt yield on loans that were paid off after their original maturity year. The gap between prepaid loans and loans that were liquidated is even greater having averaged a 700bp difference during this same period. For a detailed breakout of debt yields of loans that have been refinanced and liquidated by property type going back to 2021, please see Figure 190 in our appendix.
Figure 173: Generally, conduit CMBS loans with higher debt yields receive better refinancing outcomes
Average NCF debt yield of private label CMBS loans (excluding defeased loans) that were either paid off early, on-time, late or liquidated by maturity year, as of May 2024
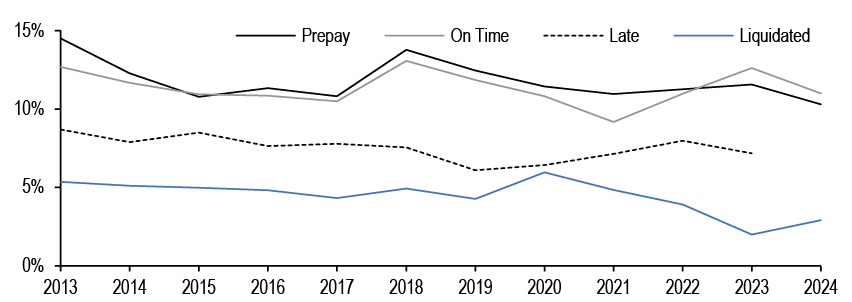
Source: J.P. Morgan, Trepp
Throughout last year and this year, we repeatedly noted that conduit LCF AAA extension risk for shorter vintages are very limited considering how well refi success rates are holding up. And, while there has been debate about whether including early payoffs in the overall refi success number is fair, as we demonstrate above, a lot of what paid off early for 2023 and 2024 scheduled maturities did so in 2022 and 2023 when financial conditions increasingly become tighter. That said, the outlook for mid-to-longer duration vintages (2017+) can become more challenging as office exposures increase appreciably in these vintages. Barring a substantial rate rally and/or a significant recovery in office fundamentals, LCF AAA extension risk for these vintages are more material than earlier vintages. It seems that at least some of this is priced into the market as conduit LCF AAAs with very high concentrations to office are still trading 40bp+ wider to those with low concentrations ( Figure 174).
Figure 174: Conduit LCF AAA extension risk if more substantial for mid-to-longer duration vintages with more substantial office exposures barring a substantial rate rally and/or a significant recovery in office fundamentals as those maturities approach
Spreads to Treasuries (bp), 2018-2023 vintage conduit CMBS LCF AAAs, outliers determined using inter-quartile ranges are excluded each day
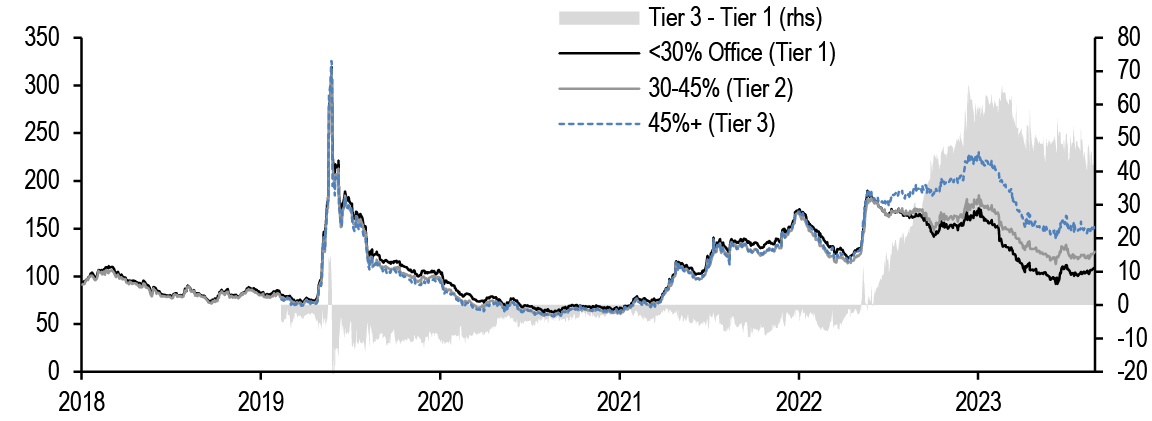
Source: J.P. Morgan, Pricing Direct
Floating-rate SASB extensions
Through May 2024, about $67bn of floating rate SASB loans reached their maturity dates, most backed by mixed-use properties. Like the 2023 maturities, the vast majority of these loans were extended. Overall, about 68% of these loans exercised embedded extension options and 6% received servicer modifications that included maturity date extensions ( Figure 175). Many of these loan modifications required the property’s sponsor to inject capital into the deal. For example, UBSCM 2018-NYCH, a deal backed by a portfolio of upper midscale hotels, received a 9-month extension after agreeing to a $10mn principal paydown. In the case of CSMC 2021-GATE, the sponsor is required to deposit nearly $45mn into a leasing reserve in exchange for a 1yr maturity date extension with a 1yr extension option. However, some loans that were expected to mature during the first five months were not extended. 12% of these loans are currently delinquent and 3% are performing as they work with special servicers on resolutions. Another 10% have been paid off and 1% have been liquidated.
Figure 175: Most floating-rate SASB loans that reached their scheduled maturity dates this year have been extended
Balance and percentage split of floating-rate SASB loans that have either been liquidated, paid off, became delinquent, optionally extended, have been modified, or are performing by property type, as of May 2024
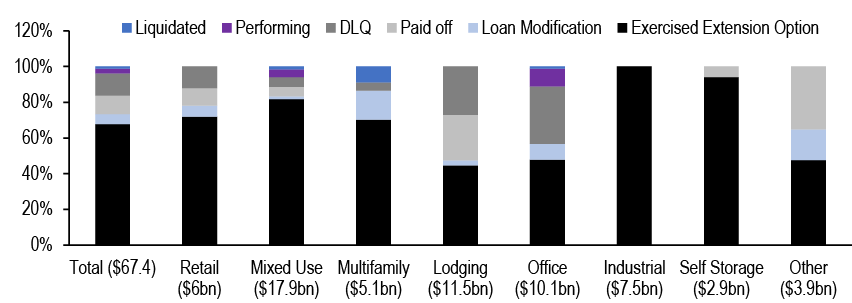
Source: J.P. Morgan, Trepp
When we look at the data by property type, unsurprisingly, office is the clear underperformer. Office loans have one of the lowest extension success rates at just 48%, which is only behind the lodging sector and the “other” sector. Please note that the “other” sector includes relatively small asset classes like manufactured housing and healthcare. However, the “other” and lodging sectors have the highest payoff rates by far, at 35% and 25%, respectively. Some of the hotel deals that were paid off this year like BX 2018-BILT and GWT 2019-WOLF have been part of the Blackstone’s refinancing wave. In the case of office, there have been limited payoffs and high delinquencies. It is likely that the extension and payoff success rates for office will remain low relative to other property types.
Currently, there is about $161bn of outstanding floating SASB deals. Using either their 2023YE NOI DSCR or their underwritten DSCR, we estimate that about 60% of these deals have NOI DSCR less than 1.25x and 29% have a NOI DSCR less than 1.0x ( Figure 176). While DSCR levels are important in determining whether a loan can be refinanced or extended, sponsor commitment is just as important, if not more important. If sponsors are committed to these properties and are willing to inject capital into these deals, then the extension success rate for these deals will likely remain high.
Figure 176: Most of the outstanding floating- rate SASB market has thin capped NOI DSCRs
% of outstanding floating-rate SASB by capped DSCR bucket and property type
| Less than 1.0x | 1.0x-1.25x | 1.25x-1.5x | 1.5x-1.75x | 1.75x-2.0x | 2.0x-2.25x | 2.25x-2.5x | Greater than 2.5x | |
| Industrial | 8.1% | 12.5% | 5.0% | 6.0% | 0.7% | 1.0% | 0.0% | 1.5% |
| Lodging | 11.2% | 14.1% | 8.0% | 3.0% | 4.0% | 1.0% | 2.6% | 1.9% |
| Mixed Use | 3.0% | 0.2% | 0.1% | 0.2% | 0.2% | 0.0% | 0.3% | 0.0% |
| Multifamily | 0.0% | 1.1% | 0.5% | 0.4% | 0.0% | 0.0% | 0.0% | 0.0% |
| Office | 4.3% | 2.0% | 2.0% | 1.9% | 0.0% | 0.0% | 0.0% | 0.4% |
| Other | 2.0% | 0.6% | 0.2% | 0.0% | 0.0% | 0.0% | 0.0% | 0.0% |
| Total | 28.6% | 30.6% | 15.8% | 11.5% | 4.8% | 2.0% | 2.9% | 3.8% |
Source: J.P. Morgan, Trepp
Delinquencies, special servicing, and modifications
The serious delinquency rate (60d+ including non-performing matured and FC/REO) for private label CMBS continued to rise this year due, in large part, to maturity defaults. During the May remit period, the serious delinquency rate for private label CMBS reached 4.3%, representing a nearly 40bp increase since the end of last year ( Figure 177). The special servicing rate for private label CMBS loans increased 128bp the through the year so far to reach 7.4%. Also, it is important to note is the rise in loan modifications. The loan modification rate for private label CMBS is now at 10.5%, the highest level on record. When we exclude forbearance, the modification rate is 7.74%, a 111bp increase since the beginning of the year.
Figure 177: The serious delinquency, special servicing, and loan modification rate for private label CMBS loans have all climbed this year
60d+ delinquency rate (including NP matured and FC/REO), modification rate, modification rate excluding temporary forbearance, special servicing, and foreclosure rate for private label CMBS, as of May 2024
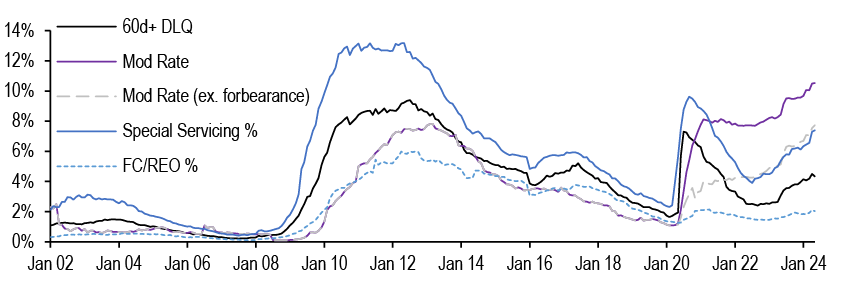
Source: J.P. Morgan, Trepp
Office loans have continued to be the marginal driver of the rise in serious delinquencies for private label CMBS loans ( Figure 178). Office loan delinquency rates increased by 100bp since the end of the last year to reach 6.7%. The serious delinquency rate for all other property types have increased slightly except for retail loans, which experienced a 50bp decrease. Given the strength of the consumer, it is not surprising to see the continued decline of delinquencies in the retail sector since the end of the pandemic.
Figure 178: Office loans have been the marginal driver for the increase in the private label serious delinquency rate
Private label CMBS serious delinquency rates (60-day+ including foreclosed/REO and non-performing matured loans) by property type, as of May 2024
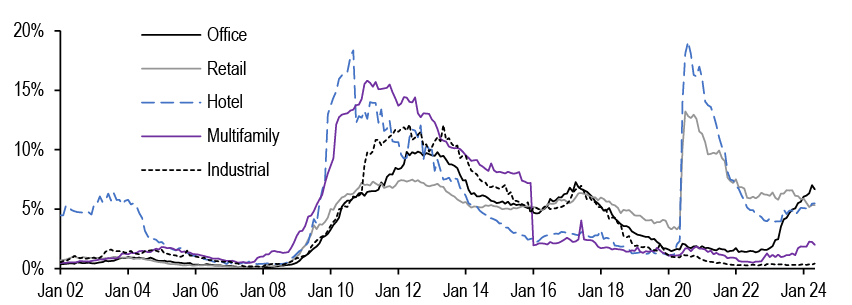
Source: J.P. Morgan, Trepp
Serious delinquencies increased across all the different CMBS deal types during the first five months of the year. The conduit CMBS serious delinquency rate is up 30bp this year to 4.8% while the SASB serious delinquency rate increased just 10bp to 3.7% ( Figure 179). Please note that the SASB delinquency rate experienced a 70bp month-over-month decrease during the May remit period due to a few loan resolutions that we previously wrote about here. However,the serious delinquency rate for CRE CLOs experienced a significant increase since the start of the year as it is now at 4% after beginning the year at 2.7%. As an almost entirely floating-rate market, CRE CLO borrowers have struggled with rising debt costs as a result of the increase interest rates over the past couple of years. This, along with asset value deterioration and limited revenue growth, has resulted in increased stress in the CRE CLO market. Meanwhile, Freddie K delinquencies remain de-minimis.
Figure 179: The serious delinquency rate for all CMBS product types has increased this year
60d+ delinquency rate (including NP matured and FC/REO) by CMBS product type, as of May 2024
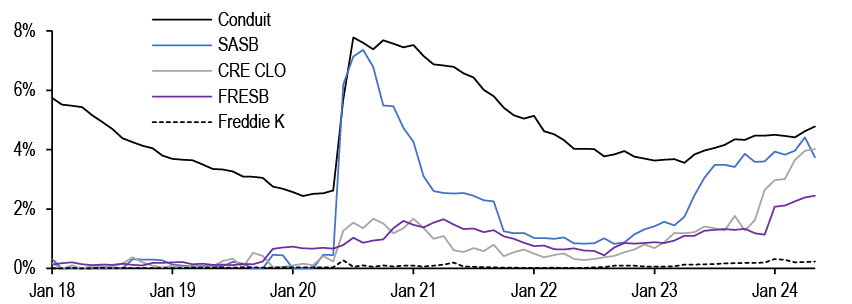
Source: J.P. Morgan, Trepp
As we mentioned earlier, the loan modification rate for private label CMBS has increased significantly since the start of the year. The marginal drivers of this increase have been office and multifamily loans. Due to the increased stress in the CRE CLO market, we have seen a dramatic rise in the modification rate for multifamily loans ( Figure 180). Since the beginning of the year, the multifamily loan modification rate has increased by 278bp to 8.73%. Of the multifamily loans to be modified this year, the vast majority were securitized in CRE CLO deals. As we have highlighted previously, CRE CLO managers have increasingly used loan modifications to preserve their existing CRE CLO vehicles. Unsurprisingly, we also saw a large uptick in office loan modifications as well. The office loan modification rate is now at 7.5% after beginning the year at 5.7%.
Figure 180: Modification rates have increased significantly for both multifamily and office loans this year
Private label CMBS modification rates (60-day+ including foreclosed/REO and non-performing matured loans) by property type, as of May 2024
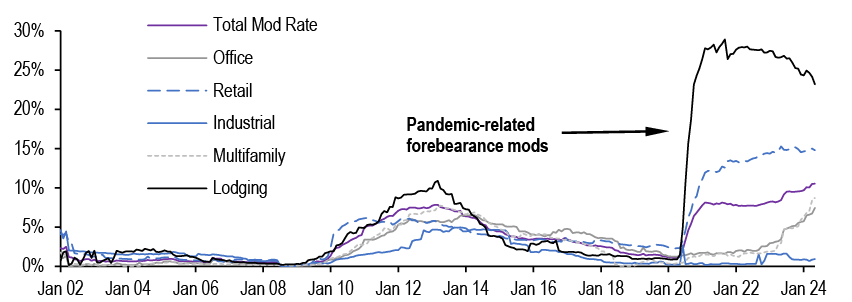
Source: J.P. Morgan, Trepp
We expect delinquencies to continue to rise but due to increased loan modifications, we revise down our serious delinquency rate forecast for private label CMBS to 5.5% from 5.7% ( Figure 181). By deal type, we revise down our conduit CMBS serious delinquency forecast from 6.8% to 5.5%. We also must revise up our CRE CLO serious delinquency rate to 5.2% from 3.5% given the increase stress in this market.
Figure 181: We think private label CMBS serious delinquencies climb to 5.5% by the end of 2024
J.P. Morgan US private label CMBS 60d+ delinquency rate (including FC/REO and NP matured loans) forecast, current levels as of May 2024
| Current 60d+ DLQ | Prior YE 2024E 60d+ DLQ Forecast | Cuurent YE 2024E 60d+ DLQ Forecast | |
| Total Private Label CMBS | 4.3% | 5.7% | 5.5% |
| Conduit CMBS | 4.8% | 6.8% | 5.5% |
| Total SASB | 3.7% | 5.0% | 5.0% |
| Fixed Rate SASB | 1.9% | 4.8% | 4.8% |
| Floating Rate SASB | 4.9% | 5.2% | 5.2% |
| CRE CLO | 4.0% | 3.5% | 5.2% |
Source: J.P. Morgan, Trepp
Issuance and demand outlook
Private label CMBS issuance has picked up significantly relative to last year. Through the first half of this year, total private label issuance was $44.4bn compared to just $16.9bn during the first six months of last year. SASB issuance has carried most of the load as it has accounted for 67% of all private label CMBS issuance this year. Blackstone’s return to the SASB market is the real driving force for this large uptick in issuance as it has used the SASB market to issue about $14.5bn of deals during the first half of the year, by far the most of any single sponsor. Despite its latest industrial deal being pulled due to some investor new issue fatigue, Blackstone is still expected to pump out a similar level of deals during the second half of the year. At $12.2bn, Conduit CMBS issuance has picked up as well with investors showing preference for the shorter duration 5yr format. 5yr conduit deals have accounted for nearly 74% of all conduit issuance this year so far. Investors are also looking for more fixed rate product so conduit issuance should continue on a similar pace through the rest of the year. With SASB and conduit issuance continuing to perform well, we forecast that total private label CMBS issuance will reach $85bn in 2024 ( Figure 182).
Figure 182: Our forecast for total US CMBS issuance in 2024 is $205bn
J.P. Morgan US CMBS issuance forecast ($bn)
| Gross Issuance | 2020 FY | 2021 FY | 2022 FY | 2023 FY | 2024 YTD | Prior 2024E FY | 2024E FY | Y/Y Chg |
| Total CMBS | 248 | 351 | 276 | 161 | 86 | 207 | 205 | 27% |
| Private Label | 65 | 157 | 100 | 47 | 45 | 62 | 85 | 83% |
| Conduit | 31 | 31 | 23 | 20 | 12 | 25 | 25 | 27% |
| SASB | 24 | 79 | 46 | 20 | 31 | 25 | 55 | 181% |
| CRE CLO | 9 | 46 | 29 | 7 | 2 | 12 | 5 | -25% |
| Other | 1 | 1 | 2 | 1 | 0 | |||
| Agency | 183 | 194 | 167 | 115 | 41 | 145 | 120 | 5% |
| Freddie | 74 | 79 | 70 | 52 | 22 | 65 | 55 | 6% |
| Fannie | 76 | 69 | 70 | 53 | 16 | 65 | 55 | 3% |
| Ginnie Project Loans | 34 | 45 | 26 | 10 | 4 | 15 | 10 | 4% |
Source: J.P. Morgan
On the other hand, agency CMBS issuance has continued to underwhelm this year after registering just $115bn of issuance in 2023. In our 2024 outlook, we discussed the change in the FHFA volume cap rules that would exclude workforce housing loans from the volume caps if the loan sponsor agrees to preserve affordability according to AMI definitions for 10 years or the term of the loan. We thought that these sponsor preservation loans would be one reason why 2024 agency CMBS issuance volumes would exceeds last year’s total. However, according to data from FNA DUS Disclose, sponsor preservation loan production has been limited, accounting for just ~10% (~$1.6bn ) of all FNA DUS issuance volumes this year. With multifamily acquisition financing likely to continue to underwhelm, we don’t see much room for growth in agency CMBS issuance compared to last year. As such, our Agency CMBS issue forecast for 2024 is $120bn. In total, our US CMBS issuance forecast is $205bn.
As far as demand for CMBS bonds, we continue to see heavy money manager involvement, particularly at the top of the capital stack. Using new issue market participation data from deals J.P. Morgan participated in syndicating, money managers have purchased about 61% of CMBS new issue bonds rated between AAA and single-A ( Figure 183). Insurance/Pensions were the second most active participants in this part of the capital stack, accounting for 29%. Down the stack was dominated by the alternatives like hedge funds, private equity, and REITs. These participants likely have higher yield targets and are willing to take on the additonal risk associated with these bonds. It is likely these dynamics will persist through the rest of the year as well as the lack of bank participation. Given the negative headlines surrounding CRE and the potential for increased regulatory strain, banks are not likely to make a meaningful return to the CMBS market anytime soon.
Figure 183: Money managers have been very active at the top of the capital stack while fast money has dominated the bottom portion
Percentage of new issue private label CMBS brought by investor type by issuance year and rating, only for deals in which J.P. Morgan was involved as a syndicator
| Bank | HF/PE/REIT | Insurance/Pension | Money Manager | Other | |
| AAA-A | |||||
| 2017 | 7% | 3% | 52% | 36% | 2% |
| 2018 | 12% | 4% | 43% | 39% | 1% |
| 2019 | 11% | 5% | 43% | 41% | 0% |
| 2020 | 16% | 4% | 39% | 41% | 0% |
| 2021 | 16% | 6% | 43% | 35% | 0% |
| 2022 | 29% | 3% | 27% | 41% | 0% |
| 2023 | 5% | 7% | 44% | 44% | 0% |
| 2024 | 2% | 8% | 29% | 61% | 0% |
| BBB-B | |||||
| 2017 | 0% | 52% | 17% | 27% | 4% |
| 2018 | 2% | 51% | 29% | 17% | 0% |
| 2019 | 0% | 61% | 25% | 13% | 0% |
| 2020 | 0% | 53% | 26% | 18% | 3% |
| 2021 | 2% | 48% | 34% | 15% | 1% |
| 2022 | 0% | 47% | 13% | 40% | 0% |
| 2023 | 0% | 61% | 1% | 30% | 8% |
| 2024 | 0% | 90% | 3% | 7% | 0% |
Source: J.P. Morgan
Conduit CMBS loss projections - tweaking our office scenarios
Almost two years ago, we developed a set of office-related stresses for our CMBS credit model in which we ran discrete but gradual occupancy shocks to estimate loss impact on CMBS office loans. Going into 2023, in our year-ahead Outlook, we turned our 10pt occupancy shock scenario into our Base Case. Since we first crafted these scenarios, we’ve accumulated nearly two years of data on the office market and while the sector is not out of the woods yet, we think we can start to refine our stresses to cater to more local metro area stresses that are playing out. While the office demand shock due to remote work is broad, we also know that certain markets are holding up better than others ( Figure 184). We focus on these differences for refining our office shocks for our revised loss projections. As always, we will continue to refine our scenarios as we learn more.
Figure 184: It’s fairly clear by now the differentiation of performance across the largest office markets
Asking rent change since Q1 2019 versus vacancy rate change since Q1 2019 across the largest 50 office markets

Source: J.P. Morgan, Costar
Our old Base Case assumed an admittedly blunt 10pt peak-to-trough decline in national office occupancies. This shock was not applied immediately but over time, proportionately with the vintage level percentage of top 3 or 5 tenant lease expirations per the CMBS data. While the utilization shock had occurred at the onset of the pandemic, the actual economic loss is contingent on actual lease rolls as tenants choose to stay, leave, or downsize. Using betas extracted from a historical regression of MSA level rent per square foot versus occupancy levels and changes in occupancy levels for the largest 20 office markets, we forecasted how much rents would fall into our gradual occupancy shocks. We also assumed a 1 for 1 change in NOIs to rents.
In our latest effort, we introduce more differentiation in occupancy declines across the largest office MSAs ( Figure 185). There is hardly any science behind these assumptions, only what we believe the new normal with occupancies will be, somewhat informed by the various mobility/utilization stats we track. Naturally, all these assumptions are subject to changes as we learn more. In addition, the other material change we implement related to NOI modeling is using fixed operational expenses to translate forecasted rents to NOIs as opposed to our prior assumption of fixing the operational expense ratio. In reality, office assets carry a lot of fixed costs so the absolute level of expenses shouldn’t change quickly over time. Here, we derive the operational expense data from the CMBS financials by vintage and fix the absolute amounts into our stress scenarios so that NOIs fall more than 1 for 1 relative to revenues ( Figure 186). Finally, as it relates to our cap rate spread mean reversion assumptions, we previously assumed the 1yr half-life speed to mean reversion as our Base Case. With less Fed cuts priced in, we move our assumption to a 2yr half-life speed for mean reversion under our new Base Case ( Figure 187).
Figure 185: We revise (and hopefully refine) our office stress scenarios for our CMBS loss model
US office actual occupancy declines since Q1 2019 as of Q1 2024, and occupancy shocks assumed for J.P. Morgan’s CMBS loss model by metro area
| Occ. Chg. | Old | New | Regression | |||
| MSA | Since 1Q19 | Base | Bearish | Base | Bearish* | R2 |
| National | -4.4% | -10% | -20% | -7.5% | -11.3% | 74.7% |
| New York | -6.1% | -10% | -20% | -6.0% | -9.0% | 42.7% |
| DC | -3.8% | -10% | -20% | -7.5% | -11.3% | 48.5% |
| Chicago | -5.0% | -10% | -20% | -7.5% | -11.3% | 89.5% |
| Los Angeles | -6.2% | -10% | -20% | -7.5% | -11.3% | 89.6% |
| Dallas | -3.9% | -10% | -20% | -6.0% | -9.0% | 61.4% |
| Boston | -4.5% | -10% | -20% | -5.6% | -8.4% | 34.9% |
| Houston | -3.5% | -10% | -20% | -3.8% | -5.6% | 66.5% |
| Atlanta | -4.3% | -10% | -20% | -6.0% | -9.0% | 94.0% |
| Philadelphia | -3.0% | -10% | -20% | -6.0% | -9.0% | 60.8% |
| Seattle | -8.9% | -10% | -20% | -11.3% | -16.9% | 78.4% |
| Minneapolis | -3.3% | -10% | -20% | -6.0% | -9.0% | 39.8% |
| Detroit | -2.6% | -10% | -20% | -3.8% | -5.6% | 74.9% |
| Phoenix | -4.4% | -10% | -20% | -6.0% | -9.0% | 83.8% |
| San Francisco | -15.4% | -10% | -20% | -15.0% | -22.5% | 64.8% |
| Denver | -6.5% | -10% | -20% | -7.5% | -11.3% | 60.0% |
Source: J.P. Morgan, CostarNote: New bearish scenario is 1.5x times the base case occupancy shocks. Regression R2 refers to the historical regression of metro area office asking rent psf versus occupancy levels and changes in occupancy. Markets highlighted in gray are those with low R2. As such, we overwrite regression betas with the national level values for projection purposes.
Figure 186: We revise our methodology of translating rent changes to NOI changes by fixing the level of operational expenses
Example of our new Base Case occupancy shock scenario and resulting declines in rent and NOI using the 2023 vintage lease roll schedule (rent and NOI is indexed to 100 at 2014)
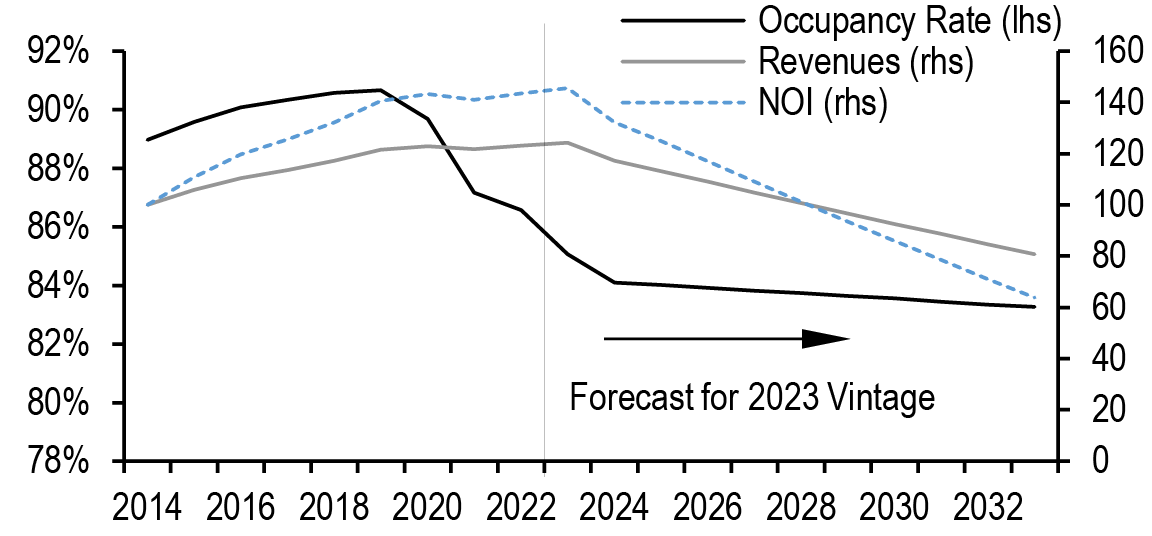
Source: J.P. Morgan, Costar
Figure 187: We also adjust our Base Case for speed of cap rate mean reversion from 1yr half life to 2yr half life
Conduit CMBS office cap rates and forecasts based on spread mean reversion to the historical average at different half life speeds (%)
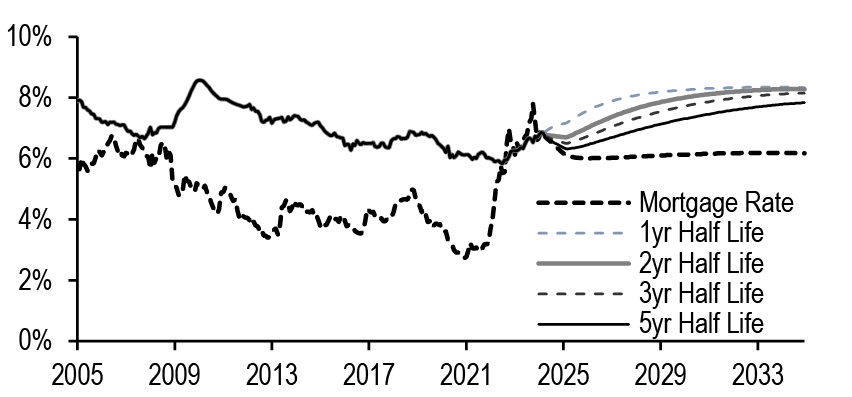
Source: J.P. MorganNote: We use our Agency MBS teams mortgage rate forecast, which is reliant on forward rates.
In short, our revised occupancy shocks in aggregate and slower mean reversion of cap rate spreads lower projected default rates while the fixed operational expense adjustment increases projected default rates under our Base Case. Our new Bearish Case just applies a multiplier of 1.5x to our Base Case occupancy shocks. Figure 188 summarizes our revised loss forecasts by vintage and by property type. While our new Base Case losses in aggregate are only 60bp higher than our old Base Case at 5%, more recently issued vintages with higher office concentrations see 1.5-2pt increases in Base Case cumulative losses as the NOI adjustment offsets lower occupancy shocks and slower cap rate mean reversion. This also means higher losses to lower IG mezz and credit bonds.
Figure 188: Our revised loss forecasts hit more recently issued vintages harder
J.P. Morgan Conduit CMBS loss model cumulative loss projections
| Vintage / Property Type | Old Base | New Base | New Bearish | Old vs. New Base | |
| All 2.0 | 2010-24 | 4.4% | 5.0% | 6.0% | 0.6% |
| Vintage | 2010 | 2.7% | 2.6% | 2.6% | 0.0% |
| 2011 | 2.7% | 2.7% | 2.7% | 0.0% | |
| 2012 | 4.1% | 4.1% | 4.1% | 0.0% | |
| 2013 | 3.5% | 3.8% | 3.8% | 0.3% | |
| 2014 | 4.9% | 4.9% | 4.9% | 0.0% | |
| 2015 | 4.3% | 4.4% | 4.5% | 0.1% | |
| 2016 | 4.8% | 4.9% | 5.2% | 0.1% | |
| 2017 | 5.2% | 5.5% | 6.3% | 0.3% | |
| 2018 | 4.8% | 5.2% | 6.2% | 0.5% | |
| 2019 | 5.2% | 6.9% | 8.4% | 1.7% | |
| 2020 | 4.8% | 6.5% | 8.1% | 1.7% | |
| 2021 | 3.7% | 5.8% | 7.4% | 2.1% | |
| 2022 | 5.6% | 7.6% | 9.9% | 2.0% | |
| 2023 | 3.0% | 4.7% | 6.1% | 1.7% | |
| 2024 | 0.7% | 2.2% | 3.1% | 1.5% | |
| Property Type | Office | 6.8% | 8.8% | 11.8% | 2.0% |
| Retail | 4.4% | 4.3% | 4.3% | -0.2% | |
| Lodging | 3.5% | 3.4% | 3.4% | -0.1% | |
| Multifamily | 1.8% | 1.7% | 1.7% | -0.1% | |
| Industrial | 1.5% | 1.4% | 1.4% | -0.1% | |
| Other | 1.5% | 1.8% | 1.8% | 0.3% | |
| Average Loss | AAA | 0.0% | 0.0% | 0.0% | 0.0% |
| By Original | AA | 0.0% | 0.0% | 0.2% | 0.0% |
| Rating | A | 0.4% | 0.7% | 3.2% | 0.3% |
| BBB+ | 5.0% | 7.7% | 13.1% | 2.7% | |
| BBB | 2.0% | 6.3% | 26.6% | 4.3% | |
| BBB- | 6.1% | 9.8% | 16.4% | 3.7% | |
| BB | 23.2% | 33.9% | 46.3% | 10.7% | |
| B | 48.5% | 55.9% | 62.4% | 7.5% | |
| NR | 79.8% | 81.6% | 83.4% | 1.8% | |
Source: J.P. Morgan
Appendix
Figure 189: Loan resolutions for all of private label CMBS
As of May 2024
| All Private Label CMBS | ||||||||||||||
| Liquidated | Paid Off | Outstanding | ||||||||||||
| Orig. Mat. Period | Before Maturity Yr | Maturity Yr | After Maturity Yr | Total | Before Maturity Yr | Maturity Yr | After Maturity Yr | Total | Perf. | Perf. Mod. | DLQ | DLQ Mod. | Total | Secur. Bal ($bn) |
| 2005 | 1% | 2% | 2% | 5% | 39% | 54% | 2% | 95% | 0% | 0% | 0% | 0% | 0% | 5.7 |
| 2006 | 2% | 0% | 0% | 2% | 41% | 56% | 1% | 98% | 0% | 0% | 0% | 0% | 0% | 14.5 |
| 2007 | 4% | 1% | 1% | 5% | 53% | 41% | 1% | 95% | 0% | 0% | 0% | 0% | 0% | 18.1 |
| 2008 | 3% | 1% | 3% | 7% | 43% | 45% | 5% | 92% | 0% | 0% | 0% | 0% | 0% | 38.7 |
| 2009 | 3% | 3% | 9% | 15% | 17% | 29% | 39% | 85% | 0% | 0% | 0% | 0% | 0% | 35.4 |
| 2010 | 3% | 6% | 15% | 25% | 20% | 37% | 18% | 75% | 0% | 0% | 0% | 0% | 0% | 39.9 |
| 2011 | 4% | 5% | 15% | 24% | 18% | 43% | 15% | 75% | 0% | 0% | 0% | 0% | 0% | 50.4 |
| 2012 | 6% | 7% | 15% | 28% | 15% | 45% | 12% | 72% | 0% | 0% | 0% | 0% | 0% | 59.3 |
| 2013 | 5% | 4% | 5% | 13% | 21% | 63% | 3% | 87% | 0% | 0% | 0% | 0% | 0% | 41.0 |
| 2014 | 8% | 3% | 6% | 17% | 19% | 59% | 5% | 83% | 0% | 0% | 0% | 0% | 0% | 47.7 |
| 2015 | 10% | 3% | 6% | 18% | 16% | 61% | 5% | 81% | 0% | 0% | 0% | 0% | 0% | 91.0 |
| 2016 | 12% | 3% | 8% | 23% | 19% | 47% | 10% | 76% | 0% | 0% | 0% | 0% | 0% | 134.8 |
| 2017 | 15% | 3% | 8% | 26% | 23% | 45% | 5% | 73% | 0% | 0% | 0% | 1% | 1% | 132.5 |
| 2018 | 2% | 2% | 1% | 5% | 51% | 34% | 9% | 94% | 0% | 1% | 0% | 0% | 1% | 28.8 |
| 2019 | 1% | 1% | 1% | 2% | 24% | 38% | 24% | 86% | 5% | 5% | 1% | 1% | 12% | 46.3 |
| 2020 | 1% | 1% | 1% | 2% | 24% | 20% | 27% | 71% | 15% | 8% | 3% | 2% | 27% | 55.7 |
| 2021 | 1% | 1% | 1% | 2% | 18% | 28% | 35% | 81% | 5% | 8% | 3% | 2% | 18% | 74.5 |
| 2022 | 1% | 1% | 2% | 4% | 30% | 37% | 9% | 75% | 7% | 9% | 3% | 1% | 21% | 66.4 |
| 2023 | 1% | 0% | 0% | 1% | 15% | 18% | 3% | 36% | 49% | 9% | 4% | 1% | 63% | 133.8 |
| 2024 | 1% | 1% | 0% | 2% | 17% | 12% | 0% | 28% | 57% | 6% | 6% | 0% | 70% | 62.4 |
Source: J.P. Morgan, Trepp
Figure 190: NCF debt yields for private label CMBS loans that were either paid off early, on-time, late or liquidated by maturity year and property type, as of May 2024
| Prepay | On Time | Late | Liquidated | |
| 2024 | ||||
| Total | 10.3% | 11.0% | n/a | 2.9% |
| Office | 9.7% | 10.6% | n/a | 5.8% |
| Retail | 11.2% | 11.2% | n/a | 3.8% |
| Lodging | 13.8% | 13.5% | n/a | 1.3% |
| Industrial | 7.2% | 12.7% | n/a | n/a |
| Multifamily | 7.8% | 8.6% | n/a | 2.3% |
| 2023 | ||||
| Total | 11.6% | 12.6% | 7.2% | 2.0% |
| Office | 12.1% | 9.8% | 7.0% | 2.1% |
| Retail | 12.0% | 10.9% | 8.8% | 3.3% |
| Lodging | 11.7% | 12.5% | 9.5% | 0.2% |
| Industrial | 12.2% | 12.9% | 9.2% | 6.3% |
| Multifamily | 10.0% | 17.6% | 5.8% | 3.0% |
| 2022 | ||||
| Total | 11.3% | 11.9% | 6.1% | 4.3% |
| Office | 12.5% | 8.5% | 4.1% | 2.5% |
| Retail | 12.1% | 10.9% | 11.7% | 6.1% |
| Lodging | 10.4% | 11.4% | 8.3% | 2.2% |
| Industrial | 11.5% | 10.0% | 1.6% | 9.3% |
| Multifamily | 9.5% | 11.1% | 10.9% | 4.2% |
| 2021 | ||||
| Total | 11.0% | 9.2% | 7.1% | 4.8% |
| Office | 11.5% | 8.5% | 8.8% | 4.8% |
| Retail | 12.1% | 11.3% | 7.9% | 5.4% |
| Lodging | 8.4% | 2.6% | 7.2% | 1.3% |
| Industrial | 12.3% | 11.7% | 4.3% | 5.7% |
| Multifamily | 10.0% | 6.8% | 5.1% | 5.0% |
Source: J.P. Morgan, Trepp
Weekly market snapshot
Figure 191: Summary of deals with ratings actions
Summary of CMBS deals with ratings actions (upgrades and downgrades), June 14, 2024 to June 27, 2024
| Deal Name | Deal Type | CMBX | Upgrade (+) / Downgrade (-) | # of Bonds w/ Ratings Changes | Senior Most Bond w/ Ratings Changes | Notches | Rating Agency |
| BAMLL 2014-FRR8 | Conduit | N/A | + | 2 | BBB | 1-2 | KBRA |
| BANC 2017-CRE2 | Other | N/A | - | 1 | BBB- | 3 | KBRA |
| BFLD 2020-EYP | SASB | N/A | - | 8 | AAA | 3-7 | KBRA |
| BMARK 2018-B8 | Conduit | 12 | - | 7 | AAA | 2-3 | Fitch |
| BMARK 2019-B9 | Conduit | 13 | - | 10 | AAA | 1-3 | Fitch |
| BX 2021-SOAR | SASB | N/A | + | 6 | AA | 2-5 | KBRA |
| CD 2018-CD7 | Conduit | N/A | - | 2 | BB | 1-2 | KBRA |
| COMM 2014-CR14 | Conduit | N/A | - | 4 | AL | 3-7 | DBRS Morningstar |
| COMM 2017-COR2 | Conduit | 11 | - | 3 | BBB- | 2-3 | Fitch |
| FREMF 2014-K40 | Agency | N/A | + | 2 | AA+ | 1 | KBRA |
| GSMS 2015-GS1 | Conduit | 9 | - | 9 | AA | 1-3 | Fitch |
| GSMS 2018-3PCK | SASB | N/A | - | 9 | AA | 1-3 | S&P |
| JPMCC 2014-C20 | Conduit | 8 | - | 2 | Ba2 | 2-3 | Moody's |
| JPMCC 2017-JP5 | Conduit | N/A | - | 2 | BB+ | 2-3 | Fitch |
| JPMCC 2017-JP6 | Conduit | N/A | - | 3 | BBB- | 2-3 | Fitch |
| JPMCC 2018-ASH8 | SASB | N/A | - | 5 | A- | 1-3 | S&P |
| JPMDB 2017-C5 | Conduit | N/A | - | 4 | A | 3 | Fitch |
| MOA 2020-WC39 | Conduit | N/A | - | 1 | BB | 2 | Fitch |
| MSBAM 2015-C27 | Conduit | N/A | - | 5 | BBBL | 3-6 | DBRS Morningstar |
| OT 2017-OT | SASB | N/A | - | 3 | A- | 1-2 | KBRA |
| WFCM 2016-BNK1 | Conduit | 10 | - | 4 | BBB | 2-3 | Fitch |
| WFCM 2017-C39 | Conduit | N/A | - | 8 | AAA | 1-3 | Fitch |
| WFCM 2017-C40 | Conduit | 11 | - | 4 | BBB- | 2 | Fitch |
| WFCM 2017-SMP | SASB | N/A | - | 5 | Aaa | 4-5 | Moody's |
Source: J.P. Morgan, Bloomberg Finance L.P.
Figure 192: CMBS ratings downgrades to upgrades ratio since March 2021
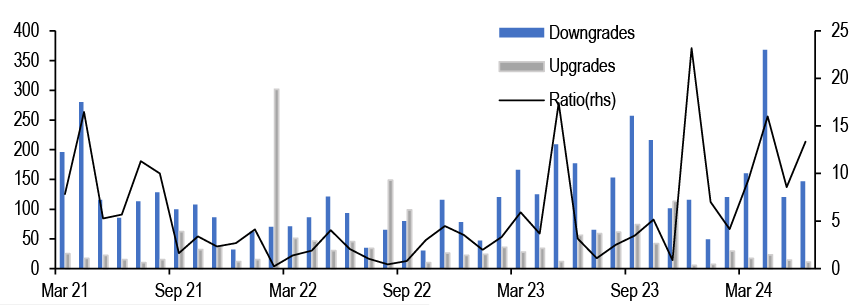
Source: J.P. Morgan, Bloomberg Finance L.P.
Primary Markets
Figure 193: Summary of recently priced deals
Summary of CMBS deals that have priced between June 14, 2024 to June 27, 2024
| Deal Name | Pricing Date | Deal Type | Deal Size ($mn) | Pricing Spread |
| FREMF 2024-K523 | 6/18/2024 | Freddie K | $700 | AS: TSOFR+55 |
| FRESB 2024-SB114 | 6/20/2024 | FRESB | $265 | A5F: J+47 A7F: J+65 A10F: J+81 |
| GSMS 2024-FAIR | 6/20/2024 | Fixed-rate SASB | $430 | A: J+185 B: J+225 C: J+290 D: J+400 E: J+525 |
| BANK 2024-5C27 | 6/21/2024 | Conduit CMBS | $801 | A2: J+101 A3: J+103 AS: J+145 B: J+175 C: J+225 |
| ARES 2024-IND | 6/25/2024 | Floating-rate SASB | $590 | A: TSOFR+175 B: TSOFR+210 C: TSOFR+240 D: TSOFR+295 E: TSOFR+400 |
| BFLD 2024-WRHS | 6/27/2024 | Floating-rate SASB | $608 | A: TSOFR+155 B: TSOFR+205 C: TSOFR+250 D: TSOFR+300 E: TSOFR+375 |
Source: J.P. Morgan, Bloomberg Finance L.P.
Weekly Tracker
Figure 194: Delinquency rate
Conduit CMBS 30-day+ delinquency rate including FC/REO and NP matured (%)
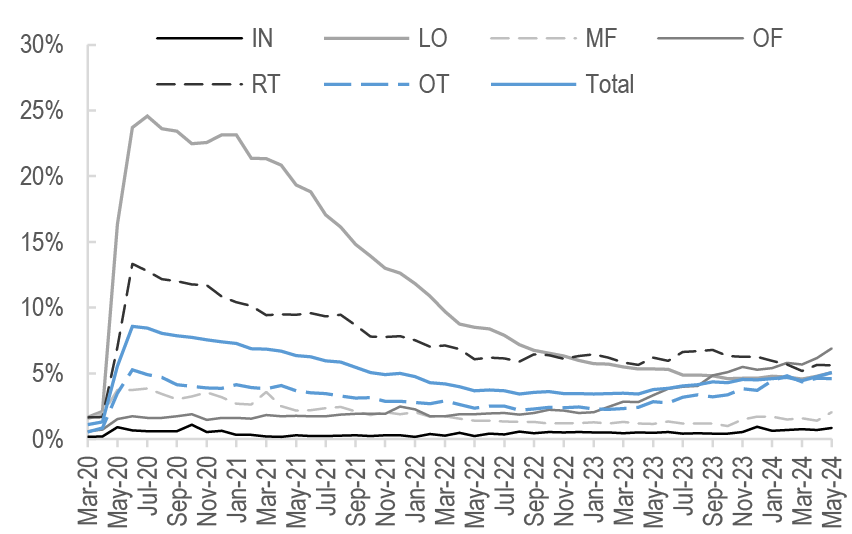
Source: J.P. Morgan, Trepp
Figure 195: Delinquency cure rates
Conduit CMBS 30 day+ delinquency to performing transition rates (%)
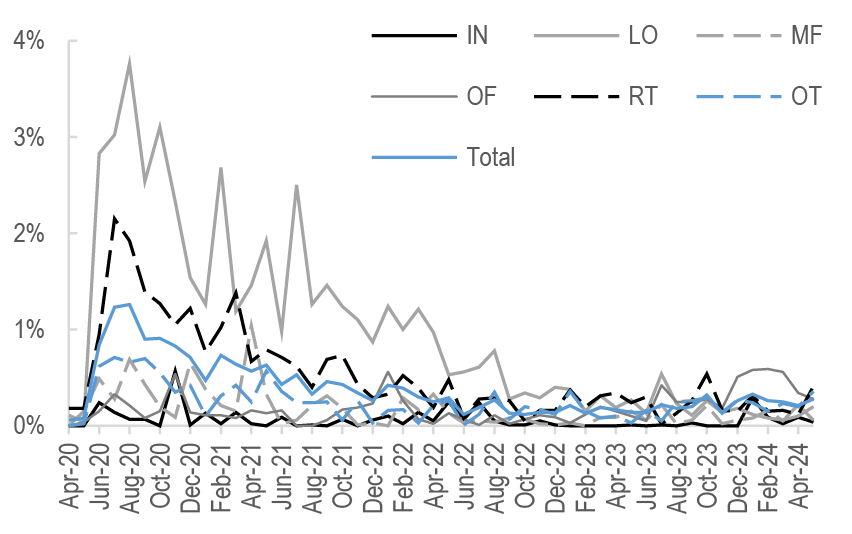
Source: J.P. Morgan, Trepp
Figure 196: Specially serviced rate
Conduit CMBS percentage of loans in special servicing (%)
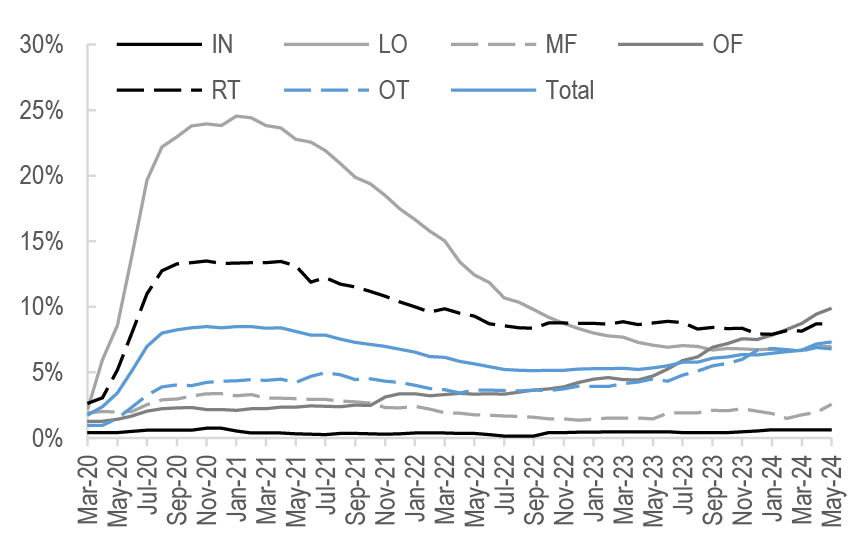
Source: J.P. Morgan, Trepp
Figure 197: Office RTTO indexed to pre-pandemic levels
Kastle System Back to Work Barometer, weekly
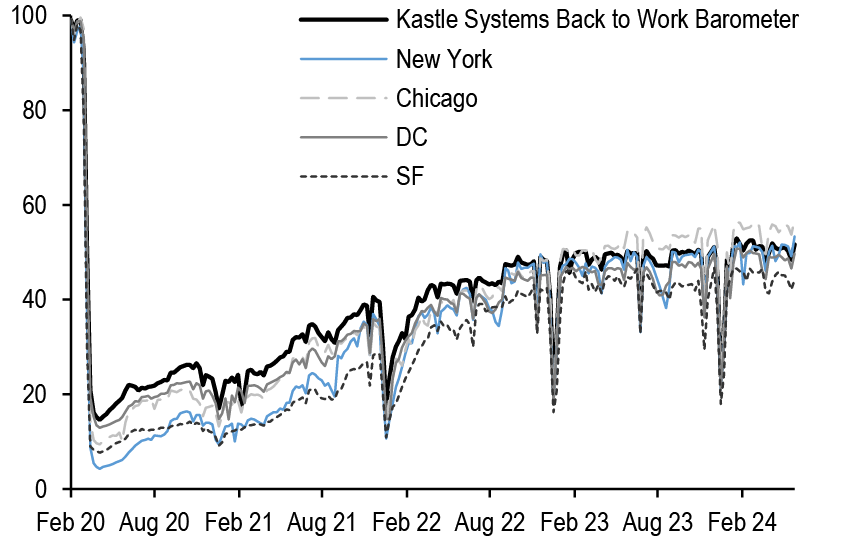
Source: Kastle Systems, Bloomberg Finance L.P.
Cross Sector Spreads
| Current | Changes | 5yr Trailing | Percentile Rank | ||||||||
| Product | Tranche / Bucket | 6/27/24 | -1w | -1m | -1y | Min | Max | 3yr | 5yr | 7yr | |
| Conduit CMBS | 3yr AAA | 92 | -2 | 0 | -53 | 26 | 463 | 31.6% | 52.1% | 66.1% | |
| Treasury Spread (bp) | 5yr AAA | 138 | -2 | -7 | -37 | 47 | 461 | 52.6% | 66.9% | 76.8% | |
| 5yr LCF AAA | 108 | 3 | 8 | N/A | 96 | 108 | 97.6% | 97.6% | 97.6% | ||
| 10yr LCF AAA | 100 | 1 | 1 | -55 | 59 | 340 | 32.0% | 53.6% | 64.4% | ||
| 10yr AS | 140 | 9 | 11 | -72 | 74 | 440 | 31.2% | 51.3% | 64.5% | ||
| 10yr AA | 170 | 12 | 12 | -155 | 90 | 565 | 34.5% | 51.7% | 65.5% | ||
| 10yr A | 210 | 10 | 2 | -285 | 123 | 756 | 26.3% | 42.0% | 56.6% | ||
| 10yr BBB- | 625 | 0 | -30 | -308 | 263 | 1354 | 40.0% | 56.3% | 60.3% | ||
| XA | 134 | 14 | -4 | -167 | 90 | 535 | 19.9% | 33.1% | 48.7% | ||
| Freddie K | 7yr A2 | 48 | 1 | 6 | N/A | 6 | 100 | 53.6% | 69.5% | 78.7% | |
| Treasury Spread (bp) | 10yr A2 | 49 | 0 | 0 | N/A | 10 | 110 | 49.7% | 66.0% | 72.5% | |
| 2020 Vintage B | 153 | 0 | -5 | -57 | 109 | 441 | N/A | N/A | N/A | ||
| 2020 Vintage C | 188 | 0 | -5 | -55 | 158 | 593 | N/A | N/A | N/A | ||
| X1 | 150 | 0 | 8 | N/A | 50 | 400 | 26.5% | 35.9% | 55.7% | ||
| X3 | 340 | 0 | 8 | N/A | 225 | 695 | 25.2% | 35.5% | 53.8% | ||
| SOFR Floater (DM) | 56 | 1 | 10 | N/A | 19 | 90 | 48.3% | 56.7% | 56.7% | ||
| FRESB | A5H (5yr Hybrid ARM) | 113 | 1 | 14 | N/A | 2 | 131 | 74.2% | 84.4% | 88.1% | |
| Treasury Spread (bp) | A10F (10yr Fixed Rate) | 82 | 1 | -2 | N/A | 16 | 126 | 49.0% | 68.0% | 74.3% | |
| Fannie DUS | 7/6.5 TBA | 53 | 1 | 8 | N/A | 7 | 110 | 53.6% | 69.1% | 76.8% | |
| Treasury Spread (bp) | 10/9.5 TBA | 54 | 1 | 1 | N/A | 14 | 135 | 42.4% | 61.7% | 65.0% | |
| SOFR SARM (DM) | 60 | 0 | 8 | N/A | 22 | 95 | 37.1% | 52.8% | 51.8% | ||
| Fannie ACES | 7yr A2 | 50 | 1 | 5 | N/A | 7 | 102 | 50.3% | 68.6% | 77.8% | |
| Treasury Spread (bp) | 10yr A2 | 52 | 0 | 1 | N/A | 12 | 120 | 51.7% | 66.4% | 71.7% | |
| GNR Project Loans | 3.5yr | 135 | 0 | 20 | N/A | 60 | 169 | 43.7% | 66.8% | 76.2% | |
| Treasury Spread (bp) | 7.5yr | 156 | 1 | 4 | N/A | 69 | 202 | 43.7% | 66.8% | 77.0% | |
| 12yr | 149 | 0 | -6 | N/A | 80 | 237 | 37.1% | 62.9% | 73.4% | ||
| Production Coupon | FN/FR 30yr PC (OAS) | 21 | 0 | -5 | -19 | -35 | 115 | 32.7% | 47.2% | 38.9% | |
| FN/FR 30yr PC (ZV) | 124 | 3 | 3 | -8 | -2 | 173 | 64.2% | 78.0% | 84.3% | ||
| ABS | 3yr AAA Credit Card | 48 | 0 | 1 | -17 | 12 | 207 | 46.1% | 65.2% | 71.4% | |
| Treasury Spread (bp) | 3yr AAA Prime Auto | 66 | 0 | 2 | -24 | 15 | 207 | 46.0% | 62.8% | 73.4% | |
| 3yr BBB Subprime Auto | 150 | 0 | 10 | -100 | 72 | 566 | 24.0% | 42.8% | 58.6% | ||
| CLO | AAA | 122 | 10 | 21 | -74 | 101 | 408 | 23.2% | 28.3% | 37.6% | |
| Discount Margin | BBB | 371 | -1 | -8 | -156 | 323 | 972 | 23.1% | 30.6% | 48.3% | |
| BB | 777 | 3 | -8 | -221 | 693 | 1,756 | 28.9% | 38.4% | 56.0% | ||
| JULI (ex-EM) | 3-5yr | 89 | 2 | 8 | -37 | 58 | 407 | 27.3% | 39.6% | 41.3% | |
| Treasury Spread (bp) | 5-7yr | 100 | 2 | 9 | -38 | 71 | 372 | 27.9% | 38.1% | 33.5% | |
| 7-10yr | 115 | 1 | 9 | -48 | 87 | 368 | 26.3% | 35.2% | 31.4% | ||
| 7-10yr A | 99 | 1 | 8 | -41 | 68 | 316 | 26.6% | 39.6% | 39.3% | ||
| 7-10yr REITs | 130 | 2 | 7 | -68 | 98 | 350 | 25.3% | 36.2% | 28.9% | ||
| High Yield | Domestic HY | 338 | -4 | 8 | -118 | 317 | 1,139 | 6.4% | 3.8% | 2.7% | |
| Spread to Worst (bp) | Energy | 256 | -7 | 10 | -137 | 234 | 2,395 | 5.3% | 3.2% | 2.3% | |
| Swap Spreads | 3yr | 9 | -1 | -3 | -8 | -6 | 24 | 12.5% | 12.5% | 12.5% | |
| (bp) | 5yr | 1 | -1 | -3 | -6 | -8 | 15 | 9.7% | 9.7% | 9.7% | |
| 10yr | -12 | -1 | -4 | -15 | -15 | 11 | 0.6% | 0.6% | 0.6% | ||
Cross Sector Spreads (continued)
| Current | Changes | 5yr Trailing | Percentile Rank | ||||||||
| Product | Tranche / Bucket | 6/27/24 | -1w | -1m | -1y | Min | Max | 3yr | 5yr | 7yr | |
| CMBX (bp) | AAA17 | 88 | 0 | 10 | N/A | 74 | 91 | 85.8% | 85.8% | 85.8% | |
| AAA16 | 83 | 0 | 9 | -14 | 70 | 119 | 36.1% | 36.1% | 36.1% | ||
| AAA15 | 80 | 1 | 9 | -13 | 60 | 115 | 40.6% | 40.6% | 40.6% | ||
| AAA14 | 76 | 0 | 9 | -11 | 45 | 109 | 53.5% | 61.1% | 61.1% | ||
| AAA13 | 73 | 0 | 8 | -8 | 42 | 167 | 58.5% | 68.5% | 68.5% | ||
| AAA12 | 70 | 1 | 8 | -7 | 37 | 162 | 63.8% | 75.7% | 78.5% | ||
| AAA11 | 66 | 0 | 7 | -5 | 32 | 146 | 64.1% | 76.5% | 80.7% | ||
| AAA10 | 63 | 1 | 7 | -3 | 26 | 141 | 68.2% | 79.0% | 84.5% | ||
| AAA9 | 60 | 1 | 3 | -2 | 21 | 127 | 73.4% | 82.3% | 87.4% | ||
| AAA8 | 63 | 0 | 8 | 8 | 18 | 117 | 89.8% | 92.7% | 94.8% | ||
| AAA7 | 0 | 0 | 0 | -47 | 0 | 107 | 8.1% | 3.6% | 1.1% | ||
| BBB-17 | 528 | 13 | 40 | N/A | 482 | 583 | 73.6% | 73.6% | 73.6% | ||
| BBB-16 | 621 | 12 | 46 | -228 | 558 | 879 | 39.2% | 39.2% | 39.2% | ||
| BBB-15 | 647 | 14 | 55 | -245 | 375 | 922 | 59.2% | 59.2% | 59.2% | ||
| BBB-14 | 826 | 15 | 49 | -128 | 320 | 985 | 80.1% | 83.3% | 83.3% | ||
| BBB-13 | 906 | 18 | 54 | -161 | 339 | 1,151 | 72.4% | 80.0% | 80.0% | ||
| BBB-12 | 958 | 16 | 56 | -277 | 309 | 1,282 | 68.7% | 80.1% | 82.4% | ||
| BBB-11 | 815 | 7 | 48 | -283 | 302 | 1,174 | 67.8% | 76.9% | 82.7% | ||
| BBB-10 | 1,320 | 8 | 38 | -267 | 297 | 1,819 | 71.0% | 82.6% | 87.6% | ||
| BBB-9 | 1,844 | 60 | 127 | 190 | 301 | 1,850 | 99.9% | 99.9% | 99.9% | ||
| CDX (bp) | 5yr IG | 54 | 1 | 3 | -16 | 44 | 152 | 25.1% | 36.1% | 31.1% | |
| 5yr HY | 341 | 0 | 5 | -110 | 267 | 882 | 26.2% | 40.1% | 46.1% | ||
Source: J.P. Morgan
2024 Asset-backed Securities Midyear Outlook
Bigger, better, tighter
- We expect that ABS should continue to outperform over 2H24, with tighter spreads despite brisk issuance, and structures holding up well against minimal credit deterioration
- Consumer ABS delinquencies and losses should increase marginally given J.P. Morgan economists’ projected 4.0% unemployment rate for full year 2024 versus 3.6% for 2023
- Concurrently, lenders have mostly maintained or tightened underwriting over the past year or so, while excess spread and credit enhancement on ABS remain robust
- Furthermore, credit metrics on consumer ABS pools are better than those of aggregate US households in sectors such as credit cards and auto loans, reflecting the credit quality of securitized assets
- We project a new post financial crisis record ABS supply of $295bn for the full year, versus $178bn year to date and $256bn in 2023, with the auto sector continuing to dominate
- Despite spreads having rallied, yields and relative value have attracted strong demand for ABS across an expanding investor base and provided healthy liquidity in secondary
- In 2H24, we expect our indicative AAA credit card ABS (3-year) spreads to narrow to Treasury +40bp (versus +48bp currently and the 2023-2024 range of +42-75bp) and BBB subprime auto ABS (3-year) to +135bp (versus +150bp currently and range of +140-340bp)
2H24 is expected to see record annual new issue volume, minimal credit deterioration and tighter spreads
We look for the ABS market to finish 2024 with record new issue supply, spreads at the tight end of their two-year ranges and solid structures against minor underlying credit deterioration. We project full year 2024 ABS issuance at $295bn, a new post financial crisis high with year-to-date 1H24 at $178.3bn, versus $131bn in 1H23 and $256bn for full year 2023. Primary market activity is expected to slow down in 2H versus 1H due to November elections and a possible Fed cut. Nonetheless, the blazing issuance pace thus far should ensure a record total, surpassing the previous post-2007 high of $267bn in 2021. Meanwhile, ABS spreads stand near the tight end of their year-to-date range having rallied with only brief soft patches under the intense supply pressure. Investor demand remains healthy and sufficient to absorb the supply given the still attractive relative value and spread pickup in ABS versus comparable credits. Our 2024 year end forecasts are for ABS spreads to reach the tight end of their two-year range, with our indicative AAA credit card ABS (3-year) at Treasury +40bp (versus +48bp currently and the 2023-2024 range of +42-75bp) and BBB subprime auto ABS (3-year) at +135bp (versus +150bp currently and range of +140-340bp).
Consumer credit holding up
On consumer credit over the rest of 2024, we expect minimal deterioration in line with a solid labor market. Delinquencies and losses should increase minimally as our J.P. Morgan economists project 4.0% unemployment in 3Q24 and 4.1% in 4Q24 (as well as 4.1% for the following two quarters) marginally up from 3.8% in 1Q24 and 4.0% in 2Q24. In addition, lenders have maintained their underwriting standards and ABS structures remain robust. To date in 2024, consumer ABS performance has been better than expected as labor markets showed surprising strength and unemployment forecast for the year was revised down. At the low end of the consumer credit spectrum, subprime auto and FFELP ABS delinquencies seem to have eased off their peaks ( Figure 198). For prime borrowers, we previously noted an uptick in delinquencies coming into the year, a trend that has persisted, but still at a slow and manageable pace. For example, our bankcard ABS master trust performance index 30+ delinquencies stand at 1.36% for May, versus 1.16% a year ago and 1.45% for May 2019. On newer unsecured products for prime borrowers, MPL ABS delinquencies are trending to new highs, reaching 4.93% for May. Historically, charge-offs on our bankcard ABS index went up one for one with increases in unemployment rate during previous recession periods. With no recession in the year ahead forecast, unemployment projected to be mostly flat and inflation in check, we expect consumer delinquencies will continue to roll through slowly and credit losses should plateau late in 2024. In the meantime, excess spread, the first loss protection for ABS noteholders, remains near record highs on our bankcard ABS index at 19.10% in May versus 17.73% a year ago and 14.36% in May 2019 (3-month averages). On MPL ABS, lenders have made tweaks to tighten underwriting, generally resulting in fewer lower credit tiered loans and higher weighted average credit scores on securitized pools following the underperformance of the late 2022/early 2023 cohort.
Figure 198: 30+ delinquencies across consumer ABS asset classes
30+ arrears as % of current balance
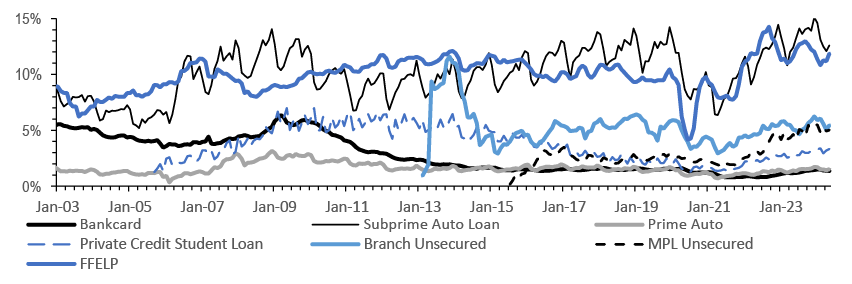
Source: J.P. Morgan, Intex
Of note, the federal student loan “on-ramp” relief program will end in September with credit bureaus to resume reporting of delinquencies and defaults. FFELP loans underlying ABS are not held by the Department of Education, and do not qualify for the on-ramp. Additionally, private credit student loans are also excluded. As such, FFELP and private credit ABS pools have reported notably higher, and true, delinquency rates, while aggregate student loan data (which is heavily federal Direct loans) reported near 0% delinquencies ( Figure 199). Student loan arrears on aggregate will spike up notably from their artificial lows in 4Q24 once credit bureau reporting resumes in October. However, we do not anticipate contagion impact on other consumer credit given federal student loans should have lower payment priority for borrowers than mortgages, auto loan, and credit card debt. FFELP loan borrowers also have alternative relief programs, including income-based repayment as well as the option to consolidate into Direct that should mitigate secondary impacts from the on-ramp expiration. Broadly, private credit student loan borrowers are of much higher credit quality than federal student loan borrowers, with co-signers on in-school private education loans and with higher disposal incomes on refi loans, which should support credit trends.
Figure 199: 90+ delinquencies on student loan worse than aggregate household credit reported by the Fed due to the on-ramp relief for Department of Education owned federal student loans
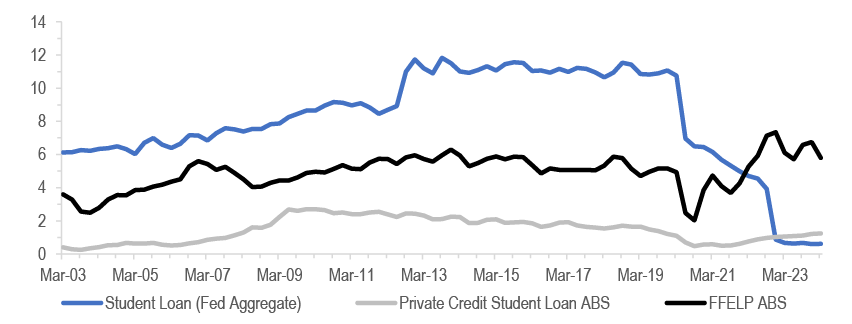
Source: New York Fed Consumer Credit Panel/Equifax, Intex, J.P. Morgan
Outside of student loans, we note that credit metrics for auto loan and credit card ABS pools are significantly better than those reported by the Fed for aggregate household ( Figure 200 and Figure 201). Specifically, the 90+ delinquencies reported in the Fed’s quarterly Household Debt and Credit Report (HDCR) includes severely derogatory accounts (i.e., repossessions, charge offs, foreclosures etc.) in addition to past due accounts. In contrast, consumer ABS 90+ metrics excludes charged-off accounts and certain repossessions. We estimated that severely derogatory balances accounted for approximately 80% and 90% of 90+ delinquencies for cards and autos, respectively based on the NYFed economists’ “Mind the Gap in Delinquency Rates” August 2019 report, which highlighted the mismatch between credit bureau data and accounting on lender books. Securitized pools represent only a small slice (approximately 10% across autos, credit cards and student loans) of aggregate consumer debt outstanding and are heavily concentrated in prime accounts versus aggregate household debt. For example, credit card ABS outstandings total approximately $80bn versus household credit card debt at $1.11 trillion, and the bulk of credit card ABS trust receivables are concentrated with prime borrowers in very seasoned accounts (on average, close to 90% with FICO greater than 660 and 60-200+ month old accounts). Furthermore, we note that the performance of receivables securitized in ABS master trusts is much better than that of aggregate managed receivables reported on banks’ balance sheets since the financial crisis. Our bankcard ABS master trust delinquencies and charge-offs consistently tracked lower than that for aggregate card receivables across all commercial banks since 2010 ( Figure 202 and Figure 203). Those trends reflected bankcard ABS sponsors securitizing credit card receivables that are higher up in quality, with greater concentrations in prime and superprime borrowers, as well as in more seasoned accounts. More recently, while consumers are clearly feeling the impacts of macroeconomic softness, consumer credit risk to ABS investors remains very well protected by high quality collateral and robust structures.
Figure 200: 90+ delinquencies on bankcard ABS notably better than levels reported for aggregate households
Quarterly
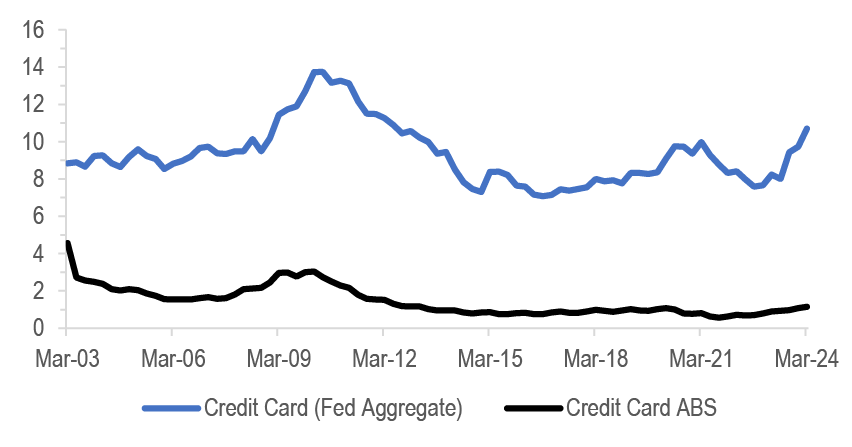
Source: New York Fed Consumer Credit Panel/Equifax, Intex, J.P. Morgan
Figure 201: 90+ delinquencies on auto loan ABS notably better than levels reported for aggregate households
Quarterly
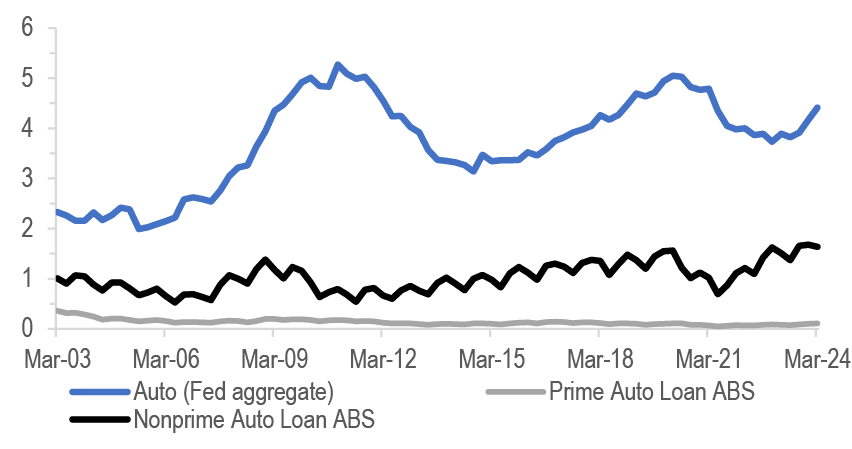
Source: New York Fed Consumer Credit Panel/Equifax, Intex, J.P. Morgan
Figure 202: 30+ delinquencies lower for card receivables in bankcard ABS than on total on bank balance sheets
Quarterly
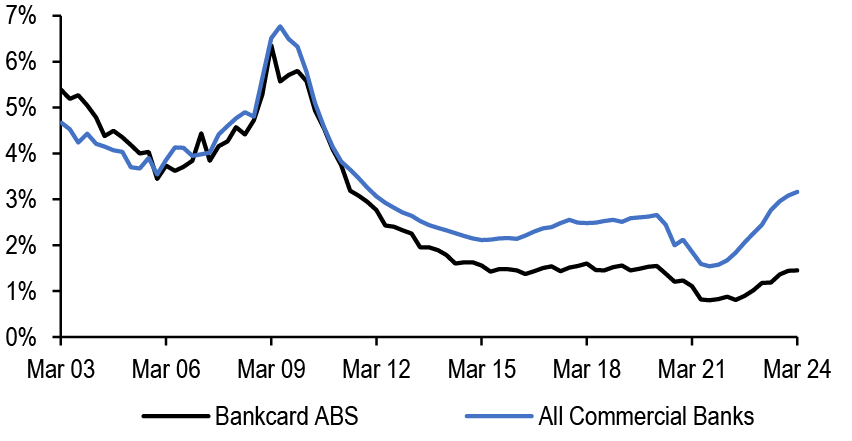
Source: J.P. Morgan, ABS deal documents, FFIEC
Figure 203: Charge-offs lower for card receivables in bankcard ABS lower than on total on bank balance sheets
Quarterly
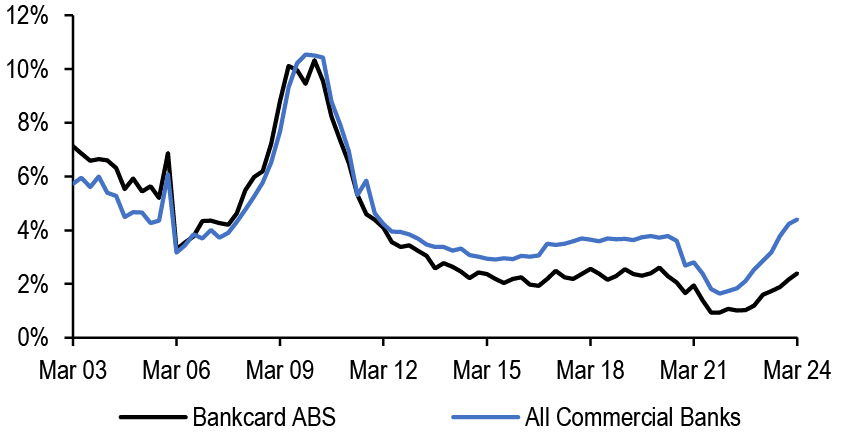
Source: J.P. Morgan, ABS deal documents, FFIEC
Performance of lower credit quality borrowers showed signs of stabilization after having previously deteriorated much faster than the more prime cohorts ( Figure 204). Through the post-pandemic normalization period, we saw rampant increase in arrears and losses on the subprime borrower base and subprime auto loan ABS delinquencies surpassed 2019 levels last year. Since the weakness, ABS sponsors in subprime, and credit broadly, resorted to tighter underwriting (e.g., shift up in credit spectrum on new originations) and servicing in 2023 due to the uncertain economic conditions stoked by high inflation. Since last year, there has been some improvement/stabilization in delinquencies and losses in the lower prime cohort. For example, 30+ delinquencies at 15 months of loan seasoning in the 600-619 band across non-prime auto loan is tracking 12.4% for 23Q1, slightly under the 13.3% for 1Q22, but still worse than the pre pandemic cohorts ( Figure 205). In addition to the inflation strain on low-end of the consumer spectrum, upward FICO-drift has further stressed delinquency prints for post pandemic vintages. Looking ahead under the no recession/no major labor market weakness scenario, we expect the worst of the non-prime/near-prime deterioration is behind us.
Figure 204: 30+ delinquencies on nonprime auto ABS by credit score band
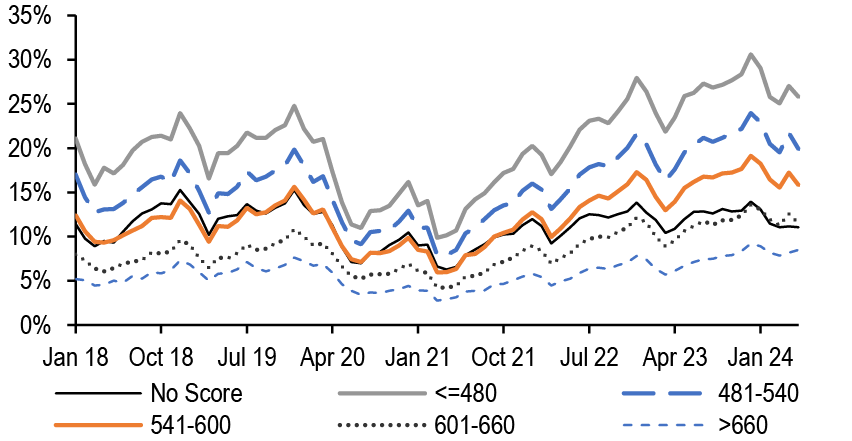
Source: J.P. Morgan, form ABS-EE via 1010data
Figure 205: 30+ delinquencies on 600-619 loans in nonprime auto loan ABS by loan age and origination quarter
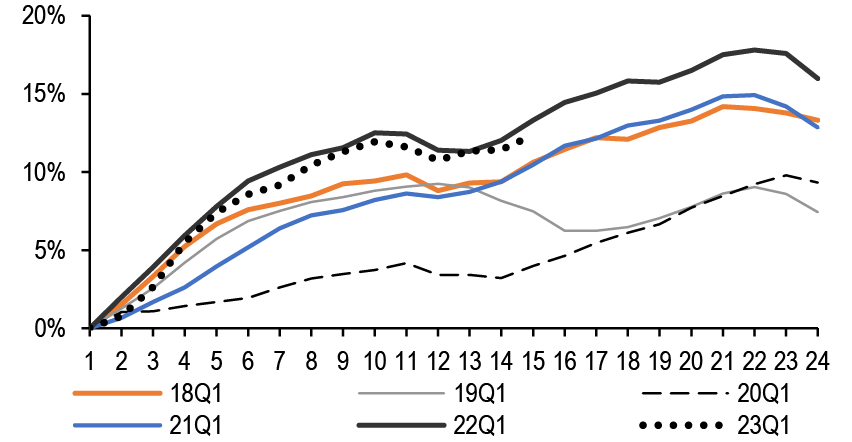
Source: J.P. Morgan, form ABS-EE via 1010data
While the initial post-pandemic normalization trends that impacted the non-prime segments are showing early signs of stabilization, more recently we have seen an uptick in arrears for prime borrower segments. Compounded effects of inflation on household and consumer expenses have resulted in this lagged credit normalization/deterioration for the higher prime segments, with some of the uptick in delinquencies attributed to the FICO drift. Nonetheless, the absolute level of increase (versus 2022) is still very low and the 2022 vintage saw practically no credit normalization. On the 700-719 credit score band, for example, 30+ delinquency is trending 1.4% at loan age 15 months for 1Q23 origination, slightly higher compared to 1.1% for 1Q22, which in turn was almost in line with pre pandemic vintages ( Figure 206). Similarly, on the unsecured consumer marketplace lending front, 1Q23 origination cohort for credit score band >720 is trending higher than 1Q22 and prior vintages ( Figure 207). Given the more default conscious nature of the prime segments with the borrower juggling through payments to avoid default, these arrears have not translated to elevated losses thus far and may not under favorable no recession and decent labor market conditions.
Figure 206: 30+ delinquencies on 700-719 loans in prime auto loan ABS by loan age and origination quarter
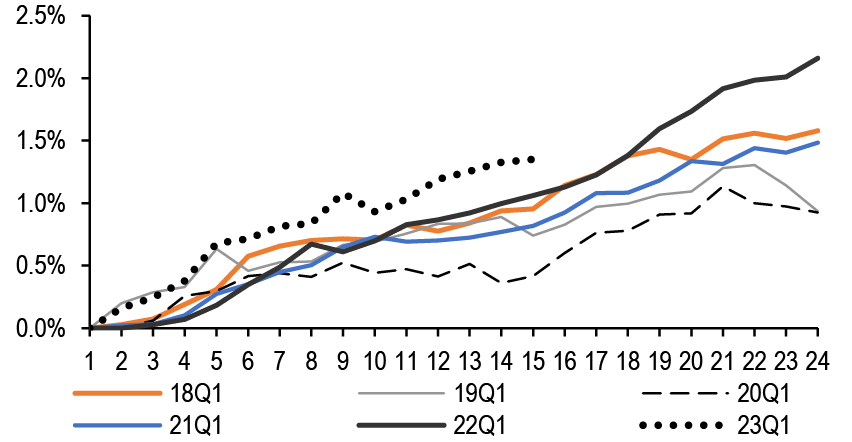
Source: J.P. Morgan, form ABS-EE via 1010data
Figure 207: 30+ delinquencies on >720 loans in marketplace lending ABS by loan age and origination quarter
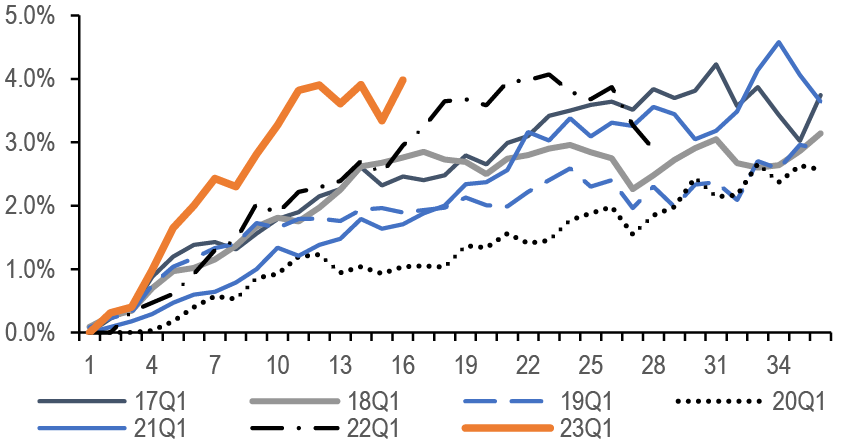
Source: J.P. Morgan, dv01
2024 likely a record ABS supply year; demand keeping up
With year-to-date supply at $178.3bn, we increased our projected full year 2024 ABS issuance to $295bn, a new post financial crisis record ( Figure 208) reflecting heavy issuance out of the auto and “other” sectors. In comparison, 1H23 saw $131bn in ABS supply with full year 2023 at $256bn. This year, the primary market activity is expected to slow down in 2H versus 1H due to the upcoming elections and a possible Fed cut. Nonetheless, the blazing issuance pace thus far should ensure a record total, surpassing the previous post-2007 high of $267bn in 2021. Auto ABS has been the main driver of the record-breaking volumes, with loans and leases being the largest segments. With auto sales this year on pace to match last year, we expect 2H24 will continue to see a steady flow of new issues from programmatic issuers in the retail auto ABS segments. Thus far, we have also seen $13.6bn in auto CLN issuance from four issuers this year versus just $0.6bn from two issuers in all of 2023. CLN issuance activity is expected to pick up as more banks seek capital relief from regulators. We note that banks have to get regulatory approval for CLN offerings and are limited to a $20bn notional cap across assets (including mortgages, auto loans, etc.) that are eligible for risk transfer. While banks have been active issuers in auto CLN and ABS, credit card securitization has been more moderate by comparison. Wells Fargo launched its debut bankcard ABS program this year, but Capital One and Discover are likely sidelined with their pending merger. Equipment ABS issuance maintains a brisk pace with programmatic issuers as well as new sponsors (e.g., Clicklease, an equipment leasing company to small businesses across all credits scores). Student loan ABS issuance year-to-date is ahead of last year’s pace at $6.3bn year-to-date, but FFELP issuers remain absent and private credit student loan issuers adjust originations to better align with demand under a high-rate environment. On the plus side, the sector in 1H23 did see first-time issuers (MPOWER and Tiden Park-Ascent) as well the first CLN ($0.21bn offered) from Bayview referencing Sallie Mae originated private credit student loans. In unsecured consumer loan ABS, we expect $15bn in 2024 supply versus $14bn in 2023 and $16bn in 2022. Sponsors have curtailed originations significantly from the 2021-2022 levels and have also established other funding channels (outside of the widely syndicated ABS transactions). The “other” ABS sector saw significant contributions in 1H24 with $6.1bn from whole business/franchise ABS (including $3.5bn from Subway’s debut deal) and $4.7bn from various data center ABS sponsors ( Figure 205).
Figure 208: ABS supply and forecasts by sector
$ billions
| 2020 | 2021 | 2022 | 2023 | 1H23 | 2024 YTD | 2024 Full Year Projected | |
| Credit Cards | 4 | 17 | 32 | 23 | 11.5 | 11.6 | 21 |
| Autos | 98 | 132 | 110 | 146 | 71.4 | 95.7 | 170 |
| Prime Loan | 46 | 50 | 50 | 73 | 32.4 | 43.7 | 85 |
| Non-prime Loan | 28 | 43 | 33 | 34 | 17.2 | 24.5 | 40 |
| Lease | 19 | 27 | 16 | 23 | 12.2 | 17.7 | 27 |
| Fleet & other | 6 | 13 | 11 | 16 | 9.6 | 9.8 | 18 |
| Student Loans | 17 | 26 | 7 | 7 | 3.8 | 6.3 | 10 |
| FFELP | 5 | 8 | - | - | - | - | 1 |
| Private Credit | 12 | 18 | 7 | 7 | 3.8 | 6.3 | 9 |
| Equipment | 13 | 19 | 22 | 21 | 9.9 | 15.9 | 23 |
| Floorplan | 4.3 | 1 | 1 | 4 | 3.6 | 4.9 | 6 |
| Unsecured Consumer | 9 | 17 | 16 | 14 | 5.9 | 8.3 | 15 |
| MPL | 4 | 8 | 9 | 8 | 3.6 | 3.1 | |
| Branch & other | 5 | 9 | 7 | 7 | 2.3 | 5.2 | |
| Other | 34 | 55 | 56 | 41 | 24.4 | 35.7 | 50 |
| Total ABS | 179 | 267 | 244 | 256 | 130.5 | 178.3 | 295 |
| % 144A | 57% | 61% | 50% | 56% | 55% | 62% | |
| % Floating-rate | 4% | 5% | 4% | 7% | 6% | 9% |
Source: J.P. Morgan
Figure 209: Other ABS supply
$ billions
| 2020 | 2021 | 2022 | 2023 | 1H23 | 2024 YTD | |
| Franchise/Whole Bus. | 4.8 | 13.7 | 6.6 | 1.7 | 0.8 | 6.1 |
| Data Center | 2.6 | 6.2 | 1.0 | 5.9 | 2.9 | 4.7 |
| Device Payment | 4.4 | 3.1 | 5.3 | 4.5 | 3.0 | 4.5 |
| Fiber | 0.2 | 1.3 | 1.2 | 4.0 | 2.4 | 3.5 |
| Solar | 2.7 | 3.2 | 4.0 | 4.2 | 2.3 | 3.2 |
| Stranded Asset/ Utility | 2.3 | 21.2 | 7.8 | 6.2 | 2.1 | |
| Timeshare | 1.9 | 2.4 | 2.6 | 2.5 | 1.0 | 2.0 |
| Insurance | 2.2 | 1.1 | 2.3 | 2.4 | 1.2 | 1.8 |
| Aircraft | 2.6 | 8.5 | 1.1 | 0.7 | 1.7 | |
| Containers | 7.3 | 5.6 | 0.8 | 0.3 | 0.3 | 0.8 |
| Railcar | 0.5 | 2.8 | 0.9 | 0.2 | 0.6 | |
| SBL | 0.4 | 1.0 | 1.7 | 1.1 | 0.6 | 0.5 |
| Trade Rec. | 0.3 | 0.5 | ||||
| Healthcare | 0.4 | 0.4 | 0.4 | 0.4 | 0.3 | |
| Taxes | 0.5 | 0.1 | 0.3 | 0.2 | 0.3 | |
| PACE | 0.3 | 0.8 | 0.5 | 0.7 | 0.4 | 0.3 |
| Miscellaneous | 4.0 | 2.3 | 6.3 | 4.1 | 2.8 | 2.9 |
| Total Other ABS | 34.4 | 55.2 | 56.0 | 40.8 | 24.4 | 35.7 |
Source: J.P. Morgan
The ABS market successfully digested supply this year, including the record amount of new issues with a growing and well-engaged ABS investor base. Strong investor appetite for ABS paper sustained the notable spread compression, with only a few soft patches for supply fatigue in 1H24. In the primary market, investor account type has been largely consistent through the years, with the recent slack in bank demand offset by money managers ( Figure 210). Asset managers accounted for about 68% of all ABS new issue purchases through 1H24. Asset managers typically see new money/mandates at the start of the year to fuel purchases, with in-flows/activity fading seasonally towards year end. Year-to-date, insurance accounts have purchased 12% of total ABS stock, in line with the 12%-13% range in prior years. Hedge fund/private equity participation has remained steady at 3%, increasing sequentially through the pandemic years reflective of more esoteric assets/structures and higher yields across ABS. Moreover, we see a slightly higher concentration of purchases by the largest accounts, indicative of a touch more lumpiness in the ongoing year compared to 2023. For instance, the top five and ten largest accounts bought 25% and 37% of total ABS so far this year, compared to 23% and 36% through 2023, respectively. Nonetheless, number of investors active in the primary ABS market increased year-to-date compared to 1H23.
Figure 210: ABS new issue purchase shares by investor type
| 2018 | 2019 | 2020 | 2021 | 2022 | 2023 | 1H24 | |
| Asset Manager | 63% | 62% | 62% | 58% | 60% | 67% | 68% |
| Insurance | 13% | 13% | 13% | 12% | 13% | 12% | 12% |
| Bank | 14% | 12% | 12% | 14% | 14% | 6% | 5% |
| Pension | 5% | 6% | 5% | 9% | 8% | 9% | 8% |
| Hedge Fund/PE | 1% | 1% | 1% | 1% | 2% | 3% | 3% |
| Other | 4% | 6% | 6% | 6% | 3% | 3% | 3% |
| Top 5 % | 24% | 19% | 21% | 20% | 22% | 23% | 25% |
| Top 10% | 37% | 31% | 35% | 32% | 33% | 36% | 37% |
Source: J.P. MorganNote: The table above is based on J.P. Morgan syndicated ABS transactions as of 1H24. The “other account type includes corporations,credit unions, government agencies, sec lenders, international investor, selling groups and broker-dealers
In addition to aggregate purchases, given the heightened new issue activity in the auto ABS sector, we reviewed demand trends across the prime auto loan, nonprime (including near-prime) and other auto (retail lease, commercial fleet, rental fleet and dealer floorplan) segments. Year-to-date auto ABS supply has accounted for roughly 56% of total ABS issuance. Other auto ABS supply as a percentage of all auto supply has decreased to 32% year-to-date compared to 35% in 1H23, while prime and nonprime auto loan segment share is tracking 44% and 24% respectively, compared to 42% and 23% respectively, in 1H23 ( Figure 211). Through 1H24, hedge funds and private equity investor base have accounted for 6% of all nonprime auto loan ABS purchases versus 3% in the prior year, offsetting some of the insurance and pension declines through those periods. Within the prime auto loan segment, share of asset manager purchases declined from 70% in 1H23 to 65% in 1H24, with banks and other investor types compensating for that decline. Across the other auto segment, demand trends remained consistent with a slight decline in insurance concentration. Investor demand concentration across auto segments was mixed, with slight uptick in lumpiness across other auto segment for top five account purchases and allocations less concentrated on top ten basis for prime and non-prime auto loans. Auto ABS investor base is sufficiently diverse and deep to absorb the brisk supply projected for the segment through 2H24.
Figure 211: Auto ABS new issue purchase shares by investor type
| Nonprime Loan | Prime Loan | Fleet/Lease/Rental/Floorplan | ||||
| 1H23 | 1H24 | 1H23 | 1H24 | 1H23 | 1H24 | |
| Asset Manager | 68% | 68% | 70% | 65% | 77% | 77% |
| Insurance | 17% | 15% | 10% | 10% | 10% | 7% |
| Bank | 1% | 1% | 5% | 6% | 5% | 5% |
| Pension | 8% | 8% | 13% | 13% | 5% | 6% |
| Hedge Fund/PE | 3% | 6% | 1% | 1% | 2% | 1% |
| Other | 2% | 2% | 3% | 5% | 1% | 3% |
| Top 5 % | 36% | 36% | 28% | 28% | 33% | 34% |
| Top 10% | 56% | 52% | 44% | 41% | 49% | 49% |
| % of Total Auto Supply | 23% | 24% | 42% | 44% | 35% | 32% |
Source: J.P. Morgan
Note: The table above is based on J.P. Morgan syndicated ABS transactions as of 1H24. The “other account type includes corporates,credit unions, government agencies, sec lenders, international investor, selling groups and broker-dealers. % of total supply is based on the aggregate auto ABS gross issuance.
On the secondary front, year-to-date flows saw decent increases from previous years as well as strong seasonal patterns and correlation to new issue volumes. Monthly BWIC volumes averaged $5.1bn for 1H24, compared to $5.1bn in 2023, $4.5bn in 2021-2022 and 2019 monthly average of $7.6bn. Trading volume, as represented by monthly average TRACE, was $14bn for 1H24, up from $12bn in 2023 and the pandemic lows of $11bn in 2021 and 2022, and roughly at par with $14.5bn average in 2019. In tandem with new issue, traditionally March tends to be busiest for TRACE and BWIC activity, while summer and winter months tend to be the lulls ( Figure 212). Additionally, in line with the record year-to-date new issue supply, March and April, at ~$18bn each, recorded the highest monthly secondary trading volume since March 2020. Dealer inventory levels for ABS also exhibit seasonality, with typically lower levels in the slow summer months and declining levels at year end. However, 1H24 has seen a buildup in dealer inventory reflecting heavy secondary and primary volumes as well as the tight credit spread environment ( Figure 213). Street has taken down bonds in recent weeks to make room for the flood of new issues. For context, current dealer inventory levels for credit card at $539mn and auto ABS at $3,243mn represents a 2.8x and 1.4x increase from $190mn and $2,246mn at the start of this year respectively. Student loan ABS inventory levels had ticked up significantly following the FFELP ABS downgrades (on the back of Fitch’s U.S. sovereign downgrade) in August 2023. Nonetheless, that stock has normalized, and current student loan inventory level is at $803mn, a healthy decline from $1,390mn at the start of this year. Broadly, dealer inventory levels have generally trended lower in recent years than pre-pandemic. Dealer inventory as of June 19th totaled $9.3bn, above the average size of $7.4bn through 2022-2023 versus average 2018-2019 levels of $10-$11bn.
Figure 212: ABS secondary activity tightly correlated with primary market volumes
ABS monthly issuance, BWIC and TRACE trading volume ($bn)
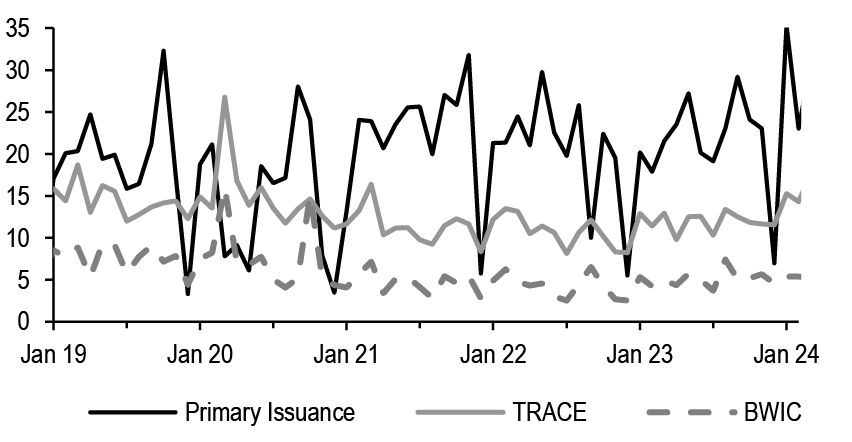
Source: J.P. Morgan, FINRA-TRACE
Figure 213: Primary dealer statistics net position by asset type
Primary dealer net position ($bn)
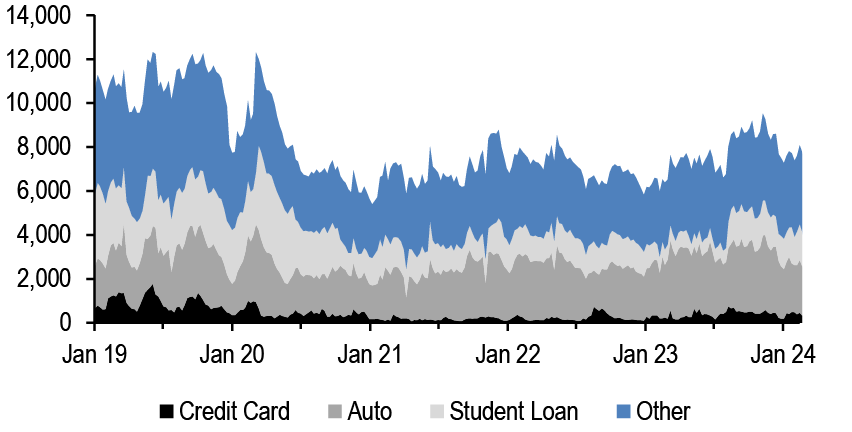
Source: J.P. Morgan, FRBNY
Note: Reported every Thursday for week ending Wednesday
ABS spreads still have room to tighten versus comparables
Our 2024 year-end forecasts are for ABS spreads to reach the tight end of their two-year range ( Figure 214), with our indicative AAA credit card ABS (3-year) at Treasury +40bp (versus +48bp currently and the 2023-2024 range of +42-75bp) and BBB subprime auto ABS (3-year) at +135bp (versus +150bp currently and range of +140-340bp). Downside risks include heavy supply. Although we project 2H24 volume to be lower than 1H24, there remains scope for plenty of issuance and activity is likely to remain concentrated in weeks/days without FOMC, key inflation/job releases, holidays, industry conferences, etc. Furthermore, December is seasonally a very quiet new issue month, so second half issuance will typically be spread over just five months. Investor demand overall is healthy but fatigue is possible after unrelentingly loaded weeks. On the positive side, even after the 1H24 spread rally, ABS still offer pickup versus comparable credit. For example, cash surrogate AAA bankcard ABS spreads currently at Treasury +48bp offers spread pickup on AA JULI financials whereas historically, AAA bankcards were rich and through comparable unsecured corporates ( Figure 215). On BBBs, subprime auto ABS at Treasury +150bp offer more concession in recent years than earlier periods, currently almost 40bp pickup versus around 15bp average back in 2021 ( Figure 216). Our forecasted “tights” of 2H24 will still be relatively cheap versus the tightest spreads since the pandemic. We think AAA benchmark bankcard and prime auto loan ABS should lead the spread narrowing to back through comparable unsecured credits given those sectors’ long history of rock solid credit fundamentals. Our top pick is AAA 3-year private credit student loan ABS, which stands out as cheap at triple-digit spreads, offering significant spread concessions to subprime auto as well as MPL unsecured consumer loan ABS. Credit fundamentals on private credit student loan ABS from benchmark sponsors are strong with robust structures and high underlying asset collateral quality (e.g., high income borrowers for refi and cosigned for in-school). Off-the-run and lower down the capital stack, ABS will remain most susceptible to idiosyncratic sponsor risks as well as macroeconomic/market volatility.
Figure 214: ABS spread forecast for 2024 year end
bp
| Forecast 2024 Year End | 2024 | 2023 | 2022 | 2021-2020 | 2019 | 2018-12 | ||||||||
| 6/27 | Wide | Tight | Wide | Tight | Wide | Tight | Wide | Tight | Wide | Tight | Wide | Tight | ||
| AAA Senior ABS | ||||||||||||||
| Credit Card | 40 | 48 | 55 | 47 | 75 | 42 | 70 | 17 | 207 | 12 | 43 | 26 | 58 | 17 |
| Prime Auto Loan | 50 | 68 | 70 | 62 | 110 | 65 | 100 | 20 | 207 | 15 | 49 | 30 | 73 | 24 |
| Subprime Auto | 70 | 80 | 95 | 80 | 135 | 75 | 175 | 38 | 324 | 16 | 66 | 37 | 116 | 35 |
| FFELP | 85 | 94 | 110 | 90 | 140 | 110 | 150 | 45 | 180 | 37 | 65 | 46 | 105 | 20 |
| Private Credit | 90 | 105 | 145 | 100 | 170 | 130 | 195 | 65 | 250 | 50 | 85 | 60 | 235 | 35 |
| MPL | 70 | 80 | 110 | 75 | 215 | 95 | 300 | 62 | 1063 | 39 | 87 | 58 | N/A | |
| Subordinate ABS | ||||||||||||||
| BBB Subprime Auto | 135 | 150 | 210 | 140 | 340 | 210 | 425 | 100 | 566 | 72 | 143 | 104 | 393 | 108 |
| BB Subprime Auto | 320 | 345 | 495 | 335 | 600 | 480 | 650 | 230 | 816 | 177 | 253 | 199 | 568 | 209 |
Source: J.P. MorganNote: Above spreads indicative 3-year to Treasury, except AAA MPL 1-year and AAA subprime auto 2-year. In addition, FFELP and private credit student loan ABS spreads to LIBOR until 6/1/2023 and to SOFR thereafter for FFELP
Figure 215: AAA ABS spreads cheap to unsecured corporates
bp
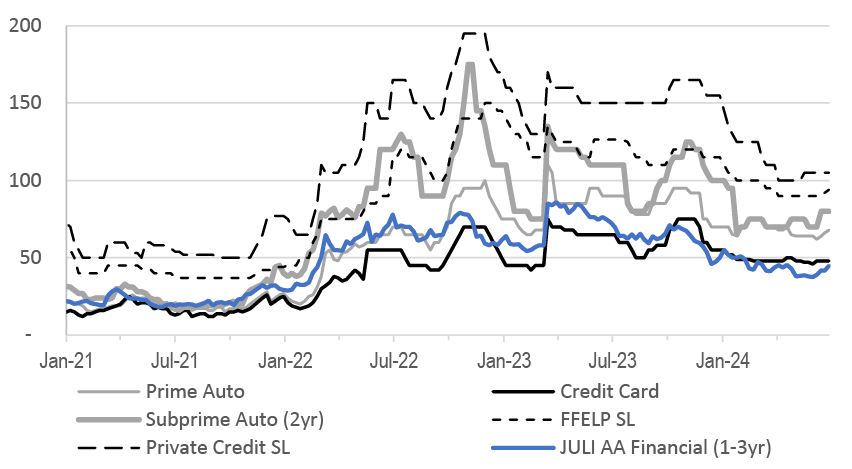
Source: J.P. MorganNote: Above spreads indicative 3-year to Treasury, except FFELP and private credit ABS spreads to LIBOR until 6/1/2023 and to SOFR thereafter
Figure 216: BBB subprime auto ABS spreads cheap to unsecured corporates
bp
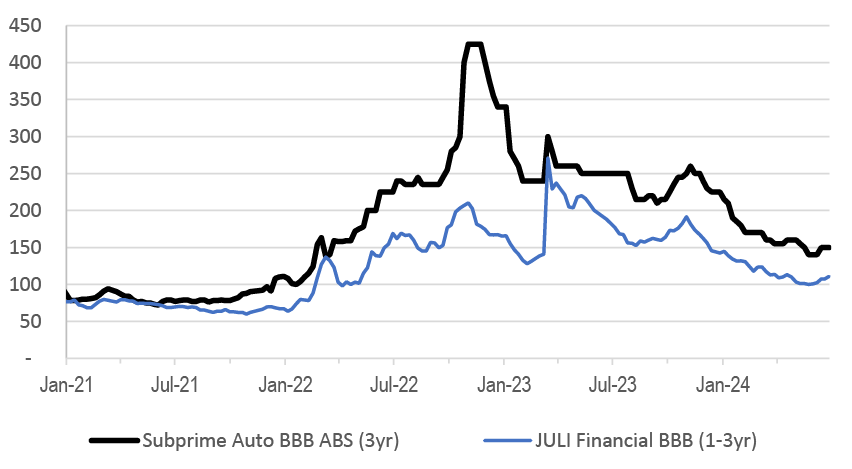
Source: J.P. Morgan
Data appendix
Figure 217: ABS supply
$bn
| 2020 | 2021 | 2022 | 2023 | 2023 YTD | 2024 YTD | |
| Credit Cards | 4 | 17 | 32 | 23 | 11.5 | 11.6 |
| Bank/Charge | 4 | 17 | 30 | 21 | 11.2 | 10.3 |
| Retail | 0 | 0 | 2 | 2 | 0.4 | 1.3 |
| Autos | 98 | 132 | 110 | 146 | 71.4 | 95.7 |
| Prime Loan | 46 | 50 | 50 | 73 | 32.4 | 43.7 |
| Non-prime Loan | 28 | 43 | 33 | 34 | 17.2 | 24.5 |
| Lease | 19 | 27 | 16 | 23 | 12.2 | 17.7 |
| Fleet & other | 6 | 13 | 11 | 16 | 9.6 | 9.8 |
| Student Loans | 17 | 26 | 7 | 7 | 3.8 | 6.3 |
| FFELP | 5 | 8 | 0 | 0 | 0.0 | 0.0 |
| Private Credit | 12 | 18 | 7 | 7 | 3.8 | 6.3 |
| Equipment | 13 | 19 | 22 | 21 | 9.9 | 15.9 |
| Floorplan | 4 | 1 | 1 | 4 | 3.6 | 4.9 |
| Unsecured Consumer | 9 | 17 | 16 | 14 | 5.9 | 8.3 |
| MPL | 4 | 8 | 9 | 8 | 3.6 | 3.1 |
| Branch & other | 5 | 9 | 7 | 7 | 2.3 | 5.2 |
| Miscellaneous | 34 | 55 | 56 | 41 | 23.6 | 35.7 |
| Total ABS | 179 | 267 | 244 | 256 | 129.6 | 178.3 |
| % 144A | 57% | 61% | 50% | 56% | 55% | 62% |
| % Floating-rate | 4% | 5% | 4% | 7% | 6% | 9% |
Source: J.P. Morgan.
Figure 218: Other ABS supply
$bn
| 2020 | 2021 | 2022 | 2023 | 2023 YTD | 2024 YTD | |
| Franchise/Whole Bus. | 4.8 | 13.7 | 6.6 | 1.7 | 0.8 | 6.1 |
| Data Center | 2.6 | 6.2 | 1.0 | 5.9 | 2.1 | 4.7 |
| Device Payment | 4.4 | 3.1 | 5.3 | 4.5 | 3.0 | 4.5 |
| Fiber | 0.2 | 1.3 | 1.2 | 4.0 | 2.4 | 3.5 |
| Solar | 2.7 | 3.2 | 4.0 | 4.2 | 2.3 | 3.2 |
| Stranded Ast | 2.3 | 21.2 | 7.8 | 6.2 | 2.1 | |
| Timeshare | 1.9 | 2.4 | 2.6 | 2.5 | 1.0 | 2.0 |
| Insurance | 2.2 | 1.1 | 2.3 | 2.4 | 1.2 | 1.8 |
| Aircraft | 2.6 | 8.5 | 1.1 | 0.7 | 1.7 | |
| Containers | 7.3 | 5.6 | 0.8 | 0.3 | 0.3 | 0.8 |
| Railcar | 0.5 | 2.8 | 0.9 | 0.2 | 0.6 | |
| SBL | 0.4 | 1.0 | 1.7 | 1.1 | 0.6 | 0.5 |
| Trade Rec. | 0.3 | 0.5 | ||||
| Healthcare | 0.4 | 0.4 | 0.4 | 0.4 | 0.3 | |
| Taxes | 0.5 | 0.1 | 0.3 | 0.2 | 0.3 | |
| PACE | 0.3 | 0.8 | 0.5 | 0.7 | 0.4 | 0.3 |
| Miscellaneous | 4.0 | 2.3 | 6.3 | 4.1 | 2.8 | 2.9 |
| Total Other ABS | 34.4 | 55.2 | 56.0 | 40.8 | 23.6 | 35.7 |
Source: J.P. Morgan.
Figure 219: ABS spread performance
bp
| Benchmark | Current | 1-week | 10-week | |||
| 6/27/2024 | Change | Avg | Min | Max | ||
| Credit Card - Fixed Rate | ||||||
| 2-yr AAA | Treasury | 45 | 0 | 44 | 42 | 46 |
| 3-yr AAA | Treasury | 48 | 0 | 48 | 46 | 50 |
| 5-yr AAA | Treasury | 55 | 0 | 56 | 53 | 60 |
| 10-yr AAA | Treasury | 80 | 0 | 81 | 78 | 87 |
| B-Piece (5-yr) | Treasury | 85 | 0 | 86 | 83 | 90 |
| C-Piece (5-yr) | Treasury | 129 | 0 | 130 | 127 | 135 |
| Credit Card - Floating Rate | ||||||
| 2-yr AAA | SOFR | 43 | 0 | 46 | 43 | 50 |
| 3-yr AAA | SOFR | 53 | 0 | 56 | 53 | 60 |
| 5-yr AAA | SOFR | 78 | 0 | 81 | 78 | 85 |
| 10-yr AAA | SOFR | 108 | 0 | 111 | 108 | 115 |
| B-Piece (5-yr) | SOFR | 113 | 0 | 116 | 113 | 120 |
| C-Piece (5-yr) | SOFR | 158 | 0 | 161 | 158 | 165 |
| Auto - Prime | ||||||
| 1-yr AAA | Treasury | 44 | 0 | 39 | 37 | 44 |
| 2-yr AAA | Treasury | 57 | 0 | 55 | 54 | 57 |
| 3-yr AAA | Treasury | 66 | 0 | 65 | 62 | 70 |
| 3-yr AA | Treasury | 90 | 0 | 84 | 80 | 90 |
| Student Loans (FFELP) | ||||||
| 3-yr AAA | SOFR | 92 | 0 | 90 | 90 | 92 |
| 7-yr AAA | SOFR | 110 | 0 | 110 | 110 | 110 |
| Private Credit Student Loan | ||||||
| 3-yr AAA | SOFR | 105 | 0 | 104 | 100 | 110 |
| Unsecured Consumer MPL | ||||||
| 1-yr AAA | Treasury | 80 | 0 | 81 | 75 | 85 |
| 3-yr AA | Treasury | 130 | 0 | 145 | 125 | 165 |
| 3-4yr A | Treasury | 170 | 0 | 183 | 170 | 195 |
| 3-4yr BBB | Treasury | 245 | 0 | 256 | 240 | 270 |
| 3-4yr BB | Treasury | 465 | 0 | 483 | 460 | 505 |
| Auto - Subprime | ||||||
| 1-yr AAA | Treasury | 65 | 0 | 60 | 55 | 65 |
| 2-yr AAA | Treasury | 80 | 0 | 75 | 70 | 80 |
| 3-yr AA | Treasury | 95 | 0 | 92 | 85 | 95 |
| 3-yr A | Treasury | 115 | 0 | 112 | 105 | 115 |
| 3-yr BBB | Treasury | 150 | 0 | 150 | 140 | 160 |
| 3-yr BB | Treasury | 345 | 0 | 344 | 335 | 350 |
Source: J.P. Morgan.
Figure 220: Fixed-rate AAA ABS (3-year) spreads to Treasury
bp
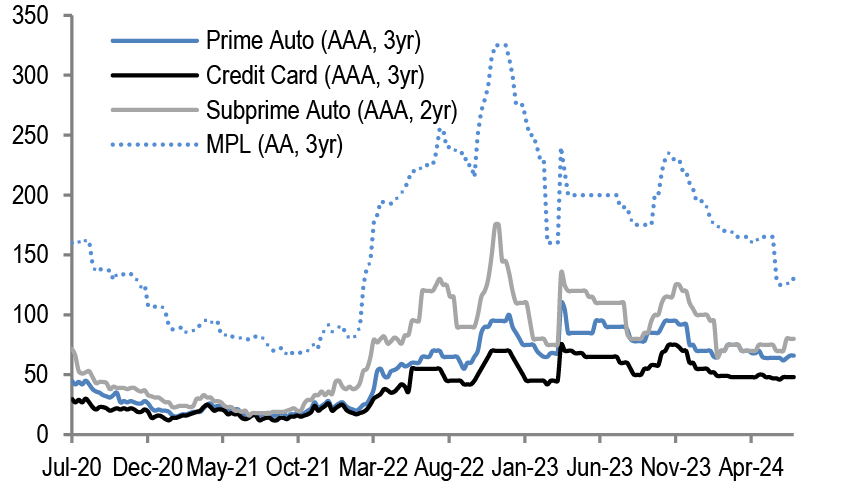
Source: J.P. Morgan.
Figure 221: Floating-rate AAA ABS (3-year) spreads to SOFR
bp
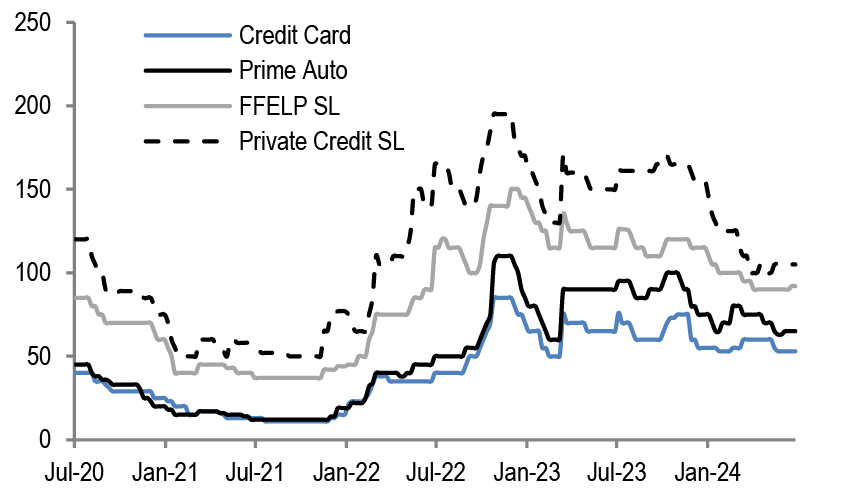
Source: J.P. Morgan. Note: Spreads to LIBOR till June 29, 2023 and to SOFR since then.
Figure 222: AAA cross sector spreads (3-year) to Treasury/SOFR
bp
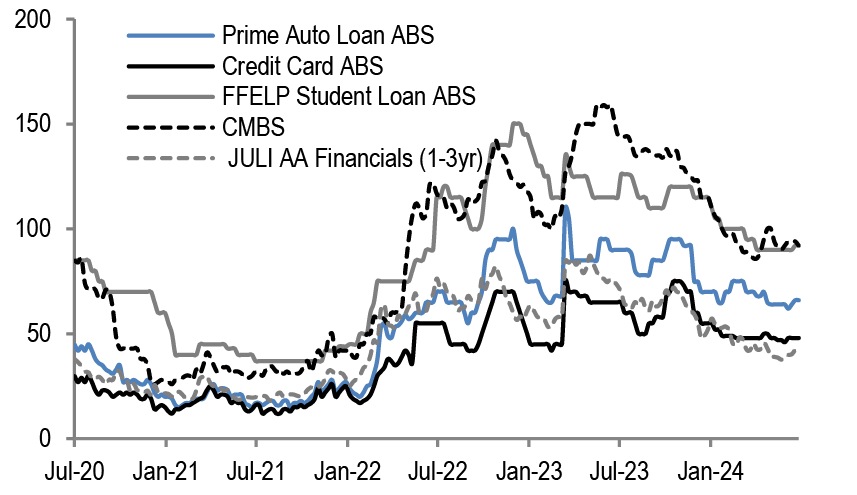
Source: J.P. Morgan. Note: FFELP Student Loan ABS spread to LIBOR till June 29, 2023 an to SOFR since then.
Figure 223: BBB subprime auto ABS (3-year) and MPL unsecured consumer ABS (3-4year) vs. BBB financials to Treasury
bp
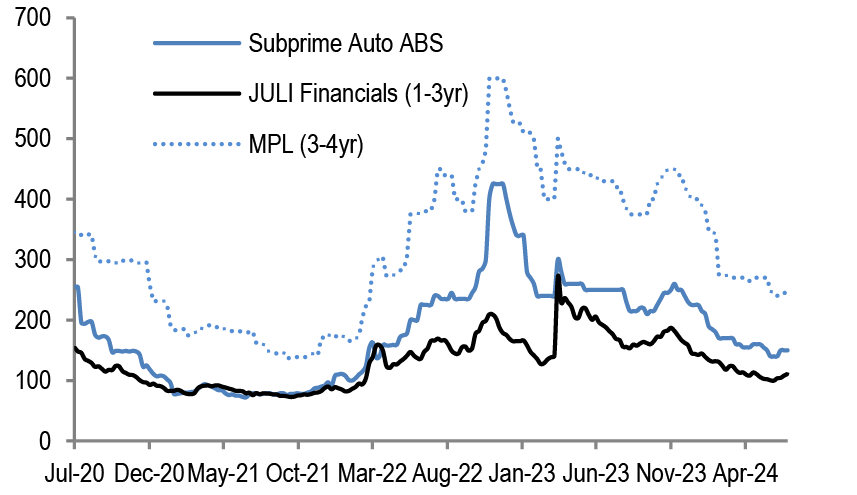
Source: J.P. Morgan.
Figure 224: ABS secondary trading weekly TRACE volume
$bn
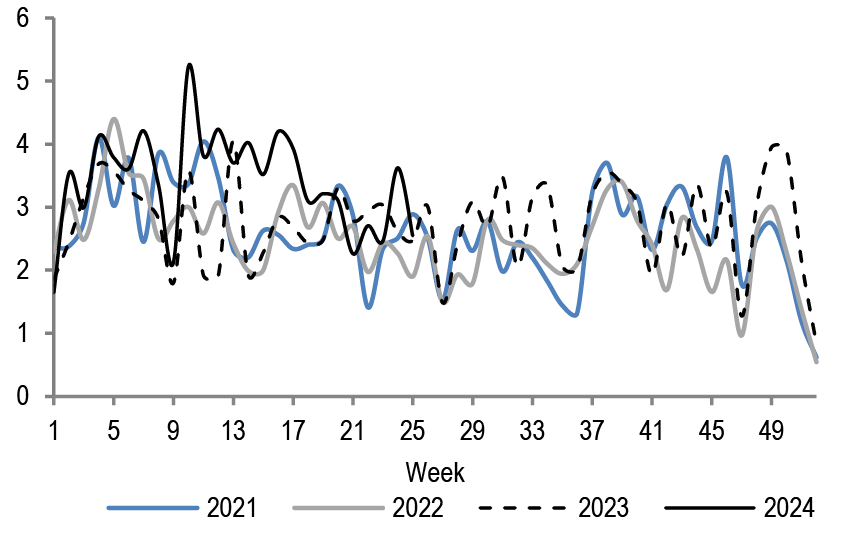
Source: J.P. Morgan, TRACE
Corporates
- Revising our YE 2024 spread forecast to 110bp (from 95bp previously). We expect slower GDP growth in 2H24, which could lead to a continuation of the recent trend of declining yields, a negative for spreads. Also, global rates dynamics have made US credit less attractive to overseas investors, and domestic fund inflows have slowed in line with middling YTD total return. Election uncertainty and Fed uncertainty could increase volatility, generally a market negative. That said, 110bp is still a tight spread historically. We believe spreads can stay tight with still strong technicals driven by high yields, a slowdown in supply, an expected improvement in corporate earnings and the start of Fed policy easing in 2H24. In 1H24 JULI spreads did not stay below 100bp even with higher yields and stronger demand. Now with less strong technicals expected going forward we move to a modestly wider spread target of 110bp.
- Revising supply forecast up to $1.45tr (from $1.3tr). This leaves $590bn of supply to come in 2H24 (-31% vs 1H24). Including coupons, 2H24 net supply should be close to zero vs +$210bn in 1H24.
- Credit Fundamentals: Credit metrics have been deteriorating with leverage near the higher end of its 5yr range and interest coverage near the lower end. Yet ratings trends have been very positive with the BBB share of the market at an 8 year low but we anticipate more Fallen Angels than Rising Stars from here. We do not believe credit fundamentals will be a key driver for spreads unless the economy slows meaningfully.
- Valuations: We believe the 10s30s curve will steepen modestly if/when yields decline, though still flat by historical standards. If the Fed cuts in H2, the front-end should benefit from inflows out of Money Markets into short-term bonds.
- Sector Recommendations: We recommend Overweights in Yankee Banks, Finance Cos, Consumer, Basics, Domestic Telecoms, Insurance and Media/Entertainment and Underweights in Technology and Retail.
Moving from ‘as good as it gets’ to slightly less so - we revise our year-end spread forecast wider to 110bp
We revise our spread forecast to 110bp (from 95bp previously). Our new forecast is near the current level (107bp as of June 20th). We also revise up our full year supply forecast to $1.45tr (from $1.3tr expected previously). This leaves ~$590bn of supply to come in 2H24. This would be a 31% decline in issuance compared to the estimated 1H24 total. HG bonds will deliver 1.8% total return and 0.4% excess return from now until YE under our revised spread forecast and our US rates forecasts (FY24 Total return forecast is 2.5% and Excess return forecast is 1.7%).
The first half of this year brought stronger than expected economic growth and higher than expected yields which led to very strong demand technicals. Despite this, HG spreads never went tighter than 99bp, suggesting that our prior spread forecast of 95bp was too much of a stretch. In the second half of 2024, we expect some of the demand technicals to become less strong. This is being driven by yields which have been declining on better inflation data and weaker growth data. JPM expects growth in 2H24 to be below 1H24, so the risk is that yields continue to fall, making it difficult for spreads to reach new tights. This yield dynamic is especially relevant to our measures of overseas demand which have been deteriorating throughout Q2 and we do not anticipate this reverting soon. Also, domestic fund flows have been lighter in 2Q than in 1Q, which is partly seasonal and partly a result of more modest HG return expectations, driven by rate cuts expectations which are much reduced from earlier in the year. On the other hand, a spread of 110bp at YE would still be a very tight spread historically. Support of this includes yields which at >5% remain historically attractive even as they are off of their peak. Supply should moderate too relative to the rapid H1 pace. Credit rating trends also remain strongly positive, even as some key credit metrics are slowly deteriorating. In other words, we remain constructive on HG credit and believe that the asset class offers relatively safe carry, but with technicals slightly less strong and potentially more macro ‘noise’ from elections and the Fed it seems unlikely that spreads can reach fresh YTD tights.
There are both positive and negative scenarios which could move spreads more meaningfully than our base case forecast. On the positive side, when the Fed cuts rates (JPM expects the first cut in November) there could be an increased focus on locking in long duration fixed income assets. If US HG bond supply remains light over the next few months, as we expect, and corporate earnings are strong as the equity analyst community expects, HG bond market may be in a sweet spot of heavy demand with supply insufficient to meet it. This could lead to spreads reaching new tights. A benign US election outcome in the market’s view would be required for this to play out. Drivers of a more negative outcome with wider spreads could include a meaningful move lower in HG bond yields such that demand ebbs. We have seen repeatedly in 2Q that moves down in yield have led to wider spreads, at least in the short term. The opposite outcome could also lead to wider spreads – i.e. meaningfully higher yields. This could come about due to political developments whereby the market loses confidence in future fiscal discipline or Fed independence. Political developments in Europe could also erode market confidence, even as they are likely to lead to US outperformance vs Europe.
Figure 225: 2024 YE Forecasts
| Current | 2024 Forecast | Change | |
| HG bond spread | 107bp | 110bp | 3bp |
| HG bond yield | 5.4% | 5.6% | 0.2% |
| HG bond total return | 0.7% | 2.5% | 1.8% |
| HG bond excess return | 1.3% | 1.7% | 0.4% |
| Rising Stars | $17bn | $25bn | $8bn |
| Fallen Angels | $3bn | $30bn | $27bn |
| HG gross supply | $843bn | $1.4tr | $595bn |
| HG net supply | $408bn | $617bn | $209bn |
Source: J. P. Morgan. Current/YTD is as of 6/18/24.
Figure 226: 2024 Sector recommendations
| Sector | Analyst | Recommendation | Sector | Analyst | Recommendation | |
| Yankee Banks | Kabir Caprihan | OW | US Banks | Kabir Caprihan | N | |
| Euro Senior | OW | Regional US Banks | N | |||
| Swiss Holdco | OW | Large US Banks - Sen HoldCos | N | |||
| UK Holdco | OW | Large US Banks - Sub OpCos | N | |||
| Japanese Banks | N | Large US Banks - Sub HoldCos | N | |||
| Euro Sen Non Pref | N | Utilities | Kevin Kwan | N | ||
| Australia/NZ Banks | N | Utilities OpCos | OW | |||
| Canadian Banks | UW | Utilities HoldCos | N | |||
| Consumer | Carla Casella | OW | Utilities Power Gencos | N | ||
| Food/Beverages | OW | Energy | Matthew Anavy | N | ||
| Tobacco | N | Pipelines/Midstream/MLP | OW | |||
| Consumer Products | UW | Integrated Energy | N | |||
| Insurance | Brett Gibson | OW | Exploration/Production | N | ||
| Life Insurance | OW | Refiners | N | |||
| P&C Insurance | N | Energy Services | UW | |||
| Finance Companies | Kabir Caprihan | OW | Healthcare Pharmaceuticals | Brett Gibson | N | |
| Telecoms | Christian Crosby | OW | Large Cap Pharma | OW | ||
| Domestic Telecoms | OW | Medical Devices | N | |||
| Yankee Telecoms | UW | Biotech Generics | N | |||
| Basic Industries | OW | Healthcare Services | UW | |||
| Homebuilding | Arjun Chandar | OW | Transportation | Mark Streeter | N | |
| Metals/Mining | Arjun Chandar | OW | Aviation | OW | ||
| Paper/Packaging | Arjun Chandar | OW | Freight | N | ||
| Chemicals | Aaron Rosenthal | N | Railroads | UW | ||
| Building Materials | Arjun Chandar | UW | Automotive | Evan Piascik | N | |
| Media Entertainment | Christian Crosby | OW | Automotive Finance Co | N | ||
| Cable/Satellite | OW | Automotive Manufacturing | N | |||
| Diversified Media | N | Automotive Suppliers | UW | |||
| Capital Goods | N | Technology | Christian Crosby | UW | ||
| Aerospace/Defense | Yilma Abebe | OW | Retail | Carla Casella | UW | |
| Manufacturing | Evan Piascik | UW | Food/Drug Retail | UW | ||
| Property Real Estate | Mark Streeter | N | Non-Food Retail | UW |
Source: J.P. Morgan.
Valuations: Yields still high enough but the margin of error is shrinking
HG bond spreads are very tight compared to longer term averages and we expect them to remain so. Our forecast of 110bp is at the 12% level in the 5yr range and 6% in the 10yr range. This is being driven by attractive yields. Yields are still attractive by most longer term measures. Despite falling 109bp below the yield highs for this cycle reached last October and 42bp below the YTD highs, current yields are still at the 87th percentile over the past 5 years and 94th percentile over the past 10 years. In our view, so long as HG yields remain well above 5% (5.43% as of June 20th) , it is likely that spreads as % of yields to remain quite low, which would be in-line with past history. Currently the spread as a percent of yield is 20%. If yields move well below 5% we believe there could be some upward pressure on spreads, as the spread as percent of yield level will become more challenging.
Figure 227: So long as yields remain high, we believe spreads as a % of yield can remain quite low
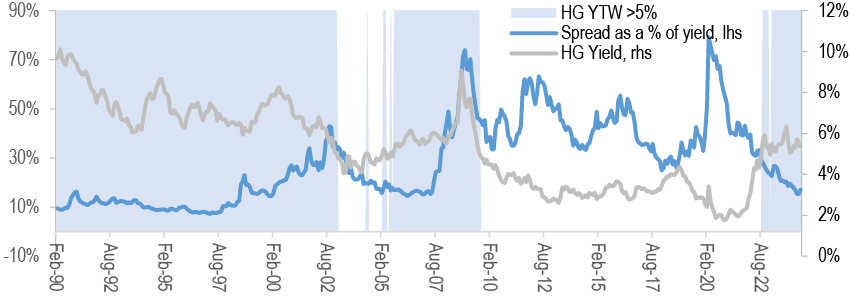
Source: J.P. Morgan, Bloomberg Finance L.P.
The aforementioned discussion is most relevant at the long-end of the curve. At the front-end we believe an important valuation metric is the yield pickup between 3m T-bills and 1-3 year high grade credit. Should the Fed cut rates this year as JPM expects, it is possible this curve could dis-invert for the first time since 1Q23 which could lead to flows out of Money Market funds into front-end bond funds, reversing the strong flows in the other direction after the Fed began hiking in 2022.
Figure 228: Last year there were strong flows out of short term HG corp bond funds into Gov’t bond funds. This year these flows are muted
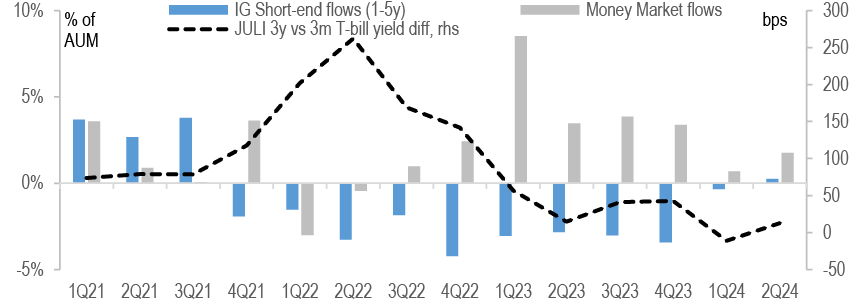
Source: J.P. Morgan, EPFR
10s30s spread curve: The 10s30s spread curve has been stable this year near 20bp. This is well below the 5yr average of 30bp and 10yr average of 36bp (ex Covid). We believe that the current level is too tight from a fundamental perspective given that a lot can go wrong between years 10 and 30 with respect to credit risk. That said, so long as yields remain high there is going to be strong demand for long duration, high quality credit. This demand is keeping the curve flatter than has historically been the case. We do think the risk is for some steepening of the curve in 2H24 but it will likely be limited unless yields move more meaningfully lower.
2024 Elections: Potentially the key event of 2H24, unless it isn’t
The last few weeks has seen several electoral surprises around the globe (India, Mexico and France), all of which have been consequential for markets. Near term there are elections in France and the UK which will continue to keep focus on Europe - which matters for relative pricing between US and Europe and therefore for European demand for US assets, as discussed above. Of course dwarfing these in importance is the US election in November. There are stark differences between the candidates and parties in the US election, so the outcome is likely to have meaningful importance to markets. Markets will be focused not just on who wins the presidency but the makeup of congress, which will dictate how much of the new president’s agenda is likely to be achievable. Several issues will be in focus as the election approaches:
- Tax policy: The surging fiscal deficit combined with the expiration in 2025 of many personal tax provisions from the 2017 TCJA law is going to keep a focus on taxation issues. This will have an impact on rates broadly. Also, corporate tax rates and tax provisions may be reviewed with some arguing to lower them further to spur growth and others arguing to raise them to bring in more revenue. As is typically the case with taxes, the devil will be in the details and thus far there are no detailed proposals from either party, but these tax changes could have an impact on both credit fundamentals and technicals (supply).
- Trade policy: The HG market is heavily weighted towards multi-nationals and 27% of the JULI is non-US companies so trade policy can be a material factor for credit. Tariffs impact individual companies both on the sourcing side and the sales side, as they are often meet with retaliatory tariffs.
- Regulation: Bank supply will vary based on potential regulatory decisions, and bank products/policies are subject to federal oversight and challenge as well, so Washington’s approach to banks is important for credit markets. The healthcare sector is now the third largest sector (behind US and Yankee Banks) in JULI and is very much impacted by government policies. With the fiscal deficit likely to be a key focus for either of the new administration, healthcare has the potential to be impacted. Utilities and Energy are also at risk to benefit or suffer from increased or decreased regulatory focus on fossil fuels. M&A activity will be driven, in part, by the future government's emphasis on antitrust enforcement.
A more tangible ramification of politics to the HG market currently is also simply as it relates to the technicals: A surging deficit is leading to heavy UST issuance, with USTs now at 43% of the Agg index, a near record high proportion. We believe this is increasingly pushing active investors to underweight USTs under the auspices of diversification and thus in turn being more overweight MBS and less underweight Corps than they would be otherwise.
Figure 229: US deficit is surging and parts of the tax code change next year, putting corp taxes in the spotlight again
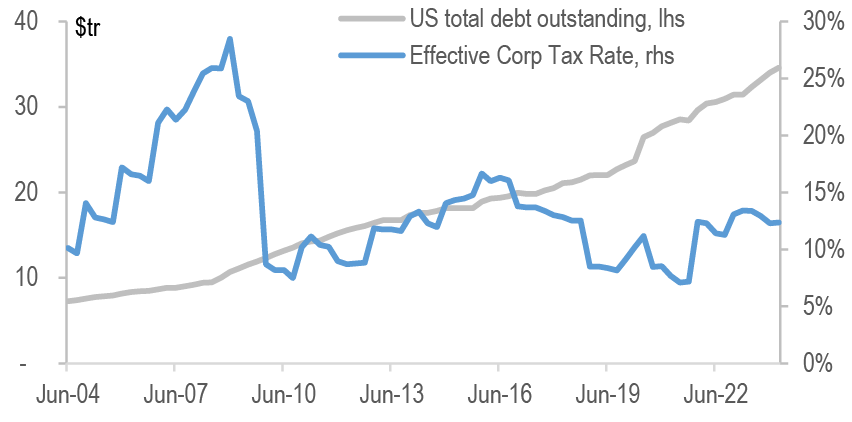
Source: J.P. Morgan, Bloomberg Finance L.P.
Figure 230: Distribution of the US Agg index by product: Deficit pushing USTs to record high, incentivizing diversification into MBS and Corps
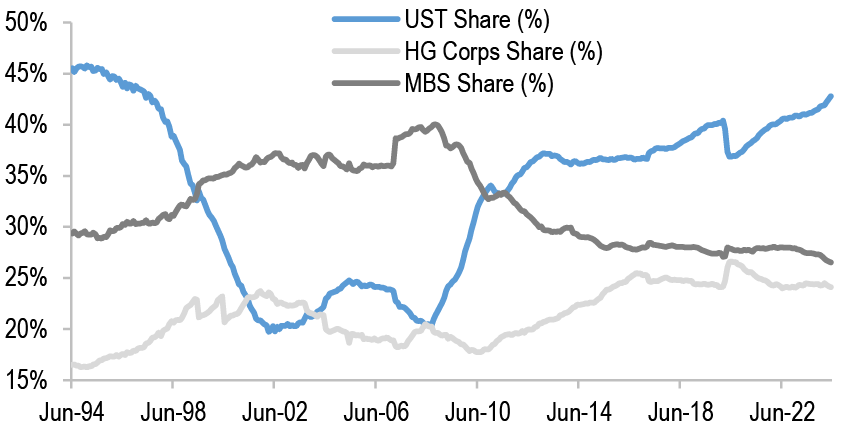
Source: J.P. Morgan, Bloomberg Finance L.P.
Technicals: Demand likely to stay strong but less so than H1
We review demand for US HG credit by looking at each of the key parts of the investor base:
US Insurance companies: We believe these will keep buying at a moderate pace, much as they have throughout the last 2 years. From an asset allocation perspective, US insurance companies are de-emphasizing HG credit but they continue to be active buyers nonetheless. Over the past two years the US life insurance industry has not net added to their holdings of HG corporate bonds - but they have bought to maintain a stable position. Instead they have focused on alternatives, privates and other less liquid credit assets. We believe that this trend will continue.
Figure 231: Y/Y the growth in corporate bond holdings was all in privates. Mortgage growth likely spurred by favorable capital treatment
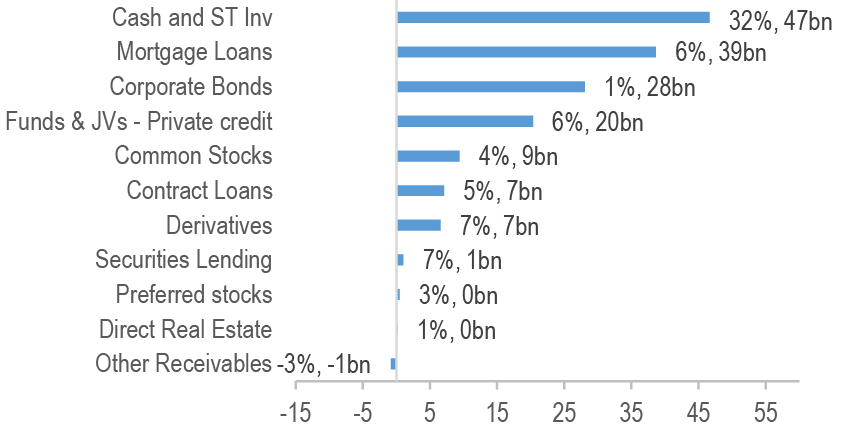
Source: J.P. Morgan, NAIC
Figure 232: Insurance companies are significantly underweight banks vs the market due to the short duration of bank bonds and single issuer exposure limits
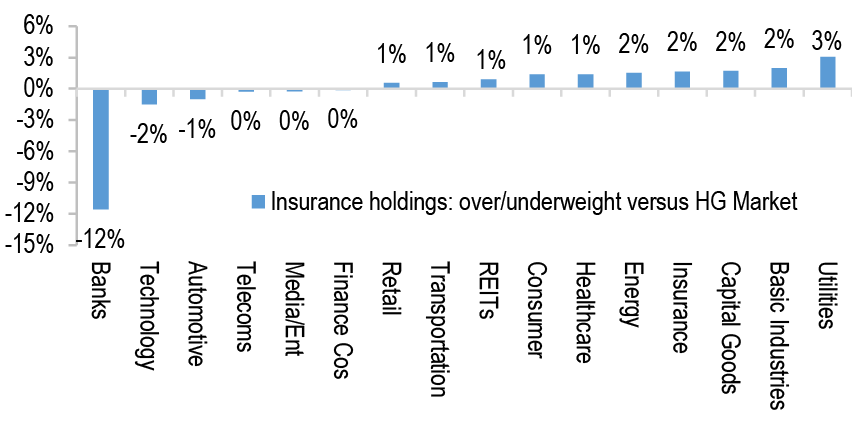
Source: J.P. Morgan, NAIC
US pension funds: Our impression is that these investors have been relatively active buyers of the long-end YTD but to a lesser degree than one might have expected given funding ratios well north of 100%. In our view, this is a function of performance, whereby pensions that have de-risked more have lagged in both good and bad markets in recent years, as evidenced by the table below. However, rising stock markets and still attractive yields are likely to continue the slow but steady move towards a greater share of fixed income positions.
Figure 233: Pension funding ratios above 100% supports corporate bond demand
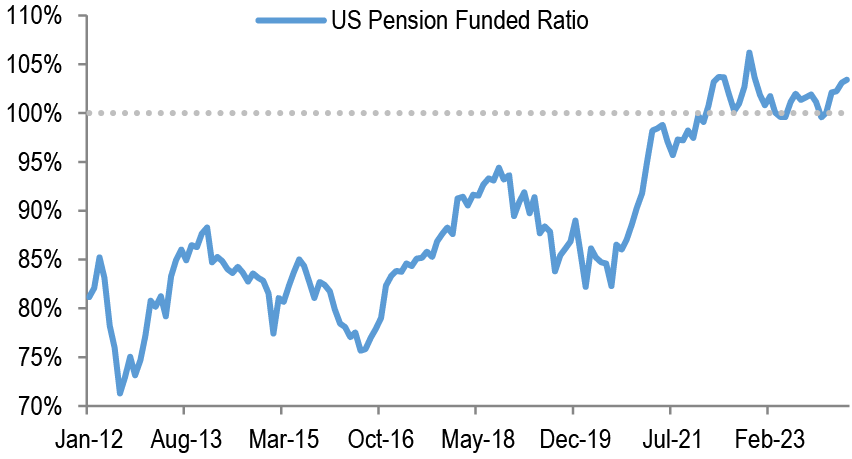
Source: J.P. Morgan, Milliman
Figure 234: Allocations to Fixed Income have increased, and the return implications have been negative vs. those with less fixed income
| Fiscal Year | FI allocation (50% or higher) | FI allocation (less than 50%) | ||
| No. of companies | Avg Investment Return | No. of companies | Avg Investment Return | |
| 2019 | 30 | 16.6% | 56 | 18.8% |
| 2020 | 29 | 12.5% | 57 | 14.6% |
| 2021 | 33 | 4.8% | 53 | 10.5% |
| 2022 | 37 | -20.1% | 49 | -18.2% |
| 2023 | 41 | 7.7% | 45 | 9.0% |
| Avg | 34 | 4.3% | 52 | 6.9% |
Source: J.P. Morgan, Milliman
Foreign investors: Foreign demand for US credit was strong to start 2024, both from Asia and Europe. We believe the latter flows are at risk in H2 as USD credit is no longer cheap to EUR credit, especially now that EUR credit is widening rapidly on account of the upcoming French and UK elections. The other driver of this is the recent ECB cut and projections for another cut in September, creating more rate divergence between the ECB and the Fed and thus higher hedging costs (EURUSD hedge costs are up 30bps from their YTD lows already). On the other hand, should the BoJ get back on track with its hiking trajectory this could be incrementally positive for demand from Japan (the current forward curve suggests hedging costs will fall 60bps over the next 6 months).
Figure 235: With the move up in yields and down in hedging costs – USD credit is now less attractive to Euro-based investors
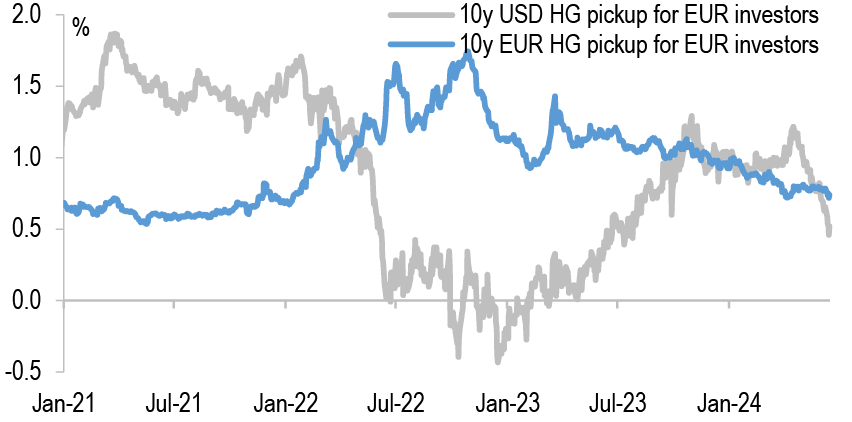
Source: J.P. Morgan, Bloomberg Finance L.P.
Figure 236: JPY hedging costs are likely to fall 60bps while EUR hedge costs likely higher over next 6m
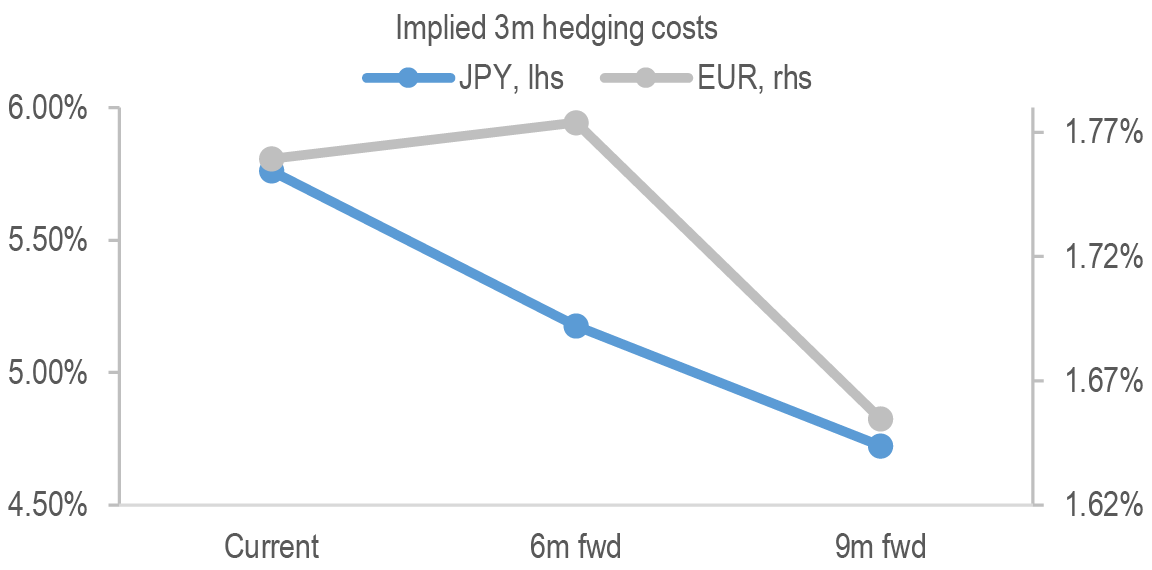
Source: J.P. Morgan, Bloomberg Finance L.P.
Retail investors (Mutual Funds/ETFs): YTD $176bn of inflows have come into HG bond mutual funds and ETFs. This is 4.8% of the total AUM of these funds as of the start of the year. Of these inflows, 69% have come in the first quarter, with flows positive but slower since. It appears that flows were strong early in the year when many expected several Fed cuts in 2024. As those expectations were scaled back flows moderated as well. Looking forward toward 2H24 we expect a continuation of moderate inflows until the Fed cuts rates. This may then cause renewed focus on locking in duration ahead of what is expected to be a more rapid rate cut path in 2025.
Figure 237: Strong HG inflows in 2024 already almost match all of 2023
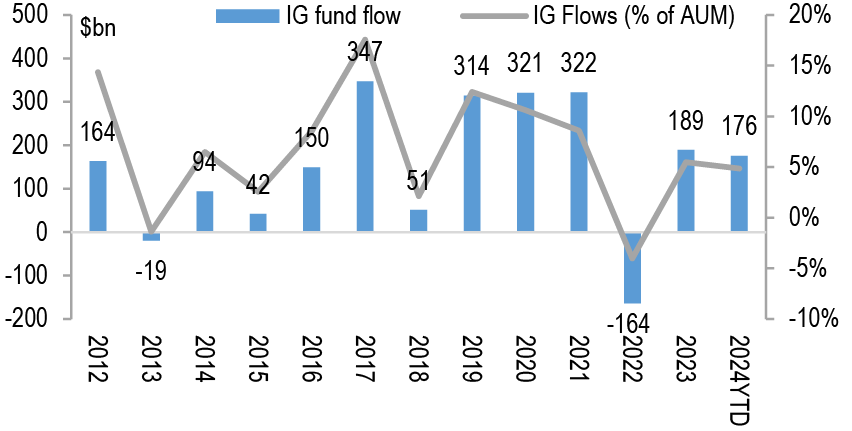
Source: J.P. Morgan, EPFR
Figure 238: HG intermediate and long duration funds have had material inflows so far as a % of their AUM
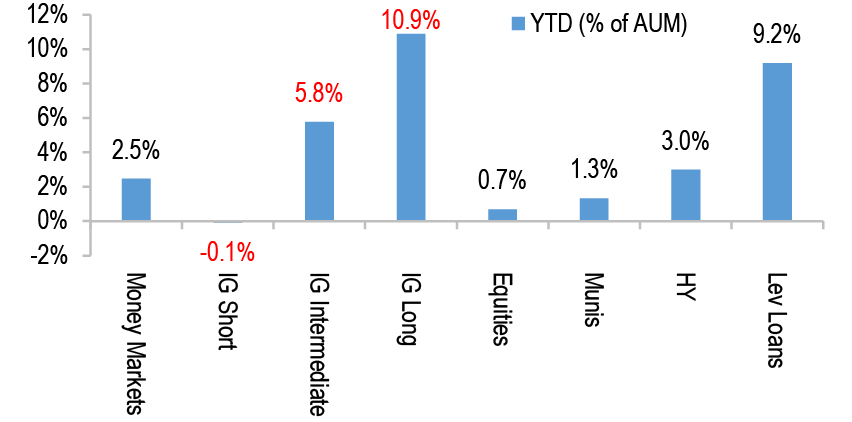
Source: J.P. Morgan, EPFR
Fundamentals: Key metrics are weakening with slow EBITDA growth and higher coupons, expected stronger EBITDA should help in 2H24
Over the past few quarters credit metrics have steadily deteriorated. They are still solid and we do not believe they will become a driver of spreads unless/until economic growth weakens meaningfully. The current dynamic of tight spreads is, in our view, a function much more of the strong technicals than of developments on corporate balance sheets.
The recent deterioration in credit metrics has been driven by negative EBITDA growth combined with rising debt and interest expense. The negative EBITDA growth has been driven by the commodity sectors (Energy, Chemicals, Metals/Mining) as well as Utilities. EBITDA growth has lagged nominal GDP growth in recent quarters, both due to weakness in commodities prices and due to deteriorating profit margins, such that EBITDA is growing more slowly than revenue. Companies have responded to the weak earnings environment with a reduction in payouts to shareholders, i.e., lower share buybacks and dividends, and also through moderation in capex spending. These creditor-friendly trends have helped offset the weaker metrics and have contributed to positive ratings developments, as discussed further below. Looking forward, equity analysts have a bullish view on revenue and earnings growth for the rest of 2024. Should these forecasts prove correct EBITDA should improve and this should help stabilize credit ratios. Also, the move lower in yields recently will reduce future bond coupons and help slow the pace of interest expense growth later in 2024, if it persists.
Turning to the details of current (i.e. 1Q24) key credit ratios, EBITDA for all sectors declined 4.0% in 1Q24 y/y while it rose 5.9% excluding the commodities sectors. Gross leverage ended 1Q24 at 3.3x (at the high end of the 2.9x-3.5x 5yr range). Excluding the Utilities sector (which has leverage nearly double that of any other sector), leverage is better at 2.8x (in the middle of its 2.5x-3.1x 5yr range). Interest expense rose 16% y/y through 1Q24 as the average coupon on new issues so far in 2024 is 5.4%, 209bp above the average coupon of existing bonds in our index. This has led interest coverage to decline by 2.2x turns over the past four quarters, to 9.6x (vs the 5yr range of 8.9x-13.0x). Interest coverage is stronger ex Utilities at 10.9x, but still near the low end of the 10.0x-14.7x 5yr range. Capex growth was moderate over the past year at just 4.3% while cash paid to shareholders declined 4.5% y/y - both signs of conservative balance sheet management to the benefit of creditors.
Figure 239: EBITDA growth ex-Commodities is accelerating
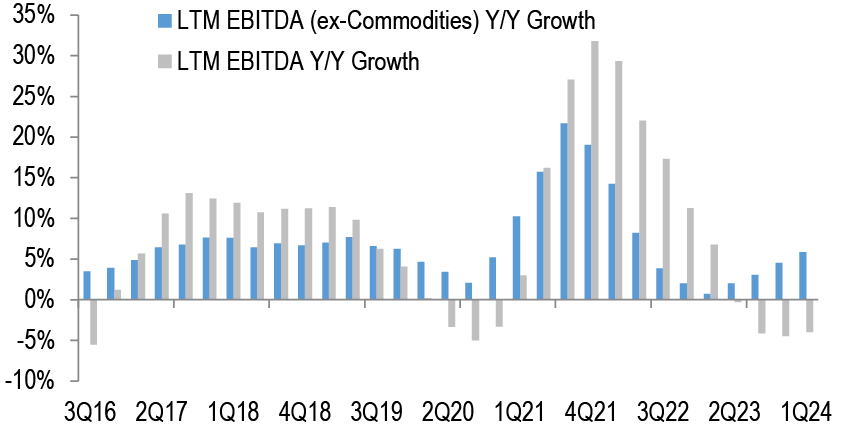
Source: J.P. Morgan.
Figure 240: EBITDA margins continue to deteriorate, ex-Utilities
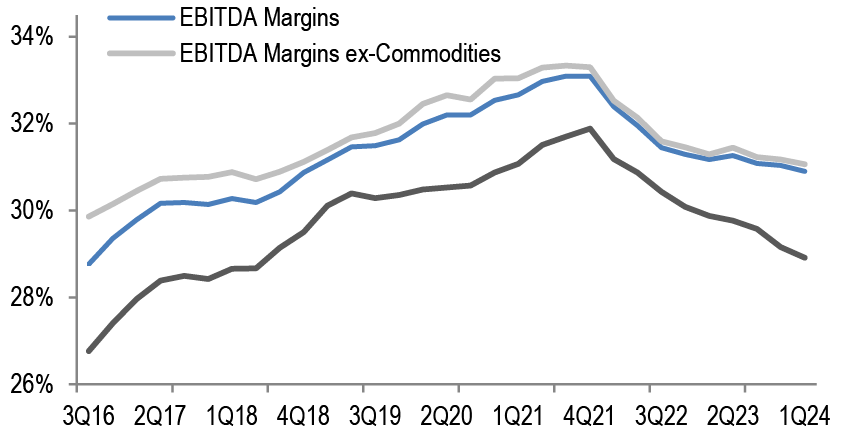
Source: J.P. Morgan.
Figure 241: Leverage trends continue to deteriorate
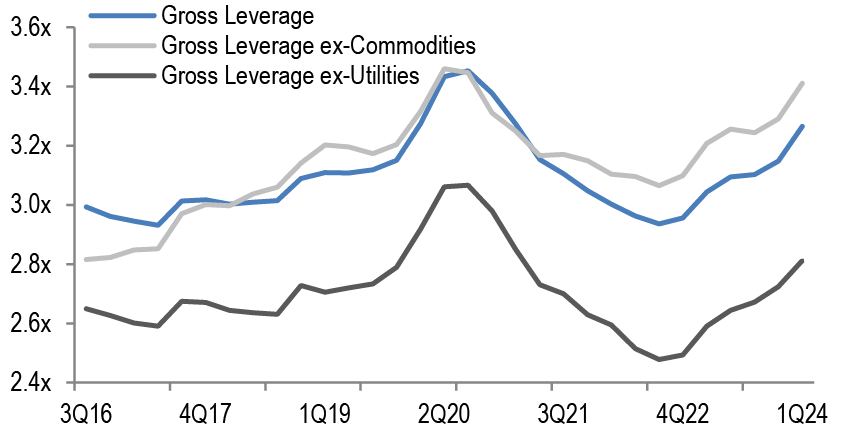
Source: J.P. Morgan.
Figure 242: Interest expense is rising rapidly with higher coupons and more debt outstanding
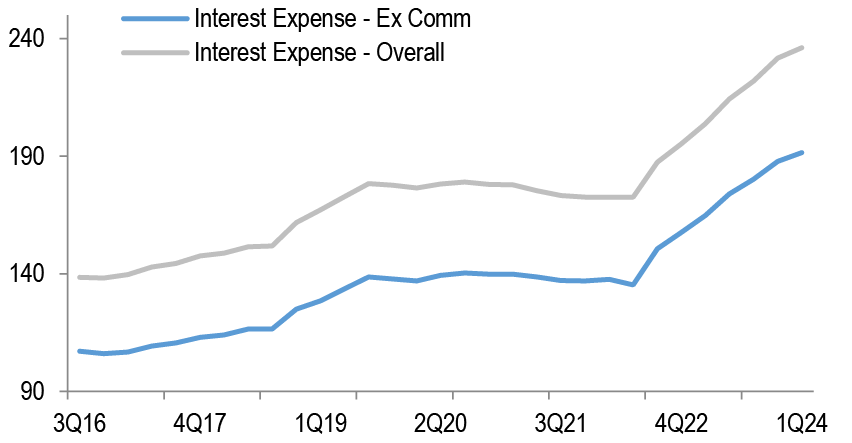
Source: J.P. Morgan.
Figure 243: Interest coverage ratio is declining but remains modestly above its pre-Covid level
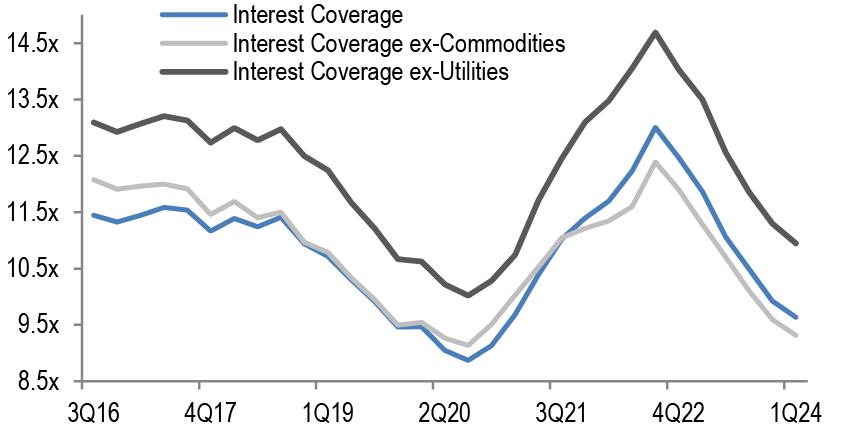
Source: J.P. Morgan.
Figure 244: Shareholder payouts have been reduced but are rising again in 2024
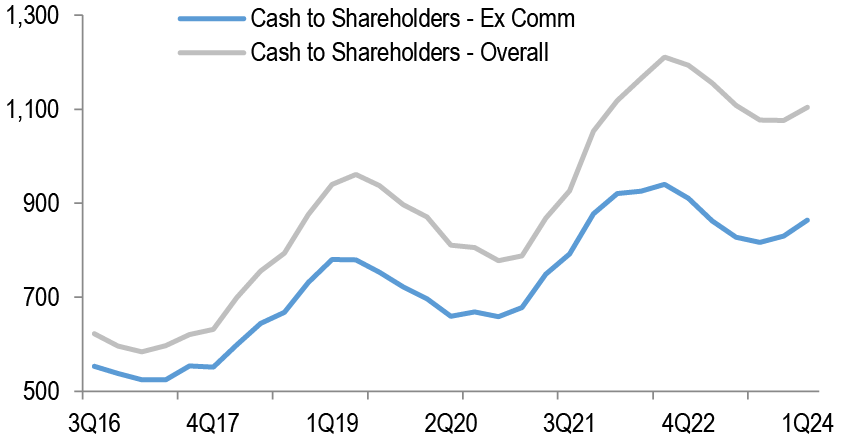
Source: J.P. Morgan.
Figure 245: S&P500 revenue growth is forecasted to increase steadily over the next 3 quarters
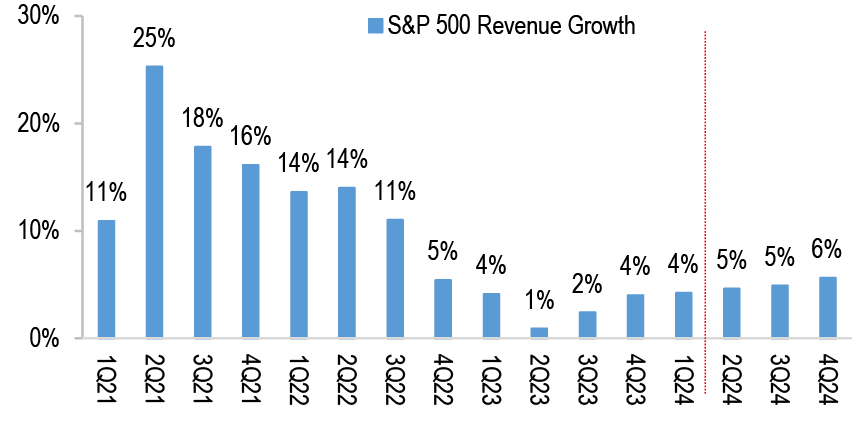
Source: J.P. Morgan.
Figure 246: S&P500 earnings growth is expected to be stronger for the rest of 2024
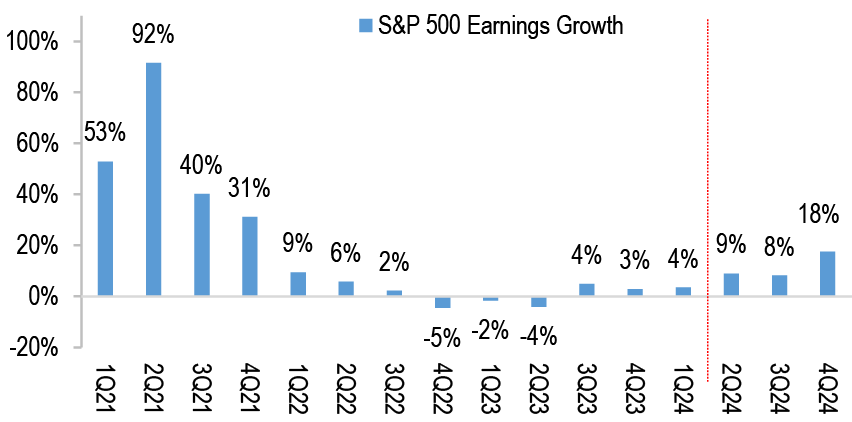
Source: J.P. Morgan.
Ratings: The strong positive ratings momentum of 2022-2023 has continued in 1H24
Upward ratings momentum in HG has been extremely strong so far into the year with the upgrade/downgrade ratio at a record 4.8x: YTD $424bn of debt has been upgraded while only $88bn has been downgraded. Overall 4.5% of the HG market has been upgraded in 2024 on a net basis. This follows 7.9% net upgraded in 2023 and 6.8% in 2022. As a result, the index average rating has been steadily improving and BBBs are now 46% of the index, the lowest since 2015. A-rated bonds make up 45% of the index, the highest percentage since 1H12. With corporate earnings expected to be strong for the remainder of 2024 ratings trends are likely to stay strong. There are some risks including slowly deteriorating credit ratios as discussed above, and also the potential for a pickup in M&A and shareholder friendly activity as rates come down. That said, it is unlikely that the strong positive ratings momentum of the past 2.5yrs changes direction in 2024.
Figure 247: Upgrades have outsized downgrades about 5:1 YTD
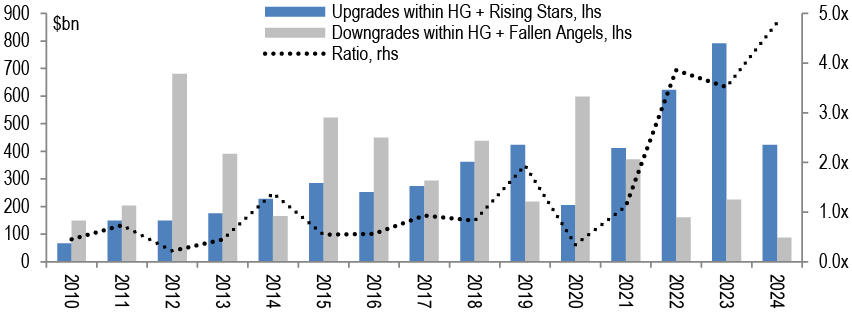
Source: J.P. Morgan, Bloomberg Finance L.P.
The migration of credits between HY to HG has been limited so far this year with $17bn of Rising stars and $2.5bn of Fallen angels. However, we believe this may flip in 2H: We anticipate an additional $7.5bn of index eligible Rising Stars bringing the full-year forecast to $25bn. On the other hand, there is ~$28bn of debt in our Fallen Angel pipeline, tallying to ~30bn of Fallen Angels in 2024.
Figure 248: Rising Star Candidates: We expect another $7.5bn for a total of $25bn in 2024
| Timeframe | Ticker | Issuer | Sector | Total Debt Outs. ($mn) | Index Eligible Debt Outs. ($mn) | Moody's Rtg | S&P Rtg | Fitch Rtg |
| 2024 | ACI | Albertsons Companies | Retail | $6,550 | - | Ba3 | BB+ | - |
| 2024 | VENTGL | Venture Global Calcasieu Pass | Energy | $4,750 | $4,750 | Ba2; P | BB+ | - |
| 2024 | SWN | Southwestern Energy | Energy | $3,740 | - | Ba2; P | BB+ | BB+ |
| 2024 | DAL | Delta Air Lines | Transportation | $2,641 | $1,741 | Aa3 | A+ | - |
| 2024 | AM | Antero Midstream | Energy | $2,600 | - | Ba3 | BB+ | - |
| 2024 | BLDR | Builders FirstSource | Basic Industries | $2,550 | - | Ba2; S | BB-; P | - |
| 2024 | HESM | Hess Midstream Operation | Energy | $2,500 | - | Ba2; S | BB+ | BB+; S |
| 2024 | DTMINC | DT Midstream Inc | Energy | $2,100 | - | Ba2; P | BB+; S | BB+ |
| 2024 | PCG | PG&E Corporation | Utilities | $2,000 | - | Baa2; P | BBB; S | BBB; P |
| 2024 | CHK | Chesapeake Energy | Energy | $1,950 | - | Ba2; P | BB | BB+ |
| 2024 | RRC | Range Resources | Energy | $1,788 | - | Ba3; P | BB; S | - |
| 2024 | NWSA | News Corp | Media/Entertainment | $1,500 | - | Ba1; P | BB+; P | BBB-; S |
| 2024 | KNTK | Kinetik | Energy | $1,000 | - | Ba1; S | BB+; S | BB+; P |
| 2024 | ENDENR | Endeavor Energy | Energy | $1,000 | - | Ba2 | BB+ | BBB- |
| 2024 | MCAIRH | Macquarie Airfinance | Transportation | $1,000 | $1,000 | Baa3; S | BB+; P | BB+; S |
| 2025 | OLN | Olin Corp | Basic Industries | $1,793 | - | Ba1; S | BB+; P | BBB-; S |
| 2025 | LADR | Ladder Capital | Property/Real Estate | $1,646 | - | Ba2 | BB- | BB+ |
| 2025 | GGAMFI | Griffin Global Asset Management | Transportation | $1,000 | $1,700 | - | BB- | BB; S |
| 2025 | CRWD | Crowdstrike | Technology | $750 | - | Baa3; P | BB; S | - |
| 2025 | GNL | Global Net Lease | Property/Real Estate | $500 | $500 | - | BB+ | BB+ |
| 2025 | CTREV | CareTrust REIT | Property/Real Estate | $400 | $400 | Ba2 | BB+ | BB+ |
| 2024 Pipeline | $37,670 | $7,491 | ||||||
| 2025 Pipeline | $6,089 | $2,600 |
Source: J.P. Morgan.
Figure 249: Fallen Angel Candidates: We expect another $28bn for a total of $30bn in 2024
| Timeframe | Ticker | Issuer | Sector | Index Eligible Debt Outs. ($mn) | Moody's Rtg | S&P Rtg | Fitch Rtg |
| 2024 | PARA | Paramount Global | Media/Entertainment | $13,006 | Baa3; N | BB+; S | BBB-; N |
| 2024 | IFF | International Flavors & Fragranc | Basic Industries | $7,650 | Baa3; S | BBB-; N | BBB; S |
| 2024 | FMEGR | Fresenius Medical Care AG | Healthcare | $3,000 | Baa3; S | BBB- | BBB- |
| 2024 | EMACN | Emera Inc | Utilities | $2,450 | Baa3; N | BBB- | BBB |
| 2024 | VFC | VF Corp | Retail | $1,250 | Baa3; N | BBB-; N | - |
| 2024 | SECBEN | SBL Holdings Inc. | Insurance | $1,000 | - | BBB-; S | BBB-; S |
| 2025 | CE | Celanese Corp | Basic Industries | $7,150 | Baa3; N | BBB-; N | BBB-; S |
| 2025 | FMC | FMC Corp | Basic Industries | $3,000 | Baa2; N | BBB-; N | BBB-; S |
| 2025 | CAG | Conagra Brands Inc | Consumer | $6,482 | Baa3; S | BBB-; S | BBB-; S |
| 2024 Pipeline | $28,356 | ||||||
| 2025 Pipeline | $16,632 |
Source: J.P. Morgan.
Supply: We are increasing our forecast for HG bond supply in 2024 to $1.45tr
Primary markets have been extremely robust this year with 1H24 issuance likely to total about $850bn. This would be the 2nd most active half year for HG bond supply following the $1,172bn issued in 1H20 at the peak of COVID. We increase our full-year supply forecast to $1.45tr, up 8.7% (+$115bn) from our spring revision of $1.3tr and our original forecast of $1.2tr in Nov last year. If our forecast comes to fruition, this would be the highest issuance ex-2020. Of this, $184bn or 13% of supply is attributable to M&A related issuance. We also estimate maturities to total $821bn which would lead to net issuance of $617bn.
Put another way, YTD supply has averaged $142bn/month and our forecast is for an average of $118bn/month going forward (combining August and December into a single month for this calculation), which is a 17% reduction. Historically, the 2nd half of each year brings lower supply than the first half, and we believe this dynamic will be even more pronounced this year due to many issuers taking advantage of the strong demand for HG credit that has prevailed so far in 2024. That said, maturities in 2025 are an estimated $975bn, up 19% from the $821bn of maturities this year. This maturity profile is likely to keep supply active all year, and perhaps there will be a pick-up in issuance once the election is over and the Fed has made its first rate cut.
Figure 250: We expect ~$590bn of gross issuance in 2H24 and about ~$220bn of net issuance
| Gross Issuance ($bn) | Maturities ($bn) 2024F | Net Issuance ($bn) 2024F | ||||
| Sectors | 2024F | M&A related forecast | 2024 YTD Issuance | YTD as % of total forecast | ||
| Financials | 569 | 15 | 326 | 57% | 422 | 147 |
| Banks | 427 | 0 | 230 | 54% | 341 | 86 |
| US banks | 195 | 0 | 108 | 55% | 148 | 47 |
| Yankee Banks | 232 | 0 | 122 | 53% | 193 | 39 |
| Finance Companies | 67 | 9 | 40 | 60% | 44 | 23 |
| Insurance | 75 | 6 | 56 | 74% | 38 | 37 |
| Non-Financials | 870 | 169 | 517 | 59% | 399 | 471 |
| Automotive | 83 | 0 | 55 | 66% | 46 | 37 |
| Basic Industries | 51 | 6 | 29 | 56% | 22 | 29 |
| Capital Goods | 77 | 16 | 48 | 63% | 35 | 41 |
| Consumer | 94 | 23 | 44 | 47% | 30 | 64 |
| Energy | 74 | 21 | 47 | 64% | 40 | 34 |
| Healthcare/Pharma | 125 | 46 | 91 | 73% | 43 | 82 |
| Media/Entertainment | 26 | 5 | 8 | 30% | 11 | 15 |
| Property/Real Estate | 27 | 0 | 17 | 60% | 17 | 10 |
| Retail | 41 | 24 | 15 | 35% | 14 | 27 |
| Technology | 92 | 27 | 49 | 54% | 61 | 31 |
| Telecoms | 21 | 0 | 9 | 44% | 14 | 7 |
| Transportation | 32 | 0 | 16 | 49% | 25 | 6 |
| Utilities | 126 | 0 | 90 | 72% | 39 | 86 |
| Total | 1,438 | 184 | 843 | 59% | 821 | 617 |
This report was excerpted from US High Grade Credit 2024 Mid-Year Outlook: Moving from ‘as good as it gets’ to slightly less so - we revise our year-end spread forecast wider to 110bp, Eric Beinstein, June 24, 2024.
High Yield
- We published our 2024 High Yield and Leveraged Loan Midyear Outlook: Note, Presentation, Replay.
- We believe leveraged credit will provide carry-esque returns over the next six months and spreads will finish 2024 well inside the long-term average with balance sheets in a good position ahead of a forecasted economic slowdown (US GDP 1% 2H). As well, our colleagues expect relative rate stability with our UST yield targets aligned with market pricing. While expected to erode, HY balance sheets are in a good position with leverage only 0.2x above a decade low and coverage metrics still 0.5x above the long-term average. Not quite as robust, leverage for loan borrowers is at a four-year low and interest coverage ratios are stabilizing amid a record re-pricing wave. Ratings for HY are historically benign with CCCs rising off a multi-decade low and BBs 800bp above the long-term average. While ratings are not as supportive for loans, technicals are robust with retail inflows expected to continue and CLO issuance comfortably surpassing net new supply. As well, access to capital is broadening with 2024’s $235bn of B3 or lower rated issuance as much as the past few years’ activity combined. At the same time, investors are the most conservatively positioned by ratings in the past decade, which should serve to mitigate any sell-off in lower-quality credit.
- We forecast high yield bond spreads to widen 25bp to 380bp, which equates to a FY24 return of 6%+. And even with a repricing wave and forecasted 25bp decline in SOFR, the pure carry for loans is comfortably above bonds. For context, 2024’s record pace of re-pricing/refi activity has lowered asset margins 10bp YTD, and the average coupon (9.03%) is 23bp below the high. Our full-year 2024 return forecast for loans remains 9.0%. We also forecast a year-end 2024 loan YTM and STM of 8.75% and 500bp. With HY/LL spreads underpricing our 2025 default forecasts, the expected modest widening in 2H is due to our belief that an additional premium will need to be baked into spreads as growth slows, rates remain restrictive, the cycle matures, and uncertainty around 2025’s landscape builds.
- We believe the decade-high 127bp gap between LL/HY default rates will widen into year-end due to weaker credit fundamentals for loan issuers, headwinds from higher for longer policy rates, and a record pace of LMEs across the loan market. We forecast HY and LL default rates to end 2024 at 2.00% and 3.75%, respectively, and we expect them to rise further in 2025 to 3.00% and 4.00%. As well, we forecast 2024 high yield bond and loan issuance of $275bn and $1trn, respectively. We also maintain our non-refi related HY and loan issuance forecasts of $80bn (HY) and $145bn (LL). Meanwhile, we do believe that a more challenging corporate fundamental backdrop will translate into a modest rise in sectoral dispersion and ratings decompression as 2024 progresses.We recommend OW BBs and UW CCCs. Sectors we are OW include Financials, Metals/Mining, Media, and Utility, and sectors UW include Consumer Prod., Housing, Industrials, and Packaging.We are also downgrading Energy and upgrading Healthcare to Neutral.
High Yield Bond and Leveraged Loan Midyear Update: The Wolf Will Huff and Puff, but the House Will Not Fall Down
2024 Leveraged Credit Midyear Outlook Summary: Credit markets have taken the repricing of central bank policy expectations in stride in 1H24 with HY spreads (355bp) only 20bp above the post-GFC low and leveraged loans providing gains (4.5%) exceeding the bulk of fixed income. Our economists forecast 1.0% US GDP growth for the next two quarters driven by the ongoing impacts of tight monetary policy, as evidenced of late by the labor market’s gradual cooling and moderating inflation. And recent indications of solid but slowing growth are ideal for credit markets, assuming growth does not slow so much that corporate earnings estimates weaken materially. And if this slowdown in growth allows the Fed to reduce rates as our economists forecast for the November meeting, markets are likely to look forward to the positive economic impacts of the rate cut. Meanwhile, our colleagues are forecasting relative rate stability for the next six months with their YE24 2yr, 5yr, and 10yr Treasury yield targets of 4.6%, 4.3%, and 4.4% now closely aligned with present market pricing. For high yield bonds, weakening credit fundamentals, a less supportive technical (more supply, modest growth in outstanding), and negative agency trends are expected to be offset by supportive factors such as elevated yields, strong balance sheets, benign credit ratings, improving capital market conditions, resurfacing retail inflows, and a yoy decline in default activity. And for leveraged loans, the negative fundamental ramifications from elevated rates and slower growth should lead to ongoing downgrade and default risk, which we expect to be offset by elevated coupons (9%), earnings delivery, a record pace of CLO origination, steady inflows, and a negligible pace of net new supply. We believe leveraged credit will provide carry-esque returns over the next six months and spreads will finish 2024 comfortably inside the long-term average with balance sheets in a good position ahead of a forecasted modest economic slowdown.
We are forecasting 2024 total returns for high yield bonds and leveraged loans of 6% and 9%, respectively
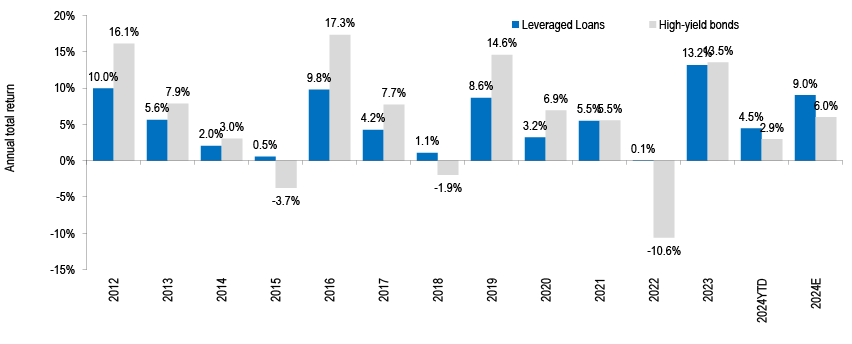
Source: J.P. Morgan.
2024 High Yield Bond and Leveraged Loan Forecasts
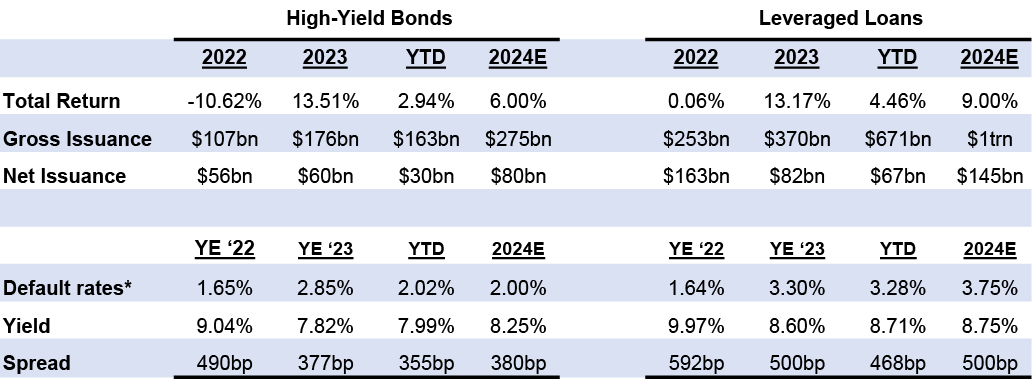
Source: J.P. Morgan.
Importantly, HY and LL corporates are delivering an elevated level of earnings beats and generally positive guidance. And HY balance sheets are in a good position to weather forthcoming corporate headwinds with leverage only 0.2x above a more than decade low (4.0x) and coverage metrics (5.0x) still 0.5x above the long-term average. Not quite as robust, leverage for loan borrowers is at a four-year low (4.9x), and interest coverage ratios (3.0x) are showing signs of stabilizing amid a record re-pricing wave. Ratings for HY are also historically benign with the attribution of CCCs and B3/B- rising off a multi-decade low and the attribution to BBs (48%) 800bp above the long-term average. The ratings narrative for the loan index is not as supportive, although the loan product is already trading at a near-historic extreme discount versus bonds (YTM for loans is 75bp above YTW for bonds). As well, issuers are pro-actively addressing maturities now with the bulk of 2024’s leveraged credit issuance attributable to refi. And with $209bn of the $471bn of maturities rated B3 or lower, importantly, access to capital is broadening with the $235bn of B3 or lower rated issuance in 1Q/2Q as much as the past few years’ activity combined. Meanwhile, the technical for bonds and leveraged loans has shifted to a neutral factor from a large tailwind over the past few years. The high yield bond universe is expanding in 2024 (+$37bn or 3% ) as an increase in net new money ($30bn non-refi plus $33bn bond-for-loan takeouts) is offsetting an ongoing imbalance of rising stars ($24bn) versus fallen angels ($5bn). We expect the high yield bond market to grow by $75bn in 2024 (or 6%) due to active bond-for-loan takeout activity and as fallen angels narrowly surpass rising stars in 2H24. And 2024’s modest expansion in leveraged loans (+$7bn) has been accompanied by modest net new issue volumes and an increase in syndicated loans issued to refinance high yield bonds ($10.2bn) and private credit ($15.8bn). We expect the leveraged loan universe to contract by a modest amount in 2H24 (~$15bn) amid light net new issuance, ongoing cannibalization by private credit, and as bond-for-loan takeouts exceed loan-for-bond takeouts. At the same time, investors are the most conservatively positioned by ratings in the past decade, which should serve to mitigate any sell-off in lower-quality credit in response to a forecasted mild economic slowing.
B3 or lower volume is at a high since 2021 amid broadening access to capital
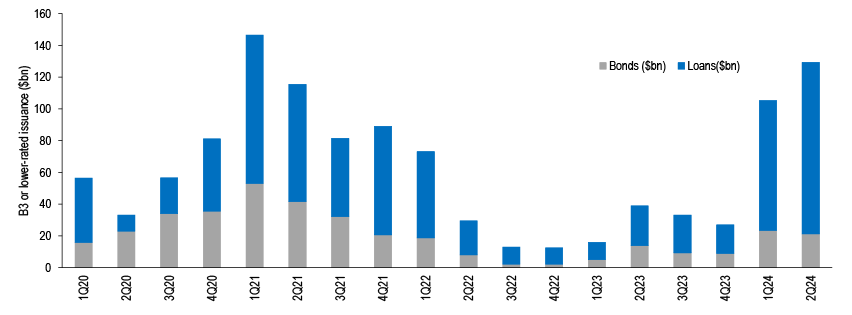
Source: J.P. Morgan.
The high yield bond product has its most benign ratings mix on record, whereas ratings trends for leveraged loans are less supportive and getting worse amid a downgrade wave
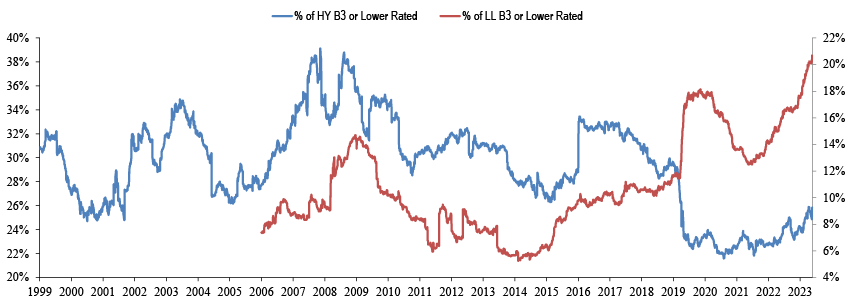
Source: J.P. Morgan.
We continue to forecast high yield bond spreads to widen 25bp to 380bp by year-end 2024, which includes a 25bp rise in the YTW to 8.25%. This equates to a full-year return for high yield bonds of 6%+, or a 3%+ return in 2H24 after delivering 2.9% in 1H24. Even with a record repricing wave and SOFR expected to end the year 25bp lower, the pure carry on the loan product is still comfortably above bonds. For context, 23% of the loan market has repriced in 2024, which compares to as much as 45% in 2017. As discussed here, a repricing and refinancing wave equating to 2017’s would only erase ~25bp of carry (average 60bp reduction to margins). For context, 2024’s re-pricing/refinancing activity has lowered asset margins for the index by 10bp YTD, and the average coupon (9.03%) is only 23bp below the high. Our full-year 2024 return forecast for leveraged loans continues to be 9.0%, or a 4.5% return in 2H24 after delivering 4.3% in 1H24. We also continue to forecast a year-end 2024 yield and spread to maturity for the loan index of 8.75% and 500bp.With HY/LL spreads underpricing our 2025 default forecasts, the expected modest widening in 2H is due to our belief that an additional premium will need to be baked into spreads as growth slows, rates remain restrictive, the cycle matures, and uncertainty around 2025’s landscape builds.
We forecast high yield bond spreads to widen 25bp over the next six months to 380bp, which is well below the 30-year average
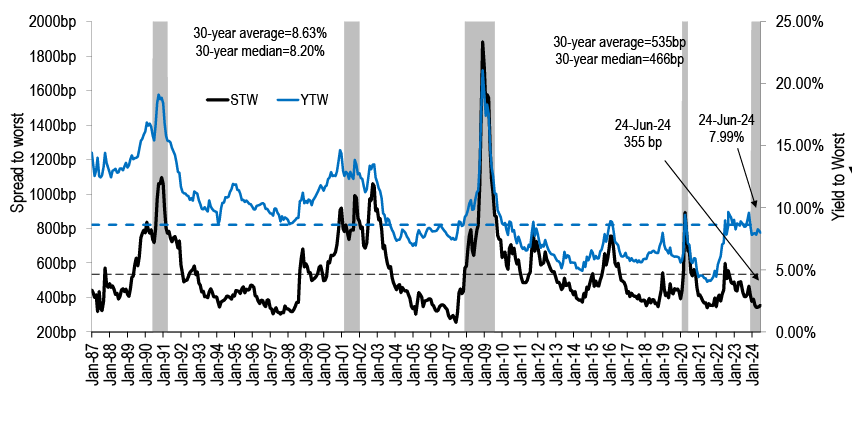
Source: J.P. Morgan.
Loan asset margins are down only 10bp year to date due to a repricing and refinancing wave

Source: J.P. Morgan.
We continue to believe the decade-high 127bp gap between LL/HY default rates will widen into year-end due to weaker credit fundamentals for loan issuers, headwinds from higher-for-longer policy rates, and a record pace of distressed transactions/liability management exercises (LMEs) across the loan market. Meanwhile, bond default rates are expected to benefit from a roll-off of heavy default activity between June and November 2023. Specifically, we forecast high yield bond and leveraged loan default rates to end 2024 at 2.00% and 3.75%, respectively, and we expect them to rise further in 2025 to 3.00% and 4.00%. Factors that support a less severe default outcome in the next 18 months include a resilient economy, limited maturities, broadening access to capital, strong balance sheets, a 2019-esque distressed environment, and a historically benign ratings profile for bonds. As well, we continue to forecast 2024 high yield bond and loan issuance of $275bn and $1trn, respectively, or comfortably below the past decades’ average of $340bn (HY) and $550bn (LL). We also maintain our non-refi related HY and loan issuance forecasts of $80bn (HY) and $145bn (LL) given issuers’ and investors’ focus on refinancing. For context, net issuance has averaged $125bn and $195bn per annum since 2010. And at a mere 7% of outstanding, 2024’s net issuance would equate to one-third of 2012-2021’s run-rate. Meanwhile, we do believe that a more challenging corporate fundamental backdrop will translate into a modest increase in sectoral dispersion and ratings decompression as 2024 progresses. We expect these conditions to materialize by the 3Q reporting season. This implies an investor will be better served allocating up in quality despite lower-quality credits’ slight outperformance year to date. For context, CCCs underperformed in four of 2024’s first five months amid rising idiosyncratic issues in sectors such as Telecom and Cable. We recommend Overweighting BBs and Underweighting CCCs. And sectors we are OW include Financials, Metals/Mining, Media, and Utility, and sectors we are UW include Consumer Products, Housing, Industrials, and Paper/Packaging. We are downgrading the HY Energy sector from Overweight to Neutral as the sector has outperformed. We are also upgrading Healthcare from Underweight to Neutral given better visibility around stability in the near term. The loan product is expected to feel more fundamental headwinds than bonds from the immediate transmission of rates and more aggressive capital market trends. We find B1 loans attractively priced versus BB loans. And given we expect the downgrade to continue, B2/B/B3/B- loans should underperform amid hindered demand conditions.
We continue to forecast high yield bond and leveraged loan default rates in 2024 of 2.00% and 3.75%, respectively, which we expect to rises to 3.00% and 4.00% in 2025
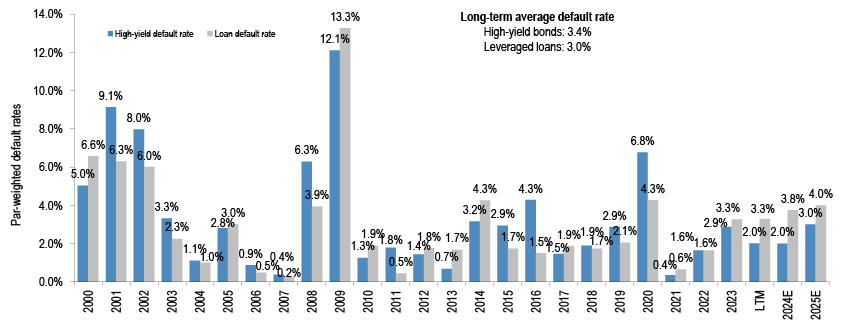
Source: J.P. Morgan.
Refinancing activity in 2024 is expected to exceed 2021’s record production with meaningful Fed rate cuts appearing further out
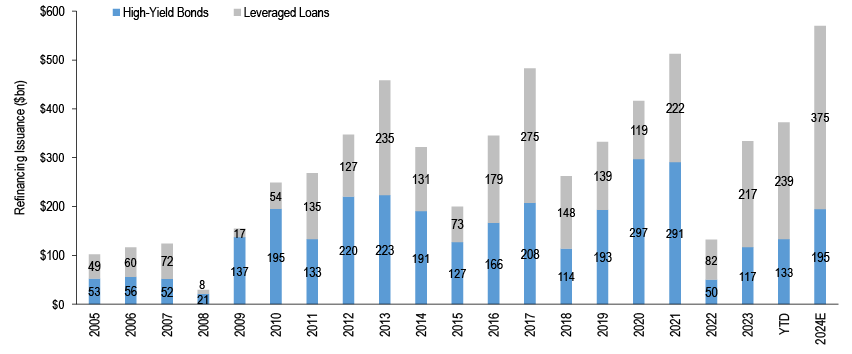
Source: J.P. Morgan.
This report was excerpted from, 2024 High Yield Bond and Leveraged Loan Midyear Outlook, Nelson Jantzen, June 26th, 2024
CLO
MY24 Outlook - Fire Burn and Cauldron Bubble
- We are hosting our midyear outlook webinar on Wednesday, June 26th, at 10 am EST / 3pm BST. In order to join and/or view the replay please pre-register here: https://openexc.zoom.us/webinar/register/WN_7u4MWNeeRK-3BsAiY1_c8Q
- After a strong H1, the bullish tone in CLOs is susceptible to macro event risks from geopolitics to disinflation. CLOs have had strong YTD returns (+4.3% CLOIE Total) and we modestly adjust our FY forecast to +7.5% (from +7.0% prior) or slightly less return of +3.2% for the rest of the year. Demand for floaters is solid amid yield curve inversion and CLO T1 AAAs swept through our 140bp MY target and are closer to our 130bp YE target we set on April 10th, a view that was met with skepticism at the time; link. Spreads are tight (14th %ile) and our targets and trade ideas imply not much alpha, but our 130bp target implies a modicum of compression.
- We’re neither Cassandra nor the Oracle of Delphi, but what are signs of a market bubble or at least some overheating? US CLO new origination has been setting near-consecutive monthly records even as loan creation underwhelms; this seems unsustainable unless buyouts and M&A pick up ( Figure 252). CLO new supply has outpaced net loan supply for the last 22 out of 25 months and we hesitate to make comparisons, but this is unprecedented: in 2005-2007, CLOs outpaced net loans in only 4 months. Meanwhile, par-plus pricing in CLO bonds and loans challenges forward debt and equity return. As a result, we’ve noticed a pick-up in questions about bullish outcomes such as if money market funds become a material buyer of CLO AAAs (we don’t see this given constraints and MMFs around Fed cycles: link) to goldilocks growth and inflation continuing. As a possible sign of complacency, CLO spread trading ranges are back to 2021-era levels ( Figure 253).
- We often hear that market technicals will remain strong given expectations of negative net supply after runoff, but we don’t see this, and portfolios may also be at risk of future extension as tight spreads encourage CLO resets and as the loan maturity wall extends. In fact, net growth is +$56bn US CLO and +$73bn globally in 24H1 despite some amortization. We’re expecting a slowdown in H2 and project FY24 CLO net supply after amortization of +$60bn US and +$75bn globally, a weaker pace but still above last year (+$51bn US CLO, +$70bn globally). Given our revised supply forecast of $140-150bn, this implies -$40-45bn of paydowns in H2 compared to -$40bn in H1 or that amortization reduces FY supply by ~60%. (CLO resets/refis do not alter the equation as they merely recycle older deals to some newer holders and situational upsizes actually increase market outstandings).
- We are adjusting our US CLO new issue supply forecast to $140-150bn (or $145bn, from $130bn prior) and raising our refi/reset forecast to $180bn (from $100bn prior) as spreads tightened to our 140bp MY target quicker than we anticipated. $145bn implies a sizeable reduction of -50% in the pace (YTD $97bn) and we think managers will prioritize AUM even if funding spreads widen. This forecast, if realized, would be the second-highest US CLO new issue year but some way below the record $184.5bn in 2021. Collateral creation is challenging and CLOs will essentially be taking up most if not nearly all of our colleagues’ $145bn net new money US Loan forecast with managers also having to buy in secondary (our forecast includes PCLO). The high CLO refi/reset forecast also dovetails with strong refi and repricing activity in loans with our colleagues having raised their US Loan gross supply forecast to $1tn. In Europe, we increase our new CLO supply forecast to €40bn (from €30bn) which if reached would be similar to record $39.6bn in 2021.
- CLOs do offer some relative value, but this is more situational now. Call-adjusted AAAs of around 110-115bp from 135-140bp nominal currently (assumes -25bp adjustment; see here), in line with plain-vanilla Corporates (106bp JULI US, 125bp iBoxx Non-Fins Europe). Our top trades are 1) Selectively sell par-plus AAA in secondary to buy short refi at par, 2) Buy deleveraging/near-deleveraging AA and A for low spread duration while earning carry, and 3) Selectively buy clean Mezz (BB) at 10%+ YTM were spreads to soften on resets or risk-off.
- CLO credit performance is unlikely to meaningfully turn in H2 unless the economy falls into recession, but May did produce the third-highest distressed exchange activity on record and JPM raised the loan default rate forecast to 3.75% (from 3.25%) (link). Junior OC (BB/B) Cushions have slightly eroded from 3.8% at this time last year to 3.5%, and currently 3.4% of 1,546 US BSL CLOs are failing. There has been an uptick in Moody’s and S&P CCC exposure, both of which are +1% LTM in US BSL portfolios, but underperformance remains mostly concentrated in older vintages (2012-2015) that may have difficulty refinancing/resetting and instead are likely to liquidate/amortize.
CLO MY24 Outlook - Fire Burn and Cauldron Bubble
After a strong H1, the bullish tone in CLOs is susceptible to macro event risks from geopolitics to disinflation.CLOs have had strong YTD returns (+4.3% CLOIE Total) and we modestly adjust our FY forecast to +7.5% (from +7.0% prior) or slightly less return of +3.2% for the rest of the year. Demand for floaters is solid amid yield curve inversion and CLO T1 AAAs swept through our 140bp MY target and are closer to our 130bp YE target we set on April 10th, a view that was met with skepticism at the time; link. Even so, spreads are tight (14th %ile) and our targets and trade ideas imply not much alpha, but the direction of travel is tighter in the broader backdrop of JPM’s house view of tactical bearishness on duration and some narrowing in corporate credit spreads (link).
We’re neither Cassandra nor the Oracle of Delphi, but what are signs of a market bubble or at least some overheating? US CLO new origination has been setting near-consecutive monthly records even as loan creation underwhelms; this seems unsustainable unless buyouts and M&A pick up ( Figure 252). CLO new supply has outpaced net loan supply for the last 22 out of 25 months and we hesitate to make comparisons, but this is unprecedented (in 2005-2007, CLOs outpaced net loans in only 4 months). Meanwhile, par-plus pricing in CLO bonds and loans challenges forward debt and equity returns. As a result, we’ve noticed a pick-up in questions about bullish outcomes such as if money market funds become a material buyer and push CLO AAAs tighter (we don’t see this given constraints and MMFs around Fed cycles: link) to goldilocks growth/inflation continuing. As a possible sign of complacency, CLO spread trading ranges are back to 2021-era levels ( Figure 253).
We often hear that market technicals will remain strong given expectations of negative net supply after runoff, but we don’t see this, and portfolios may also be at risk of future extension as tight spreads encourage CLO resets and as the loan maturity wall extends. In fact, net growth is +$56bn US CLO and +$73bn globally in 24H1 despite some amortization. We’re expecting a slowdown in H2 and project FY24 CLO net supply after amortization of +$60bn US and +$75bn globally which is a weaker pace but still above last year’s growth in FY23 (+$51bn US CLO, +$70bn globally). Given our revised supply forecast of $140-150bn, this implies about -$40-45bn of paydowns in H2 compared to -$40bn in H1 or that amortization effectively reduces FY supply by ~60%. (CLO resets/refis do not alter the equation as they merely recycle older deals to some newer holders and situational upsizes actually increase market outstandings).
We are adjusting our US CLO new issue supply forecast to $140-150bn (or $145bn, from $130bn prior) and raising our refi/reset forecast to $180bn (from $100bn prior) as spread tightening has been quicker than we anticipated. $145bn implies a sizeable reduction of -50% in the pace (YTD $97bn) and we think managers will prioritize AUM even if spreads widen. This forecast, if realized, would be the second-highest US CLO new issue year but some way below the record $184.5bn in 2021. Collateral creation is challenging and CLOs will essentially be taking up most if not nearly all of our colleagues’ $145bn net new money US Loan forecast with managers also having to buy in secondary (our forecast includes PCLO). The high CLO refi/reset forecast also dovetails with strong refi and repricing activity in loans with our colleagues having raised their US Loan gross supply forecast to $1tn. In Europe, we increase our new CLO supply forecast to €40bn (from €30bn) which if reached would be similar to record $39.6bn in 2021.
CLOs do offer some relative value, but more situational now. Call-adjusted AAAs of around 110-115bp from 135-140bp nominal currently (assumes -25bp adjustment; see here), in-line with plain-vanilla Corporates (106bp JULI US, 125bp iBoxx Non-Fins Europe). Our top trades are 1) Selectively sell par-plus AAA in secondary to buy short refi at par, 2) Buy deleveraging/near-deleveraging AA and A for low spread duration while earning carry, and 3) Selectively buy clean Mezz (BB) at 10%+ YTM were spreads to soften on resets or risk-off.
CLO credit performance is unlikely to meaningfully turn in H2 unless the economy falls into recession, but May did produce the third-highest distressed exchange activity on record and JPM raised the loan default rate forecast to 3.75% (from 3.25%) (link). Junior OC (BB/B) Cushions have slightly eroded from 3.8% at this time last year to 3.5%, and currently 3.4% of 1,546 US BSL CLOs are failing. There has been an uptick in Moody’s and S&P CCC exposure, both of which are +1% LTM in US BSL portfolios, but underperformance remains mostly concentrated in older vintages (2012-2015) that may have difficulty refinancing/resetting and instead are likely to liquidate/amortize.
Figure 251: Positive YTD net growth as record new origination outweighs amortization
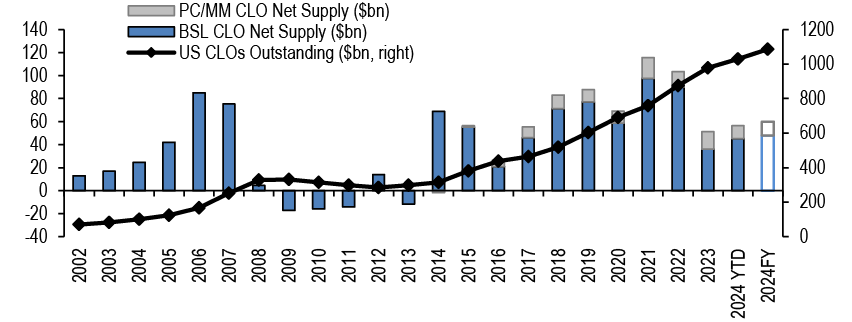
Source: J.P. Morgan, Bloomberg Finance, L.P. PC/MM CLO net supply data available from 2014. As of June 17th, 2024.
Figure 252: There have been many key supply moments in the first few months of 2024
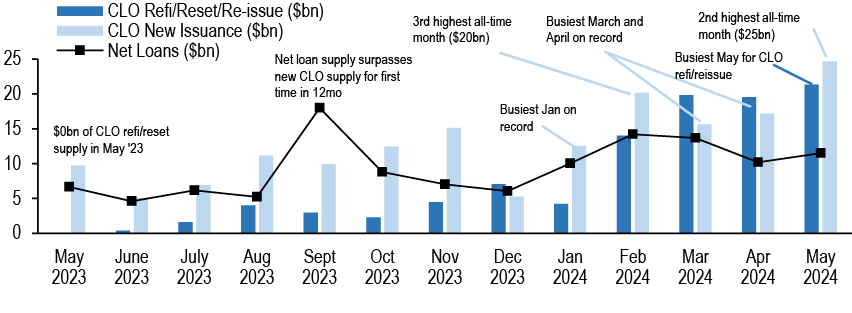
Source: J.P. Morgan.
Spreads/Total Return Forecast
Our YE24 US and Euro AAA Primary Tier 1 target of 130bp imply 10bp compression and it’s possible that our forecast will be met sooner rather than later. Demand for floating-rate products is robust and spreads have trekked tighter over recent weeks given supportive market technicals. After reaching our 140bp MY24 target, Tier 1 CLO AAA Primary spreads are now in the in the 14th percentile based on the last decade (adj. to SOFR) versus the 8th percentile for US HG Credit, so CLOs are not that historically cheap anymore even as other sectors are a bit tighter. Market volatility and CLO spread ranges are back to 2021-era levels which implies very benign outcomes around growth and inflation after so much compression already, posing risk to valuations. We expect that compression is limited given heavy issuance, call risk, and above-par secondary pricing (97.7% of CLOIE AAA is currently trading above par). CLOs have had strong YTD returns (+4.3% CLOIE Total) and we modestly adjust our FY index return forecast to +7.5% (from +7.0% prior) which implies slightly less return of +3.2% for the rest of the year.
Figure 253: Spread ranges are back to 2021’s low volatility-era
bp
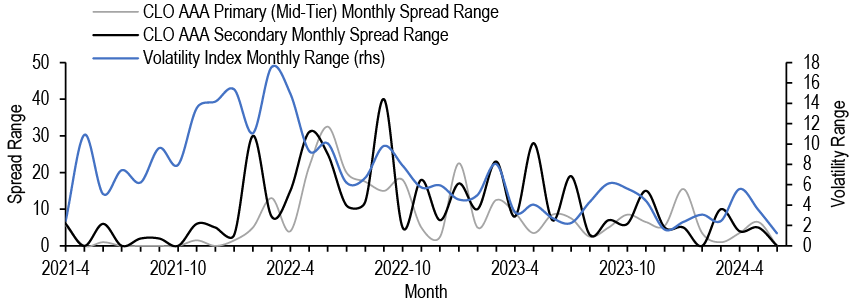
Source: J.P. Morgan, Bloomberg Finance, L.P. Based on monthly Max-Min range for CLO spreads and the VIX Index. Smoothed line for formatting purposes.
Figure 254: Call-Adjusted CLO spreads are almost as tight as more plain-vanilla corporate and securitized products
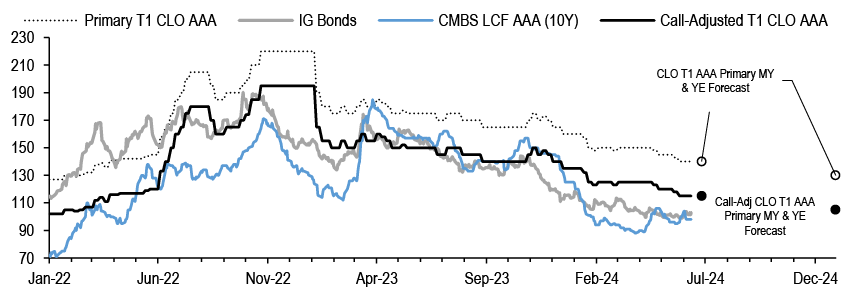
Source: J.P. Morgan. Based on Tier 1 Primary US CLO AAA weekly spread series. Call-adjusted series assumes a -25bp margin reduction.
Supply Trends
We are adjusting our US CLO new issue supply forecast to $140-150bn (from $130bn prior). We are also raising our refi/reset forecast to $180bn (from $100bn prior) as spread momentum to our (achieved) 140bp MY24 target has been quicker than we anticipated and spreads are closing in on our 130bp YE24 target . Readers might be surprised given the tone of this outlook, but managers will prioritize AUM growth even if spreads widen. This forecast, if realized, would be the second-highest US CLO new issue year but still some way below the record $184.5bn in 2021. Collateral creation remains very challenging and CLOs will essentially be taking up most if not nearly all of our colleagues’ $145bn net new money US Loan forecast with managers also having to buy in secondary (and also our forecast includes PCLO). The very high CLO refi/reset forecast also dovetails with record refi and repricing activity in the loan market with our colleagues having raised their US Loan gross supply forecast to $1tn.
To achieve $140-150bn the US, an average ~$8bn per month is needed to year-end, which appears attainable given that there has been an average $18bn per month over the first 5 months. May was the second heaviest month of all-time ($25bn) in addition to the busiest Jan, Feb, March, and April months ever ( Table 1), which has pushed YTD new supply to a record pace of $97bn, but we have observed some slowdown of supply in June to $6.8bn MTD. CLO supply has been strong amidst a huge amount of capital markets activity across a hot fixed income market from government borrowing to loan repricings to corporates. On the other hand, we expect that the second half of the year will slow as collateral sourcing is challenging and new CLO supply has outpaced net loan supply for the last 22 out of 25 months, which is unprecedented given that in the run-up to the GFC there were only 4 months that CLOs outpaced net loans. Currently one-third of US BSL CLOs are out of reinvestment, but net growth has been positive (+$56bn YTD US, +$73bn YTD globally) through 1H24 ( Figure 251). We’re expecting some slowdown in the second half of the year and project 2024YE net growth to be +$60bn in the US and +$75bn globally. Given our supply forecast of $140-150bn, this implies about $40-45bn of paydowns in 2H compared to $40bn in 1H.
In Europe, we increase our new CLO supply forecast to €40bn (from €30bn) which if reached would be about the same as the record $39.6bn in 2021. We are currently at $23.5bn YTD which is a record pace and up +88% YoY. Over the last five months, issuance has been an average €4.4bn and we expect an average €2.5bn over the next 7 months to reach our forecast. While supply has not been quite as shattering as in the US, which is a much larger market ($1086bn US vs €240bn EUR), we have seen the busiest January, April, and May months in Europe this year. We expect a slight slowdown in the second half of the year.
Refi/Reset
We are also raising our refi/reset supply forecast to $180bn (from $100bn prior) which implies strong activity in the second half of the year after $95bn in 1H24 given that we expect spreads to continue tightening. There is $78bn of deal notional, or an additional 8.8% of the universe, coming out of non-call period in the second half of the year, of which $51bn has a AAA margin that is wider than 140bp suggesting this cohort is currently in-the-money. This is in addition to the $610bn or 70% of the universe that is already callable. Moreover, $79bn of deal notional is exiting reinvestment in 2024, of which $28bn has a AAA margin wider than 140bp and is likely to reset to extend and capture lower funding costs ( Table 1). Given our view that spreads will compress to 130bp by by year-end, even minimal tightening will make it more favorable to reset/refinance the liabilities over the course of the year.
We expect that high margin and recent vintage CLOs will continue to be the bulk of refi/reset activity. Most of the activity is likely to come from 2018-2020 vintages, which are beginning to exit reinvestment or have a high cost of funding. There is limited ability to refinance or reset older vintage CLOs as they have more seasoned portfolios, higher CCC and default exposure, and may have looser deal documentation around post-reinvestment trading activity; for context, only 14% of YTD refi/reset activity has been from 2015 or earlier vintages. In 2024 YTD, there have been 129 US Resets (totaling $57bn) and 97 Refinancings (totaling $36bn), which have mostly been from 2018-2020 vintage deals. On average, the AAA margin reduction is -6bp for US BSL resets and -27bp for US BSL refinancings YTD, though there is dispersion ( Figure 255).
Table 1: What US BSL CLOs are ‘in-the-money’ by reinvest year?
| US BSL CLOs ($bn) | Reinvest Year | ||||
| AAA Margin | 2023 and Earlier | 2024 | 2025 | 2026 | 2027 and Later |
| <120 | 9.9% | 2.4% | 1.3% | 0.0% | 0.0% |
| 120 to 130 | 34.3% | 15.3% | 12.9% | 3.3% | 0.3% |
| 130 to 140 | 32.0% | 46.4% | 19.1% | 24.1% | 14.6% |
| 140 to 150 | 17.9% | 20.6% | 19.9% | 54.6% | 15.7% |
| 150 to 160 | 4.1% | 7.0% | 25.8% | 7.9% | 22.1% |
| 160 to 170 | 0.6% | 3.3% | 11.8% | 3.1% | 9.1% |
| 170 to 180 | 0.6% | 5.0% | 5.3% | 0.8% | 9.5% |
| >=180 | 0.5% | 0.0% | 3.8% | 6.2% | 28.7% |
| Total | 221.25 | 79.00 | 37.79 | 252.45 | 285.14 |
| Total % of Total Deal Notional | 25.27% | 9.02% | 4.32% | 28.83% | 32.56% |
| Total > 140bp | 52.67 | 28.38 | 25.21 | 183.17 | 242.64 |
| Total >140bp % of Total Deal Notional | 6.01% | 3.24% | 2.88% | 20.92% | 27.71% |
Source: J.P. Morgan, Intex. Based on 1,917 US BSL CLOs (excluding static and PC/MM CLOs) and $876bn of deal notional. Margin based on largest CLOIE AAA Tranches as of 5/31/2024.
Figure 255: YTD Refi/Reset Supply has primarily been from the 2018-2020 vintages
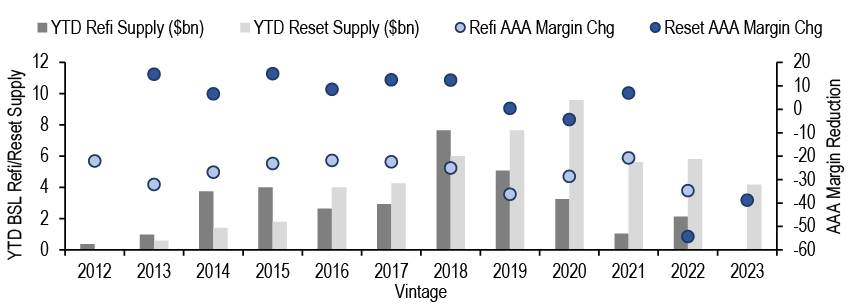
Source: J.P. Morgan. Excludes Static and PC/MM CLOs. Captures average YTD refi/reset margin reduction of largest floating-rate CLO AAA tranches.
Performance
Market technicals have been strong for the last few months, what about fundamentals? CLO credit loss and performance is unlikely to meaningfully turn in H2 unless the economy rapidly falls into recession, but May produced the third highest exchange activity on record. Our HY/Loan colleagues’ have raised their leveraged loan default rate forecast to 3.75% (from 3.25%) due to weaker credit fundamentals for loan issuers, headwinds from higher for longer policy rates, and a record pace of distressed transactions/LMEs across the loan market (link). In terms of CLO collateral performance, Junior OC (BB/B) Cushions have only slightly eroded from 3.8% at this time last year to 3.5%, and currently 3.4% of 1,546 US BSL CLOs are failing. There has been an uptick in Moody’s Caa exposure, which has risen from 4.1% at this time last year to 5.1% currently. Similarly, S&P CCC exposure has risen from 5.1% to 6.1% over the last 12 months. There is significant dispersion by vintage, as 2015 or earlier deals are underperforming with 27% failing Moody’s Caa, 50% failing S&P CCC, and 15% failing the OC test ( Table 2).
Table 2: Older CLO vintages are significantly underperforming compared to newer vintages
| Moody's Caa1 or less | S&P CCC or less | Junior BB/B OC Cushion | ||||||||||
| Vintage | Total | 2012-2015 | 2016-2019 | 2020-2023 | Total | 2012-2015 | 2016-2019 | 2020-2023 | Total | 2012-2015 | 2016-2019 | 2020-2023 |
| Total Deal Count | 1509 | 101 | 505 | 903 | 1483 | 97 | 474 | 912 | 1546 | 110 | 533 | 903 |
| Max | 22.9% | 13.2% | 22.9% | 19.5% | 18.3% | 18.3% | 14.4% | 15.0% | 9.1% | 5.6% | 6.4% | 9.1% |
| Average | 5.1% | 6.3% | 6.3% | 4.3% | 6.1% | 7.6% | 7.4% | 5.3% | 3.5% | 1.4% | 2.3% | 4.5% |
| Median | 5.1% | 6.1% | 6.2% | 4.5% | 6.2% | 7.3% | 7.3% | 5.4% | 4.0% | 1.3% | 2.2% | 4.6% |
| Min | 0.0% | 1.9% | 1.7% | 0.0% | 0.0% | 3.6% | 1.6% | 0.0% | -2.3% | -1.0% | -2.3% | 0.0% |
| Average Limit | 7.5% | 7.5% | 7.6% | 7.5% | 7.5% | 7.5% | 7.5% | 7.5% | NA | NA | NA | NA |
| # of Deals ≥ Limit | 220 | 27 | 134 | 59 | 410 | 48 | 222 | 140 | 53 | 16 | 37 | 0 |
| % of Deals ≥ Limit | 14.6% | 26.7% | 26.5% | 6.5% | 27.6% | 49.5% | 46.8% | 15.4% | 3.4% | 14.5% | 6.9% | 0.0% |
Source: J.P. Morgan, INTEX. See US Manager Analytics for deal criteria. As of June 10th, 2024.
Credit Derivatives
Market Themes and Relative Value Trade Ideas in the Credit Derivatives Market
- Indices – CDS indices appear to be at the tighter end of the range so look attractive for hedging purposes. We position for further decompression in corporates and see SnrFins as an attractive short.
- Curves – We position for steeper curves in IG indices amidst a low vol environment while expecting HY curves to continue to be under pressure from concerns stemming from higher dispersion in HY markets.
- Options & VTRAC-X – Implied volatility has not declined despite the narrow trading range. We prefer to sell Credit options to buy cheap Rates volatility.
- Tranches – We continue to use tranches to position for increased dispersion outside the already weak names, with CDX.HY 35-100 as a favourite long and Xover 10-100 as a preferred short.
- Bond-CDS Basis – We saw an overall trend of cash outperformance in the first half of the year driven by strong demand. We position for cash to continue outperforming synthetics in IG but prefer synthetics for longs in HY.
- Credit–Equity – Equities to stay more volatile than credit. We like to fund equity shorts with high grade credit longs.
Executive Summary
Macro volatility has been subdued over the first half of 2024 as inflation has remained under control and the US economy robust. It’s hard to see what changes this narrative, but as the recent European Parliamentary elections show, volatility arrives abruptly and unexpectedly. We are reluctant to sell volatility at these levels, but equally unwilling to pay away returns in the hope that something, somewhere breaks. As such we’ve positioned for relative value, buying assets we believe still offer good returns and hedging with assets that offer convexity in a sell off.
Returns from headline indices so far this year have been attractive ( Table 3 Table NaN) albeit not spectacular. Investment Grade indices have returned 80c so far, while High Yield indices have returned 2-3.5%. For the remainder of the year, our base case is that returns remain positive but mostly due to carry and roll down rather than spread tightening.
Table 3: 1H24 Total Returns and 2H24 Forecasts

Source: J.P. Morgan.
Thematically we are positioned as follows:
- We prefer our longs in Cash and shorts in Derivatives as the latter looks stretched.
- We are sticking with Decompression as Recession remains on the horizon and Rates volatility subdued.
- We use Credit options to buy cheap Rates optionality.
- We expect US indices to outperform.
Top Trades
Indices
Our favourite long is CDX.IG which is reassuringly expensive.
Our favourite short is iTraxx Snr Fin which has outperformed and appears to be a cheap option in an environment of heightened rates uncertainty.
Curves
CDX.IG 5s10s steepeners hedged with payers
We position for 5s10s curve steepening as a low volatility strategy and hedge with out-of-the-money payers which screen cheap relative to curves. We prefer implementing the trade in CDX.IG due to lower sensitivity of a curve to wider spreads at current levels and lower vol cost.
Bond-CDS Basis
US Banks: Long 10y cash bonds vs 5y CDS
Financials have outperformed versus the rest of the market over the past few months. The move appears overdone in the synthetic space with CDS-Bond basis for the sector screening elevated relative to the rest of the market.
Options
Buy LQD Calls
Implied Rates-Credit correlation is negative and market participants appear short duration, which suggests to us that investors should be looking to position for lower yields through US high grade credit. LQD calls appear an inexpensive way to do this, particularly when compared to TLT calls, which have increased in cost over the past few months.
Buy HYG Puts
We think investors have largely discounted a US recession in the near term and have refrained from buying HYG puts on the back of this. HYG implied volatility is at the post-COVID lows and screens cheap relative to Equity volatility (SPY). With HYG similarly pricing in negative Rates-Credit correlation we think buying optionality, particularly on the downside, is attractive via HYG puts.
Tranches
Best tranche long: CDX.HY 35-100 (vs Delta)
Take advantage of the recent rise in correlation and high carry+slide offered by CDX.HY Super Senior. Implement delta hedging to position for rising dispersion and distress, funded by selling tail convexity, which we perceive as a lower risk for the second half of the year.
Best tranche short: Xover 10-100 (vs Main)
With dispersion at multi year highs in Crossover, the bulk of portfolio expected loss has shifted into the equity tranche, leaving the 10-100 synthetic tranche at historically tight spreads. We like to use the ex equity/distress index to position for continued decompression of the index vs Main.
TRS & ETF
Negative Macro Basis: Long IEAC vs Main
The current tight spread, low volatility and high rates environment favors cash outperformance versus synthetics. We position for cash compression in European HG cash vs Main as CDS-Bond basis screens negative versus current levels of index spreads.
Credit-Equity
Buy SX5E ATMS Puts vs Selling Main ATMF Puts
Take advantage of recent underperformance of credit, stretched equity valuations and elevated credit vol to fund ATMSpot SX5E puts with out of the money Main payers to September.
Short Russell 2000 vs Long CDX.IG
Hedge the continued underperformance of rate-sensitive small-cap stocks in a higher-for-longer interest rate environment funded by a long in quality credits that should remain relatively resilient.
Indices
H1 Review
It’s been largely a one way trip for CDS indices in 2024 with spreads tighter across the board; Main/IG/XO/HY are -10/-13/-23/-42 basis points tighter on a roll adjusted basis ( Table 4). The wobble in April, on the back of higher inflation and an adjustment to a “higher for longer” environment, along with rising oil prices, was short lived and the rally continued ( Figure 256). Recently, however, as we have moved into the summer months, the rally has lost steam and CDS indices appear unable to break through their YtD tights.
Below the surface, many of the relative value measures we track have seen meaningful changes. Decompression has been prevalent with High Yield indices underperforming Investment Grade Indices in both the US and Europe. On a risk-adjusted basis, Crossover has been the worst performing index, a theme we had positioned for in our CD Player 2024 Outlook. Our expectation that Non-Financials would outperform Financials has not played out as SenFin has been the best performing index across the board — the SenFin versus NonFin spread differential has compressed from 16bp to just 9bp. We had however expected US indices to outperform European indices and this has indeed been the case both in HG and HY as the US economy remains resilient.
Table 4: CDS Indices Summary

Source: J.P. Morgan.
Table 5: CDS Index RV Summary

Source: J.P. Morgan.
Figure 256: Investment Grade CDS Indices
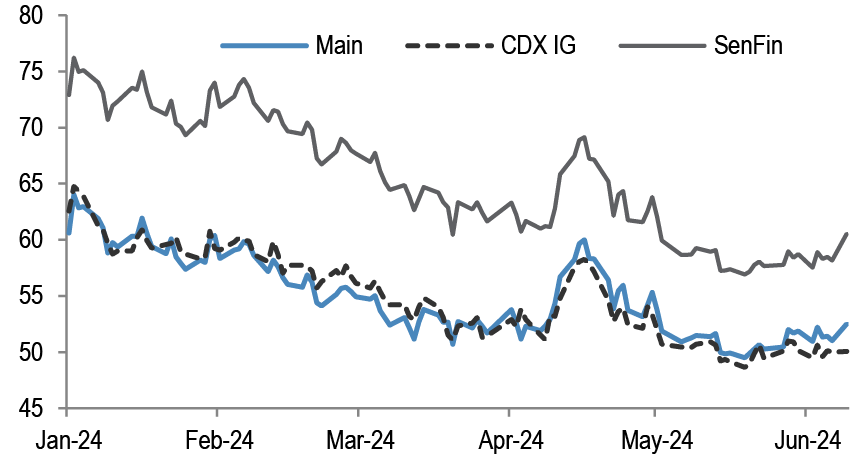
Source: J.P. Morgan.
Figure 257: High Yield CDS Indices
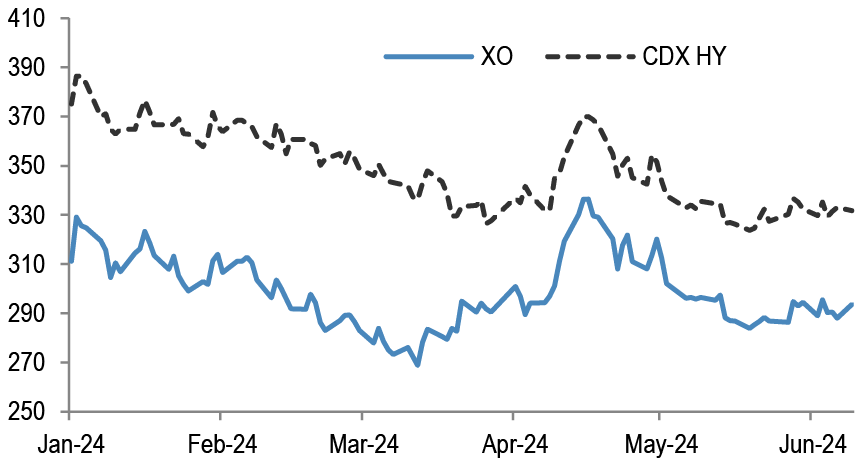
Source: J.P. Morgan.
Figure 258: HY/IG Relative Value
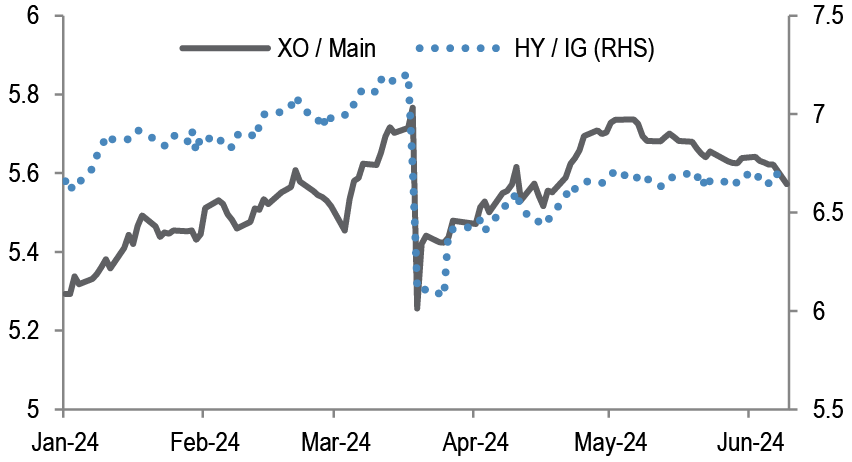
Source: J.P. Morgan.
Figure 259: Fins vs Non-Fins Relative Value
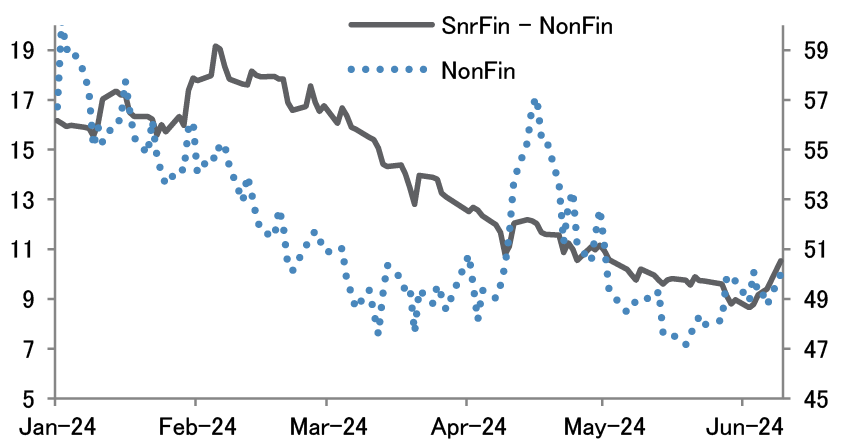
Source: J.P. Morgan.
Figure 260: Sub vs Senior Relative Value
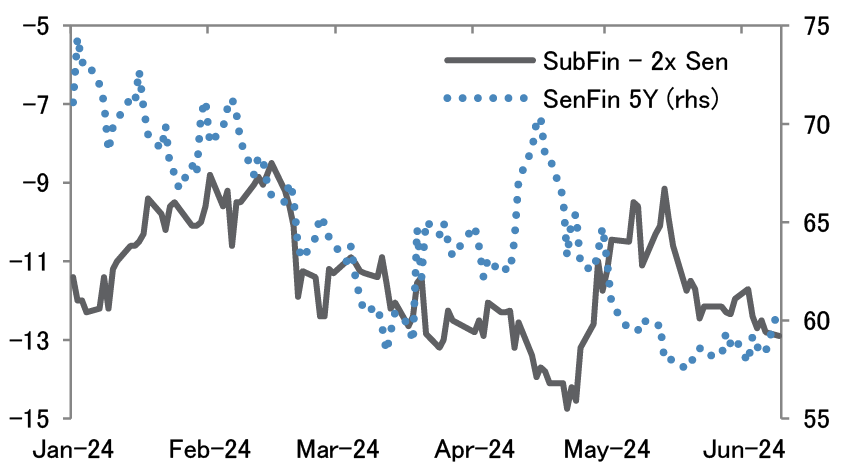
Source: J.P. Morgan.
Figure 261: US vs Europe Relative Value
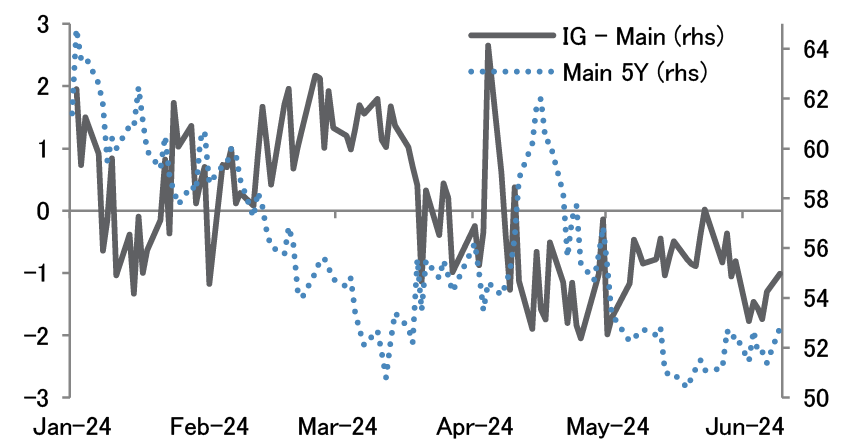
Source: J.P. Morgan.
H2 Outlook
With CDS indices now towards if not at the tight end of the range, we generally use the product as a tool for hedging rather than risk addition. While a risk-on, low-vol environment for the summer will likely continue to cause spreads to rally, we think there are better longs than just generic CDS positions. We still think there are enough risks on the horizon with recession delayed rather than averted to keep spreads elevated, and don’t expect to see either recessionary or benign level spreads for the rest of the year.
From a relative value perspective, we stick with decompression as a dominant theme — so far the index level decompression has been driven by a handful of weak names — we expect this to continue and would be long Investment Grade versus High Yield Indices. We prefer non-financials to financials, where the spread differential is at multi-year lows and we see it as a cheap option. We keep our preference for US versus Europe — while there is certainly uncertainty around the upcoming US elections, this is well telegraphed and it appears to us that upcoming European elections provide greater uncertainty.
This report was excerpted from, CD Player, June 12, 2024
2024 Municipal Mid-Year Outlook
Playing the long game for longer
- We are broadly comfortable continuing the narrative from our 2024 Outlook (‘Playing the long game’), in which we expected that the Fed would shift from a tightening bias to easing in 2H24. Specifically, we hold the view that “finding stability while navigating the end of the tightening cycle may be difficult. We suggest playing the long game, and buying municipal bonds with a longer term perspective, in periods where Treasuries sell-off. We believe that bouts of illiquidity should be viewed as an opportunity to add idiosyncratic risk, given that a cycle turn is in the offing.” We highlight that prices will be particularly vulnerable in September/October, given an expected spike in supply as issuers look to avoid election-related market volatility amid a period of low reinvestment capital.
- Both the slowing economy and election supply technicals should drive solid performance and slightly tighter spreads by year-end, as capital continues to chase yield. While timing of the first ease remains elusive, it should drive a sustained bull steepening of the curve and lead to inflows across municipal fund complexes, thus driving demand for duration, off-the-run structures (short-calls, discounts, housing, AMT, etc.), as well as BBB and high-yield bonds.
- November/December 2023 performance of 8% on the Bloomberg IG Municipal Index pulled forward much of expected 1H24 performance into 2023, but we remain confident that a Fed ease is in the foreseeable future (currently forecast for November). This informs our expectation for positive returns over 2H24.
- We project average total returns of ~3.30% across the IG curve (5% cpn current structure) for the balance of 2024, with average returns in AAA 2.95%, AA 3.05%, A 3.65%, and BBB 4.30%. The expected return curve is reasonably flat, with modest outperformance in 7-10yrs (3.50%), 16-19yrs (3.50%), and 27yrs and longer (3.65%).
- We revise our original full-year gross issuance forecast higher by 15% to $460bn (from $400bn), or 25% above full-year 2023. Tax-exempt supply of $410bn would be ~25% above 2023 ($327bn). Our forecast of taxable volume is unchanged at $50bn, which would be 35% above the $37bn of taxable volume in 2023, but still 50% lower than trailing five year average.
- Continued strength in the labor market, broadly favorable consumer fundamentals, moderating inflation, and strong home price appreciation, generally point to continued stable credit conditions in the municipal market in 2H24 and 2025.
- States are in a sound position ahead of a forecasted modest economic slowdown. State spending growth is expected to moderate from record levels as one-time spending of surplus funds abates, in a return to a more typical budget environment. Rainy day funds remain at or near record highs and while state unemployment rates have increased this year, they remain generally low by historical standards.
- Within the context of benchmark and peer group weightings, we broadly expect outperformance in idiosyncratic sectors of the market. Please see additional bulleted recommendations herein, under Summary of recommendations.
2024 Municipal Mid-Year Outlook Summary
Tax-exempt Munis: Entering 2H24, the first sentence in our 2024 outlook remains appropriate: “Finding sustained market consensus while navigating the end of the tightening cycle may be difficult… which is why we suggest playing the long game, and buying municipal bonds with a longer term perspective, particularly in transitory periods where Treasuries sell-off on episodic data releases that suggest stronger inflation, growth, or employment data.” Election-related supply technicals are expected to impact tax-exempt rates and spreads intermittently as well. We suggest adding idiosyncratic municipal risk on market weakness, given the expectation that it will become very difficult to source risk once open-end fund flows turn positive.
While market weakness could manifest for any one or combination of reasons, including a rates market sell-off, fund outflows, intermittent heavy supply weeks, or some systemic credit event, we highlight that prices may be particularly vulnerable in the September - October period, amid low reinvestment and given an expected spike in issuance as issuers look to avoid election-related market volatility. As is often the case, end of cycle dynamics may sustain volatility longer than expected, but we believe that a cycle turn is in the offing and that these bouts of illiquidity should be viewed as an opportunity.
U.S. Economics: We expect growth will continue to moderate in 2H24, with a 1.0% average growth pace for the remainder of the year, following ~1.75% growth in 1H24. Core PCE has moderated from 2.9% at the start of the year to 2.6% with fundamental drivers such as slowing wage inflation and anchored consumer and business inflation expectations aligning with around the Fed’s 2% inflation target. We expect the Fed will cut rates at the November FOMC meeting and continue at a quarterly cadence in 2025. We see risk of an earlier ease at the September meeting if any of the next three labor market reports show material weakening in hiring (link).
Figure 262: U.S. economic forecasts
| Actual | Forecasts | ||||||||
| %q4/q4 | |||||||||
| 1Q24 | 2Q24 | 3Q24 | 4Q24 | 1Q25 | 2Q25 | 2023 | 2024 | 2025 | |
| Real GDP (%q/q, saar) | 1.3 | 2 | 1 | 1 | 2 | 2.3 | 3.1 | 1.3 | 1.9 |
| Real consumer spending (%q/q, saar) | 2 | 2 | 1.1 | 1.1 | 1.2 | 1.5 | 2.7 | 1.5 | 1.3 |
| Core PCE prices (%q/q, saar) | 3.6 | 3 | 2.4 | 2.1 | 2.1 | 2.1 | 3.2 | 2.8 | 2.1 |
| Unemployment rate (%, qtr avg) | 3.8 | 4 | 4 | 4.1 | 4.1 | 4.1 | |||
| Fed funds target (%, eop, top of range) | 5.5 | 5.5 | 5.5 | 5.25 | 5 | 4.75 | |||
Source: J.P. Morgan
U.S. Rates: Our rates team posit that the market’s Fed expectations remain the dominant driver of Treasury yields, and likely will be the key factor in determining the direction of travel over 2H24. We forecast a 25bp cut in November, followed by a quarterly cadence of cuts. It remains likely this easing cycle will be shallower and perhaps more closely resemble the 1995 and 2019 easing cycles rather than the aggressive easing cycles during the 2001 recession and the GFC in 2007-2008. We believe there is still room for yields to decline. We forecast yields biased somewhat higher through the summer as markets push back on the expected timing of the first cut, but then declining again in the fall as the first ease approaches, with the curve bullishly steepening in the process (link).
Our rates team expects a modest changes to rates by year-end as yields have rallied ~30-40bps from YTD highs on slowing inflation/growth and they anticipate considerable supply. Specifically, they look for 2yr-5yr yields to fall a modest 12-8bps to 4.60% and 4.25%, respectively. In the longest portions of the curve, 10yr-30yr Treasury yields are projected to rise slightly by ~6-10bps, to 4.40% and 4.60%, respectively.
Given the above economic and rate forecast, we project significant ratio compression by year-end with 2yr-5yr muni AAA HG yields projected to fall by ~40-35bps to 2.70% and 2.55%, respectively. In the longest portions of the curve, 10yr-30yr AAA rates are projected to rally by ~15-25bps to 2.60% and 3.35%, respectively ( Figure 263).
Figure 263: We project significant ratio compression by year-end with 2yr-5yr muni AAA HG yields to fall by ~40-35bps to 2.70% and 2.55%, respectively. 10yr-30yr AAA rates are projected to rally by ~15-25bps to 2.60% and 3.35%, respectively
| Rates (%) | Actual | Forecasts | ||||
| 6/28/2024 | 1mo ahead | 3Q24 | 4Q24 | 1Q25 | 2Q25 | |
| Treasury | ||||||
| 2yr | 4.70 | 4.70 | 4.75 | 4.60 | 4.30 | 4.05 |
| 5yr | 4.32 | 4.30 | 4.40 | 4.25 | 4.00 | 3.80 |
| 10yr | 4.33 | 4.35 | 4.50 | 4.40 | 4.20 | 4.00 |
| 30yr | 4.51 | 4.50 | 4.65 | 4.60 | 4.50 | 4.35 |
| AAA Tax-exempt | ||||||
| 2yr | 3.11 | 3.05 | 3.15 | 2.70 | 2.60 | 2.40 |
| 5yr | 2.89 | 2.80 | 2.95 | 2.55 | 2.40 | 2.25 |
| 10yr | 2.84 | 2.75 | 3.00 | 2.60 | 2.50 | 2.35 |
| 30yr | 3.72 | 3.65 | 3.90 | 3.55 | 3.50 | 3.35 |
| AAA / TSY Ratios | ||||||
| 2yr | 66% | 65% | 66% | 59% | 60% | 59% |
| 5yr | 67% | 65% | 67% | 60% | 60% | 59% |
| 10yr | 66% | 63% | 67% | 59% | 60% | 59% |
| 30yr | 82% | 81% | 84% | 77% | 78% | 77% |
Source: Refinitiv, J.P. Morgan
We project average total returns of ~3.30% across the IG curve for the balance of 2024. We suggest adding to duration, off-the-run structures (short-calls, discounts, housing, AMT, etc.), and lower BBB & HY, before the Fed eases and bull steepening takes hold
In our 2024 Municipal Market Outlook, we projected outperformance for long duration, BBB and HY munis. This forecast is tracking as expected as since the release of our report on 11/21/23, Bloomberg’s Long (22yr+) municipal index has bested the Bloomberg’s IG index by ~270bps in total return, and the BBB and HY indices have outperformed the IG benchmark by about 250bps and 580bps, respectively. Please see detailed performance comparisons of a comprehensive set of our 2024 recommendations further down.
For the balance of 2024, we forecast total return performance of generic investment-grade 5’s to average ~3.30%, with reasonably flat returns across the curve. We expect modest outperformance in 7-10yrs (3.50%), 16-19yrs (3.50%), and 27yrs and longer (3.65%) on the curve. The market’s still-mixed view around the first Fed rate cut will likely ensure continued volatile markets around the release of non-consensus data, suggesting that investors should keep close to their benchmark and peer group allocations.
Figure 264: For the balance of 2024, we forecast total return performance for generic 5’s to average at 3.30%, with outperformance in 7-10yr (3.50%), 16-19yrs (3.50%), and 27yrs and longer (3.65%) on the curve
Total return forecast for 2H24, bps

Source: Refinitiv, Bloomberg Finance L.P., J.P. Morgan. Note: Returns expected between 6/28/2024 and 12/31/2024. The returns are based on 5% coupon new issue structure (non-callable out to 10yrs and 10yr call thereafter).
The A and BBB portions of the market should continue to outperform with an expected return of 3.65% and 4.30% for 5’s. Given flat curve performance and roll characteristics, we would overweight 13-17yr A and BBB rated bonds, and add higher beta assets on weakness. Please see consolidated Yield/spread additive recommendations for a more complete listing.
Figure 265: The A and BBB portions of the market should continue to outperform with expected return of 3.65% and 4.30% for 5’s
Total return forecast for 2H24,bps

Source: Refinitiv, Bloomberg Finance L.P., J.P. Morgan. Note: as of 6/24/2023. Returns between 6/25/2024 and 12/31/2024. The returns are based on 5% coupon and new issue bonds (non-callable or years to call similar to 10yrs)
Another way to determine curve positioning using a longer term purview, is to look at trailing three-year roll. Based on generic 5% AA muni trade data, the largest 3yr roll-down was observed in the 15yr area (13-15yr bonds) of the curve, with 25bps of spread to 13yr AA bonds. We also find sizable 3yr roll extending the period out somewhat, in 15-17yrs on the curve. This lines up roughly with the our 2nd half total return forecast above as well.
Identifying yield opportunities based on recent trade data: Below, we refresh our analysis of recent trade data, using transactions over 6/20/24-6/26/24. Six key takeaways: (1) Focusing first on the high-grade portion of the market, we limit the cohort of transactions to those that produce 4% or greater yield, that are AA or better rated, with 5% or higher coupons. After applying these screens, we find that 31% of the transactions that produced 4% or higher yield in this high quality cohort are AMT bonds, 25% are housing bonds, and 21% are short call bonds. This illustrates the opportunity to add yield via housing bonds, short calls, and AMT bonds while maintaining an overall higher credit rating and distribution yield.
(2) Digging deeper on short call bonds, we detail the spread-to-call and spread-to-maturity on AA or higher rated bonds, with 2-4yrs to their call date, for 4% and 5% coupon bonds. We find that the additional spread to the call earned on 4’s moving out every 5yrs on the curve is generally 20-25bps, until we hit 20yrs on the curve. While the highest spread to the call on our cohort of 4% coupon short-call bonds is in 20yrs+ on the curve, at 112bps, this is only 2bps above the spread to call (110ps) on 16-20yr bonds. This suggests buyers of short-call 4’s should not extend beyond 20yrs on the curve, as they are not being compensated for the added extension risk and duration.
(3) Additionally, the spread-to-maturity on short call 4’s suggests investors should not move out past 15yrs with a spread of 94bps to maturity, as the spread to maturity drops to 50bps out past 20yrs on the curve. As such, when considering both spread to call and maturity on 4’s, the optimal spread on AA or better rated 2-4yr call bonds is achieved in 11-20yrs on the curve.
(4) When looking at spread-to-call on 5’s with 2-4yrs to call, the spread-to-call tops out at 78bps in 16-20yrs on the curve, suggesting no incentive to extend into shorter call bonds in 20yrs and longer. When examining the spread-to-maturity on these short-call 5’s, the spread-to-maturity peaks in 11-15yrs at ~55bps. As such, when considering both spread to call and maturity on 5’s, the optimal spread on AA or better rated 2-4yr call bonds is also achieved in 11-20yrs on the curve ( Figure 266).
Figure 266: When considering both spread to call and maturity on 4’s and 5’s, the optimal spread on AA or better rated 2-4yr call bonds is achieved in 11-20yrs on the curve
Spread to HG, bps
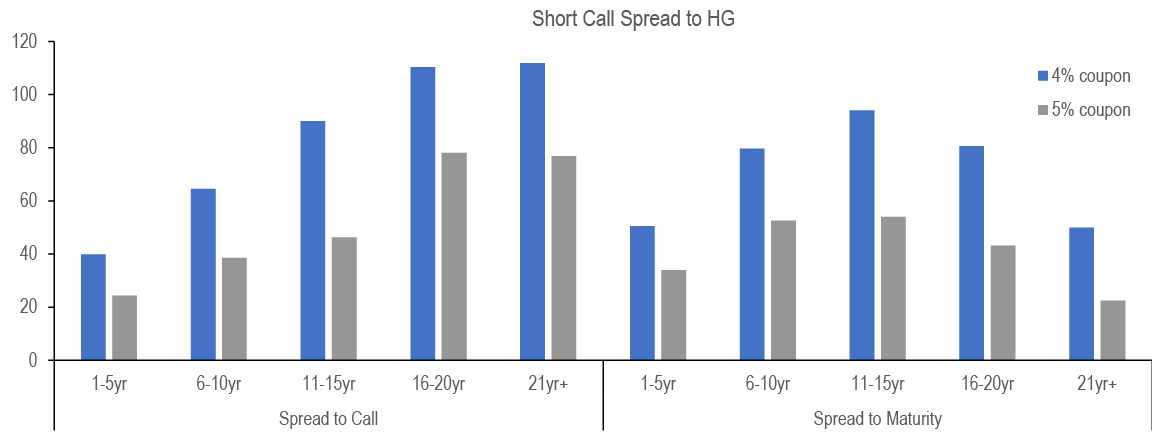
Source: MSRB, J.P. Morgan. Note: trade data from 6/20/2024 - 6/26/2024. Par value>=$500k. Tax-exempt only, Fixed coupon only, excludes health care bonds, excludes AMT bonds.
(5) Comparing the spread on current coupon housing bonds to the high-grade, we find that the spreads reach about 65bps (vs. 30bps of generic 5s) in 6-10yrs on the curve before maxing out at 115bps in 11-15yrs (vs. 25bps of generic 5s), before flattening out at about 100bps in 16yrs and longer on the curve.
Figure 267: Based on trade data, current coupon housing bonds provide spread pick up of 35-90bps over generic 5% coupon
Spread to HG, bps

Source: MSRB, J.P. Morgan. Note: trade data from 6/20/2024 - 6/26/2024. Par value>=$500k. Tax-exempt only, fixed coupon only, exclude health care bonds, exclude AMT bonds.
(6) Similar to the spread analysis on the sectors above, a concentration of max yield buyers in the longest portions of the curve drive spreads tighter as we move out from the 15yr area of the curve. As such, trade data indicates that coupon spread of 4s over 5s tops out in 11 to 20yrs at ~36-39bps. Thus far this year, long dated 4s have lagged the IG benchmark performance, but we expect 4% coupon bonds will catch up in 2H24 as we see lower base municipal market yields and better fund flows.
Figure 268: Thus far this year, long dated 4s have lagged the IG benchmark performance, but we expect 4% coupon bonds will catch up in 2H24 as we see lower base municipal market yields and better fund flows
Spread to HG, bps

Source: MSRB, J.P. Morgan. Note: trade data from 6/20/2024 - 6/26/2024. Par value>=$500k. Tax-exempt only, fixed coupon only, exclude health care bonds, exclude AMT bonds.
Consolidated Yield/spread additive recommendations
- Based on generic 5% AA muni trade data, the largest 3yr roll-down is observed in the 15yr area (13-15yr bonds) of the curve, with 25bps of spread to 13yr AA bonds. We also find sizable 3yr roll extending the period out somewhat, in 15-17yrs on the curve.
- Trade data suggest that yield oriented investors barbell curve exposure, as AA 5% coupon generic yields in 1-4yrs are ~3.15%, before dropping into the belly of the curve out to 10yrs (3.00%), while steepening in 13-30yrs with yields ranging from ~3.10%-3.90%.
- AMT spreads will likely not rally consistently until open-end funds experience sustained inflows. Corporate investors and other buyers who are not substantially impacted by AMT, can enjoy the current ~50bps of spread on AA AMT airport bonds versus non-AMT airports (AMT and Housing Bonds, 6/14/2024).
- Housing bonds produce the highest yields in 10yrs and longer on the curve, even besting 3s, 4s, AMT, and healthcare bonds. Based on trade data, discount housing bonds provide spread pick up of 35-90bps over generic 5% coupon. Additionally, when examining recent AA or better trades above 4%, we find opportunity to add yield via housing bonds, short calls, and AMT bonds while maintaining an overall higher credit rating and distribution yield (see herein and Universe of 4% Yielding Trades, 5/10/24)
- We recommend AA or better 4s at a discount in 2040 through 2043, for spread (40-45bps vs 5s) and roll-down.
- Based on a 21% tax rate, the taxable equivalent yield for 30yr AA 4% tax-exempts provides 19bps of spread pick-up over similar term corporates (06/28/2024 Muni Morning Intelligence). Life and P&C insurance can also achieve spread pick up ~15bps over similar maturity corporates for 30yr AA 4%.
- Short-call 5s provide the most spread to call of 78bps in 16-20yr maturities with calls from 2-4yrs. See full spread matrix within and our more detailed report (Add Duration/Credit, Barbell Curve, Short Call, 4/5/24).
- Investors can take advantage of wider new issue market spreads versus the secondary market: equal to an average of ~13bps in the intermediate portion of the curve. However, this has not proven true in the long-end of recent deals (Historic Supply, Cheaper/Less Inverted Curve, New Issue vs. Secondary Spread, 5/31/24).
- Data suggests that investors can achieve significant spread benefit selling larger blocks (which trade at tighter spreads) versus multiple smaller offerings (which trade wider). For example, in 3yrs and shorter on the curve, 0-$10k customer sell transactions averaged a spread of 63bps, with spreads trending consistently tighter for sales as trade size rose, hitting a low of 12bps for sales of $5mn+ (Barbell Strategy, Spread and Trade Size , 4/26/24).
- Outside-of-deminimis long-dated AA 3s present a solid after-tax total return opportunity, at an 80bps spread to generic 5s. The Constant Yield method assumes a lesser accretion in the early years of holding these bonds, and therefore lower ordinary income tax if bonds are sold in these early years. (see discussion on tax consequences here: After tax returns on 3-4-5% cpns, 3/1/24).
- A comprehensive analysis of yields and spreads across 39 sectors on the curve shows that absolute yields are at lower half of the 1-year range and the upper quartile of the 5-year range (see herein). AMT, AA housing, healthcare, TX, and A healthcare, higher-education present wider spreads, meanwhile liquid HY names are trading relatively rich vs. 5-year average.
Credit fundamentals
- Continued strength in the labor market, broadly favorable consumer fundamentals, moderating inflation, and strong post-pandemic home price appreciation generally point to continued stable credit conditions in the municipal market in 2H24 and 2025. And while state unemployment rates have increased this year, this is generally relative to record lows reached or neared in 2023.
- States are in a sound position ahead of a forecasted modest economic slowdown: State spending growth is expected to moderate from record levels as one-time spending of surplus funds abates, in what is a return to a more normal budget environment. Rainy day funds remain at or near record highs.
- State and local tax revenues: Tax receipts showed continued strength in 1Q24 despite widespread state tax cuts. Sales tax growth is decelerating but remains positive, in line with inflation, and property taxes continue to reflect benefit from strong post-pandemic growth in home prices. Looking forward, a forecasted modest economic slowdown suggests stability with limited upside potential for S&L tax receipts, which have seen strong growth in recent years. We expect continued declines in individual income tax receipts in 2H24 and 2025 given widespread state tax cuts, and therefore expect careful budgeting will be of heightened importance.
- A key theme across higher ed and health care, and appears to be emerging in charter schools, is divergence in credit quality, with already weaker-positioned issuers under pressure, while issuers with stronger financial resources are maintaining or strengthening their positions. We expect this trend to continue into 2H24 and 2025. While defaults are rare, downgrade risk has been material in these sectors, warranting increased credit scrutiny, in our view. Digging deeper into credit divergence by sector:
- Higher ed: Our analysis of Moody’s MFRA data found that downgrades over Jan 2023-Mar 2024 were disproportionately concentrated in institutions that were (1) private, (2) small (whether public or private), and (3) had relatively sharper enrollment declines. Looking forward, covenant violations are on the rise, with most of the schools reporting violations in the BBB or speculative-grade rating categories, S&P reported this month. And demographic projections suggest to us that universities already experiencing sustained enrollment declines will likely continue to see their student population shrink over time. We favor: larger institutions with resilient enrollment trends, out-of-state draw, and good revenue diversity, with limited reliance on tuition (a copy of our full analysis is here).
- Health care: Fiscal 2023 financial results varied widely by issuer, according to rating agency reports published this spring. In 2023, downgrades were seen across provider types but biased towards stand-alone credits (36) vs. systems (21). Downgrades were most prevalent in credits rated BBB+ prior to the time of action (11), followed by A and A+ (8 each). Covenant violations increased in 2022 and 2023, with the majority of breaches from providers rated BBB or below. Looking forward, while many providers are on a path to recovery, negative outlooks remain near a historical peak, and covenant violations are likely to continue for already weaker-positioned issuers, according to S&P. We favor: larger, diversified systems in demographically favorable regions, with good market position and balance sheet strength.
- Charter schools: Financial performance has been generally solid, supported by federal pandemic aid. Looking forward, federal pandemic aid sunsets in Sep 2024, if not already exhausted. A divergence in credit quality could follow, with schools that have used the funds for one-time needs better positioned than schools that have relied on the stimulus for recurring expenses. We favor: larger, more established credits that have an added level of due diligence (ie. are rated), high academic standards, and location in states with a supportive regulatory environment and favorable demographic trends (a copy of our two-part update can be found here and here).
- A compilation of our sector work in 1H24 can be found here.
2024 Municipal sector performance
Backtesting our 2024 views, we find broad outperformance versus Bloomberg’s IG Municipal Index. The period covers YTD performance as of 06/26/2024. As shown in the Figure 269 below, most of our views (indicated by green bars) have outperformed the Bloomberg Index, save for NY and TX bonds.
In the short-end of the curve, we recommended AMT bonds through 2028, and 5% coupon short calls; IG 3yr AMT bonds have outperformed the IG 3yr index by 73bps, meanwhile, short call 5s (2-4yrs to call and 17-22yr maturity) have outperformed IG 3yr by 67bps ( Figure 270). Moving to the long end, our recommendation of long 4s has lagged 5s by ~130bps thus far into the year, given the extended Fed pause. We believe this presents an opportunity for investors now, before strong summer reinvestment capital hits the market and ahead of the anticipated first Fed cut in November ( Figure 271).
On average, our recommendations have outperformed the index by 100bps, with the BBB recommendation (+160bps) and HY recommendation (+460bps) outperforming by the largest margins and the TX recommendation (-30bps) and NY recommendation (-10bps) lagging the most. The Housing sector has also outperformed the IG muni index by 50bps in 1H24.
Figure 269: On average, the recommendations have outperformed the index by 100bps, with the BBB recommendation (+160bps) and HY recommendation (+460bps) outperforming by the largest margins
YTD return, %

Source: Bloomberg Finance L.P., J.P. Morgan. Note: as of 6/26/2024. Benchmark is Bloomberg Muni Index (LMBITR).
Figure 270: IG 3yr AMT bonds outperformed IG 3yr index by 73bps, meanwhile, short call 5s (2-4yrs to call and 17-22yr maturity) outperformed IG 3yr by 67bps
YTD return, %
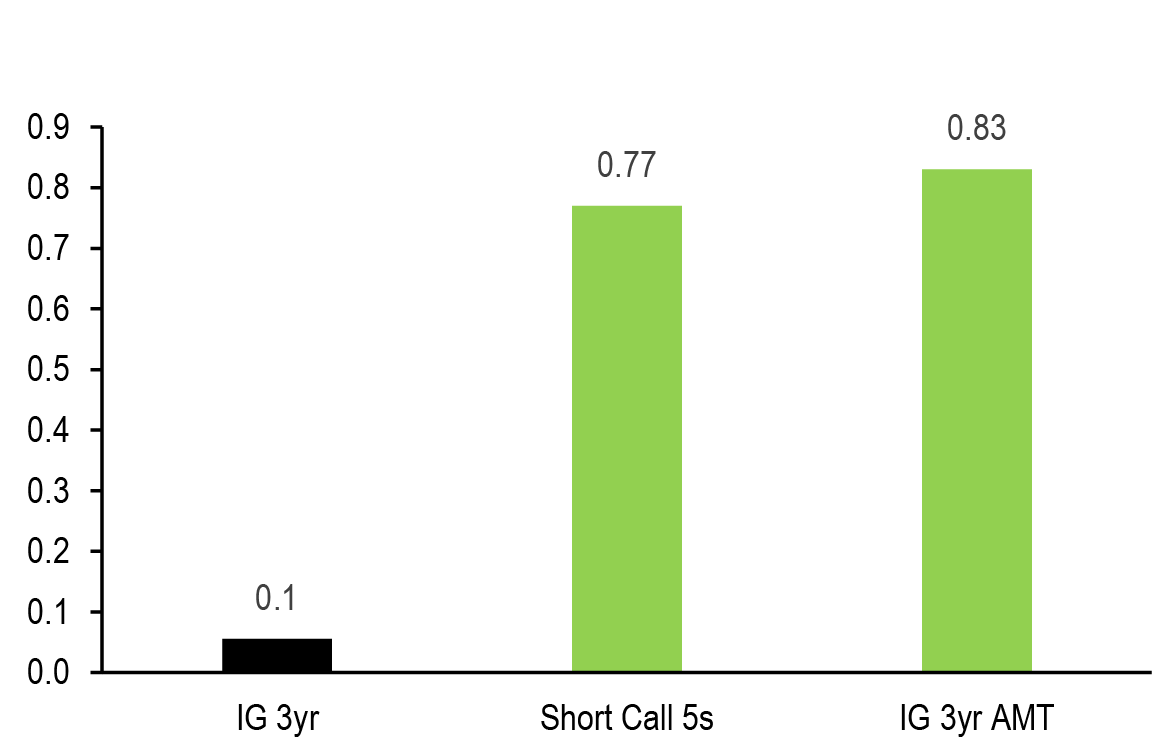
Source: Bloomberg Finance L.P., J.P. Morgan. Note: as of 6/26/2024
Figure 271: Moving to the long end, our recommendation of long 4s lagged 5s by ~130bps thus far , while this presents an opportunity for investors
YTD return, %
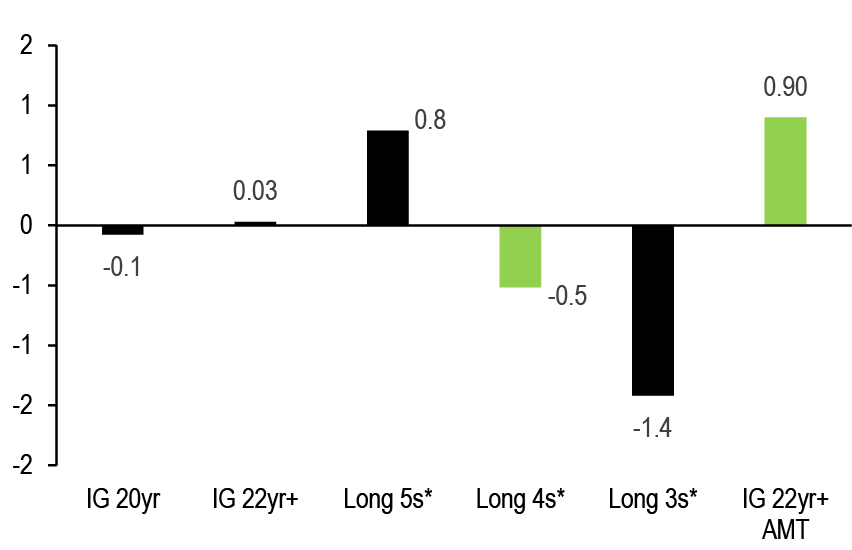
Source: Bloomberg Finance L.P., J.P. Morgan. Note: as of 6/26/2024
The presidential election comes into focus
Yesterday’s Biden-Trump debate further brings into focus the implications of the November US presidential election. Naturally, markets will be focused not just on who wins the presidency but the makeup of congress, which will dictate how much of the new president’s agenda is likely to be achieved. In Figure 272 below, we provide municipal market context on each candidate’s policy intentions taken from information on campaign websites, public comments, press reports, and other publicly available sources, as well as sector-specific JPM research.
A full copy of our 2024 election work can be found here.
Figure 272: Potential municipal market impacts of each candidate’s policy goals
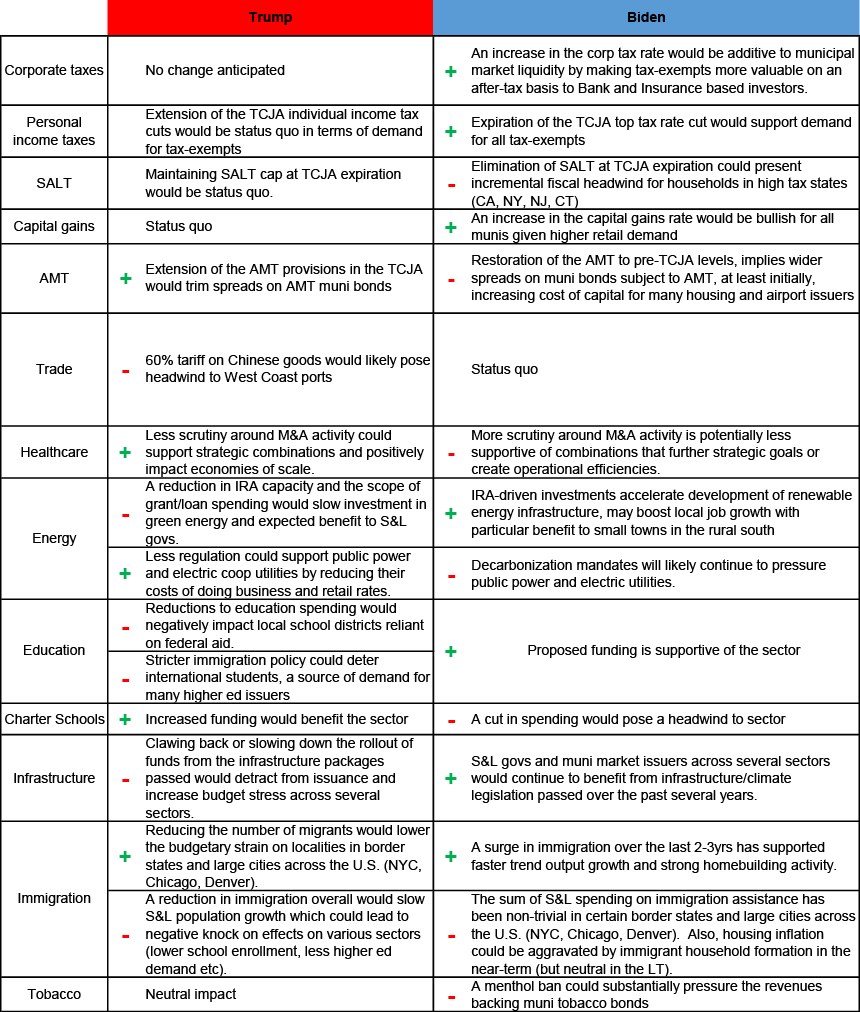
Source: Campaign websites, public comments, press reports, S&P, sector-specific JPM research reports, J.P. Morgan
We revise our full-year issuance forecast higher by 15% to $460bn, with tax-exempt supply of $410bn and $50bn in taxable/corporate cusip issuance
This year's 1H24 leap in primary market volume is a function of lower tax-exempt borrowing costs vs. taxable fixed-income rates, and front loading in an election year. We are revising our full-year supply forecast higher by 15% to $460bn (from $400bn expected previously), accounting for unanticipated BAB ERP calls ($8.4bn), as well as higher-than-expected increases in health-care (~2x of 5yr avg), gas prepays (~2.1x of 5yr avg) and higher-education (~2.3x of 5yr avg) issuance in 1H24 (YTD sector supply analysis, 5/17/2024).
We now project full year tax-exempt issuance of $410bn, with $50bn taxable/corporate cusip issuance. Total supply at this level would be 26% higher than 2023 volume ($364bn) and 6% above the trailing five-year average ($434bn). Expected higher tax-exempt issuance ($410bn) would be 25% above 2023 ($327bn) and 23% above the trailing five-year average ($333bn). Taxable supply ($50bn) would be 35% above the $37bn taxable supply in 2023, and half of the five-year average of $100bn. With intermediate municipal high-grade yields projected to fall ~15bps from now to year end, BAB ERP refundings should persist and there should be continued appetite for capital in advance of the election in November.
This level of full year issuance implies 2H24 tax-exempt issuance of $196bn, which would be 10% above 2H23 ($178bn) and 12% above the trailing five-year average ($175bn). 2H24 taxable supply of $25bn is expected to be 19% above 2H23 ($21bn), while 57% of the five-year second-half average of $58bn.
Figure 273: We are revising our full-year forecast higher by 15% to $460bn, with tax-exempt issuance of $410bn and $50bn taxable/corporate cusip issuance
Gross issuance, $bn

Source: Bloomberg Finance L.P., J.P. Morgan. Note: Corporate CUSIP included
Based on our new forecast, 2H24 tax-exempt issuance would be 12% higher vs. the average of prior comparable election years and 14% higher vs. the non-election year average over 2001-2023 (see footnote for exclusions). Note that we anticipate November’s issuance will be ~25% below the election year average due to the stark policy differences between the candidates, elevated election uncertainty, as well as an expected increase in the pull-forward in this year’s election.
Figure 274: Based on our revised forecast, for 2H24 tax-exempt issuance would be 12% higher vs. prior election year average and 14% higher vs. prior non-election year average. We anticipate far lower issuance in November due to the stark policy differences between the candidates, elevated election uncertainty, as well as an expected increase in the pull-forward in this year’s election
Tax-exempt monthly supply, $bn

Source: Bloomberg Finance L.P., J.P. Morgan. Note: Election years represented by 2004, 2012, and 2016. Non-election years are 2001-2023, excluding 2004, 2008, 2010, 2011, 2012, 2016, and 2020.
Our forecast for net-supply over 2H24 has also changed, while remaining unchanged in July and August, September and October have shifted less supportive in the period, and more supportive after the election in November and December. In July and August, we continue to expected a somewhat less supportive than typical -$17bn in net negative supply, versus -$24bn in 2023 and a 5yr average of -$26bn. That said, with ratios in a tradable range entering July, we still anticipate market outperformance over the period. We caveat that even given this technical tailwind, the direction and magnitude of rate change in the UST market will be essential to ETF flows and relative performance over the period.
The liquidity environment in September-October is expected to be particularly challenging again in 2024, with +$24bn in net supply, versus +$10bn in 2023 and a 5-year average of +$11bn. This would suggest that the market is again susceptible to a sell-off like those experienced each year dating back to 2015. In 2023, the 10yr municipal/UST ratios hit its cheapest level for the year near the end of September (75.5%), and ended October 2.4 percentage points cheaper than when the year began.
In November and December 2024, net supply is expected to be -$11bn, similar to the -$12bn in 2023, as the prospect of potential election related volatility should limit November new issue volume. We believe that the more-supportive liquidity and lesser supply will set the market up to perform well through year-end, particularly if the Fed eases in November and a scenario where assets cheapen in the fall.
We again caveat that market technicals are easily overwhelmed by fund flows, and a sizable inflow/outflow cycle would drive the market narrative, despite net-supply conditions. This has been especially true since 2018, when TCJA lowered tax rates and lessened the consistency of corporate buyer participation in the tax-exempt market. As such, abrupt increases/decreases in rates have resulted in steep price decreases/increases, with the resulting outflow/inflow cycles overwhelming the influence of net supply. Note that other factors, such as absolute rates and the relative attractiveness of alternative investments, also play a sizable role in municipal market liquidity.
Figure 275: We believe that the more-supportive liquidity and lesser supply will set the market up to perform well through year-end, particularly in a scenario where assets cheapen in the fall.
Net supply, $bn
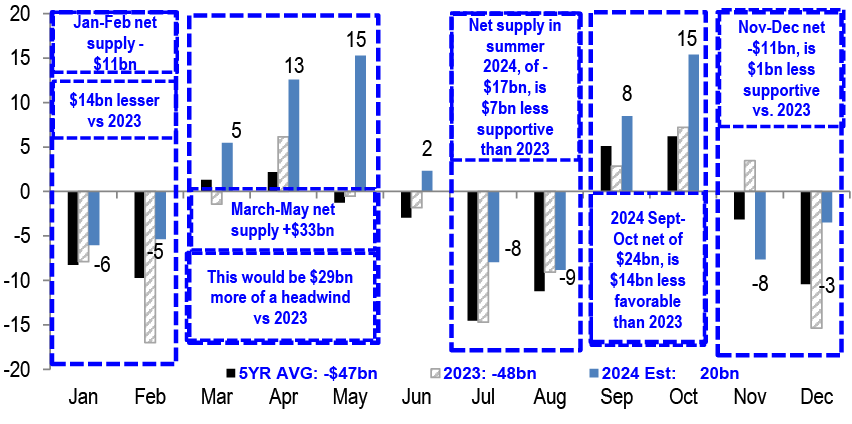
Source: Bloomberg Finance L.P., J.P. Morgan
The Fed-on-hold for longer has delayed a more pronounced turn in fund flows, but we look for momentum to pick up in 2H24
Thus far in 2024, the close on the 10yr UST yield has ranged ~82bps ,from 3.88% to 4.70%, similar to the 83bps range (2.28% to 3.11%) on the 10yr HG. Against this volatile rates backdrop, LSEG Lipper’s aggregate YTD fund flows finally turned positive after historic outflows in 2022 (-$122bn) and modest outflows in 2023 (-$9.9bn). In our 4/19/2024 publication, we found that the direction and magnitude of change in HG yields over a three-month period, has predictive power over the direction and magnitude of open-end fund flows, while ETFs are better correlated to weekly change in HG yields.
Looking forward, if our call for the first Fed cut in November is realized along with expected municipal outperformance from a dearth of supply in November and December, we project fund flows will improve around year-end 2024 ( Figure 276).
Figure 276: Given our call for a first Fed cut in November and expected municipal outperformance from a dearth of supply in November/December, we project fund flows will improve around year-end 2024
Monthly fund flow, $bn(left axis) 10yr UST yield, % (right axis)

Source: LSEG Lipper Global Fund Flows, J.P. Morgan. Note: as of 5/31/2024. Data is on monthly basis.
The 2023 trend of capital shifting from short-term funds into long-term and high-yield funds has continued in 1H24. Specifically, YTD all-term muni fund inflows (+$11.4bn) are comprised of inflows into LT funds (+$14.1bn/+$12.5bn of which is HY), and outflows from short/intermediate funds (-$3.6bn) ( Figure 277).
Figure 277: The trend of capital shifting from short-term funds into long-term and high-yield funds has continued in 1H24
YTD fund flow, $bn

Source: LSEG Lipper Global Fund Flows, J.P. Morgan. Note: Figures shown on this table are combination of weekly and monthly reporters. Data refreshed on 6/27/24 at 2pm. Includes all weekly and monthly flows recorded to date. Data may be updated in future business days of the month.
Municipal ETF AUM accounts for 14% of total municipal fund AUM as of May 2024, unchanged from YE23 as both open-end funds and ETFs have received inflows. We find this year’s volume of ETF flows is 28% of total combined open-end and ETF flow volume, when looking at the total capital moving in and out of funds this year (represented by the green bars in Figure 278), down from 2023 (47%), but still the 2nd highest in history. We also note that the correlation between ETF flows and mutual fund flows remained negative (-50%) in 2024, as the pace of tax swapping continued.
Figure 278: Municipal ETF AUM accounts for 14% of total municipal fund AUM as of May 2024, unchanged from end of 2023 as both open-end funds and ETFs received inflows. This year’s ETF flows were 28% of total of open-end and ETFs, down from 2023 (47%)
ETF flow and AUM as of total funds, % (left) and ETF and mutual funds monthly flow correlation in each year, % (right)
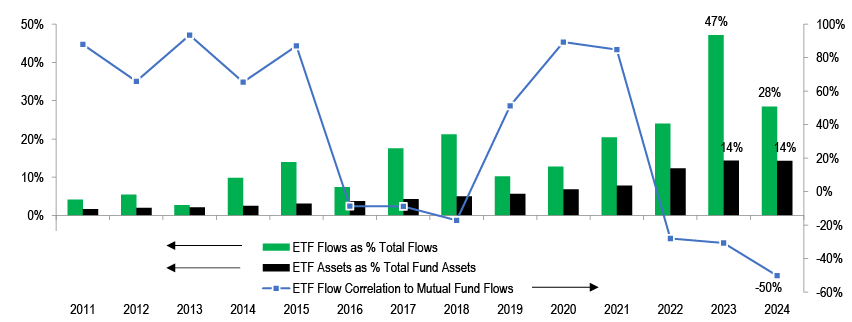
Source: LSEG Lipper Global Fund Flows, J.P. Morgan. Note: as of 5/31/2024. 2024 correlation was calculated using trailing 12 months data.
Looking forward, we expect municipal ETFs will continue to gain market share, based on their current growth trajectory and the product’s historical pace of growth in other asset classes. ETFs were first introduced to the municipal market in 2007, well after the 1993 equity and 2002 taxable fixed-income ETFs were launched. Adoption of municipal ETFs has largely tracked that of the equity and taxable fixed-income markets, which saw ETFs as a share of AUM grow to 14% and 18% over the first 17 years of their product history, respectively (versus 14% for municipals).
Today, in their 31st/22nd year, equity ETFs represent 35% of total equity fund AUM, and fixed-income ETFs have grown to 29% of total fund assets. This dramatic growth suggests substantial room for municipal ETFs to expand their share of the fund universe ( Figure 279). It is worth noting, municipal ETF fund flows are highly concentrated, with the two largest fund complexes comprising 86% of all YTD inflows.
Figure 279: Muni ETFs started in 2007, with AUM growing to 14% of total fund assets over the past 17 years. The trajectory of ETF growth in the equity and broader fixed-income markets, suggest considerable room for growth going forward
ETF AUM as of entire funds AUM, %

Source: LSEG Lipper Global Fund Flows, J.P. Morgan. Note: as of 5/31/2024
Links to our past ETF work: A copy of our detailed analysis on ETF trade pattern statistics can be found here (7/14/23). A copy of our analysis on spread pick up on non-ETF index eligible bonds over ETF eligible bonds can be found here (5/3/24) and here (4/26/24).
Absolute yields are at the lower half of the 1yr range and the upper quartile of the 5yr range. AMT, AA housing, healthcare, TX, A healthcare, and higher-ed present wider spreads, meanwhile liquid HY names are trading relatively rich vs. 5-year average
In the charts below we show the absolute yield and sector spreads on 39 sectors across the tax-exempt market. Naturally, yields are well off the wides of late October 2023, but rates across the AA sectors are still 1.1-1.2 sigma cheap to the five-year range.
Put another way, absolute yields across the AA area of the market are in the lower half of the 1-year range and the upper quartile of the 5-year range. Among the 10yr AA sectors in our analysis, we find over 3% yields on Housing, Healthcare, Higher Ed, and Texas bonds. In 10yr A-rated bonds, sector yields average 1.1 sigma above the five-year range. Interestingly, the GO sector shows the second highest yield at 3.35%, which was pushed higher by the 3.58% yield for Illinois GOs. Moving down in credit, the 10yr BBB yield (3.85%) is 0.9 sigma above the five-year average.
In 30yrs on the curve, AA sector yields average 0.9 sigma above the five-year average. Among AA sectors, Housing (4.54%), Healthcare (4.13%), and Texas bonds (4.01%) are the top three in terms of yield. Housing bonds, however, are the closest to the 3yr and 5yr average yield (4.35%), at roughly 20bps above the 3yr and 5yr average rate. In 30yr A-rated bonds, sector yields also average 0.9 sigma above the five-year average. Among 30yr A-rated sectors, Healthcare (4.31%), Higher-Education (4.24%), and Utilities (4.16%) are the top three in terms of yield. Moving down in credit, the 30yr BBB yield (4.86%) is 0.8 sigma above the five-year average (3.91%). Still other liquid credits in the high-yield investment universe such as GS 2041 (4.38%) and Buckeyes (5.62%) hover around 0.7-0.9 sigma cheap to the five-year average.
Figure 280: Absolute yields for 39 sectors across the tax-exempt market are in the lower half their one-year trading range, but well above their five-year averages
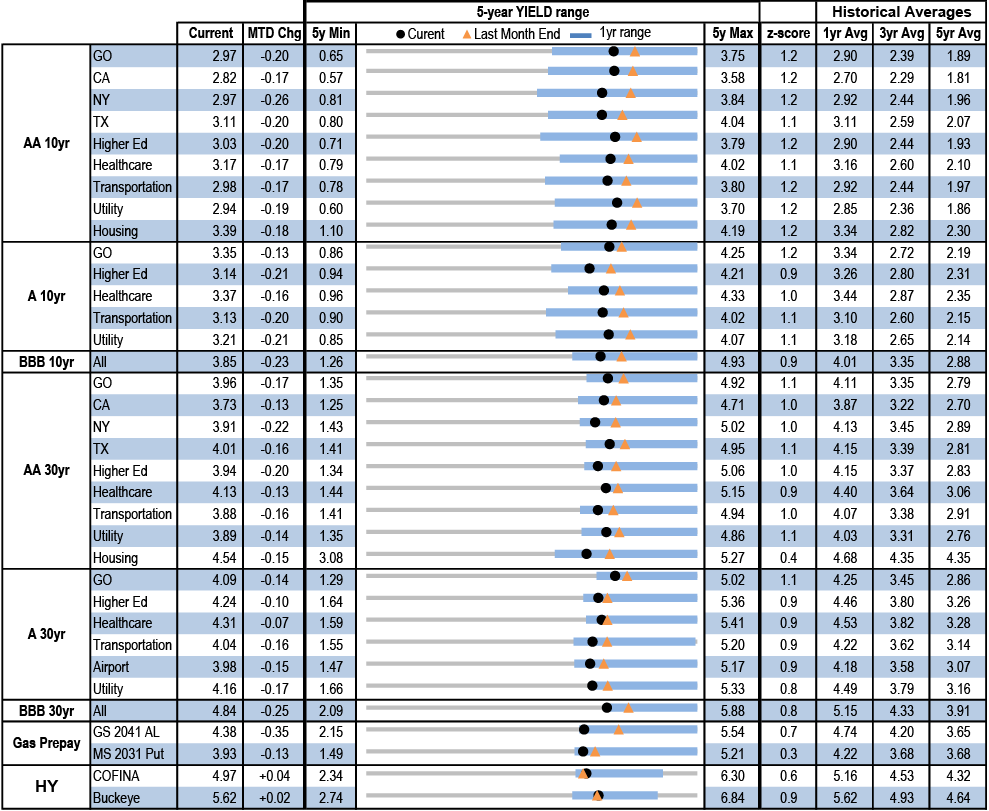
Source: ICE, J.P. Morgan. Note: 5% coupon, non-AMT, non pre-re bonds considered for the comparison. As of 6/24/2024.
Figure 281 shows the absolute spreads on 39 sectors across the tax-exempt market. Naturally, spreads have widened from the peaks in late October 2023, but 10yr spreads across AA sectors are 0.3 - 1.6 sigma cheap to the five-year average. The widest spreads were found in Housing (60bps), Healthcare (38bps), and Texas bonds (32bps). Both GO and Healthcare spreads are the widest relative to their five-year average.
In 10yr A-rated bonds, sector spreads average just 0.3 sigma cheap to their five-year average. As was the case in the yield matrix above, GO sector spreads (56bps) are second highest, pushed higher by the 75bps spreads for Illinois GOs, and just 2bps below A-rated Healthcare spread (58bps). Given the rating upgrade in 2023, 10yr IL GO bond spreads of 75bps are 0.6 sigma tight to their trailing five year average. Moving down in credit, the 10yr BBB spread, of 106bps is even with the five-year average.
In 30yrs on the curve, AA sector spreads average 0.2 sigma rich to the five-year average, with 5 of the 9 sectors shown trading through the average. Among the AA sectors, Housing (85bps), Healthcare (44bps), and Texas bonds (32bps) are the top three in terms of spread. Housing bonds, however, are the closest to the 3yr and 5yr average spreads (76bps), at roughly 20bps above the 3yr and 5yr average rate. A-rated sector spreads average 0.4 sigma rich to the five-year average, with 5 of the 6 sectors shown trading through the average. Among the A sectors, Healthcare (62bps) and Higher-Ed (55bps) are top in terms of spread. Liquid credits in the high-yield investment universe such as GS 2041 (114bps) and COFINA (128bps) are trading richest relative to their five-year average.
Figure 281: Absolute spreads for 39 sectors across the tax-exempt market
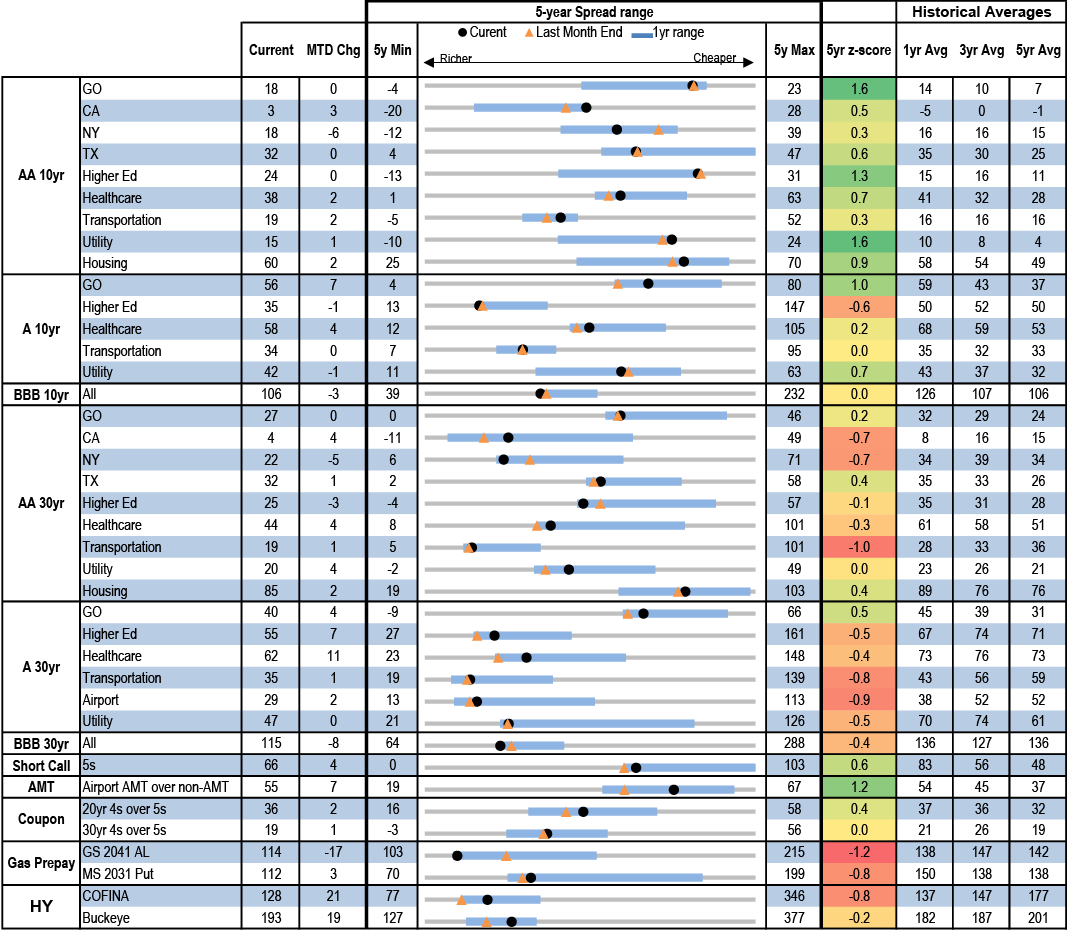
Source: Refinitiv, ICE, J.P. Morgan. Note: 5% coupon, non-AMT, non pre-re bonds considered for the comparison. As of 6/24/2024.
State and local revenues: Tax receipts showed continued strength in 1Q24 despite widespread state tax cuts. Sales tax growth is decelerating but remains positive, in line with inflation, and property taxes reflect benefit from strong post-pandemic growth in home prices
The following analysis of quarterly state and local tax receipts is based on Census Bureau data, which is not adjusted for inflation. Data referenced herein is based on not seasonally adjusted figures.
On a year-ago basis, S&L tax receipts from major sources advanced by +2.2% in 1Q24, with y/y increases in property tax (+6.0%), sales tax (+0.3%) and corporate income tax (+1.5%), but a slight contraction in individual income tax (-0.7%). This follows y/y growth of +5.6% in 4Q23 and +5.5% in 3Q, and contractions of -8.7% in 2Q and -3.1% in 1Q. Over the last twelve months, S&L tax receipts are up +0.9% y/y and up +26.8% vs. the pre-pandemic last-twelve-month (LTM) period ending in 1Q20 ( Figure 282). LTM receipts on a state-by-state basis are available in Figure 291.
Figure 282: In the last twelve months, S&L tax receipts are up +0.9% y/y and +26.8% vs. the pre-pandemic LTM period ending in 1Q20
State & local tax revenues ($mn)
| 1Q24-2Q23 | vs. 1Q23-2Q22 | vs. 1Q20-2Q19 | |
| Total major taxes | 2,031,572 | 0.9% | 26.8% |
| Individual Income | 512,952 | -8.6% | 10.0% |
| Property | 770,895 | 8.0% | 23.8% |
| Sales | 576,728 | 0.6% | 30.6% |
| Corporate Income | 170,996 | 3.3% | 137.1% |
Source: U.S. Census Bureau, J.P. Morgan. Note: LTM calculations based on quarterly nominal data. Not seasonally adjusted.
Key takeaways by major tax source:
(1) Individual income taxes (42% of total state receipts/5% of local): Individual income tax receipts declined -0.7% y/y in 1Q24, which follows an increase of +7.9% in 4Q23, declines of -0.02% in 3Q23, -27.8% in 2Q23, -21.9% in 1Q23 -12.4% in 4Q22, -4.8% in 3Q22 and increases of +14.2% in 2Q22, +22.4% in 1Q22 and +24.4% in 4Q21. This volatility is reflected in ( Figure 284). LTM individual income taxes are down -8.6% y/y but still up +10.0% vs. the LTM period ending in 1Q20. Ex-local receipts, 20 states reported y/y increases greater than 1% in individual income tax receipts in 1Q24, 19 reported y/y declines and 5 were virtually flat.
3 Key Drivers of Recent Individual Income Tax Volatility
- California: CA is the largest contributor to overall individual income tax collections (averaging 25% of total receipts over the past 5 years), so its performance - which have been volatile - influences the direction of the headline number. Individual income tax receipts in the state increased by +15.5% y/y in 1Q24 and +42.1% in 4Q23, following declines of -8.1% in 3Q23, -49.5% in 2Q23, -42.6% in 1Q23, -18.9% in 4Q22, -12.4% in 3Q22 and -2.4% in 2Q22, and increases of +21.8% in 1Q22 and +18.5% in 4Q21. This volatility is attributable to:
- Timing of collections: Tax filing deadlines were extended in CA in each 2020, 2021 and 2023, which skewed timing of what are typically highly seasonal collections. Our discussion of the impact of the 2023 deadline extension on the state’s FY25 budget can be found here (4/19/24).
- Tax base: Income tax collections in CA are highly reliant on a small group of high-income taxpayers. The tax liability of these taxpayers tends to be volatile as they earn a larger share of their total income from capital gains and stock-based compensation (link).
- State tax cuts: Since 2021, 25 states out of 41 where an individual income tax is levied have cut rates, according to the Tax Foundation. 22 of the 25 states that cut rates, or 88%, saw LTM individual income tax receipts decline y/y (avg change: -9%/median -8%), based on the quarterly Census Bureau data. States with the largest relative declines were AZ (-33%), IA (-27%) and AR (-18%).
- Worth noting, most state appear to have budgeted for these declines: According to the National Association of State Budget Officers (NASBO) Spring 2024 Survey of States (conducted over Feb-May 2024), personal income tax collections are running only 1% behind states’ budgeted estimates for fiscal 2024 (on a median basis, they are expected to decline 1.5% for the year). But there are exceptions: AZ faces a $650mn revenue gap in the current fiscal year, driven by below-forecast personal income tax performance following a series of rate cuts in recent years, according to S&P.
- SALT cap workaround: 36 states have passed laws offering an entity-level tax on pass-through entities (PTEs), according to the American Institute of Certified Public Accountants, effectively allowing for individuals who are equity owners in a PTE to indirectly deduct S&L taxes paid by the PTE beyond the $10,000 SALT cap that was established with the passage of the TCJA . PTE tax programs are designed to be revenue-neutral for states, but the complicated mix of payments, credits and refunds can take multiple years, resulting in unpredictable revenue volatility over that period. In addition, some states do not classify revenues received from PTE taxes as part of personal income taxes, instead accounting for the revenues as corporate income, according to the Tax Policy Center. The shift in where taxes are reported further complicates the ability to decipher revenue trends.
- Looking forward, in most states that have enacted a PTE tax, the tax is effective indefinitely, but several states limit the election to the tax years in which the federal $10,000 SALT cap applies (ie up until the end of 2025, under current law), while other states provide that the election provisions are automatically repealed if the federal SALT cap provisions no longer apply, according to Thompson Reuters.
(2) Property taxes (2% of total state receipts/81% of local): Consistent with strong post-pandemic growth in home prices, property tax receipts expanded for an 8th consecutive quarter with growth of +6.0% y/y in 1Q24. LTM property taxes are up 8.0% y/y and up +23.8% vs. the LTM period ending in 1Q20. For context, over the last four years, the median home price has now risen 48% ( Figure 283) (link).
- Worth noting, CRE risk has not manifested to a significant degree in top line municipal state and local tax receipts. Please see our past work on CRE here (3/11/24), here (7/7/23) and here (5/12/23), and our colleagues’ 2H24 CRE outlook here.
Figure 283: Over the last four years, the median home price has now risen 48%
Median existing home sale price: $000s, nsa (left axis), %oya (right axis)

Source: NAR, J.P. Morgan Economic ResearchNote: As of May 2024
(3) Sales taxes (42% of total state receipts/5% of local): On a year ago basis, sales tax receipts advanced for a 15th consecutive quarter; however, growth has been decelerating, with four quarters of sub-2% y/y revenue increases (+0.3% in 1Q24, +1.4% in 4Q23, +0.2% in 3Q23, and +0.6% in 2Q23), following +6.9% in 1Q23, +7.0% in 4Q22 and six prior quarters of y/y revenue increases that averaged +16.9%. This deceleration is consistent with the moderation seen in inflation.
(4) Corporate income taxes (14% of total state receipts/1% of local): Corporate income tax receipts are historically volatile, due to variance in corporate profits and timing of payments. This revenue source increased by +1.5% y/y in 1Q24.
Figure 284: Pandemic-era volatility in certain major S&L tax streams appears to be more moderating

Source: US Census Bureau, J.P. Morgan. Note: Not seasonally adjusted.
Zooming out from major tax streams alone, state General Fund revenue collections from all sources on a current fiscal year-to-date basis are tracking higher than original budgeted estimates in 33 states, on target in seven, and lower in ten, representing moderation after exceptional results in FY21, FY22 and FY23, when nearly all states beat their original forecasts, often by a large margin, according to NASBO’s Spring 2024 Survey of States. Median General Fund revenue growth was +1.9% in FY23, is expected to tick down in FY24 (-1.1%) and increase by +1.9% in FY25. Other key takeways from NASBO’s latest survey are discussed in the section below.
State spending: Survey data indicates states are generally in a sound fiscal position, with spending growth expected to moderate from record levels on return to a more normal budget environment, and as rainy day funds remain at or near record highs
The following discussion details what we think are the key takeaways from NASBO’s Spring 2024 Survey of States, which was conducted over Feb-May 2024.
State spending growth expected to moderate from record levels on return to normal budget environment
On a nominal basis, median state General Fund (GF) spending is expected to moderate in in FY25 (+1.1%), following three consecutive years of substantial growth (+7.6% expected in FY24, +10.3% in FY23, and +9.3% in FY22), as one-time spending of surplus funds wanes. Note that “headline” total state GF spending is expected to decline by 6.2% in FY25 (following +14.4% in FY24 and+7.2% in FY23) ( Figure 285), but this is distorted by substantial y/y swings in one large state (TX: +$50bn/+81% in FY24, -$44bn/-39% in FY25). To adjust for this y/y volatility, we can look to average annual GF spending growth over FY23-FY25, which is estimated to be +5.2% (median: +7.4%). This follows record growth in FY22 (+16.0%/median: +9.3%). The majority of states (27) expect to see an increase in GF spending FY25 ( Figure 286), but this is a lower count vs. FY24 (39) and FY23 (45). The expected moderation in spending growth in FY25 and since record levels in FY22 reflects a gradual return to a more normal budget environment in which new money is limited and officials must weigh competing priorities in allocating resources, according to NASBO. Additionally, mid-year spending actions for FY24 suggest that there is some divergence across states in fiscal conditions. Specifically, 16 states recommended or adopted net mid-year increases in GF spending for FY24, vs. 10 states which reported decreases relative to their originally enacted budgets (although only 3 of these attributed the cuts to a revenue shortfall (AZ, CA and MA), with the other 7 citing lower spending needs or the use of federal funds in place of GF funds).
Figure 285: Total state GF spending is expected to decline by 6.2% in FY25 after +14.4% in FY24; however, this is distorted by substantial y/y swings in one large state (TX)
Y/y change in states’ budgets (%)
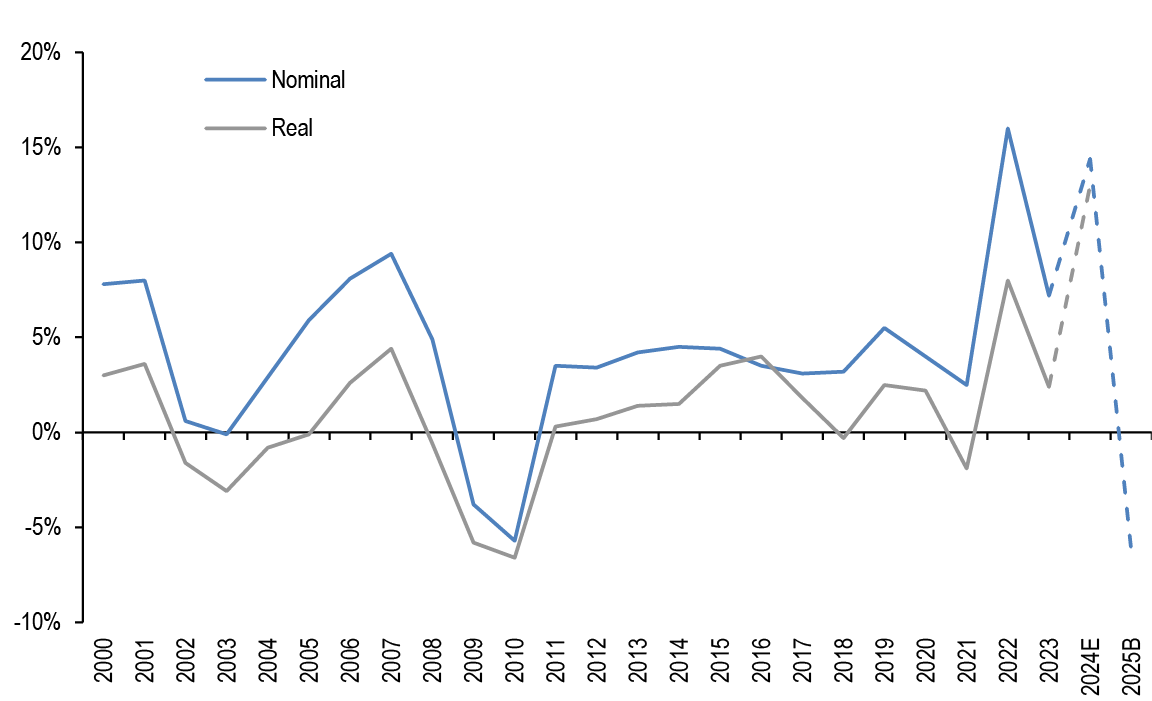
Source: National Association of State Budget Officers. This data has been modified by J.P.Morgan.
Note: Fiscal 2024 represents estimated figures and fiscal 2025 represents projections in governors’ recommended budgets.
Figure 286: The median expected growth rate in FY25 is +1.1% (vs. -6.2% total), with increases expected in 27 states
General Fund nominal % expenditure change, FY24 (E)-FY25 (B)
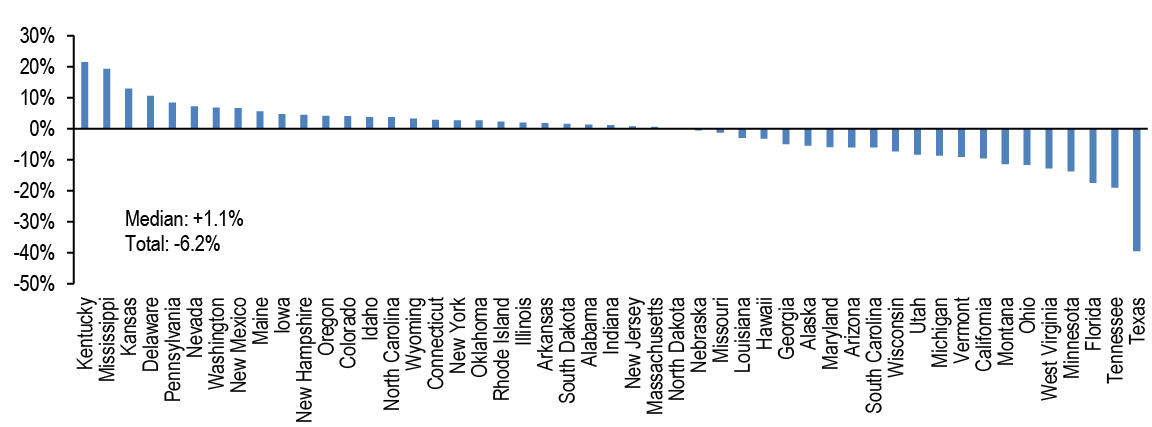
Rainy day funds remain at or near record highs. Total reserves are on track to dip, but this is to be expected after years of swelling, and is not an indication of fiscal stress
Recall, state Rainy Day Fund (RDF) balances more than doubled from FY20-FY22, from $77bn (8.4% of GF spending) to $167bn (10.8%), reflecting the receipt of substantial federal pandemic aid, and a continuation of states’ deliberate focus on building reserves post-Great Recession. States continued to add to their reserves in FY23, reaching $175bn (12.3%). While RDF balances are expected to decline in nominal terms in FY24 (to $148bn) and FY25 (to $141bn), the median RDF balance as a share of proposed GF spending is still on track to increase, to 13.2% in FY24 and 15.0% in FY25 ( Figure 287). Additionally, the aggregate expected decrease in nominal dollars is due mainly to a large anticipated decline in one state (CA), which saw extraordinary growth in prior years. Indeed, the majority of states are estimating increases in their RDF balances in FY24 (34) and further growth in FY25 (28). These high RDF levels leave states well-prepared to manage their budgets in the event of a downturn. Of course, while growth in RDF balances has been widespread, levels as a share of GF spending vary by state, with estimates for FY24 ranging from 0.6% (NJ) to 69.8% (WY). This variation is long-standing and attributable to differing fund structures, policy decisions, revenue volatility levels, fiscal conditions and other factors.
Meanwhile, total balances, which incorporate General Fund balances in the analysis of state reserves (total balances=GF ending balances + RDFs), are set to decline in both nominal terms and as a share of spending, from a record $425.9bn (37.4%) in FY23 to $297bn (23.2%) in FY24 and FY25 ($269bn/23.2%), as states spend down their surplus funds on one-time investments, like paying off debt, making supplemental pension payments, transfer payments to other state funds, refunds to taxpayers, and other uses. These are still very high levels relative in a broad historical context ( Figure 287). For example, total balances in the last pre-pandemic fiscal year (FY19) were $121.6bn (14.0%), a record high at the time. Importantly, state actions to spend down surplus GF balances are to be expected and not considered an indicator of fiscal stress.
Figure 287: RDF balances as a share of GF spending is set to reach new record highs in each FY24 and FY25, even as nominal balances are on track to decline. Total reserves are expected to decline, but remain high in a broad historical context
Source: National Association of State Budget Officers. This data has been modified by J.P.Morgan. Note: Figures for fiscal 2024 are estimates and fiscal 2025 are projections based on governors’ recommended budgets. GF and total balance figures for FY24 exclude WI, and figures for FY25 exclude MS, VA, and WI.
Ratings: The strong positive ratings trend has continued in 1H24, albeit with continued weakness in health care and private higher ed. Charter school activity also turned negative following a reprieve in recent years that was fueled by federal pandemic aid
Below, we recap year-to-date rating activity. A copy of our analysis of full year 2023 rating activity can be found here.
The strong positive ratings trend in municipals has continued so far into this year with the upgrade/downgrade ratio at 2.1x, across S&P, Moody’s and Fitch, according to Bloomberg. YTD, $158bn of debt has been upgraded while only $43bn has been downgraded. This represents some deceleration in momentum from 2023, which saw extremely strong activity: full-year upgrade/downgrade ratios were 4.2x (S&P) and 3.6x (Moody’s), the highest full-year ratios since 2009 and 2007, respectively ( Figure 289 and Figure 290). Activity continued to vary by sector in 1H24 ( Figure 288), with downgrades exceeding upgrades in health care (0.7x), higher ed (0.5x), senior living (0.6x), charter schools (0.6x) and water and sewer (W&S) (0.8x). Net negative activity in the charter school sector follows a pandemic-aid-fueled reprieve from a prolonged period of predominately negative actions. Under the hood of W&S activity, S&P accounted for 41/44 downgrades, due to (1) lack of timely disclosure and (2) corrections to ratings after an analytical error was identified in the rating agency’s assessments. In terms of higher ed, negative rating activity remain concentrated in private universities (we estimate a 0.2x ratio, based on a count of S&P and Moody’s actions), with public institutions faring better (3.0x, with limited activity). For further context, we discussed historical sector-specific rating activity for charter schools here, for higher ed here, for W&S here, and for health care here.
Looking forward: With credit conditions generally expected to remain in steady state for the remainder of 2024, it is hard to see the overall strong positive ratings momentum of the past 3yrs changing direction in 2H24. That said, sector-specific weakness appears unlikely to abate, with S&P recently reporting increased frequency of covenant violations in both higher ed and health care (while a violation itself may not necessarily trigger a rating action, the fundamental deterioration in credit metrics that often accompany them could result in one). Additionally, increased frequency of late audits (link to MSRB report) has the potential to drive an uptick in rating withdrawals.
Figure 288: The strong positive ratings trend has continued in 1H24 (2.0x), with variation by sector
YTD rating activity for select muni sectors, sorted in descending order of upgrade/downgrade ratio

Source: Bloomberg Finance L.P., J.P. MorganNote: As of 6/20/24. Encompasses S&P, Moody’s and Fitch actions. Not all sectors shown.
Figure 289: S&P’s upgrades exceeded downgrades for a 12th straight quarter in 1Q24 (2.0x)...
S&P count of upgrades and downgrades, # (left); Upgrades/downgrades ratio, x (right)

Source: S&P Global Ratings Research, J.P. Morgan. Gray shaded area indicates recessionary period.
Figure 290: ...and Moody’s ratio was positive for a 13th straight quarter (2.3x)
Moody’s count of upgrades and downgrades, # (left); Upgrades/downgrades ratio, x (right)

Source: Moody’s, J.P. Morgan. Gray shaded area indicates recessionary period.Note: 1Q17 local GO methodology revision led to one-time spike in upgrades
Side-by-side 50 state comparison
Below, we provide a side-by-side comparison of economic and financial metrics for each state, sorted by region. Blue shading denotes higher/stronger relative performance; orange shading denotes lower/weaker relative metrics.
Key takeaways
- Unemployment rates: On a year ago basis, May 2024 unemployment rates were lower in five states, unchanged in four, and higher in 41 and DC (29 of which saw rates increase at a faster relative pace vs. the national level). For context, many state unemployment rates hit or neared record lows around this time last year (link). On a year-ago basis, the national unemployment rate increased by +0.3% y/y to 4.0% in May, the highest since January 2022. The simple average of the year-ago change over the 50 states and DC rose by +0.4% y/y to 3.5%. States with the largest y/y unemployment rate increases include RI (+1.7%), WA (+1.1%) and CT (+1.0%). Notably, unemployment rates hit record lows last month in AZ (3.4%), TN (3.0%) and MS (2.8%). Meanwhile, 6 states and DC had unemployment rates exceeding 4.5% .
- Tax receipts: LTM state tax receipts from major sources declined by -2.0% y/y in 1Q24 (median -1.0%). By count, 12 states saw positive growth, led on a percentage basis by NE (+13% y/y); 28 states saw declines, with the largest drop in AK (-52%), and 11 states were broadly stable. Activity when measured over this period does not appear highly concentrated by region, although most states in the Northeast saw declines (7 out of 9), as did the West (8 out of 13).
Figure 291: Unemployment, tax revenue, reserves, and long term obligation metrics for all 50 states
Source: Bureau of Labor Statistics, Census Bureau, National Association of State Budget Officers, S&P, The Pew Charitable Trusts, J.P. Morgan. Blue shading denotes higher/stronger performance and metrics; orange denotes lower/weaker performance and metrics.
Glossary of Publication Topics
Sector Overviews
- Airports: 04/13/2018, 04/20/2018, 09/06/2019, 05/15/2020,06/11/2021, 01/10/2022, 02/11/2022, 08/19/2022, 07/28/2023
- Bond Insurance: 03/18/2016, 6/23/2017, 10/27/2017
- Charter Schools: 01/25/13, 03/15/24, 03/22/24
- Double-Barreled Bonds: 05/13/2016, 6/24/2016, 05/13/2022
- Energy: 01/29/2016, 02/05/2016, 02/19/2016, 04/23/2021, 02/11/2022
- Environmental, Social, Governance (ESG) Bonds:06/01/2018, 10/22/2021
- Gas prepay: 3/10/2017, 06/07/2019, 3/10/2023, 3/24/2023
- Housing: 1/20/2017, 10/20/2017, 07/26/2019, 08/02/2019, 12/10/2021
- Healthcare: 04/29/2016, 1/27/2017, 3/03/2017, 1/19/2018, 1/28/2019, 2/1/2019, 01/24/2020, 10/16/2020, 01/22/2021, 08/27/2021, 06/03/2022, 06/10/2022, 9/23/2022, 4/28/2023, 01/19/2024
- Higher Ed: 5/19/2017, 9/14/2018, 07/24/2020, 07/16/2021, 08/05/2022, 04/05/24
- High/Enhanced Yield: 9/8/2017, 9/15/2017, 7/27/2018, 8/03/2018, 05/08/2020, 05/15/2020, 06/05/2020, 06/12/2020, 08/28/2020
- Local Government Credit: 4/07/2017, 11/10/2017, 06/18/2021, 10/29/2021, 11/04/2022
- Low beta/defensive: 08/25/2017
- Office: 04/14/2023, 05/12/2023, 07/07/23, 03/11/24
- Pensions: 11/03/2017, 10/12/2018, 10/19/2018, 10/26/2018, 04/05/2019, 04/17/2019, 08/16/2019, 08/23/2019, 10/18/2019, 07/30/2021, 11/05/2021, 10/28/2022, 09/29/23
- Pre-refunded bonds: 1/29/2018
- Primary and secondary (K-12) education: 11/02/2018
- Public Power/Electric: 2/09/2018, 02/19/2021, 07/09/2021, 03/18/2022
- U.S. Ports: 04/15/2016, 05/20/2016, 11/18/2016, 04/06/2018, 10/15/2021
- Secured Credits: 08/07/2015, 09/18/2015, 09/25/2015
- Special Tax Bonds: 05/01/2015, 07/31/2015, 09/25/2015, 01/29/2016, 5/5/2017, 09/29/2017, 5/18/2018, 04/26/2019, 05/03/2019, 01/31/2020, 05/20/2022
- States: 11/13/2020, 2/5/2021, 09/24/2021, 02/25/2022, 03/04/2022, 07/08/2022
- SIFMA/Floating Rate notes: 03/15/2016, 08/26/2016, 3/31/2017, 4/28/2017, 04/13/2018, 9/14/2018, 02/20/2019, 04/26/2019
- Taxable bonds: 5/11/2018, 12/14/2018, 03/29/2019, 05/31/2019, 09/27/2019, 04/03/2020, 07/10/2020, 07/24/2020, 08/14/2020, 08/21/2020, 10/16/2020, 10/23/2020, 08/06/2021, 10/22/2021, 11/12/2021, 04/08/2022, 06/03/2022, 07/29/2022, 08/05/2022
- Toll Roads: 9/16/2016, 5/12/2017, 09/15/2017, 07/10/2020, 07/15/2022
- Tobacco: 11/20/2015, 12/15/2017, 7/27/2018, 03/29/2019, 05/07/2021, 08/19/2022, 08/26/2022, 5/10/24, 5/17/24
- Water & Sewer: 05/06/2016, 6/24/2016, 02/02/2018, 12/17/2021, 7/14/23
Specific Credits
- Assured Guaranty: 03/18/2016, 6/23/2017, 10/27/2017
- National Public Finance Guarantee Corporation: 6/23/2017, 10/27/2017
- Chicago & related credits: 9/23/2016, 2/10/2017, 04/13/2018, 10/25/2019, 02/07/2020, 06/12/2020, 10/23/2020, 02/19/2021, 10/01/2021, 05/13/2022, 10/14/22
- Detroit: 05/14/2021
- Dallas/Fort Worth & related credits: 6/02/2017, 08/04/2017, 04/13/2018
- Houston & related credits: 02/19/2016, 6/02/2017, 08/04/2017, 09/01/2017
- New York City & related credits: 03/31/2015, 6/17/2016, 9/9/2016, 8/17/2018, 08/23/2019, 06/12/2020, 05/21/2021, 04/08/2022, 04/22/2022, 05/20/2022, 01/20/2023
- Puerto Rico: 3/17/2017, 5/5/2017, 5/12/2017, 6/02/2017, 09/22/2017, 5/04/2018, 9/7/2018, 02/22/2019, 04/26/2019, 05/10/2019, 05/17/2019, 02/21/2020, 03/05/2021, 04/30/2021, 01/28/2022, 02/04/2022, 03/11/2022, 03/18/2022, 03/31/2023, 07/28/2023
- Santee Cooper / MEAG / Westinghouse Bankruptcy: 3/17/2017, 3/24/2017, 3/31/2017, 9/21/2018, 9/28/2018
- State of Alaska: 07/28/2017, 06/15/2018
- State of California & locals: 03/02/2018, 03/09/2018, 06/08/2018, 02/05/2021, 04/29/2022, 05/06/2022, 01/27/2023
- State of Connecticut & locals: 8/18/2017, 5/18/2018, 10/4/2019, 05/01/2020
- State of Illinois & related credits: 9/29/2017, 7/13/2018, 1/11/2019, 03/01/2019, 05/31/2019, 07/26/2019, 02/28/2020, 05/01/2020, 02/19/2021, 05/20/2022
- State of New York: 5/16/2014, 09/29/2017, 2/8/2019, 02/10/2023
- State of New Jersey & locals: 6/17/2016, 8/05/2016, 3/24/2017, 3/31/2017, 4/27/2018, 5/04/2018, 03/15/2019, 05/01/2020, 05/21/2021, 06/04/2021
- State of Pennsylvania: 7/15/2016
- State of Texas & locals: 08/04/2017, 08/16/2019, 03/12/2021, 03/19/2021, 02/03/2023
- State of Wisconsin & locals: 03/15/2015, 9/30/2016
- U.S. Virgin Islands & Guam: 07/15/2016, 07/29/2016, 2/24/2017
Defaults/Distressed Munis
- Chapter 9/Distressed locals: 10/31/2014, 11/21/2014, 06/30/2015, 07/08/2016, 04/26/2019, 01/31/2020, 02/07/2020
- Defaults: 11/20/2015, 06/24/2016, 07/08/2016, 08/26/2016, 8/24/2018, 04/23/2020, 07/24/2020, 09/24/2021, 02/11/2022, 03/11/2022, 07/29/2022, 01/6/2023, 01/05/24
- GO Security/Statutory Lien: 10/2/2015, 11/4/2016
Tax Policy
- AMT: 03/16/2018, 5/18/2018, 10/19/2018, 06/14/2019, 04/01/2022, 05/20/2022, 12/9/2022, 07/28/2023, 02/02/2024
- De minimis: 03/02/2018, 06/14/2019, 03/25/2022, 05/06/2022, 05/13/2022
- State and local tax (SALT) deduction cap: 1/26/2018, 7/6/2018,4/16/2021, 10/22/2021, 02/09/24
- Tax-exemption: 3/1/2013, 3/15/2013, 05/20/2016
- Tax swapping: 1/24/2014, 10/28/2016, 2/09/2018, 10/12/2018, 11/15/2019
- Tax reform: 2/28/2014, 12/16/2016, 4/28/2017, 5/05/2017, 6/16/2017, 09/29/2017, 10/272017, 11/03/2017, 11/10/2017, 1/26/2018
Other Federal Public Policy
- BABs: 02/23/24, 03/01/24
- COVID-19: 03/06/2020, 03/13/2020, 03/20/2020, 03/27/2020, 04/03/2020, 04/17/2020, 06/26/2020, 07/31/2020, 01/08/2021, 02/26/2021, 09/17/2021
- CARES Act: 04/03/2020, 01/21/2022
- American Rescue Plan: 03/26/2021, 04/09/2021, 05/21/2021, 01/21/2022
- Inflation Reduction Act: 08/05/2022, 08/19/2022, 08/26/2022
- Infrastructure spending: 04/09/2021, 05/14/2021, 07/16/2021, 08/06/2021, 09/17/2021, 01/21/2022
- Fed facilities/Municipal Liquidity Facility: 8/11/2020
- Regulatory reform/High-Quality Liquid Assets: 04/01/2016, 07/14/2017, 03/09/2018, 8/24/2018
- Health-care reform/Medicaid funding: 3/10/2017, 3/17/2017, 3/24/2017, 6/23/2017, 07/28/2017, 11/22/2017
- Trade war and tariffs: 04/06/2018, 06/07/2019
Periodic Updates
- Coupon performance: 04/08/2016, 9/21/2018, 03/15/2019, 06/14/2019, 06/28/2019, 10/18/2019, 08/20/2021, 04/01/2022, 08/26/2022, 09/09/2022
- Federal Reserve Flow of Funds: 01/10/2020, 03/27/2020, 06/26/2020, 09/25/2020, 12/11/2020, 06/18/2021, 09/24/2021, 12/17/2021, 03/18/2022, 06/10/2022, 09/16/2022, 12/16/2022 , 12/15/2023, 03/15/24
- Make-Whole Call: 04/22/2016, 07/12/2019
- Outflow cycle: 10/29/2021, 11/05/2021, 03/11/2022, 04/01/2022, 04/29/2022, 05/06/2022, 05/13/2022, 09/16/2022
- Short call bonds: 08/28/2015, 12/11/2015, 03/04/2016, 3/3/2017, 3/10/2017, 08/04/2017, 03/26/2021, 10/01/2021, 06/10/2022
- Taxable advance refunding: 09/13/2019, 10/25/2019, 10/16/2020, 10/01/2021
- Total Return & Performance: 05/13/2016, 06/10/2016, 5/19/2017, 07/07/2017, 11/10/2017, 02/23/2018, 1/4/2019, 01/10/2022, 04/08/2022
- Sovereign Government Relative Value: 09/09/2016, 01/19/2018, 8/17/2018
- State and Local revenues: 04/13/2018, 9/21/2018, 1/11/2019, 05/17/2019, 06/21/2019, 09/20/2019, 01/10/2020, 04/17/2020, 09/11/2020, 09/18/2020, 11/13/2020, 01/29/2921, 06/18/2021, 11/12/2021, 03/25/2022, 09/09/2022, 11/10/22, 2/24/2023, 02/23/24
- Appropriation debt: 8/19/2016, 01/26/2024
Municipal Market Outlook
Weekly Updates
- Economic and policy updates
- Next week’s supply, fund flows
- Comparisons versus Corporates, Treasuries, and Global Sovereigns
- Full year gross, net-supply estimates, and interest rate forecast
Emerging Markets
- In EM fixed income, we are MW GBI-EM local rates, CEMBI and EMBIGD.
Emerging Markets Outlook and Strategy
EM assets to be held-back in 2H24 by the looming US elections, while macro uncertainties remain unresolved. The first half of 2024 saw EM markets continue to be mainly driven by the US and global cyclical environment, as the interaction of growth and inflation cycles with their impacts on the US and EM monetary policies have been at the fore. The growth outlook is better despite a recent stall in momentum, while central bank rate forecasts have had to be revised higher again . Equity and commodity prices are higher, with credit spreads tighter, giving a mid-cycle feel where risk has outperformed rates-sensitive assets. EM’s own recovery from distressed pricing, along with this global trend, has led EM credit to outperform local markets YTD, as EM sovereign spreads tightened 41bp (when properly adjusted for Venezuela’s index inclusion) and EM corporates tightened 58bp, for total returns of 2.2% and 3.3% respectively. Local markets have been dragged by higher yields (+40bp), while carry has helped limit the total return loss to -2.9% on local bonds in USD terms.
Keep MW across EM local rates, Sovereigns & Corporates, while hiding out in idiosyncratic carry. Trading a strong global macro trend for EM does not look like a great risk/reward strategy to us at the current juncture. First, there still remains a degree of ‘observational equivalence’ in the US and global data: on the one hand there is still a tight US labor market which can generate sticky inflation, with few signs of corporate or household imbalances, so rates may stay high-for-long. On the other hand, growth looks to be slowing with our economists forecasting this to continue in 2H24 and the cumulative impact of rate hikes may still be lagging through the economy. EM assets have become tired of trading these macro variations, as each scenario has looked plausible over the last two years. The bar for further Fed hikes is currently high but the rates landscape may again change post-US election. This brings us to the second issue for EM markets, which is a US election cycle in which some of the policy proposals may significantly impact specific EM countries (see section later and also 2024 US Election Watch) . Given a lack of risk-premia in EM assets ahead of this, there is an element of complacency. On the positive side of the ledger, we still think EM has good idiosyncratic carry in places where two cycles of distress have abated: an EM default cycle and an EM inflation cycle. Both were precipitated by a generational US hiking cycle and there is still some excess risk premia we think in some high yielding local and hard currency markets to exploit. Harvesting this idiosyncratic carry while remaining hedged against market beta is how we are currently recommending to position within EM.
From the multiverse of risks to the singularity of a US election: EM will be a bit bumpier in 2H24. Despite feeling jittery, EM markets in 1H24 have not been that volatile. EM local rates have moved higher, but mostly just reversing the move lower from November. EM currency returns have mostly been within a range, when carry is included, while EM credit spreads have continued to retrace lower. We came into the year bullish on EM local markets (OW EM Rates) but have been running MW since April and are still MW in EM sovereigns and corporates given spreads (ex-distressed) are already tight by historical standards. Markets have recently felt more like the multiverse in terms of many drivers competing for prominence and none decisively driving a trend, with EM election surprises adding some specific volatility in South Africa, Mexico and India most recently. Given the narrowing window until US election risks become more prominent, we see less promising risk-reward and can see a choppy summer without a strong trend. The risks around the November US election are likely skewed negatively at this point and we will look to adjust EM overall and country risk for the election scenarios as we get closer to this event risk.
Large upside domestic demand surprises prevented an expected 1H24 slowing in growth. At the start of this year, we had expected building drags from a slowing China and the 2021-23 global hiking cycle to pull down 1H24 EM growth to a 4%ar. In the event, growth looks to have slowed much less than expected—to a forecasted 4.5%ar in 1H24 from 5%ar in 2H23—and that only on account of China, while EM ex China (EMX) has held broadly steady. The stronger-than-expected 1H performance reflects material upside domestic demand surprises in 1Q, with growth momentum already expected to downshift in the current quarter, particularly in EM Asia. In China, weak activity and survey data since March have confirmed that support from policy measures that had buoyed 1Q growth is running out, and we see growth slowing sharply to a 3.5%ar this quarter. Elsewhere in the region, a pause in the tech-led manufacturing lift also looks to be weighing on 2Q growth in EMAX. By contrast, growth trends in the other two regions look more differentiated. In EMEA EM, CEE and South Africa are expected to accelerate further this quarter on firming domestic—particularly consumer—demand, while the combined headwinds from past monetary tightening and fading fiscal supports lead to a stall in Türkiye. In Latam, continued strength in activity data point to a further acceleration in Mexico on top of the significant upside 1Q surprise. Moreover, while we expect 2Q growth in Brazil to hold steady at a 2%ar, risks around our forecast due to floods in the southernmost state of the country are tilted to the downside.
Progress towards achieving inflation targets is becoming more varied across countries in the last mile. The ups and downs in inflation in recent years have been strongly synchronized across countries. But with global impulses fading and becoming more mixed, inflation dynamics are turning more divergent. Core inflation is already at or below central bank targets in EM Asia—partly due to widespread slack in the region—but remains elevated in much of Latam and EMEA EM. Outside of EM Asia, core inflation at end-2024 is projected to be within 50bp of target midpoints only in Brazil and South Africa. Inflationary overshoots of 100bp or more above targets are expected in Hungary, Poland, Romania, Chile and Colombia (along with Turkiye), with more modest deviations of 50-100bp expected in Israel, Czechia, Mexico and Peru .These overshoots largely reflect elevated services inflation amid domestic demand strength and accelerating real wage growth, with weaker currencies also adding to imported inflation for some countries. For major DMs too we see the path ahead as most likely to deliver sticky inflation; in both the US and Euro area we see core CPI inflation above 3%oya this year even as an early-year overshoot fades.
Cautious EM easing looks set to continue in Latam and CEE, broadening to EM Asia in 4Q24.With disinflation progress slowing, EM easing has started losing steam. After cutting 75bp in the four quarters to 2Q24, we look for EM (ex China and Türkiye) to lower policy rates by a further 40bp on average by year-end, broadly matching the projected decline in inflation. Where easing cycles are at a mature stage but rate buffers are still ample, we look for the pace of easing to slow (as in Czechia, Hungary and Chile), while other are likely to pause (Mexico) or even hold for an extended period (Brazil), largely due to stickier inflation. Among the group of EMs that have already started easing, only Colombia is expected to deliver more cuts in 2H24 than 1H24 with the others cutting on average 150bp less. Our base case still sees rate cuts broadening to Russia, Romania, South Africa and India in 3Q24, followed by the rest of EM Asia in 4Q24. But easing in these groups is expected to be more modest.
For many EMs, rate cuts remain strongly contingent on the Fed and the dollar. While falling inflation and benign external conditions allowed EM easing cycles to start last year, the extension of easing cycles into 2H24 among the early EM rate cutters—and the start of easing in the others—will depend on easing by major DM central banks. Market pricing for the Fed has been pared back to just under 50bp cuts through end-2024 from around 150bp at the start of the year. While our US team continue to look for 75bp of easing this year this call is under pressure from sticky inflation. We see the path ahead as most likely to deliver continued sticky inflation and further scaling back of DM easing expectations for 2024-25 as the foundations of the immaculate disinflation narrative is challenged. A key test for the coming months will be whether central bank confidence that inflation is on track to fall to 2% next year will wane. A further pricing out of DM rate cuts along with a stronger dollar could force EM central banks currently easing to go on hold, while a handful of countries in EM Asia—where rate differentials versus the Fed are at record lows—could be forced to adopt capital flow and/or stealth tightening measures and could even face pressure to hike.
US elections used to not matter much for EM assets, until 2016 showed how much they can. Before 2016, US elections were generally not significant for EM markets, with assets usually performing somewhat better after elections as uncertainty was removed (see EMOS 2024 Outlook). 2016 was a departure from that, as the Trump victory led to a significant EM asset sell-off, with countries such as Mexico and China seeing particularly large moves given specific policies that impacted their trade relationships with the US. This pressure lasted for much of the Trump presidency, before giving way eventually to the COVID-19 recession sell-off. From the November 2016 election to the initial peak as markets priced the surprise (versus polling) Trump victory, EM credit was least affected with sovereign spreads moving 50bp wider and EM corporate spreads 22bp wider. US 10y rates rose 74bp helping EM local bond yields (GBI-EM) rise 59bp. Those countries most affected by the change in policy implied by the new White House saw particularly large moves and had already been underperforming into the election. From the day (in July 2015) that President Trump announced his candidacy to their weakest point during his presidency, MXN depreciated 46% vs the USD and CNY 21%. The fact there may be less election surprise or policy novelty this time, and the better state of EM fundamentals and technicals, should help mitigate the extent of moves versus those seen post-2016. But with little clear election risk-premia so far priced into EM assets, we would again expect a reaction if the election result brings in a set of policies that impact EM markets.
Impacts of the US election on EM in 2024/2025: International and domestic channels. Since the 2016 US election period, we have become more familiar with the channels through with specific US policies can impact EM markets. We can separate these channels into: 1) International policies, given the US President has more far-reaching powers to act unilaterally in the international arena. This can operate via: (A) tariffs and trade policy, as well as (B) geopolitics and security. Many EM countries will likely be affected by different international policy proposals that are at stake in the US elections. Additionally, 2) The impact on EM risks from potentially rising US rates and USD moves, coming from the impact of additional US fiscal stimulus through tax cuts or other budget policies. These impacts are also dependent on the congressional outcome, as well as the presidential election result, as a combination of House/Senate/White House from the same party is likely to be able to be fiscally more expansive. It is through these channels that we will assess the impact of the US elections on EM in the following sections.
For further detail, see Emerging Markets Outlook and Strategy for 2H24 A more tactical approach to EM warranted amid a mixed macro picture and US election risks, L. Oganes et al, June 6, 2024
Forecast & Analytics
Interest rate forecast
| Actual | 1m ahead | 3Q24 | 4Q24 | 1Q25 | 2Q25 | |
| 28-Jun | 28-Jul | 30-Sep | 31-Dec | 31-Mar | 30-Jun | |
| Rates (%) | ||||||
| Effective funds rate | 5.33 | 5.35 | 5.35 | 5.10 | 4.85 | 4.60 |
| SOFR | 5.34 | 5.30 | 5.35 | 5.10 | 4.85 | 4.60 |
| 2-yr Treasury | 4.72 | 4.70 | 4.75 | 4.60 | 4.30 | 4.05 |
| 3-yr Treasury | 4.51 | 4.50 | 4.55 | 4.40 | 4.15 | 3.95 |
| 5-yr Treasury | 4.33 | 4.30 | 4.40 | 4.25 | 4.00 | 3.80 |
| 7-yr Treasury | 4.32 | 4.30 | 4.40 | 4.25 | 4.00 | 3.80 |
| 10-yr Treasury | 4.34 | 4.35 | 4.50 | 4.40 | 4.20 | 4.00 |
| 20-yr Treasury | 4.60 | 4.60 | 4.70 | 4.60 | 4.40 | 4.20 |
| 30-yr Treasury | 4.50 | 4.50 | 4.65 | 4.60 | 4.50 | 4.35 |
| Spreads (bp) | ||||||
| Fed funds/2yr | -61 | -65 | -60 | -50 | -55 | -55 |
| 2s/10s | -38 | -35 | -25 | -20 | -10 | -5 |
| 2s/5s | -39 | -40 | -35 | -35 | -30 | -25 |
| 5s/10s | 1 | 5 | 10 | 15 | 20 | 20 |
| 5s/30s | 17 | 20 | 25 | 35 | 50 | 55 |
| 10s/30s | 16 | 15 | 15 | 20 | 30 | 35 |
Source: J.P. Morgan
Swap spread forecast*
| Actual | YE24 | |
| 28-Jun-24 | 31-Dec-24 | |
| SOFR Swap Spread (bp) | ||
| 2-year SOFR swap spread (bp) | -14 | -6 |
| 5-year SOFR swap spread (bp) | -28 | -22 |
| 10-year SOFR swap spread (bp) | -42 | -37 |
| 30-year SOFR swap spread (bp) | -79 | -79 |
* Forecast uses matched-maturity spreads
Source: J.P. Morgan
TIPS real yield & breakeven forecast
| Actual | 3Q24 | 4Q24 | 1Q25 | 2Q25 | |
| 28-Jun-24 | 30-Sep-24 | 31-Dec-24 | 31-Mar-25 | 30-Jun-25 | |
| Breakevens (bp) | |||||
| 5Y | 226 | 235 | 230 | 230 | 215 |
| 10Y | 228 | 230 | 230 | 225 | 220 |
| 30Y | 229 | 230 | 225 | 225 | 220 |
| Real yields (%) | |||||
| 5Y | 2.08 | 2.05 | 1.95 | 1.70 | 1.65 |
| 10Y | 2.06 | 2.20 | 2.10 | 1.95 | 1.80 |
| 30Y | 2.21 | 2.35 | 2.35 | 2.25 | 2.15 |
| Curves (bp) | |||||
| 5s/10s BE | 2 | -5 | 0 | -5 | 5 |
| 10s/30s BE | 1 | 0 | -5 | 0 | 0 |
| 5s/10s yld | -2 | 15 | 15 | 25 | 15 |
| 10s/30s yld | 15 | 15 | 25 | 30 | 35 |
Source: J.P. Morgan
Economic forecast
| %ch q/q, saar, unless otherwise noted | ||||||||||
| 23Q4 | 24Q1 | 24Q2 | 24Q3 | 24Q4 | 25Q1 | 25Q2 | 2023* | 2024* | 2025* | |
| Gross Domestic Product | ||||||||||
| Real GDP | 2.1 | 4.9 | 3.4 | 1.4 | 2.0 | 1.0 | 1.0 | 3.1 | 1.4 | 1.9 |
| Final Sales | 2.1 | 3.6 | 3.9 | 1.8 | 1.3 | 0.6 | 0.9 | 3.5 | 1.2 | 1.8 |
| Domestic Final Sales | 2.0 | 3.5 | 3.6 | 2.4 | 2.4 | 1.0 | 1.3 | 3.2 | 1.8 | 1.9 |
| Business Investment | 7.4 | 1.4 | 3.7 | 4.4 | 5.4 | 2.1 | 3.4 | 4.6 | 3.8 | 4.6 |
| Net Trade (% contribution to GDP) | 0.0 | 0.0 | 0.3 | -0.7 | -1.1 | -0.4 | -0.4 | 0.3 | -0.6 | -0.1 |
| Inventories (% contribution to GDP) | 0.0 | 1.3 | -0.5 | -0.4 | 0.7 | 0.4 | 0.1 | -0.4 | 0.2 | 0.1 |
| Prices and Labor Cost | ||||||||||
| Consumer Price Index | 3.0 | 3.4 | 2.7 | 3.8 | 3.3 | 2.5 | 2.4 | 3.2 | 3.0 | 2.4 |
| Core | 4.7 | 3.0 | 3.4 | 4.2 | 3.4 | 2.8 | 2.7 | 4.0 | 3.3 | 2.4 |
| Employment Cost Index | 4.1 | 4.1 | 3.8 | 4.8 | 3.3 | 3.0 | 2.8 | 4.2 | 3.5 | 2.9 |
| Unemployment Rate (%, sa) | 3.6 | 3.7 | 3.7 | 3.8 | 4.0 | 4.0 | 4.1 | - | - | - |
| * Q4/Q4 change | ||||||||||
Source: J.P. Morgan
Financial markets forecast
| Credit Spread | Current | YE24 |
| 10-year SOFR swap spread (bp) † | -42 | -37 |
| FNMA 30yr 6% Front Tsy OAS (bp) | 28 | 30 |
| 10yr conduit CMBS LCF AAA † | 98 | 95 |
| 3-year AAA card ABS to Treasuries (bp) | 48 | 40 |
| JULI spread to Treasuries (bp) | 109 | 110 |
| High Yield Index | 351 | 380 |
| Emerging Market Index | 395 | 400 |
| Local currency: GBI-EM yield (%) | 6.56% | 5.58% |
cont.
| Current | YE24 | |
| S&P 500 (level)† | 5460 | 4200 |
| Brent ($/bbl) | 86 | 83 |
| Gold ($/oz) | 2324 | 2300 |
| EUR/USD | 1.07 | 1.05 |
| USD/JPY | 161 | 146 |
† Mid-year forecasts only
Source: J.P. Morgan
Gross fixed-rate product supply*

Treasury client survey

Source: J.P. Morgan
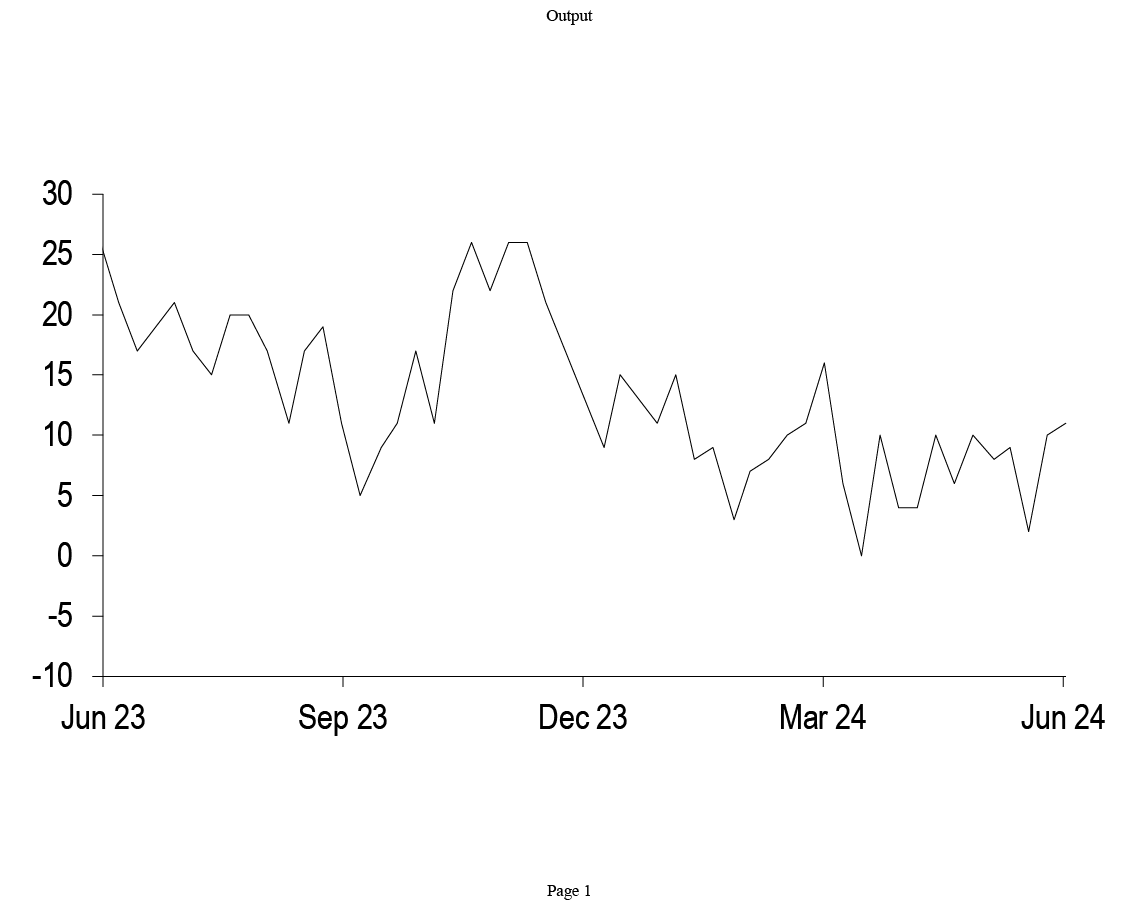
Source: J.P. Morgan
Treasury net issuance forecast
J.P. Morgan projection of net Treasury issuance to private investors, Federal Reserve purchases of Treasuries, and expected change in Treasuries held by private investors; $bn
| Year | Net privately-held borrowing | Fed secondary market purchases | Net change in privately-held debt | |||
| Bills | Coupons | Bills | Coupons | Bills | Coupons | |
| CY 2019 | 77 | 1133 | 169 | 77 | -92 | 1056 |
| CY 2020 | 2547 | 1752 | 157 | 2184 | 2390 | -432 |
| CY 2021 | -1195 | 2898 | 0 | 957 | -1195 | 1942 |
| CY 2022 | -37 | 1638 | 0 | 75 | -37 | 1563 |
| CY 2023 | 2047 | 1107 | 0 | 0 | 2047 | 1107 |
| CY 2024 | 406 | 1909 | 0 | 0 | 406 | 1909 |
Source: J.P. Morgan, US Treasury, Federal Reserve Bank of New York
T-bill weekly net issuance
Weekly net issuance of T-bills, historical and JPM projections; $bn
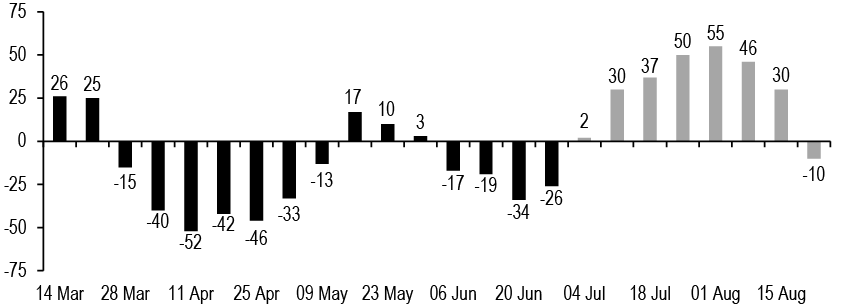
Source: J.P. Morgan
Dealer inventories
Primary dealer positions in Treasuries*, with 5-year statistics; $bn
| Maturity | Last | 1w chg | 5y avg | 5y min | 5y max | 5y z-score |
| T-bills | 39 | -35 | 51 | -4 | 119 | -0.4 |
| <2y | 27 | -6 | 35 | -17 | 97 | -0.3 |
| 2-3y | 16 | 0 | 5 | -14 | 18 | 1.9 |
| 3-6y | 67 | -3 | 29 | -2 | 69 | 2.5 |
| 6-7y | 26 | 1 | 12 | -4 | 29 | 2.1 |
| 7-11y | 21 | -1 | 3 | -10 | 27 | 2.5 |
| >11y | 48 | 0 | 46 | 27 | 62 | 0.4 |
| 11-21y | 21 | 0 | ||||
| >21y | 28 | 0 | ||||
| TIPS | 22 | -2 | 13 | 1 | 25 | 1.8 |
| FRNS | 11 | -2 | 7 | -14 | 28 | 0.6 |
| Total | 278 | -48 | 200 | 76 | 325 | 1.4 |
Source: Federal Reserve Board of New York
*Latest data as of 6/19/2024
Investor position technical indicators
Current value of various position indicators* versus 1 month ago; 1-year z-score
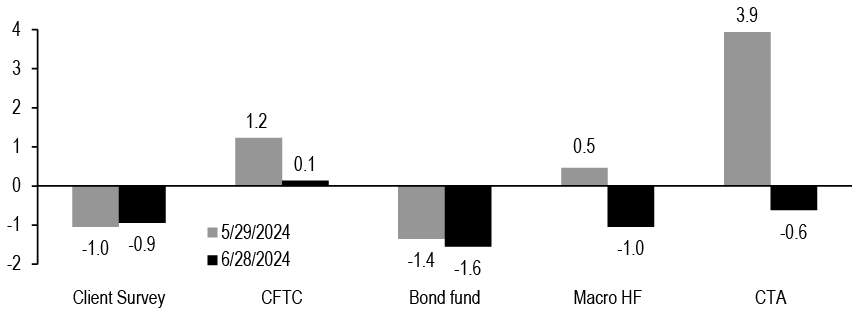
Source: CFTC, Bloomberg Finance L.P, SG, HFR, J.P. Morgan
* JPM Client Survey refers to a 4-week moving average of our Treasury Client Survey Index; (Longs+Neutrals)/(Shorts+Neutrals), see Survey Says: Using the Treasury Client Survey to predict rates moves, 7/21/23for more details. CFTC refers to the non-commercial net longs in UST and SOFR futures contracts reported by the CFTC. CTA beta is the four-week partial beta of SG CTA Index to 10-year UST yields. Real money beta is the eight-week partial beta of excess returns of the 20 largest actively managed US core bond funds to 10-year UST yields. Macro HF beta is the six-week partial beta of HFRX Macro/CTA Index to 10-year UST yields
Treasury market functioning metrics
Various metrics of Treasury market functioning; units as indicated
| Indicator | Today | 1w chg | 1y avg | 1y min | 1y max | 1y z-score |
| Duration weighted mkt depth*; $mn | 258 | 14.8 | 204 | 134 | 282 | 1.6 |
| 10y price impact**; 32nds | 0.6 | -0.1 | 0.8 | 0.4 | 1.2 | -1.0 |
| 1m GC/OIS; bp | 0.0 | -7.9 | 5 | -0.1 | 14.6 | -1.9 |
| UST curveRMSE***; bp | 6.7 | 2.1 | 3.3 | 2.3 | 6.7 | 5.1 |
| 10s/3x old 10s ASW; bp | -0.5 | -0.1 | -1.2 | -3.1 | 0.3 | 0.7 |
| 30s/3x old 30s ASW; bp | 0.4 | 0.1 | -0.3 | -2.1 | 1.2 | 0.8 |
Source: J.P. Morgan, BrokerTec
* Market depth is the sum of the three bids and offers by queue position, averaged between 8:30 and 10:30am daily
** Price impact defined as the average move in order book mid-price against a $100mn flow in traded notional. See Drivers of price impact and the role of hidden liquidity, J. Younger et al., 1/13/17 for more details.
*** Root Mean Square Error of J.P. Morgan par fitted Treasury curve (see The new and improved Treasury par curve model, 7/16/18)
Select Federal Reserve balance sheet items
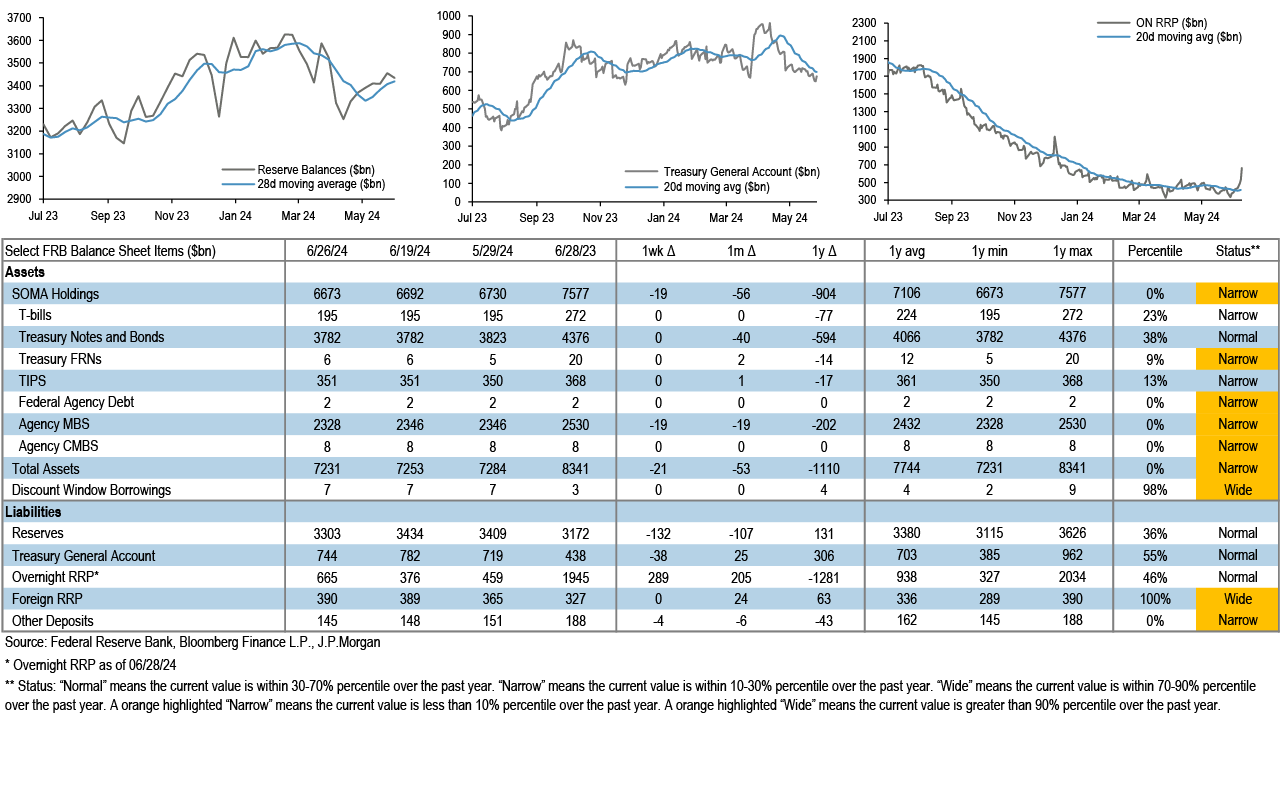
Money market funds
Assets under management ($bn)
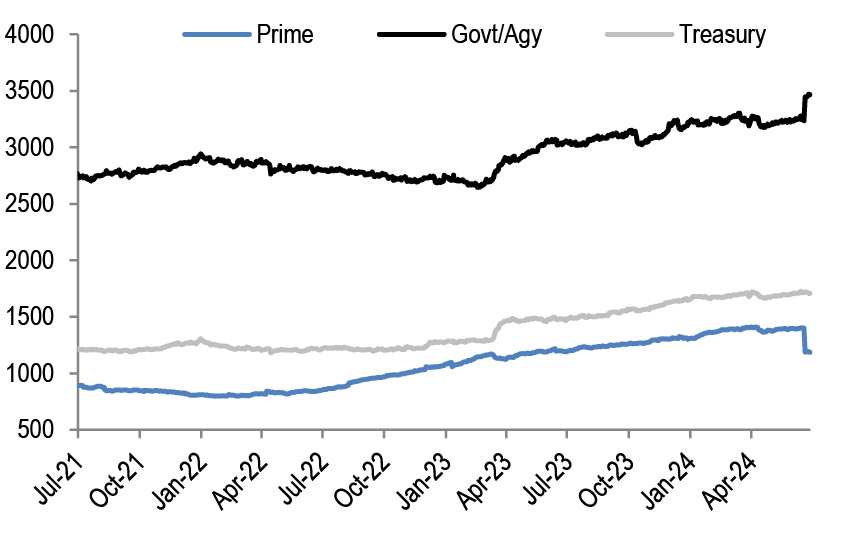
Weighted average maturity (days)
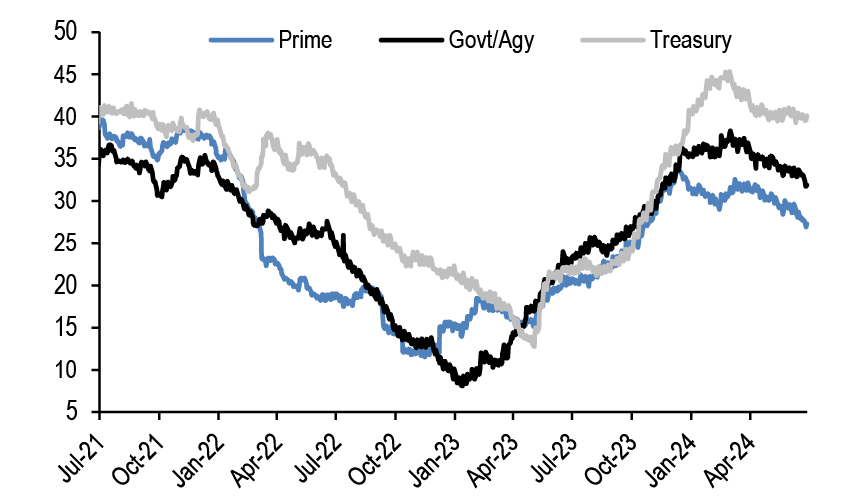
Source: Crane Data, J.P. Morgan
US funds flows
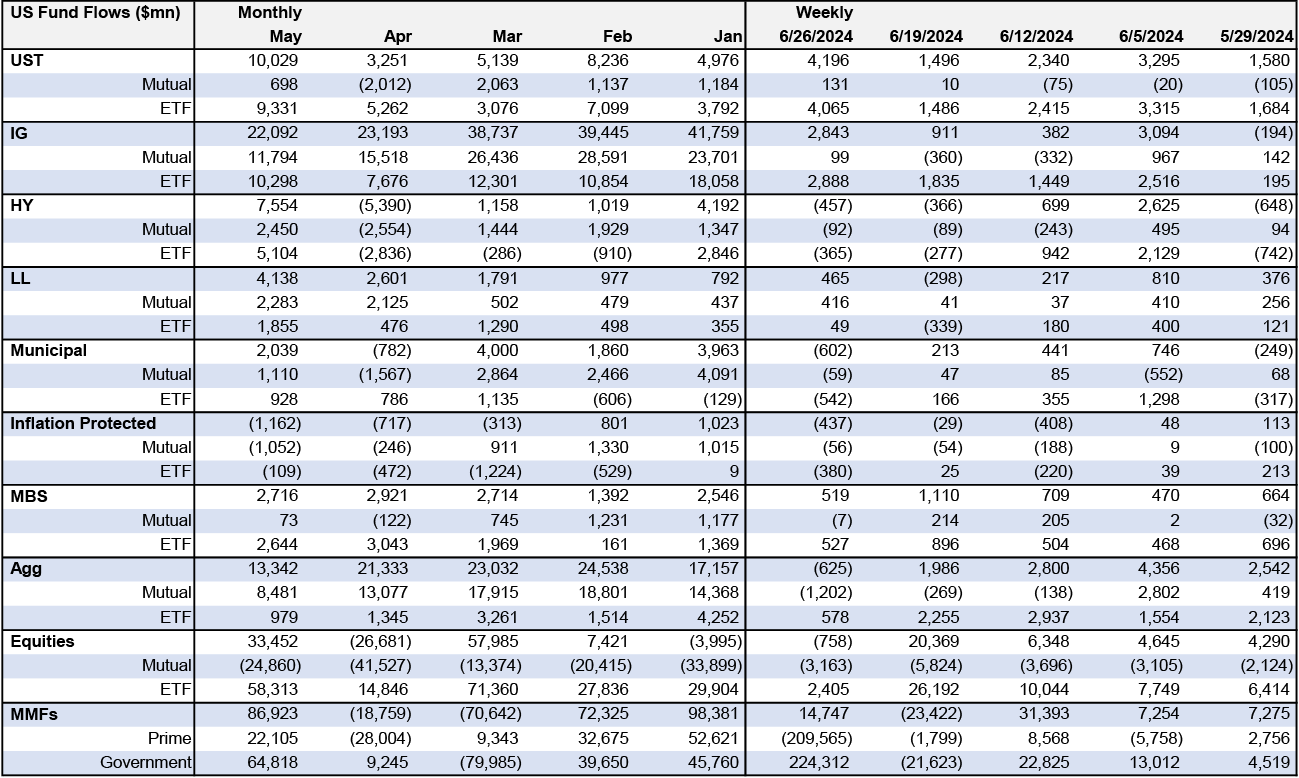
Source: EPFR, Crane Data, J.P. Morgan
Market Movers Calendar
| Monday | Tuesday | Wednesday | Thursday | Friday |
|---|---|---|---|---|
| 1 Jul Manufacturing PMI(9:45am) Jun final 51.5 ISM manufacturing(10:00am) Jun 48.5 Construction spending(10:00am) May 0.3% |
2 Jul JOLTS(10:00am) May 7.950mn Light vehicle sales Jun 15.8mn
Fed Chair Powell (9:30am) |
3 Jul ADP employment(8:15am) Jun Initial claims(8:30am) w/e Jun 29 230,000 International trade(8:30am) May -$77.4bn Services PMI(9:45am) Jun final 55.0 ISM services(10:00am) Jun 53.0 Factory orders(10:00am)Jun
Announce 10-year note (r) $39bn Announce 3-year note $58bn Announce 30-year bond (r) $22bn
NY Fed’s Williams (7:00am)
FOMC minutes |
4 Jul Independence Day, markets closed |
5 Jul Employment(8:30am) Jun 200,000 Average weekly hours 34.3 Unemployment rate 4.0%
NY Fed’s Williams (5:40am) |
| During the week: New York Fed President Williams speaks (30 Jun) | ||||
| 8 Jul Consumer credit(3:00pm) May |
9 Jul NFIB survey(6:00am) Jun
Auction 3-year note $58bn
Fed Chair Powell (10:00am) |
10 Jul Wholesale trade(10:00am) May
Auction 10-year note (r) $39bn |
11 Jul CPI(8:30am) Jun Initial claims(8:30am) w/e Jul 6 Federal budget(2:00pm) Jun
Auction 30-year bond (r) $22bn Announce 20-year bond (r) $13bn Announce 10-year TIPS $19bn
Atlanta Fed’s Bostic (11:30am) |
12 Jul PPI(8:30am) Jun Consumer sentiment(10:00am) Jul preliminary |
| 15 Jul Empire State survey(8:30am) Jul
Fed Chair Powell speaks(12:00pm) |
16 Jul Retail sales(8:30am) Jun Import prices(8:30am) Jun Business leaders survey(8:30am) Jul NAHB survey(10:00am) Jul Business inventories(10:00am) May |
17 Jul Housing starts(8:30am) Jun Industrial production(9:15am) Jun Beige book(2:00pm)
Auction 20-year bond (r) $13bn |
18 Jul Initial claims(8:30am) w/e Jul 13 Philadelphia Fed manufacturing(8:30am) Jul Leading indicators(10:00am) Jun TIC data(4:00pm) May Auction 10-year TIPS $19bn Announce 2-year note $69bn Announce 2-year FRN $30bn Announce 5-year note $70bn Announce 7-year note $44bn
Dallas Fed’s Logan (1:45pm) Fed Governor Bowman (7:30pm) |
19 Jul Atlanta Fed’s Bostic (12:45pm) |
| 22 Jul |
23 Jul Philadelphia Fed nonmanufacturing(8:30am) Jul Existing home sales(10:00am) Jun Richmond Fed survey(10:00am) Jul
Auction 2-year note $69bn |
24 Jul Manufacturing PMI(9:45am) Jul flash Services PMI(9:45am) Jun final New home sales(10:00am) Jun
Auction 5-year note $70bn Auction 2-year FRN $30bn
Dallas Fed’s Logan and Fed Governor Bowman (4:05pm) |
25 Jul Real GDP(8:30am) 2Q advance Durable goods(8:30am) Jun Initial claims(8:30am) w/e Jul 20 Advance economic indicators(8:30am) Jun KC Fed survey(11:00am) Jul
Auction 7-year note $44bn |
26 Jul Personal income(8:30am) Jun Consumer sentiment(10:00am) Jul final |
Source: Private and public agencies and J.P. Morgan. Further details available upon request.
- 1
see An Update to the Budget and Economic Outlook: 2024 to 2034, CBO, 6/19/2024 - 2
see Details and Analysis of President Biden’s Fiscal Year 2025 Budget Proposal, Tax Foundation, 3/22/24 - 3
see Budgetary Outcomes Under Alternative Assumptions About Spending and Revenues, CBO, May 2024 - 4
See e.g., Amiti, M., Redding, S. J., & Weinstein, D. E. (2019). “The Impact of the 2018 Trade War on U.S. Prices and Welfare.” and Crowley, M. A., Meng, N., & Song, H. (2020). “Tariff Scares: Trade Policy Uncertainty and Foreign Market Entry by Chinese Firms.”