
Flows & Liquidity
Equity market concentration and the shift from active to passive funds
- We are sceptical of the thesis that the shift from active to passive is being reinforced by increasing US equity market concentration.
- While active funds appear to be overall UW the ‘Magnificent 7’ stocks, they have managed to outperform their benchmarks both during 2023 and YTD, there is little sign of the active to passive shift having accelerated as a share of AUM.
- The SEC diversification rule may not be as critical as it might seem taken at face value.
- This week’s yen interventions may imply that Japanese authorities would have to consume a greater amount of foreign currency reserves to have the same impact as before.
- Retail investors retrench from both equity and crypto markets.
- The shift from active to passive equity funds continues unabated with active equity mutual funds bearing the brunt of equity fund selling in April. A question often arising in our client conversations is whether the shift from active to passive equity funds is reinforced by US equity market concentration and the rise of Magnificent seven stocks. The argument being that as active equity managers struggle to catch up with the rising weight of US large tech stocks and as they face the SEC’s diversification rule or their own stock/sector limits, they are forced to limit their exposure to the largest US tech stocks, which in turn makes it more difficult to outperform benchmarks in the current juncture. This in turn induces end investors such as retail investors to shift even more towards passive equity funds which, by simply tracking equity indices, do not face such concentration constraints. And this flow shift creates a self-reinforcing circle: as more money goes into passive equity funds it ends up in large tech stocks, which then expand further, becoming even bigger components of equity indices.
- While we are sympathetic to some of the above arguments, we are sceptical of the overall thesis.
- It is certainly the case that there has been an increased concentration since the onset of the pandemic when looking at the share of the so-called ‘Magnificent 7’ (Apple, Amazon, Alphabet, Meta, Microsoft, NVIDIA and Tesla) as a share of total S&P 500 market capitalisation (Figure 1). It is also evident in their shares of total S&P 500 earnings, though perhaps less so in terms of sales. Interestingly, while there is a perception that the large tech companies are ‘defensives’, the earnings as a % of total S&P earnings do exhibit cyclicality in the upswing in 2020/21, the correction in 2022 and from mid-2023 onward. This suggests they may be somewhat less defensive than commonly perceived. And when we take the difference between the Magnificent 7 share of S&P market cap and their share of revenues, equity market concentration has not made any new highs beyond the step increase seen after the pandemic (Figure 2).
Figure 1: Magnificent 7 share of S&P 500 market capitalisation, earnings and sales
In %.
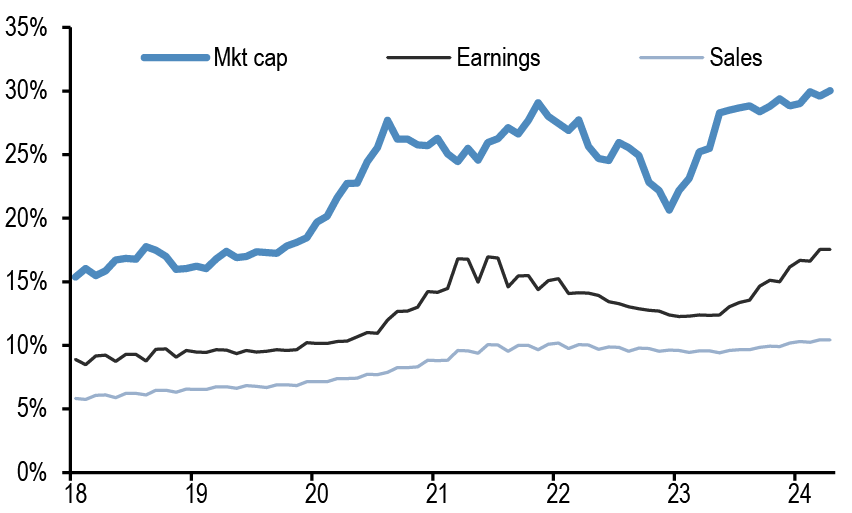
Source: Bloomberg Finance L.P., J.P. Morgan.
Figure 2: Difference between market capitalisation and sales shares of the Magnificent 7 share in the S&P 500
In %.
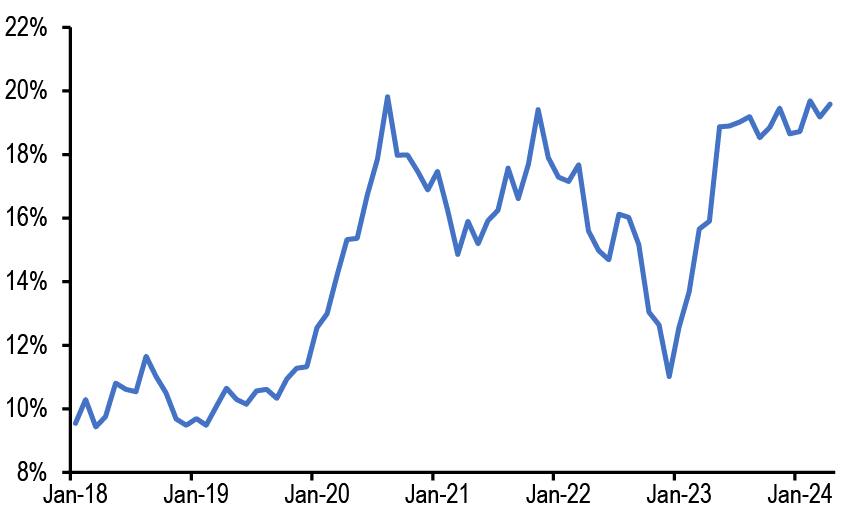
Source: Bloomberg Finance L.P., J.P. Morgan.
- Second, while it is true that share of Magnificent 7 stocks is overall higher in passive vs active funds (by adding up the weights in Figure 3 we get 26% overall allocation for active funds vs 29% for passive funds), the biggest US active equity mutual fund managers have managed to outperform their benchmarks during 2023 and YTD, as shown by Figure 4 and Figure 5. This perhaps reflect their UWs in Apple and Tesla and their OWs in Microsoft and Google, as shown in Figure 3. For example, if we apply the allocations in Magnificent 7 stocks shown in Figure 3, we find that active funds would have slightly outperformed passive funds YTD.
Figure 3: Share of active and passive equity funds’ holdings* in Magnificent 7 stocks relative to their total holdings of stocks in the S&P 500 index*
In %. As on 1st May 24.
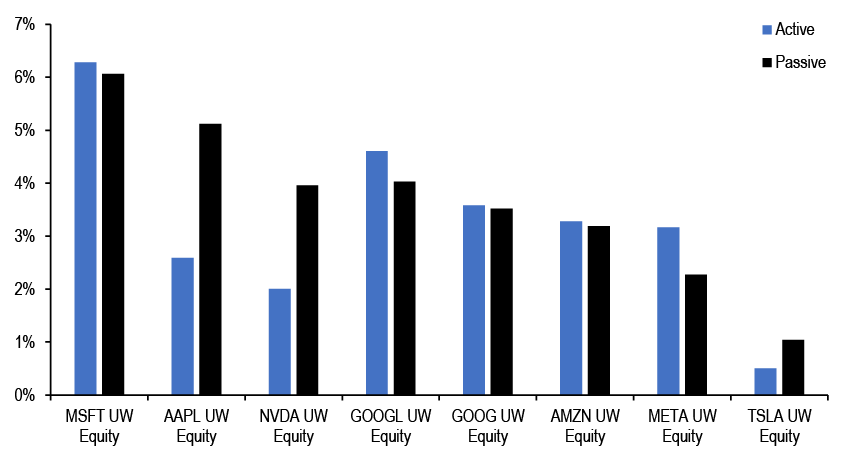
Source: Bloomberg Finance L.P., J.P Morgan.
* where active and passive ownership is specifically identified, excludes ‘unknown’ management style holdings.
Figure 4: Annual median excess return vs. benchmark of 100 biggest active US equity mutual funds
In %.
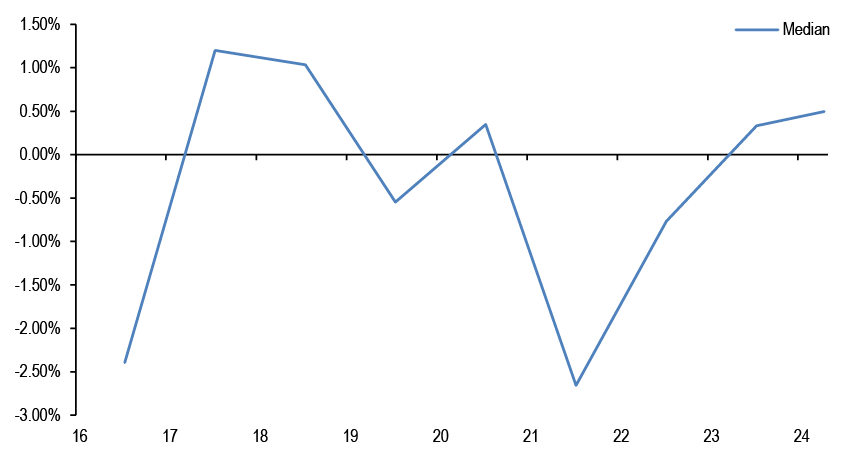
Source: Bloomberg Finance L.P., J.P Morgan.
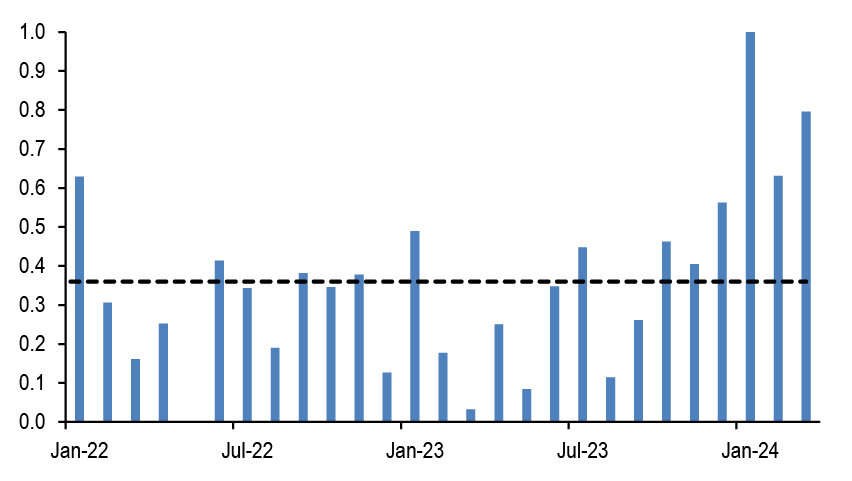
Figure 5: Share of 100 biggest active US equity mutual funds beating their benchmark
In %.
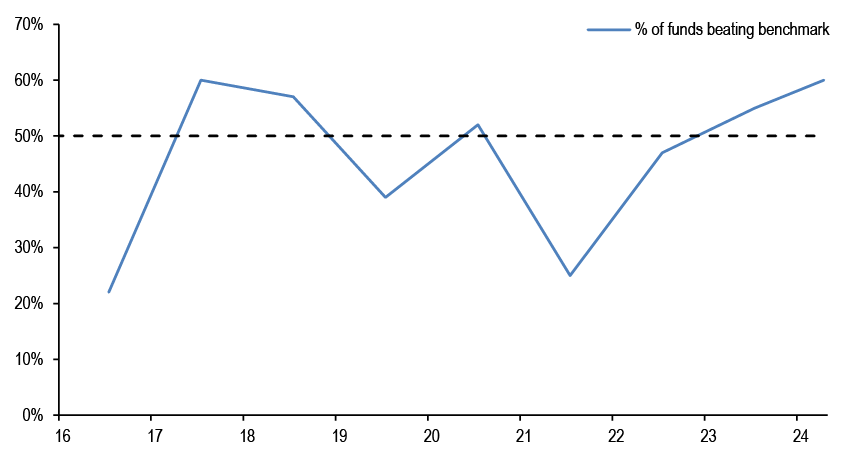
Source: Bloomberg Finance L.P., J.P Morgan.
- Third, the shift from active to passive equity funds has been taking place for some time and the trend does not appear to be accelerating due to the rise of Magnificent 7 stocks (Figure 6). Indeed, while there has been an acceleration in the outflow from active funds in nominal terms, with an increase in outflows in 2016 to $390bn having accelerated to around $500bn in 2020, 2022 and 2023, this is largely due to a price effect. The outflows relative to AUM, which rose to just over 6% in 2016, have been similar in magnitude in recent years.
Figure 6: Share of active vs. passive in equity US domiciled funds
As % of total AUM. Active and passive funds are US domiciled. Passive funds include ETFs. Last obs. is Mar’24.

Source: ICI, J.P. Morgan.
- Fourth, the SEC diversification rule itself is perhaps not as critical as it seems on surface for three reasons. A) Our understanding of the SEC diversification rule is that up to 25% of fund assets can be held as large holdings (i.e. stocks with more than 5% of fund’s assets). This leaves room for active funds to have a few large exposures of >5% such as in Microsoft, Apple, Nvidia. B) Even if the room under this 25% rule is exhausted, funds have the option to re-categorise themselves as “non-diversified” and appeal to investors for picking the highest quality/highest return potential stocks (as successful equity long/short hedge funds and non-diversified active equity managers argue). And there is no evidence that end investors mind stock concentration. A simple fund search shows that less than 10% of US active equity mutual funds use “diversified” in their fund description. And after all, end investors have been pouring money into equity index ETFs and equity long/short hedge funds despite high/rising concentrations. C) While the SEC rule limits the addition of new exposure to individual stocks once the thresholds have been breached, as we note above active funds on aggregate are seeing outflows as part of the shift from active to passive. Active funds seeing outflows could simply sell other stocks to return cash to investors and increase their exposure to the magnificent 7 stocks beyond the above thresholds in a passive way.
- In all, we are sceptical of the thesis that the shift from active to passive is being reinforced by increasing US equity market concentration. While active funds appear to be overall UW the Magnificent 7 stocks, they have managed to outperform their benchmarks both during 2023 and YTD, there is little sign of the active to passive shift having accelerated as a share of AUM. And the SEC diversification rule may not be as critical as it might seem taken at face value.
This week’s yen interventions may imply that Japanese authorities would have to consume a greater amount of foreign currency reserves to have the same impact as before
- Japanese authorities appear to have intervened twice this week in periods of thin liquidity , on Monday 29th of April during a Japanese holiday and in late New York trading on May 1st . In both days the dollar dropped by around 5 yen intraday. We do not yet have information about the size of the intervention on May 1st, but press reports and the reported daily projection of changes in current account balances at the Bank of Japan point to around JPY6tr of intervention on April 29th . Provisional daily data on BoJ’s projected current account balances (that are subject to revisions) point to somewhat smaller intervention amount on May 1st of around JPY4tr, bringing this week’s total intervention to around JPY10tr. That said, the provisional figures for the intervention on Monday were subsequently revised higher.
- This compares to a total intervention of around JPY9tr during Sep/Oct 2022 (in three series interventions on Sep 22nd , Oct 21st and Oct 24th 2022). At the time JPY2.8tr was used for Sep 22nd , JPY5.6tr for Oct 21st and JPY0.7tr for Oct 24th. Each of those three interventions had caused an immediate (but temporary) drop in the dollar of around 5-6 yen. The intervention last Monday April 29th 2024 had caused an immediate (and again temporary) drop in the dollar of around 5 yen. So at face value and assuming the size was JPY6tr as suggested by press reports and daily current account balances, last Monday’s intervention was somewhat less impactful per each trillion yen bought than the Sep/Oct 2022 interventions overall. In turn this may imply that Japanese authorities would have to consume a greater amount of foreign currency reserves to have the same impact.
- In terms of how the intervention was funded, typically it is dollar deposits (like those held by the MoF at the Fed’s reverse repo facility) that are consumed during the actual intervention. That said, the lesson from the Sep/Oct 2022 interventions is that these deposits tend to be replenished relative quickly by the MoF eventually selling dollar securities. In other words, some downward pressure in short-dated USTs is likely as dollar securities are eventually sold in the days/weeks following this week’s interventions.
- Indeed during the Sep/Oct 2022 interventions while at the time of the actual interventions dollar deposits were likely consumed, cumulatively over these two months the item “Deposits with Foreign central banks and BIS” at MoF’s Official Reserve Assets was roughly unchanged at around $136bn between Aug 31st 2022 and Oct 31st 2022. That is, dollar deposits were replenished within days or weeks by the MoF likely selling USTs. Instead the market value of “Securities” at the MoF’s foreign currency reserves had declined from $1037bn Aug 31st 2022 to $941bn Oct 31st 2022. Surely a significant part of this $96bn market value reduction was due to price changes as UST yields had increased by 100bp at the time. Assuming duration of 3 years for the dollar securities held as reserves, a 100bp increase in UST yields would imply a loss of around 3 x 100bp =3% or $31bn, so the remaining $96bn-$31bn=$65bn reduction in the market value of “Securities” in Japan’s foreign currency reserve assets would be due to sales to fund the intervention. This estimate is comparable to the actual intervention amount of JPY9.2tr during Sep/Oct 2022.
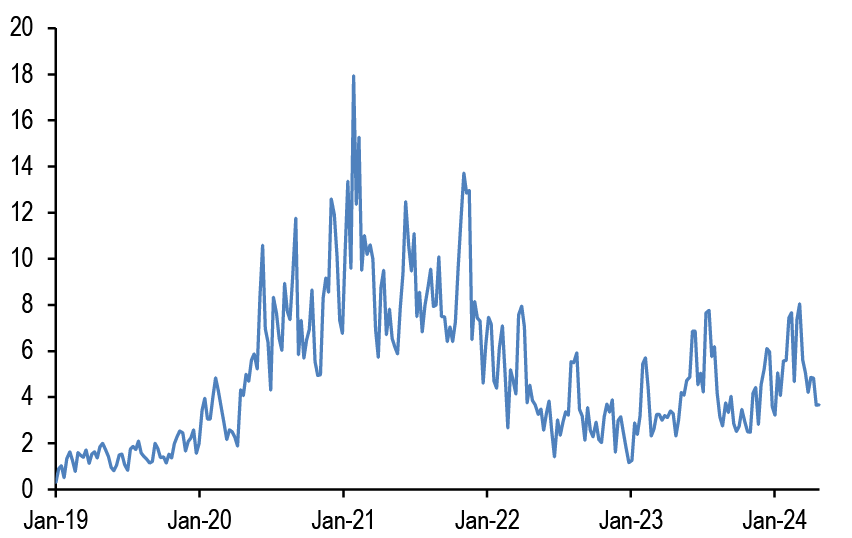
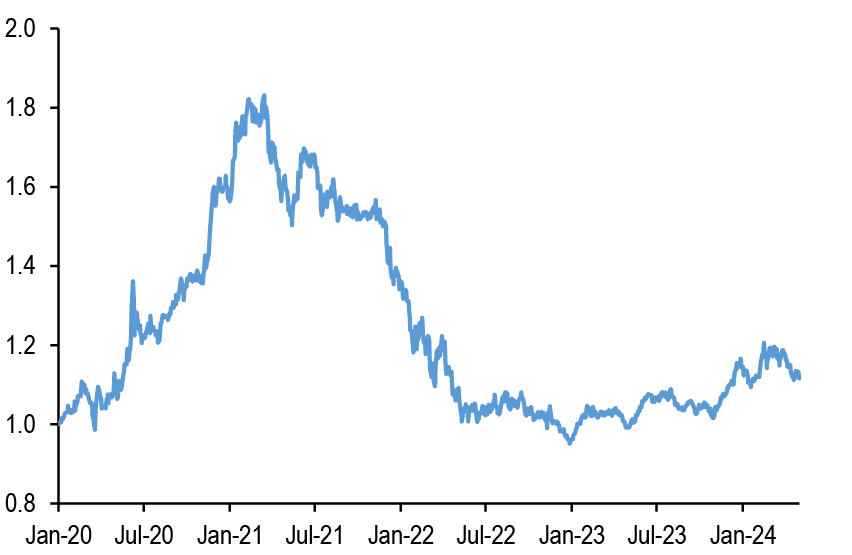
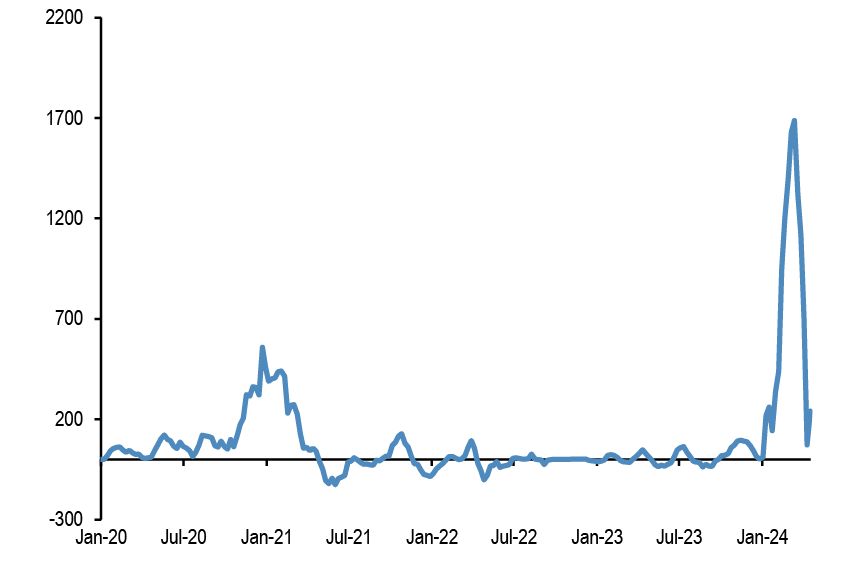
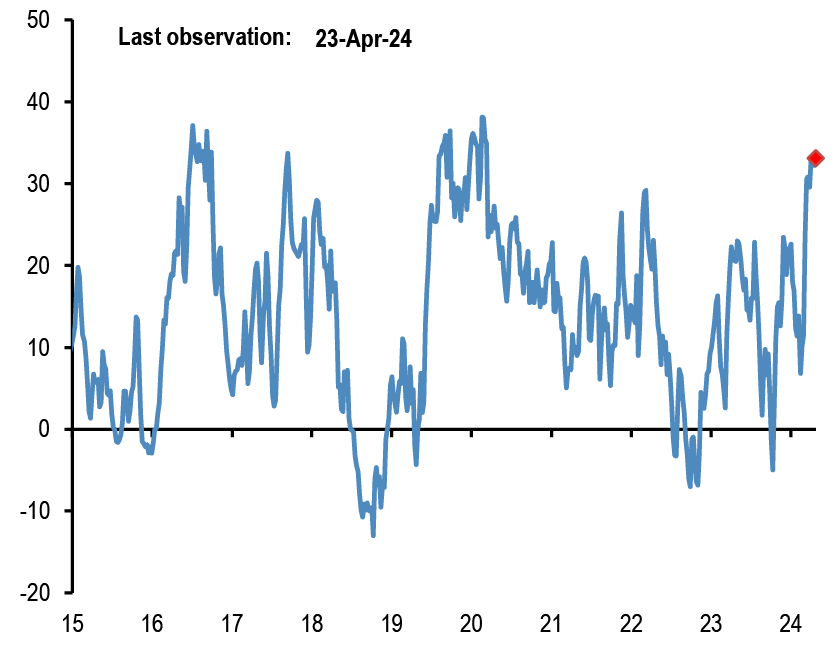
- Similar to Sep/Oct 2022 the intervention did little in changing investors attitudes towards Japanese assets. Institutional investors, both offshore and onshore, continue to hold elevated Japanese equity exposures ( Figure 7 to Figure 9), roughly neutral positions in JGBs ( Figure 10) and very negative positions in the yen ( Figure 11 and Figure 12).
- We recommend our readers to also see the latest notes by our yen strategist Junya Tanase.
Figure 7: Position proxy for offshore Nikkei futures
‘000 contracts.
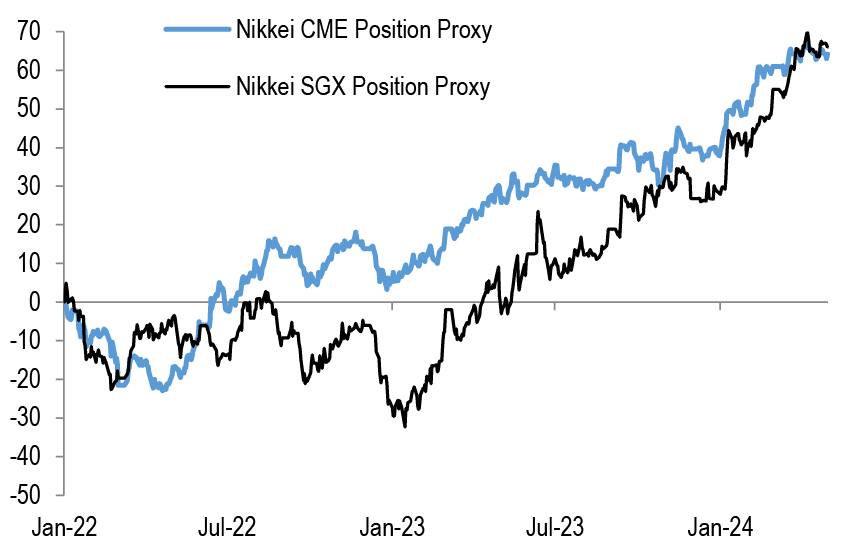
Source: Bloomberg Finance L.P., J.P. Morgan.
Figure 8: Position proxy for onshore Nikkei futures
‘000 contacts.
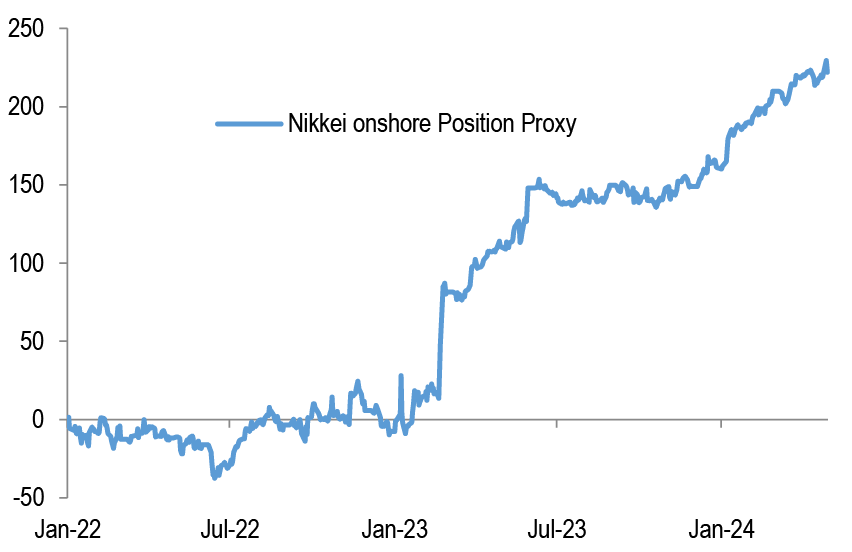
Source: Bloomberg Finance L.P., J.P. Morgan.
Figure 9: Tokyo Stock Exchange margin trading - total buys minus total sells
In bn of shares. Topix on right axis.

Source: Tokyo Stock Exchange, Bloomberg Finance L.P., J.P. Morgan.
Figure 10: Position Proxy for 10Y JGB futures
Number of contracts in thousands across all expiries. Cumulative weekly absolute change in open interest multiplied by the sign of the futures price change every week.
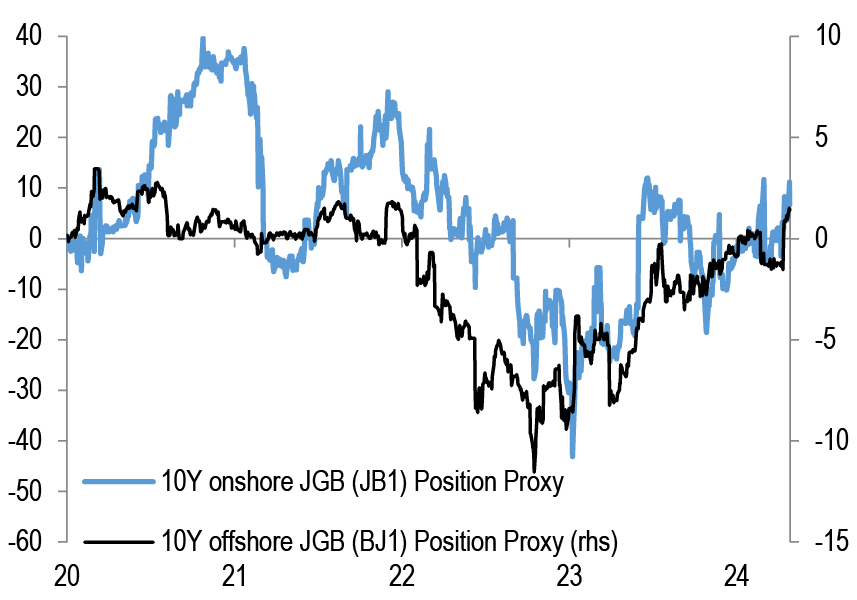
Source: Bloomberg Finance L.P., J.P. Morgan.
Figure 11: Position Proxy for JPY futures
Number of contracts in thousands across all expiries. Cumulative weekly absolute change in open interest multiplied by the sign of the futures price change every week.
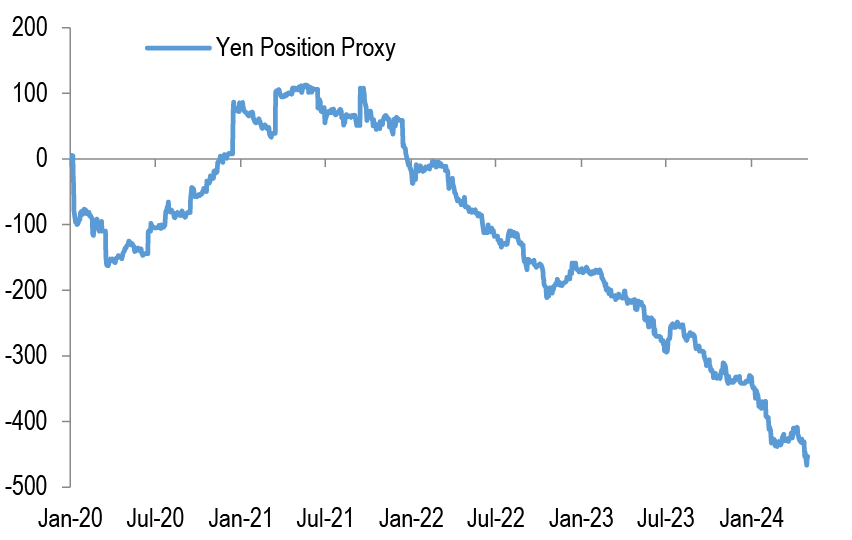
Source: Bloomberg Finance L.P., J.P. Morgan.
Figure 12: Average of longer- and shorter-term momentum signals for Yen
z-score of the momentum signal in our Trend Following Strategy framework shown in Tables A3 and A4 in the Appendix. Average of shorter- and longer-term momentum.

Source: Bloomberg Finance L.P., J.P. Morgan.
Retail investors retrench from both equity and crypto markets
- We had argued in our previous publication F&L April 17th that the bitcoin halving was priced in and there was likely to be downside pressure on bitcoin prices post halving for three reasons:
- Still overbought conditions as per our futures position proxy.
- Bitcoin prices still well above our vol adjusted comparison to gold ($45k, see F&L March 7th ) or its medium term projected production cost post halving once unprofitable miners retrench ($42k, see F&L Feb 28th).
- Subdued crypto VC funding YTD despite the crypto resurgence
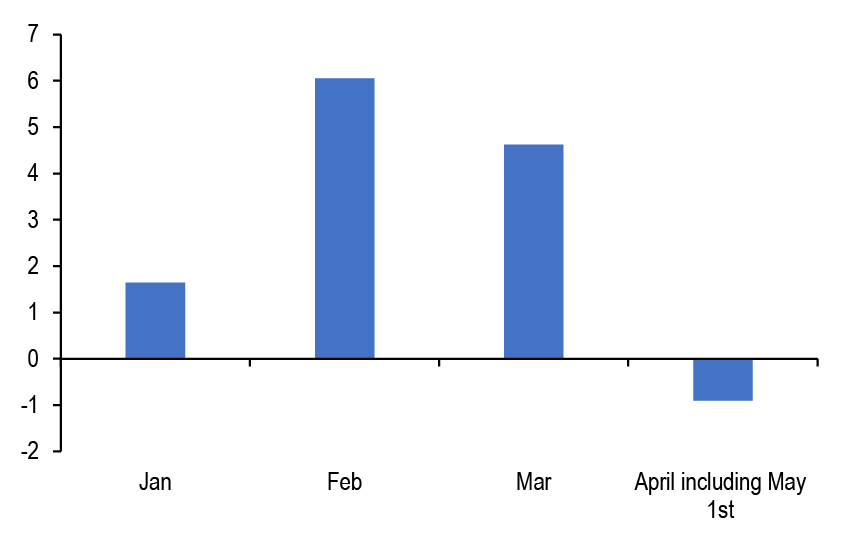
- The past two weeks saw significant selling/profit taking with perhaps retail investors playing a bigger role than institutional investors. In fact retail investors appear to have sold both crypto and equity assets during April. Indeed, not only have spot bitcoin ETFs seen outflows in April ( Figure 13) but our proxies of the retail impulse into equities have also downshifted over the past month. This is shown by Figure 14 to Figure 18. Figure 14 highlights the net flow into equity funds including ETFs and mutual funds, typically used by retail investors,. The net flow into equity funds turned negative in April after strong buying in February and March. Figure 15 depicts small traders’ option flows for exchange-traded individual equity options in the US which has also downshifted in recent weeks. This is a proxy for the net flow into call options by US retail investors i.e. option customers with less than 10 contracts. The data come from OCC, the world’s largest equity derivatives clearing organisation and are weekly, with the week ending April 26th the last available observation. Figure 16 highlights the relative performance of 50% Nasdaq + 50% Russell 2000 basket vs. the S&P500 Index, which has also declined in recent weeks consistent with retail investors selling, given that Nasdaq and Russell 2000 stocks are the preferred habitats of US retail investors. Figure 17 shows the relative performance of US Retail Investors' Favorites US equity basket vs. S&P500 Index has also declined in recent weeks consistent with retail investors sell-off. Finally, the swings we observe in US retail investors’ sentiment surveys such as the AAII survey (shown in Figure 18) has swung from bullish to bearish territory last month.
- In terms of institutional investors, it has been mostly momentum traders such as CTAs or other quantitative funds taking profit on previous extreme long positions in both bitcoin and gold, as shown by our momentum traders’ positioning proxies of Figure 19.
- However, the overall positioning across our futures as shown in Figure 20 declined by less than our momentum signals in Figure 19 suggesting a more limited position reduction by other institutional investors outside quantitative funds/CTAs.
- In all, with a lack of positive catalysts , with the retail impulse dissipating and with the three headwinds mentioned previously in our publication ( elevated positioning , high bitcoin prices vs gold and vs the estimated bitcoin production cost, subdued crypto VC funding ) still in place, we maintain a cautious stance on crypto markets over the near term.
Figure 13: Net flows in US spot bitcoin ETFs by month
$bn
Source: Bloomberg Finance L.P., J.P. Morgan.
Figure 14: Global Equity fund flows by month
$bn

Source: Bloomberg Finance L.P., J.P. Morgan.
Figure 15: Exchange-traded Call Option Buys at Open minus Sells at Open for Costumers with less than 10 contracts for options on individual equities
In mn contracts. Last obs is for the week ending 26th Apr 2024.
Source: OCC, J.P. Morgan
Figure 16: Performance of 50% Nasdaq + 50% Russell 2000 vs. S&P500 Index
Ratio of two return indices

Source: Bloomberg Finance L.P., J.P. Morgan.
Figure 17: Retail Investors’ Favorites US equity basket vs. S&P500 Index
Ratio of two return indices
Source: GS, Bloomberg Finance L.P., J.P. Morgan
Figure 18: AAII US Investor Sentiment Index, Bullish over Bearish ratio

Source: Bloomberg Finance L.P., J.P. Morgan.
Figure 19: Our momentum signals for gold and bitcoin futures, average of long and short lookback periods
z-score in y axis.

Source: Bloomberg Finance L.P., J.P. Morgan.
Figure 20: Implied cumulative position build up by speculative inventors in gold and CME bitcoin futures
In $bn.

Source: Bloomberg Finance L.P., J.P. Morgan.
Appendix
Chart A1: Global equity & bond fund flows
$bn per year of Net Sales, i.e. includes net new sales + reinvested dividends for Mutual Funds and ETFs globally, i.e. for funds domiciled both inside and outside the US. Flows come from ICI (worldwide data up to Q4’23). Data since then are a combination of monthly and weekly data from Lipper, EPFR and ETF flows from Bloomberg Finance L.P.

Source: ICI, EPFR, Lipper, Bloomberg Finance L.P., J.P. Morgan.
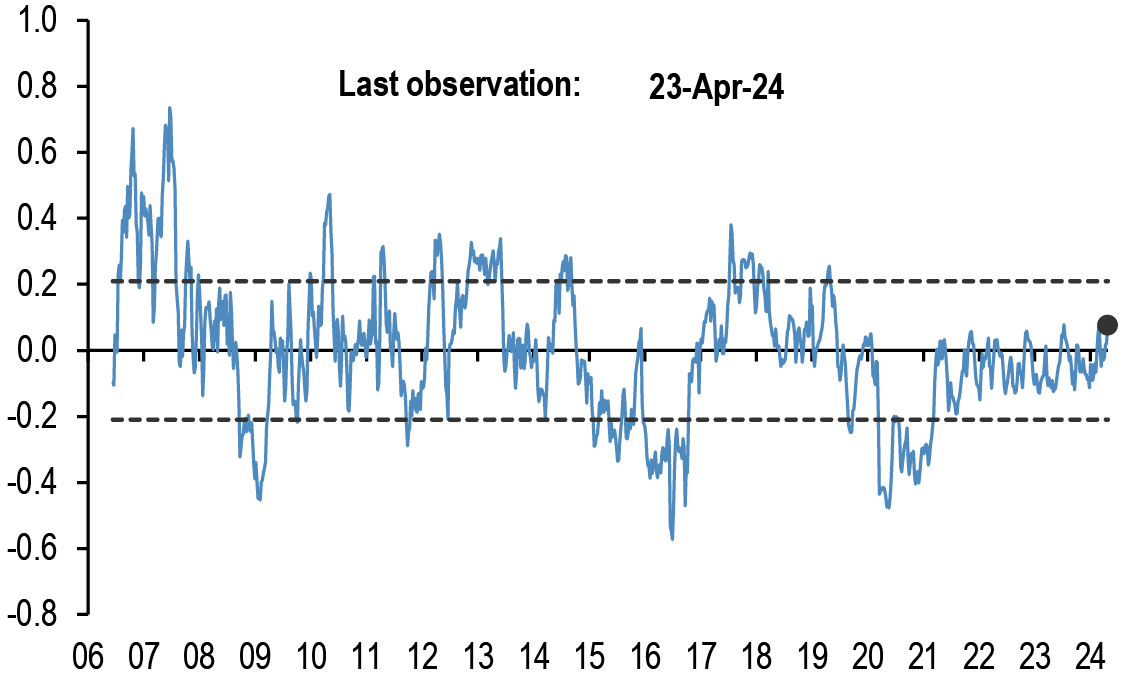
Chart A2: Fund flow indicator
Difference between flows into Equity and Bond funds: $bn per week. Difference between flows into Equity vs. Bond funds in $bn per week. Flows include Mutual Fund and ETF flows globally, i.e. funds domiciled both inside and outside the US (source: EPFR) The thin blue line shows the 4-week average of difference between Equity and Bond fund flows. Dotted lines depict ±1 StDev of the blue line. The thick black line shows a smoothed version of the same series. The smoothing is done using a Hodrick-Prescott filter with a Lambda parameter of 100.

Source: EPFR, J.P. Morgan.
Table A1: Flow Monitor
$bn per week. The first two rows include Mutual Fund and ETF flows globally, i.e.flows for funds domiciled both inside and outside the US(source: EPFR). The last fourrows only include funds domiciled in the US.International Equity funds are equity fundsdomiciled in the US that invest outside the US (source: ICI and Bloomberg FinanceL.P.).
| MF & ETF Flows | 24-Apr | 4 wk avg | 13 wk avg | 2024 avg |
| All Equity | 3.60 | -2.7 | 8.7 | 7.3 |
| All Bond | 4.40 | 9.2 | 10.9 | 10.8 |
| US Equity | -1.92 | -12.1 | -4.3 | -5.5 |
| US Bonds | -1.63 | 3.8 | 8.5 | 8.3 |
| Non-US Equity | 5.52 | 9.4 | 13.0 | 12.8 |
| Non-US Bonds | 6.03 | 5.4 | 2.4 | 2.6 |
| US Taxable Bonds | 1.93 | 2.8 | 2.6 | 3.4 |
| US Municipal Bonds | 0.69 | 0.1 | 0.1 | 0.0 |
| US HG Bonds | 0.06 | 4.7 | 5.1 | 5.0 |
| US HY Bonds | 0.34 | -0.9 | 0.0 | 0.1 |
| US MMFs | 11.44 | -22.6 | 0.2 | 0.0 |
| UCITS Flows | Jan-24 | 3 mth avg | 2023 avg | |
| Euro MMFs | 29.75 | 38.67 | 15.63 | |
| Euro Equities | 0.97 | 4.0 | 0.6 | |
| Euro Bonds | 34.83 | 25.1 | 12.3 |
Source: ICI, EPFR, EFAMA, Bloomberg Finance L.P., and J.P. Morgan.
Table A2: Trading turnover monitor
Volumes are monthly and Turnover ratio is annualised (monthly trading volume annualised divided by the amount outstanding). UST Cash is primary dealer transactions in all US government securities. UST futures are from Bloomberg Finance L.P. JGBs are OTC volumes in all Japanese government securities. Bunds, Gold, Oil and Copper are futures. Gold includes Gold ETFs. Min-Max chart is based on Turnover ratio. For Bunds and Commodities, futures trading volumes are used while the outstanding amount is proxied by open interest. The diamond reflects the latest turnover observation. The thin blue line marks the distance between the min and max for the complete time series since Jan-2005 onwards. Y/Y change is change in YTD notional volumes over the same period last year.

Source: Bloomberg Finance L.P., Federal Reserve, Trace, Japan Securities Dealer Association, WFE, J.P. Morgan.
ETF Flow Monitor (as of 1st May)
Chart A3: Global Cross Asset ETF Flows
Cumulative flow into ETFs as a % of AUM

Source: Bloomberg Finance L.P., J.P. Morgan.
Chart A4: Bond ETF Flows
Cumulative flow into bond ETFs as a % of AUM

Source: Bloomberg Finance L.P., J.P. Morgan.
Chart A5: Global Equity ETF Flows
Cumulative flow into global equity ETFs as a % of AUM

Source: Bloomberg Finance L.P., J.P. Morgan. Note: We include ETFs with AUM > $200mn in all the flow monitor charts. Chart A5 exclude China On-shore (A-share) ETFs from EM and in Japan. We subtract the BoJ buying of ETFs.
Chart A6: Equity Sectoral and Regional ETF Flows
Rolling 3-month and 12-month change in cumulative flows as a % of AUM. Both sorted by 12-month change

Source: Bloomberg Finance L.P., J.P. Morgan.
Short Interest Monitor
Chart A7: Short interest on the EEM and EMB US ETF
Short Interest as a % share of share outstanding.
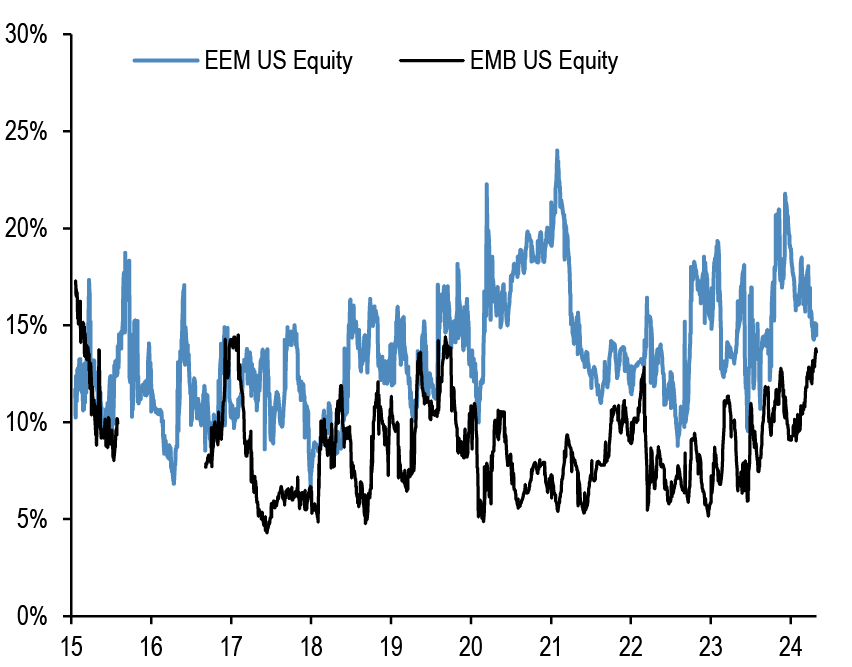
Source: S3, J.P. Morgan
Chart A9: Short interest on the SPY and QQQ US ETF
Short Interest as a % share of share outstanding. Last obs is for 26th Apr 2024.
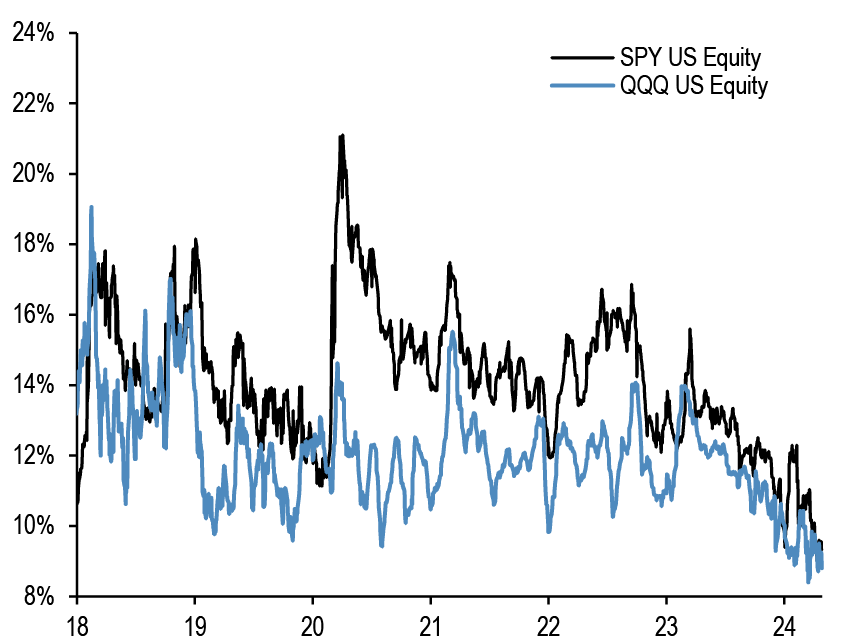
Source: S3, J.P. Morgan
Chart A8: Short interest on the LQD and HYG US ETF
Short Interest as a % share of share outstanding.
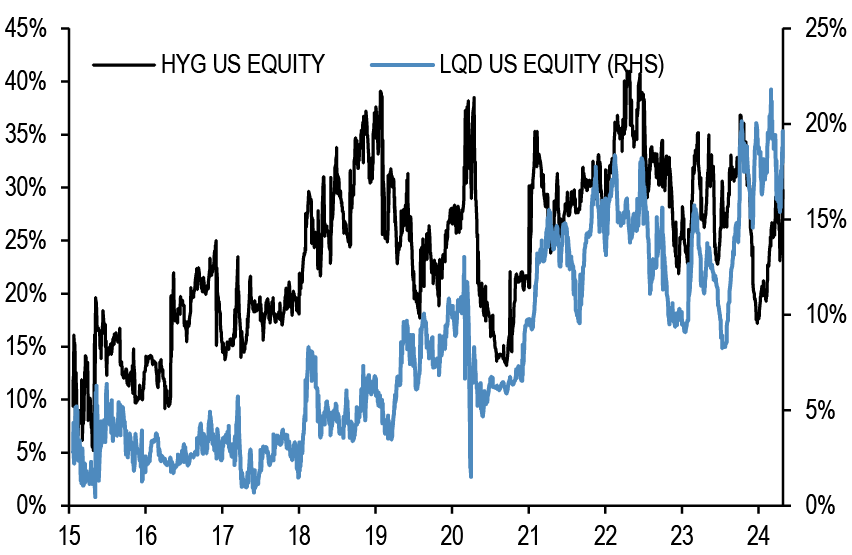
Source: S3, J.P. Morgan
Chart A10: S&P500 sector short interest
Short interest as a % of shares outstanding based on z-scores. A strategy which overweights the S&P500 sectors with the highest short interest z-score (as % of shares o/s) vs. those with the lowest, produced an information ratio of 0.7 with a success rate of 56% (see F&L, Jun 28,2013 for more details).
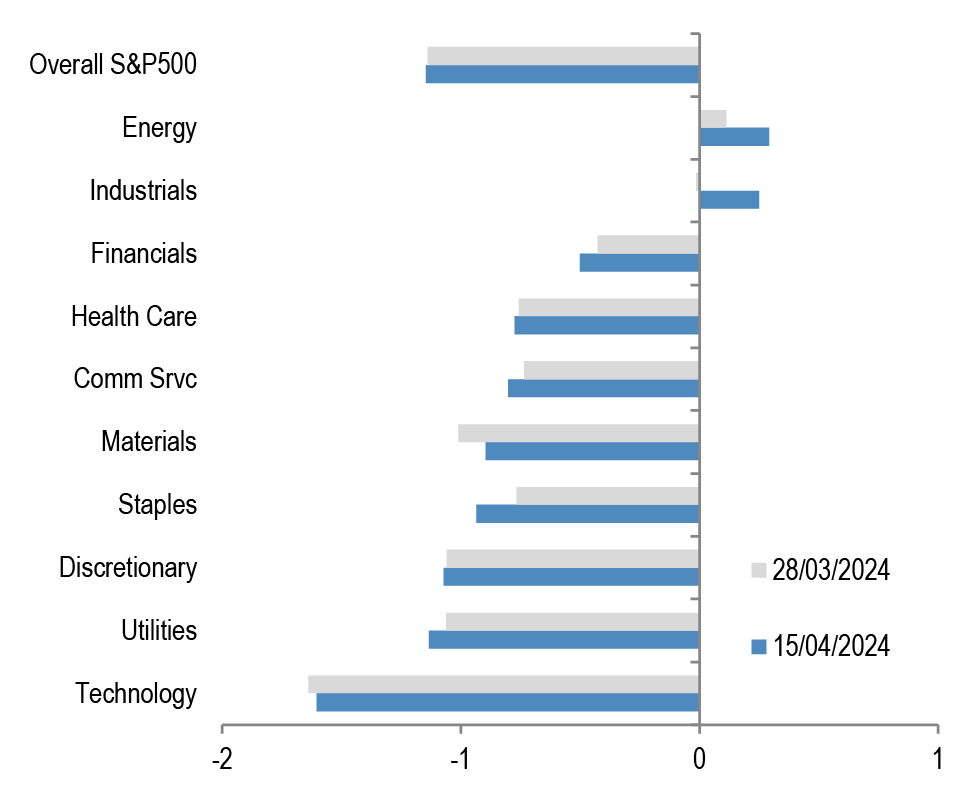
Source: NYSE, Bloomberg Finance L.P., J.P. Morgan
Chart A11a: Cross Asset Volatility Monitor 3m ATM Implied Volatility (1y history) as of 30th Apr-2024
This table shows the richness/cheapness of current three-month implied volatility levels (red dot) against their one-year historical range (thin blue bar) and the ratio to current realised volatility. Assets with implied volatility outside their 25th/75th percentile range (thick blue bar) are highlighted. The implied-to-realised volatility ratio uses 3-month implied volatilities and 1-month (around 21 trading days) realised volatilities for each asset.


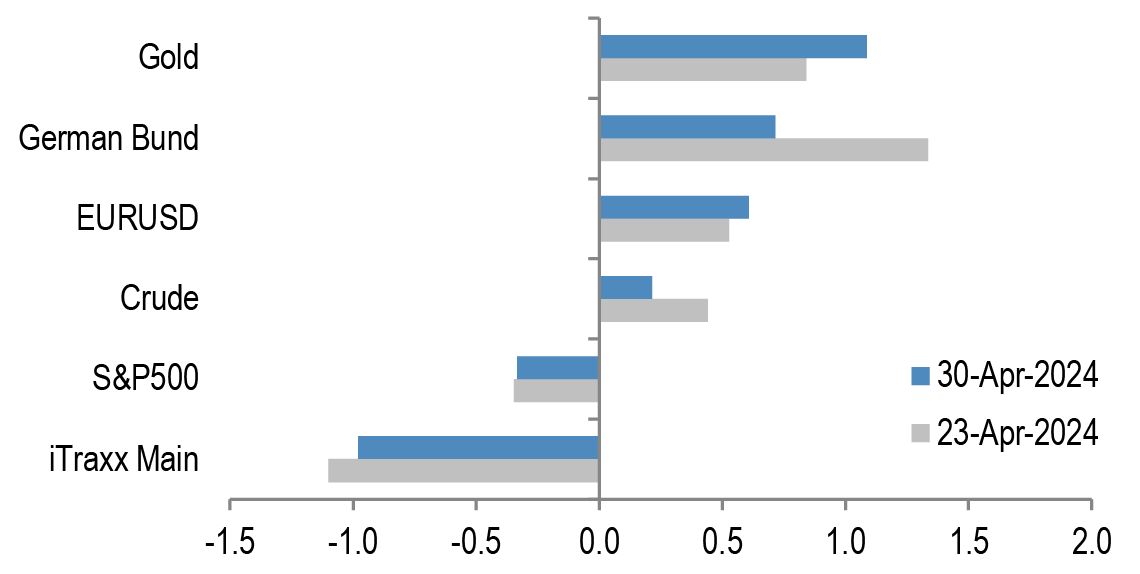
Chart A11b: Option skew monitor
Skew is the difference between the implied volatility of out-of-the-money (OTM) call options and put options. A positive skew implies more demand for calls than puts and a negative skew, higher demand for puts than calls. It can therefore be seen as an indicator of risk perception in that a highly negative skew inequities is indicative of a bearish view. The chart shows z-score of the skew, i.e. the skew minus a rolling 2-year avg skew divided by a rolling two-year standard deviation of the skew. A negative skew on iTraxx Main means investors favour buying protection, i.e. a short risk position. A positive skew for the Bund reflects a long duration view, also a short risk position.
Source: J.P. Morgan.
Chart A11c: Equity-Bond metric map
Explanation of Equity - Bond metric map: Each of the five axes corresponds to a key indicator for markets. The position of the blue line on each axis shows how far the current observation is from the extremes at either end of the scale. For example, a reading at the centre for value would mean that risky assets are the most expensive they have ever been while a reading at the other end of the axis would mean they are the cheapest they have ever been. Overall, the larger the blue area within the pentagon, the better for the risky markets. All variables are expressed as the percentile of the distribution that the observation falls into. I.e. a reading in the middle of the axis means that the observation falls exactly at the median of all historical observations. Value: The slope of the risk-return trade-off line calculated across USTs, US HG and HY corporate bonds and US equities(see GMOS p. 6, Loeys et al, Jul 6 2011 for more details). Positions: Difference between net spec positions on US equities and intermediate sector UST. See Chart A13. Flow momentum: The difference between flows into equity funds (incl. ETFs) and flows into bond funds. Chart A1. We then smooth this using a Hodrick-Prescott filter with a lambda parameter of 100. We then take the weekly change in this smoothed series as shown in Chart A1. Economic momentum:The 2-month change in the global manufacturing PMI. (See REVISITING: Using the Global PMI as trading signal, Nikolaos Panigirtzoglou, Jan 2012). Equity price momentum: The 6-month change in the S&P500 equity index. As of 26th Apr 24.

Source: Bloomberg Finance L.P., J.P. Morgan.
Spec position monitor
Chart A12: Weekly Spec Position Monitor
Net spec positions are proxied by the number of long contracts minus the number of short contracts using the speculative category of the Commitments of Traders reports (as reported by CFTC). To proxy for speculative investors for equity and US Treasury bond futures positions we use Asset managers and leveraged funds (see Chart A13), whereas for other assets we use the legacy Non-Commercial category. This net position is then converted to a dollar amount by multiplying by the contract size and then the corresponding futures price. We then scale the net positions by open interest. The chart shows the z-score of these net positions. US rates is a duration-weighted composite of the individual UST futures contracts excluding the Eurodollar contract.

Source: Bloomberg Finance L.P., CFTC, J.P. Morgan
Chart A14: Spec position indicator on Risky vs. Safe currencies
Difference between net spec positions on risky & safe currencies. Net spec position is calculated in USD across 5 ‘risky’ and 3 ‘safe’ currencies (safe currencies also include Gold). These positions are then scaled by open interest and we take an average of ‘risky’ and ‘safe’ assets to create two series. The chart is then simply the difference between the“risky” and “safe” series. The final series shown in the chart below is demeaned using data since 2006. The risky currencies are: AUD, NZD,CAD, RUB, MXN and BRL. The safe currencies are: JPY, CHF and Gold.
Source: Bloomberg Finance L.P., CFTC, J.P. Morgan.
Chart A13: Positions in US equity futures by Asset managers and Leveraged funds
CFTC positions in US equity futures by Leveraged funds and Asset managers (as a % of open interest). It is an aggregate of the S&P500, DowJones, NASDAQ and their Mini futures contracts.

Source: CFTC, Bloomberg Finance L.P. and J.P. Morgan
Chart A15: Spec position indicator on US equity futures vs. intermediate sector UST futures
Difference between net spec positions on US equity futures vs.intermediate sector UST futures. This indicator is derived by the difference between total CFTC positions in US equity futures by Asset managers + Leveraged Funds scaled by open interest minus the Asset managers + Leveraged Funds spec position on intermediate sector UST futures (i.e. all UST futures duration weighted ex ED and ex 2Y UST futures) also scaled by open interest.
Source: CFTC, Bloomberg Finance L.P. and J.P. Morgan
Mutual fund and hedge fund betas
Chart A16: 21-day rolling beta of 20 biggest active US bond mutual fund managers with respect to the US Agg Bond Index
The dotted line shows the average beta since 2013.

Source: Bloomberg Finance L.P., J.P. Morgan.
Chart A17: 21-day rolling beta of 20 biggest active Euro bond mutual fund managers with respect to the Euro Agg Bond Index
The dotted line shows the average beta since 2013.
Source: Bloomberg Finance L.P., J.P. Morgan.
Chart A18: Performance of various type of investors
The table depicts the performance of various types of investors in % as of 30th Apr 2024.

Source: Bloomberg Finance L.P., HFR, Pivotal Path, J.P. Morgan.
Chart A19: Momentum signals for 10Y UST and 10Y Bunds
Average z-score of Short- and Long-term momentum signal in our Trend Following Strategy framework shown in Tables A3 and A4 below in the Appendix

Source: Bloomberg Finance L.P., J.P. Morgan.
Chart A20: Momentum signals for S&P500
Average z-score of Short- and Long-term momentum signal in our Trend Following Strategy framework shown in Tables A3 and A4 below in the Appendix.
Source: Bloomberg Finance L.P., J.P. Morgan.
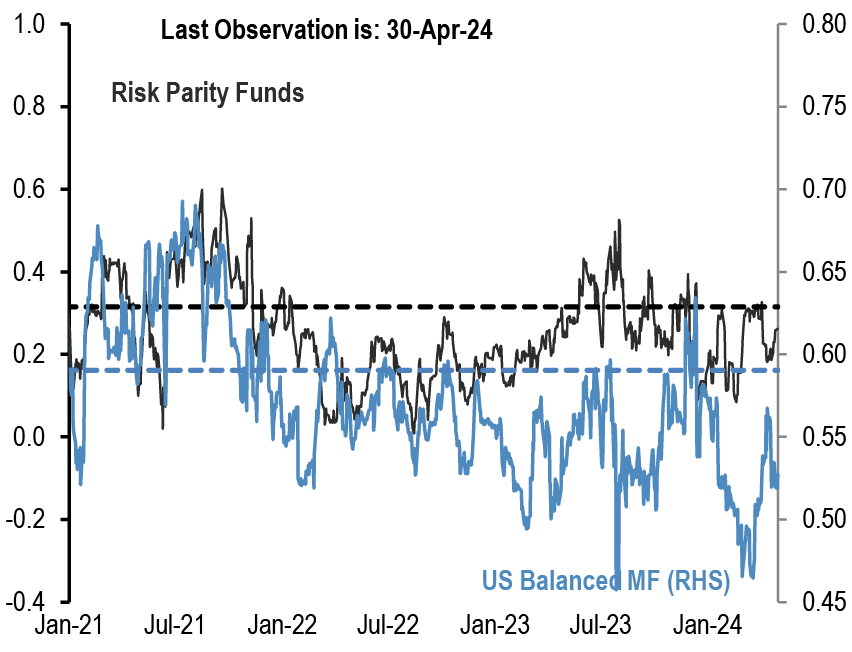
Chart A21: Equity beta of US Balanced Mutual funds and Risk Parity funds
Rolling 21-day equity beta based on a bivariate regression of the daily returns of our Balanced Mutual fund and Risk Parity fund return indices to the daily returns of the S&P 500 and BarCap US Agg indices. Given that these funds invest in both equities and bonds we believe that the bivariate regression will be more suitable for these funds. Our risk parity index consists of 25 daily reporting Risk Parity funds. Our Balanced Mutual fund index includes the top 20 US-based active funds by assets and that have existed since 2006. Our Balanced Mutual fund index has a total AUM of$700bn, which is around half of the total AUM of $1.5tr of US based Balanced funds which we believe to be a good proxy of the overall industry It excludes tracker funds and funds with a low tracking error. Dotted lines are average since 2015.
Source: Bloomberg Finance L.P., J.P. Morgan.
Chart A22: Equity beta of monthly reporting Equity Long/Short hedge funds
Proxied by the ratio of the monthly performance of Pivotal Path Asset-Weighted Equity Hedge fund index divided by the monthly performance of MSCI ACWorld Index.
Source: Bloomberg Finance L.P., Pivotal Path, J.P. Morgan
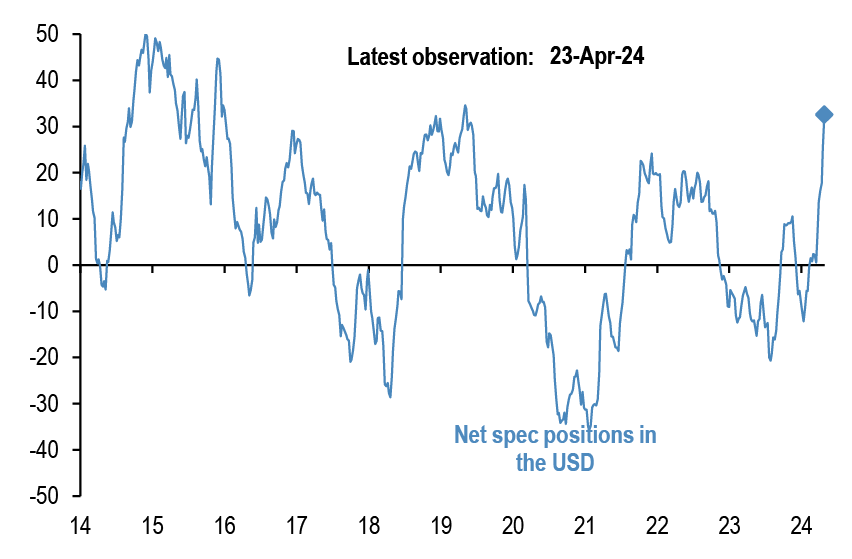
Chart A23: USD exposure of currency hedge funds
The net spec position in the USD as reported by the CFTC. Spec is the non-commercial category from the CFTC.
Source: CFTC, Barclay, Datastream, Bloomberg Finance L.P., J.P. Morgan.
CTAs – Trend following investors’ momentum indicators
Table A3: Simple return momentum trading rules across various commodities
Optimal lookback period of each momentum strategy combined with a mean reversion indicator that turns signal neutral when momentum z-score more than 1.5 standard deviations above or below mean, and a filter that turns neutral when the z-score is low (below 0.05 and above -0.05) to avoid excessive trading. Lookbacks, current signals and z-scores are shown for shorter-term and longer-term momentum separately, along with performance of a combined signal. Annualized return, volatility and
information ratio of the signal; current signal; and z-score of the current return over the relevant lookback period; data from 1999 onward.

Source: Bloomberg Finance L.P., J.P. Morgan calculations.
Table A4: Simple return momentum trading rules across international equity indices, bond futures and FX
Optimal lookback period of each momentum strategy combined with a mean reversion indicator that turns signal neutral when momentum z-score more than 1.5 standard deviations above or below mean, and a filter that turns neutral when the z-score is low (below 0.05 and above -0.05) to avoid excessive trading. Lookbacks, current signals and z-scores are shown for shorter-term and longer-term momentum separately, along with performance of a combined signal. Annualized return, volatility and
information ratio of the signal; current signal; and z-score of the current return over the relevant lookback period; data from 1999 onward.

Source: Bloomberg Finance L.P., J.P. Morgan calculations.
Corporate Activity
Chart A24: G4 non-financial corporate capex and cash flow as % of GDP
% of GDP, G4 includes the US, the UK, the Euro area and Japan. Last observation as of Q4 2023.

Source: ECB, BOJ, BOE, Federal Reserve flow of funds, J.P. Morgan.
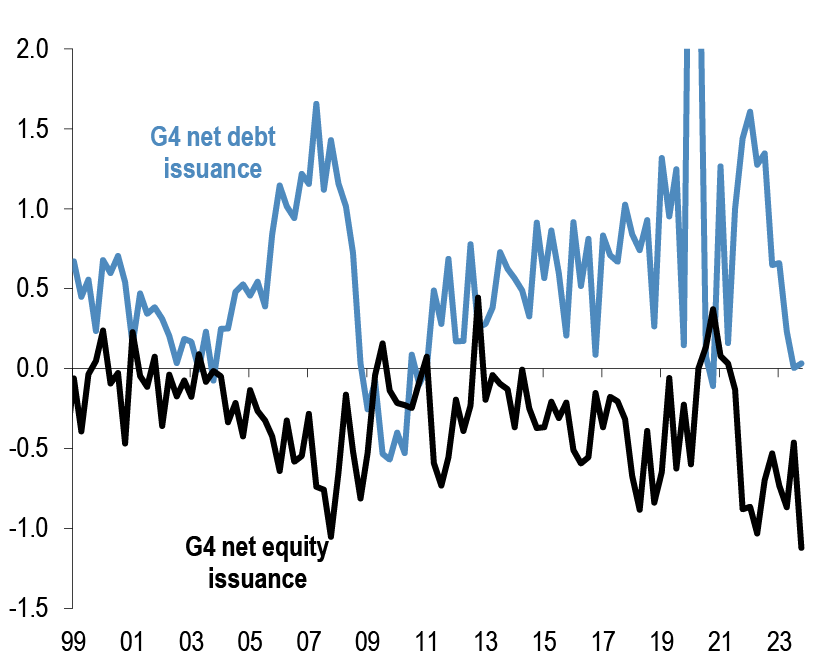
Chart A25: G4 non-financial corporate sector net debt and equity issuance
$tr per quarter, G4 includes the US, the UK, the Euro area and Japan. Last observation as of Q4 2023.
Source: ECB, BOJ, BOE, Federal Reserve flow of funds, J.P. Morgan.
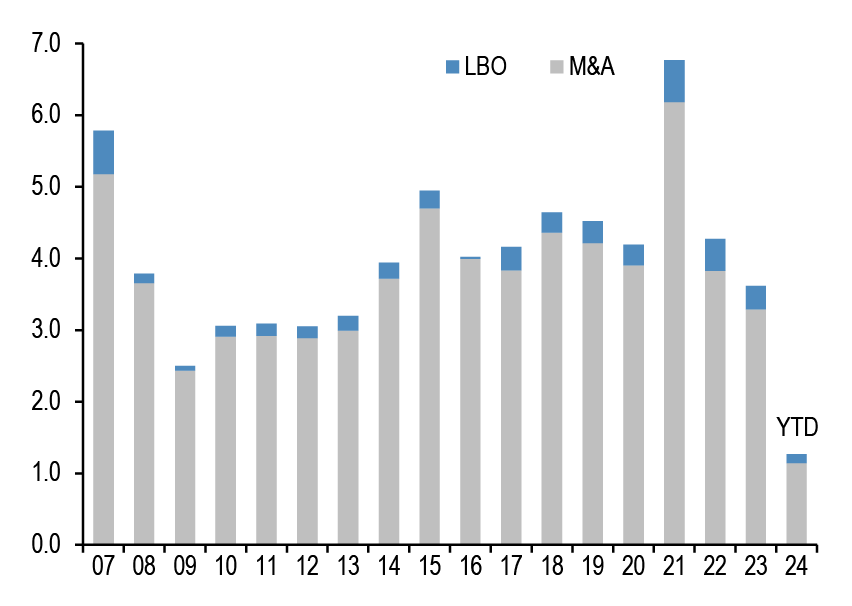
Chart A26: Global M&A and LBO
$tr. M&A and LBOs are announced.
Source: Dealogic, J.P. Morgan.
Chart A27: US and non-US share buyback
$bn, are as of Apr’24. Buybacks are announced.

Source: Bloomberg Finance L.P., Thomson Reuters, J.P. Morgan
Pension fund and insurance company flows
Chart A28: G4 pension funds and insurance companies equity and bond flows
Equity and bond buying in $bn per quarter. G4 includes the US, the UK,Euro area and Japan. Last observation is Q4 2023.

Source: ECB, BOJ, BOE, Federal Reserve flow of funds, J.P. Morgan.
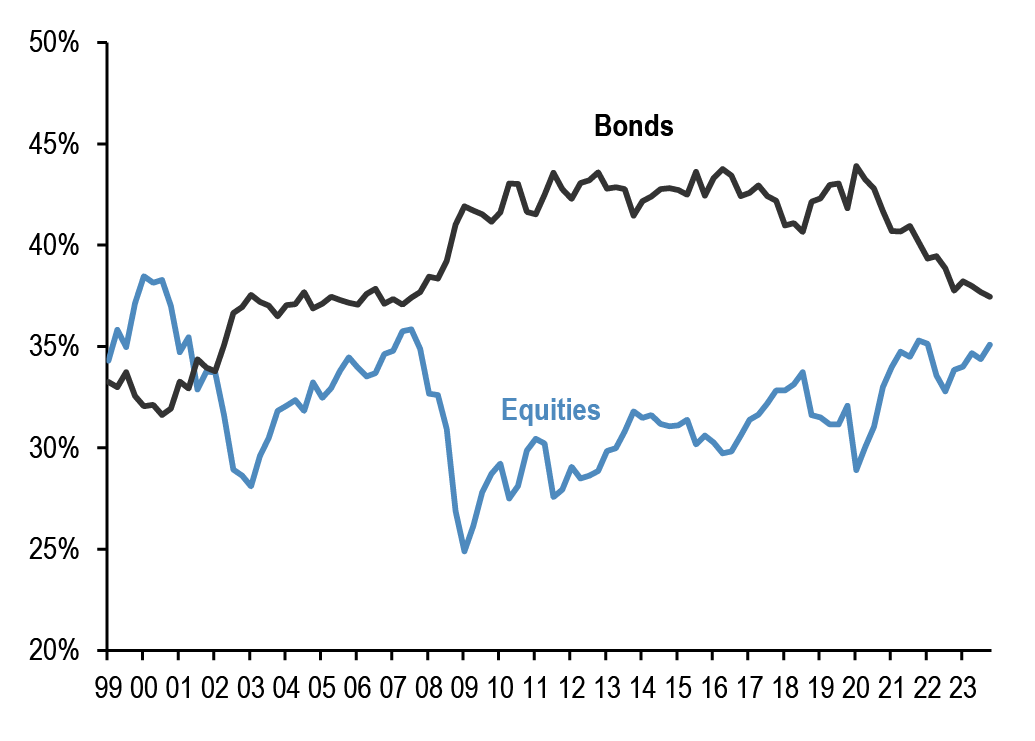
Chart A29: G4 pension funds and insurance companies equity and bond levels
Equity and bond as % of total assets per quarter. G4 includes the US, the UK, Euro area and Japan. Last observation is Q4 2023.
Source: ECB, BOJ, BOE, Federal Reserve flow of funds., J.P. Morgan
Chart A30: Pension fund deficits
US$bn. For US, funded status of the 100 largest corporate defined benefit pension plans, from Milliman. For UK, funded status of the defined benefit schemes eligible for entry to the Pension Protection Fund, converted to US$at today’s exchange rates.
Last obs. is Mar’24 for US & UK.
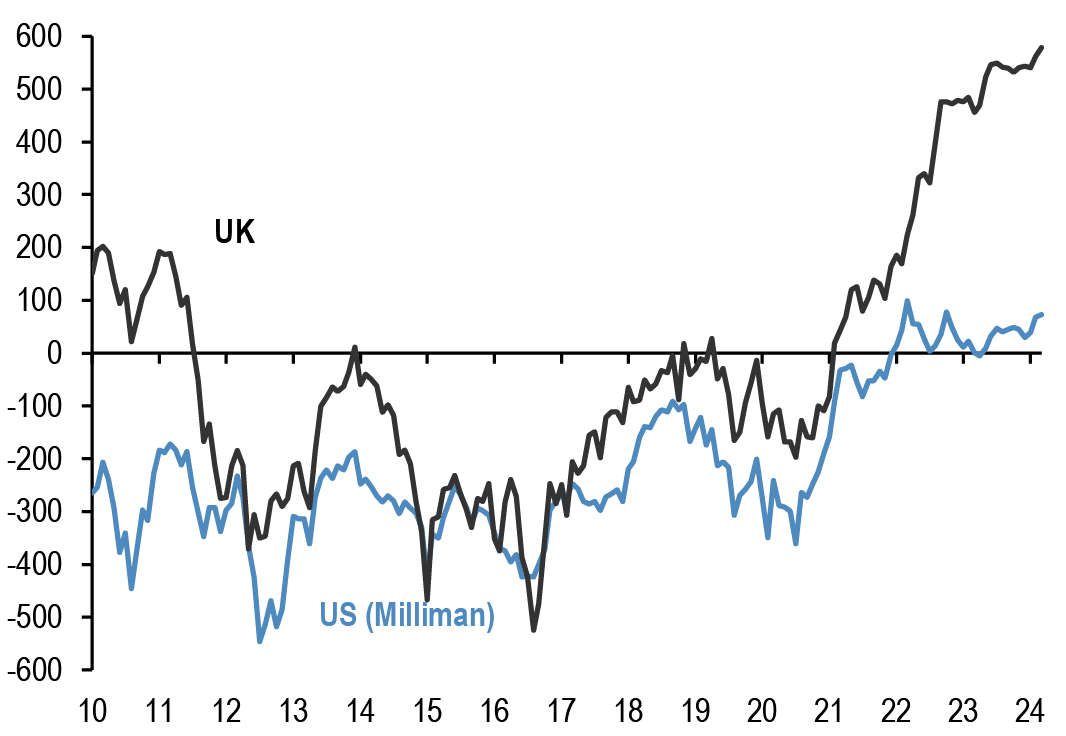
Source: Milliman, UK Pension Protection Fund, J.P. Morgan.
Chart A31: G4 pension funds and insurance companies cash and alternatives levels
Cash and alternative investments as % of total assets per quarter. G4 includes the US, the UK, Euro area and Japan. Last observation is Q4 2023.
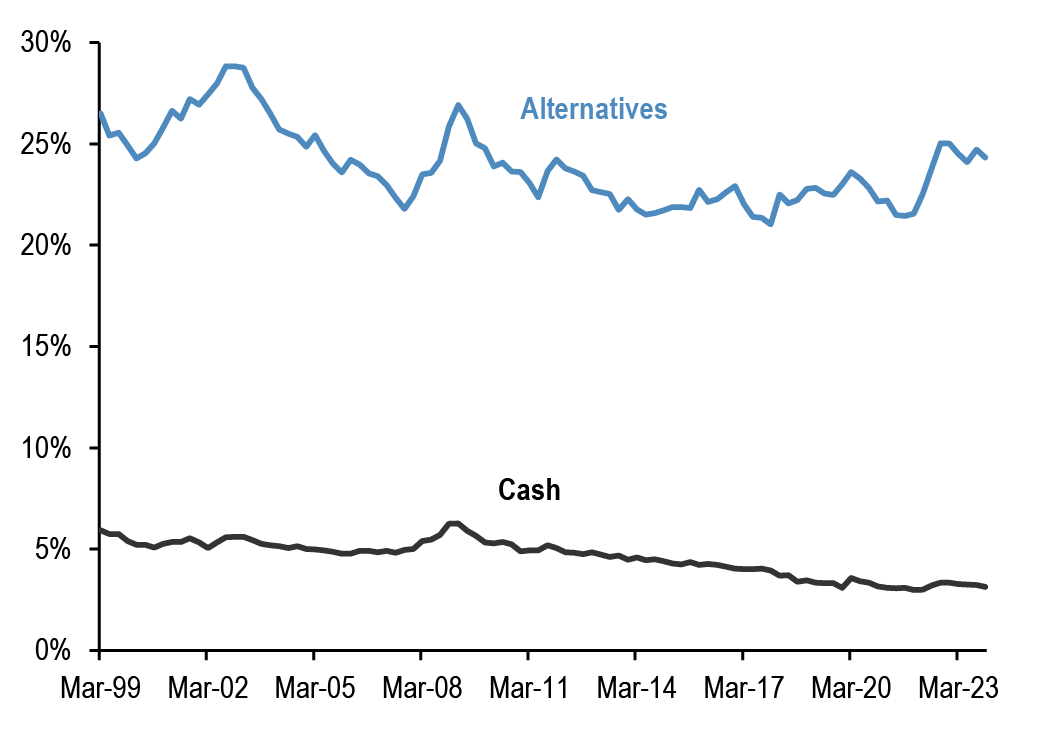
Source: ECB, BOJ, BOE, Federal Reserve flow of funds, J.P. Morgan.
Credit Creation
Chart A32: Credit creation in the US, Japan and Euro area
Rolling sum of 4-quarter credit creation as % of GDP. Credit creation includes both bank loans as well as net debt issuance by non-financial corporations and households. Last obs. is Q4’23 for US, Japan, & Euro Area.
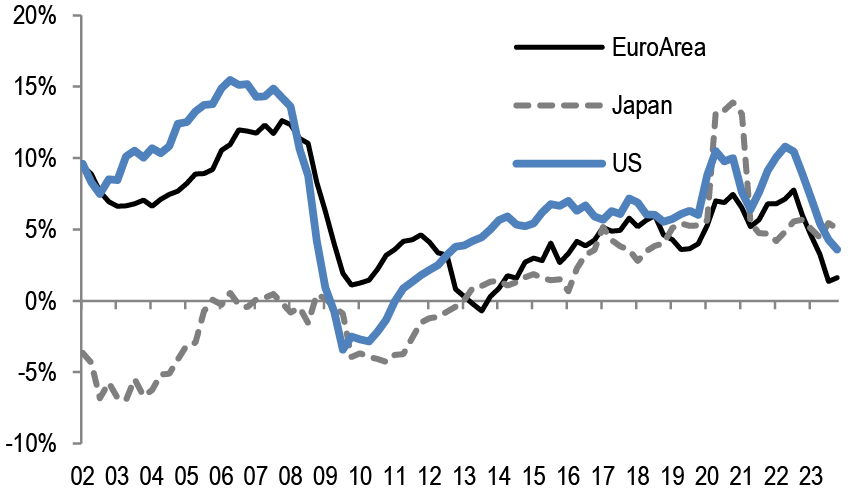
Source: Fed, ECB, BoJ, Bloomberg Finance L.P., and J.P. Morgan calculations.
Chart A33: Credit creation in EM
Rolling sum of 4-quarter credit creation as % of GDP. Credit creation includes both bank loans as well as net debt issuance by non-financial corporations and households. Last obs. is for Q3’23.
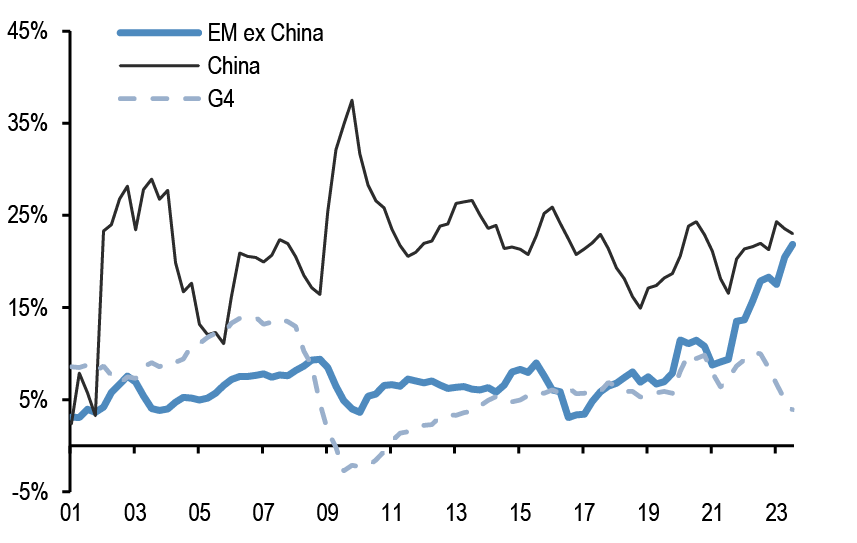
Source: G4 Central banks FoF, BIS, ICI, Barcap, Bloomberg Finance L.P., IMF, and J.P.Morgan calculation
Chart A34: Monthly net issuance of US HG bonds
$bn. Mar 2024.
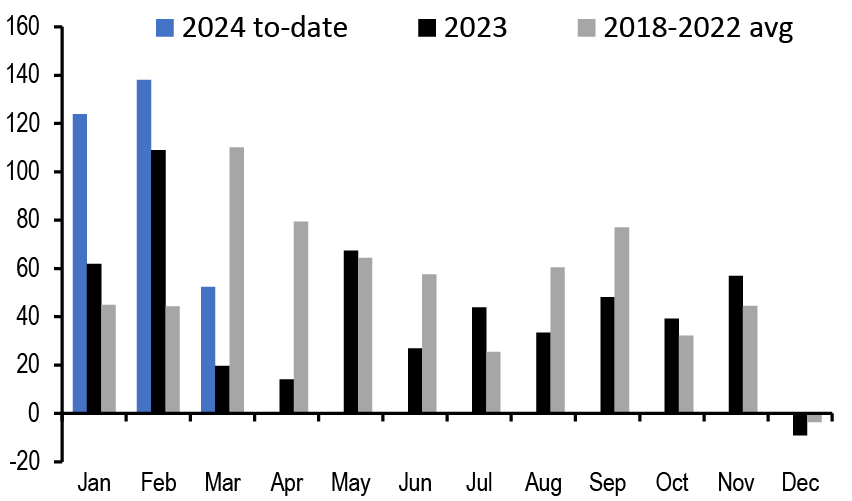
Source: Dealogic, J.P. Morgan
Table A5: Equity and Bond issuance
$bn, Equity supply and corporate announcements are based on announced deals, not completed. M&A is announced deal value and buybacks are announced transactions. Y/Y change is change in YTD announcements over the same period last year.
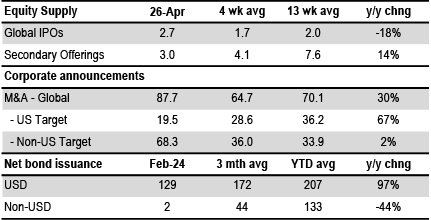
Source: Bloomberg Finance L.P., Dealogic, Thomson Reuters, J.P. Morgan.
Bitcoin monitor
Chart A35: Our Bitcoin position proxy based on open interest in CME Bitcoin futures contracts
In number of contracts. Last obs. for 1st Apr 2024.
Source: Bloomberg Finance L.P., J.P. Morgan
Chart A36: Cumulative Flows in all Bitcoin funds and Gold ETF holdings
Both the y-axis in $bn.
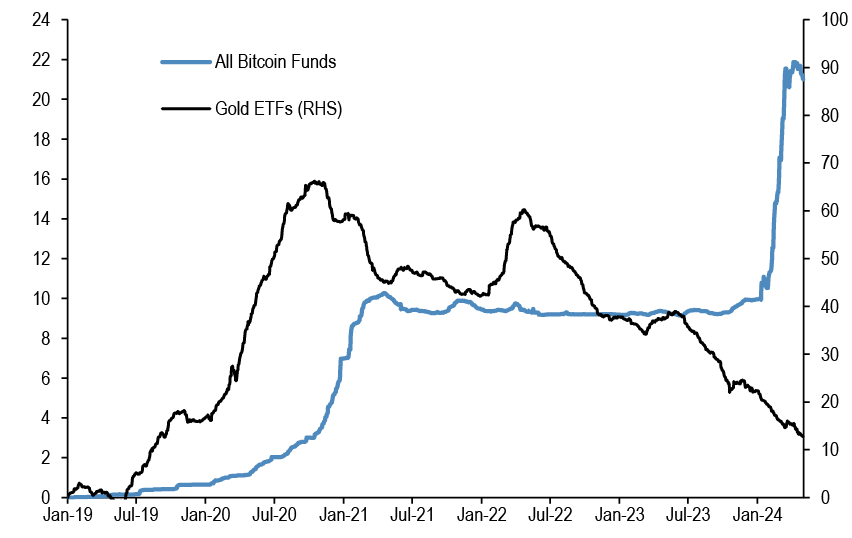
Source: Bloomberg Finance L.P., J.P. Morgan.
Chart A37: Ratio of Bitcoin market price to production cost
Based on the cost of production approach following Hayes (2018).
Source: Bitinfocharts, J.P. Morgan
Chart A38: Flow pace into publicly-listed Bitcoin funds including Bitcoin ETFs
$mm per week, 4-week rolling average flow.
Source: Bloomberg Finance L.P., J.P. Morgan.
Japanese flows and positions
Chart A39: Tokyo Stock Exchange margin trading: total buys minus total sells
In bn of shares. Topix on right axis.

Source: Tokyo Stock Exchange, Bloomberg Finance L.P., J.P. Morgan.
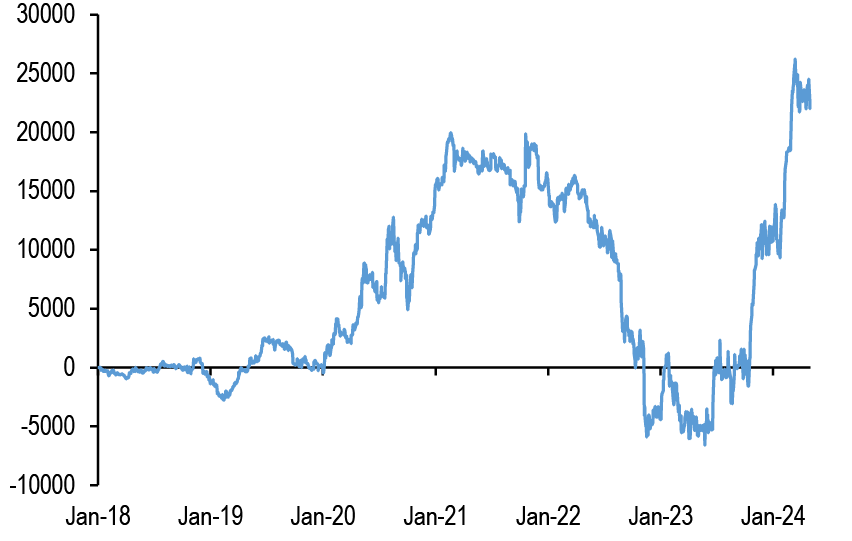
Chart A40: Monthly net purchases of Japanese bonds and Japanese equities by foreign residents
$bn, Last weekly obs. is for 19th Apr’ 24.
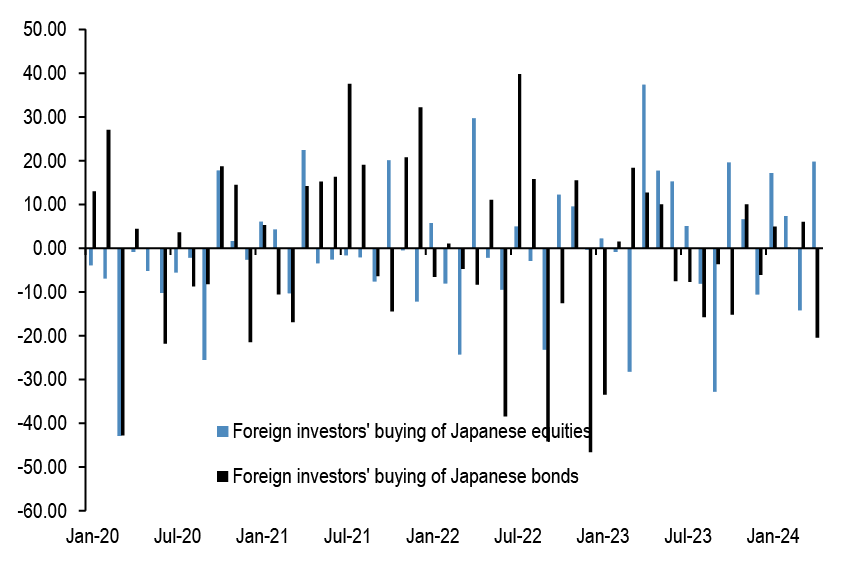
Source: Japan MoF, Bloomberg Finance L.P., and J.P. Morgan.
Chart A41: Monthly net purchases of foreign bonds and foreign equities by Japanese residents
$bn, Last weekly obs. is for 19th Apr’ 24.

Source: Japan MoF, Bloomberg Finance L.P., and J.P. Morgan.
Chart A42: Overseas CFTC spec positions
CFTC spec positions are in $bn. For Nikkei we use CFTC positions in Nikkei futures (USD & JPY) by Leveraged funds and Asset managers.
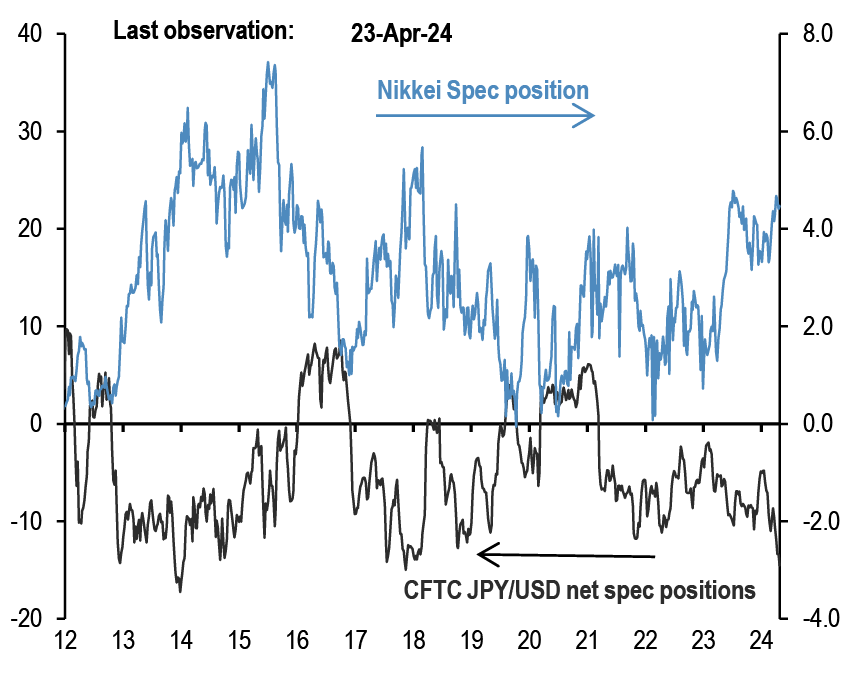
Source: Bloomberg Finance L.P., CFTC, J.P. Morgan calculations.
Commodity flows and positions
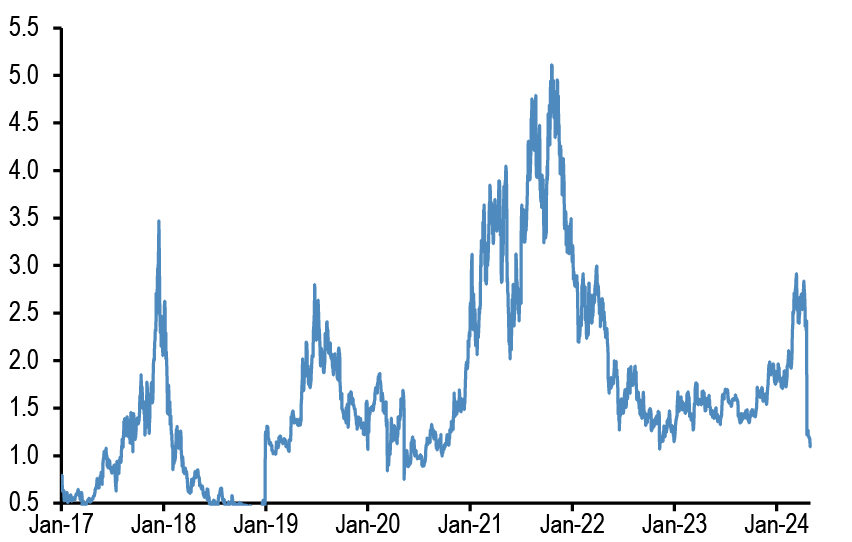
Chart A43: Gold spec positions
$bn. CFTC net long minus short position in futures for the Managed Money category.
Source: CFTC, Bloomberg Finance L.P., J.P. Morgan.
Chart A44: Gold ETFs
Mn troy oz. Physical gold held by all gold ETFs globally.
Source: Bloomberg Finance L.P., J.P. Morgan.
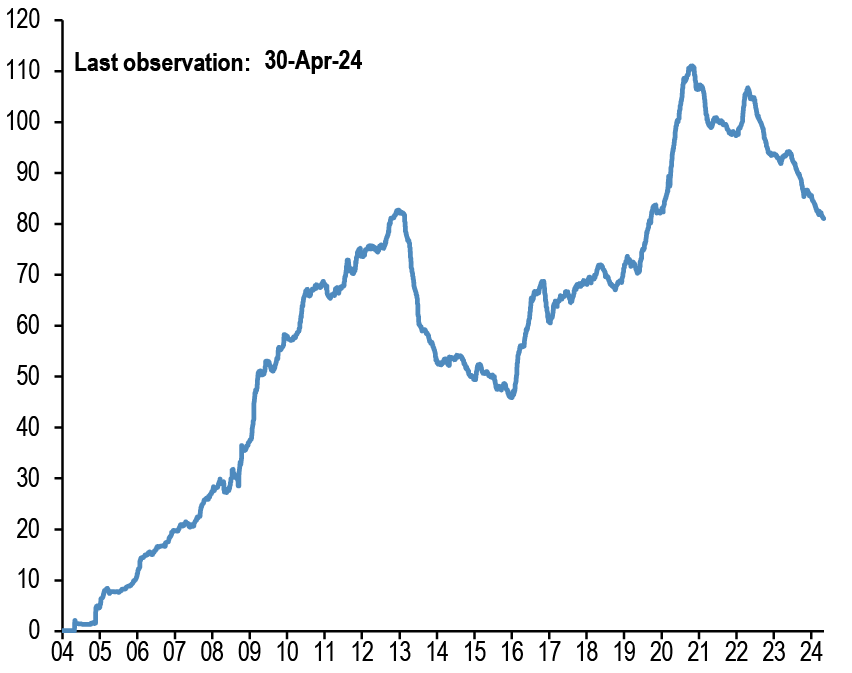
Chart A45: Oil spec positions
Net spec positions divided by open interest. CFTC futures positions for WTI and Brent are net long minus short for the Managed Money category.
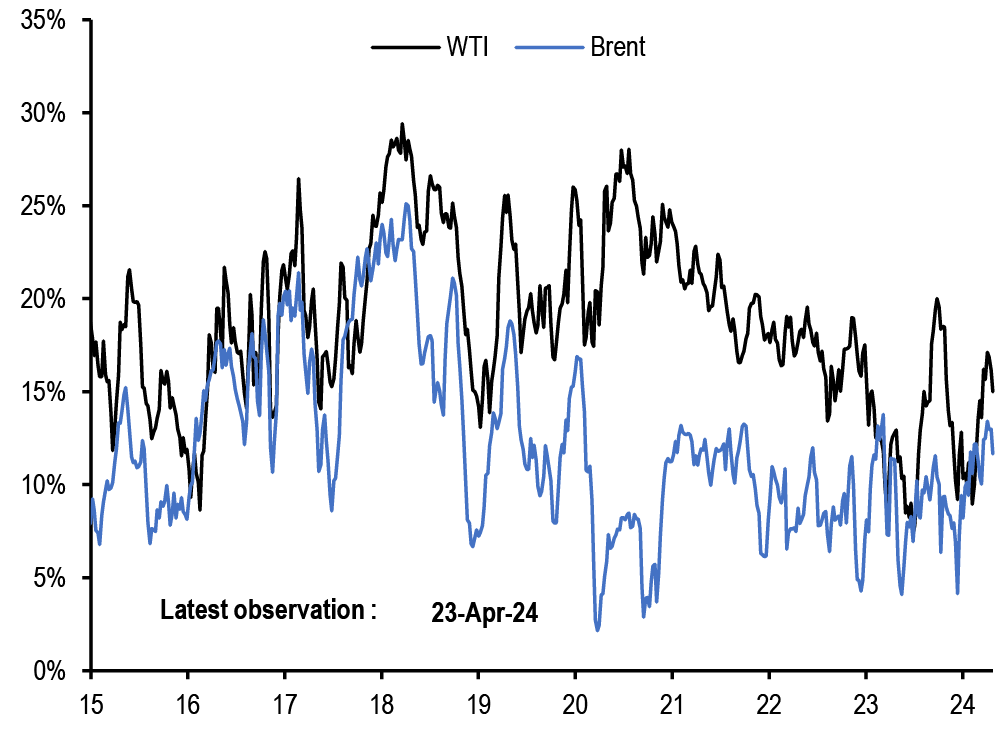
Source: CFTC, Bloomberg Finance L.P., J.P. Morgan.
Chart A46: Energy ETF flows
Cumulative energy ETFs flow as a % of AUM. MLP refers to the Alerian MLP ETF.

Source: CFTC, Bloomberg Finance L.P., J.P. Morgan.
Corporate FX hedging proxies
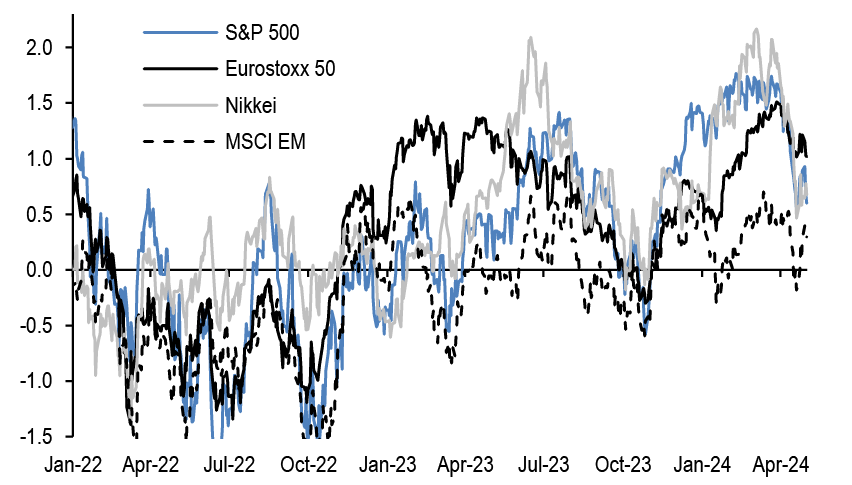
Chart A47: Average beta of Eurostoxx 50 companies and Eurostoxx Small-Cap to trade-weighted EUR
Rolling 26 weeks average betas based on a bivariate regression of the weekly returns of individual stocks in the Eurostoxx 50 index to the weekly returns of the MSCI AC World and JPM EUR Nominal broad effective exchange rate (NEER).

Source: Bloomberg Finance L.P., J.P. Morgan
Chart A48: Average beta of S&P500 companies to trade-weighted US dollar
Rolling 26 weeks average betas based on a bivariate regression of the weekly returns of stocks in the S&P500 index to the weekly returns of the MSCI AC World and JPM USD Nominal broad effective exchange rate(NEER).
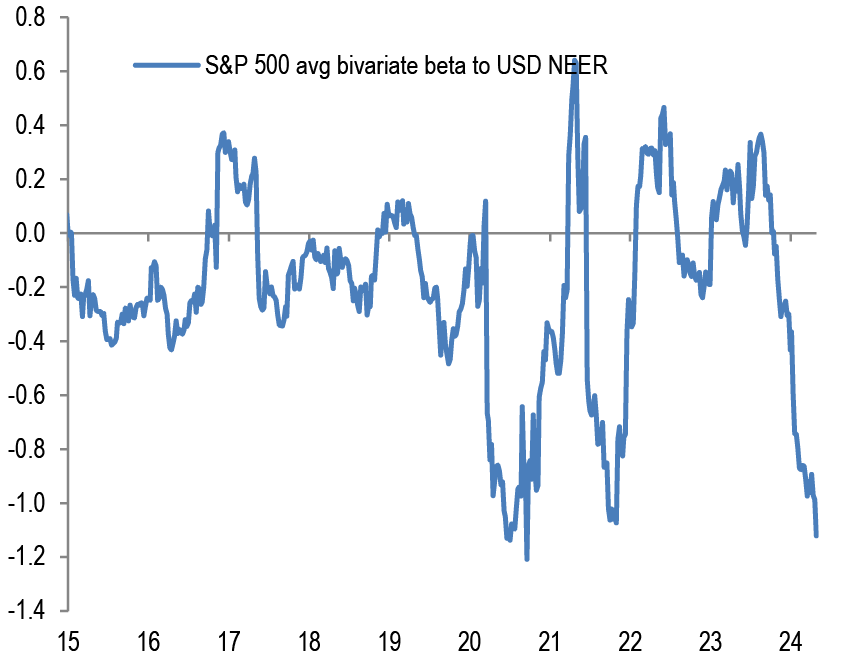
Source: Bloomberg Finance L.P., J.P. Morgan
Chart A49: Average beta of FTSE 100 companies to trade-weighted GBP
Rolling 26 weeks average betas based on a bivariate regression of the weekly returns of individual stocks in the FTSE 100 index to the weekly returns of the MSCI AC World and JPM GBP Nominal broad effective exchange rate (NEER).

Source: Bloomberg Finance L.P., J.P. Morgan
Chart A50: Average beta of MSCI EM companies to trade-weighted EM Currency Index
Rolling 26 weeks average betas based on a bivariate regression of the weekly returns of individual stocks in the MSCI EM index to the weekly returns of the MSCI AC World and JPM EM Nominal broad effective exchange rate (NEER).
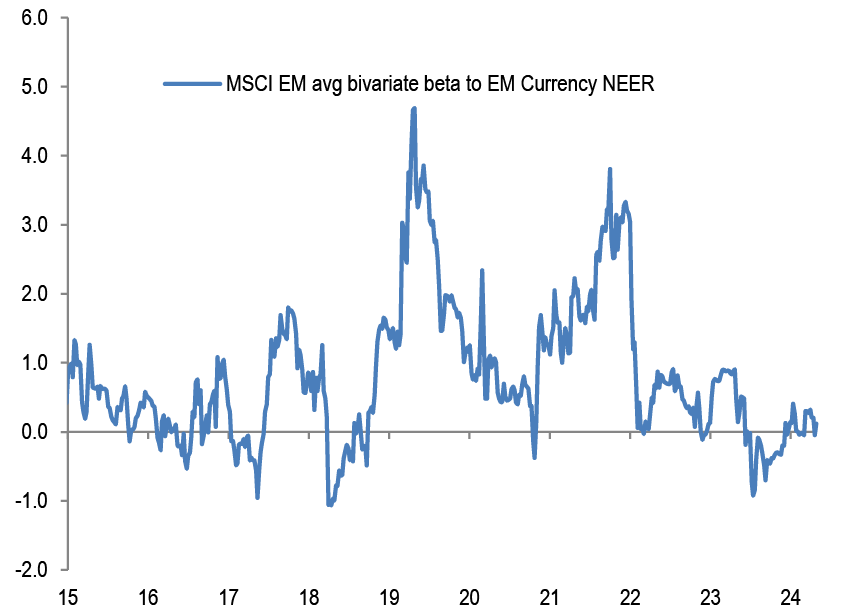
Source: Bloomberg Finance L.P., J.P. Morgan
Non-Bank investors’ implied allocations
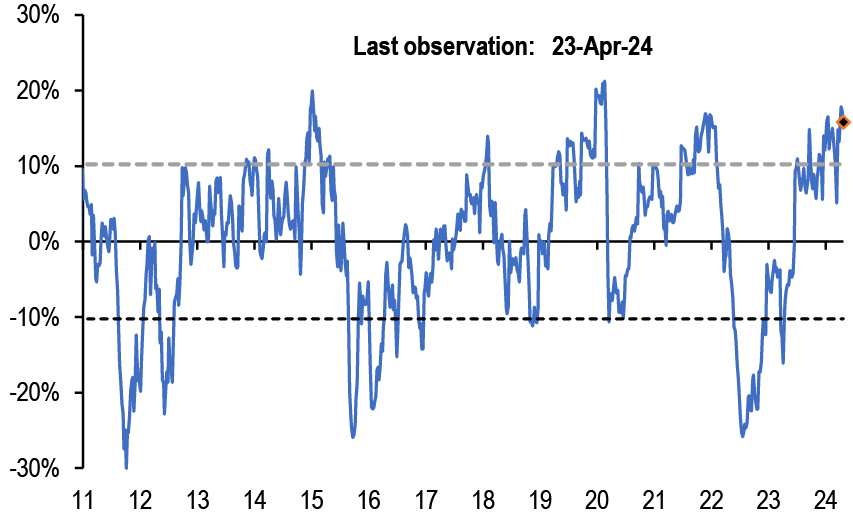
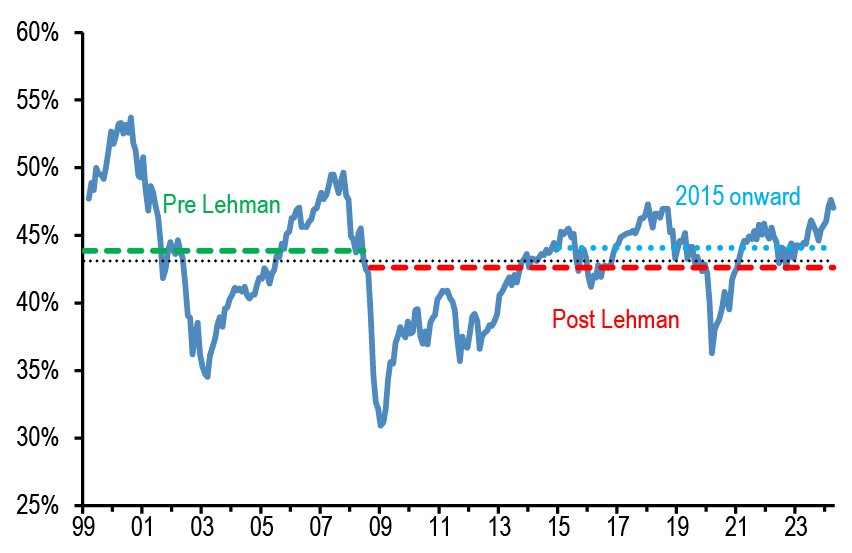
Chart A51: Implied equity allocation by non-bank investors globally
Global equities as % total holdings of equities/bonds/M2 by non-bank investors. Dotted lines are averages.
Source: Bloomberg Finance L.P., J.P. Morgan
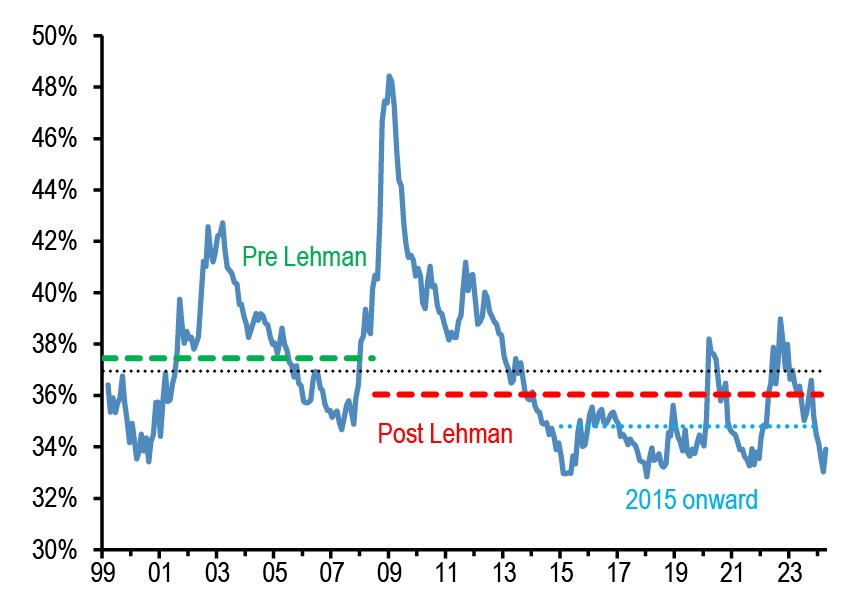
Chart A52: Implied bond allocation by non-bank investors globally
Global bonds as % total holdings of equities/bonds/M2 by non-bank investors. Dotted lines are averages.

Source: Bloomberg Finance L.P., J.P. Morgan
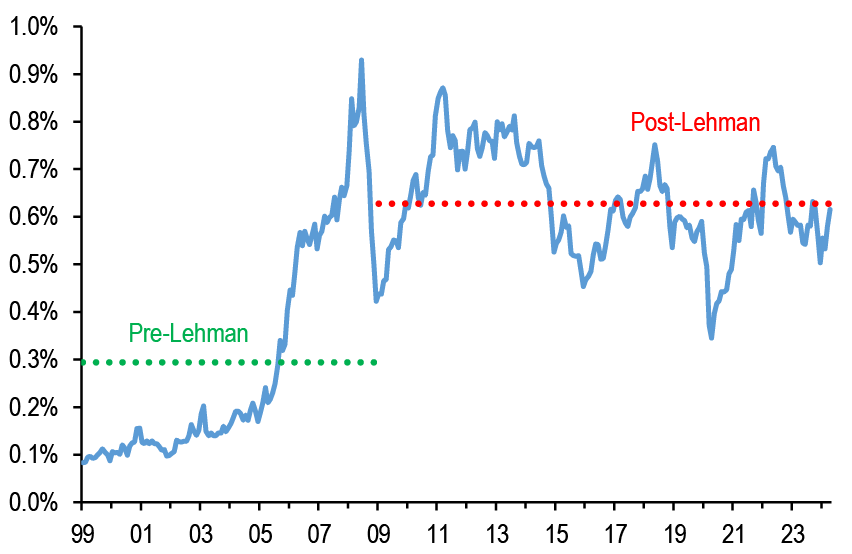
Chart A53: Implied cash allocation by non-bank investors globally
Global cash held by non-bank investors as % total holdings of equities/bonds/M2 by non-bank investors. Dotted lines are averages.
Source: Bloomberg Finance L.P., J.P. Morgan
Chart A54: Implied commodity allocation by non-bank investors globally
Proxied by the open interest of commodity futures ex gold as % of the stock of equities, bonds and cash held by non-bank investors globally.
Source: Bloomberg Finance L.P., J.P. Morgan