
Global Fixed Income Markets Weekly
Idiosyncratic paces: it’s time to adjust
- Overview: Idiosyncratic macro dynamic came to the forefront of rates markets this week with a notable outperformance of EUR rates in a bull steepening move, driven by weak Euro area flash PMI for September and selective inflation data in France and Spain. Higher conviction in the broad disinflation process in the Euro area and downside risk on growth triggered a change in our ECB call. We view this as a shift in fundamentals and now expect the ECB to deliver back-to-back 25bp cuts starting in October, reaching 2% policy rate in June 2025, earlier than our previous call for September 2025. Risks are biased for even lower terminal even in absence of a recession. We refresh our indices to capture the Intensity of Expected policy rate Normalisation (IEN) as a function of the amount of easing priced in the OIS curve and of the proximity of the trough. Across US, Euro area and UK current IEN indices are now pricing a more aggressive normalisation than in late December 2023 with lower terminal and earlier troughs. Bullish duration bias expressed mostly via option structures or long real yields in Euro area, and long 5Y gilts in UK.
- Euro: Maintain bullish duration bias on risks of markets overshooting/pricing higher recession risks. Stay OW intra-EMU/€-SSA via OW 10Y Spain vs. Germany, OW 10Y EU vs. swap and OW 5-7Y KfW vs. Germany. Enter 5s/10s France steepener vs. Germany. Take profit on 10s/30s Italy flattener vs. Germany and long 5Y Italy CDS cash basis. Take profit and re-strike 1Yx1Y receiver spread versus OTM payer to enter at a net credit reflecting our increasing conviction of a limited back up in reds. Take profit in 2s/5s conditional bull steepener. Take profit and re-strike 2s/5s/10s conditional bull-belly cheapener via 3M receivers. Hold 10s/30s swap curve tactical flatteners hedged versus longs in reds (16% risk) on RV considerations. Keep Dec24 Schatz €STR swap spread widener as convex risk-off hedge to our long carry portfolio. Expect directionality to intra-EMU spreads to increase in a flight to quality/risk-off move potentially driven by macro or geopolitical concerns. Neutral on Bund swap spread. Initiate Dec24 Schatz/Bund €STR swap spread curve flattener. Sell 3Mx30Y gamma with infrequent delta hedging; stay short 6Mx10Y unhedged straddles.
- UK: Enter tactical longs in 5Y gilts on relative valuations and asymmetric risks around US labour market data. Keep paying belly Mar25/May25/Jun25 MPC OIS fly. 10s/30s gilt curve is too steep on an RV basis. Go long belly 10s/30s/50s gilt fly (50:50). Keep 10Y swap spread narrower. Stay short 3Mx10Y unhedged straddle. We entered 10s/30s RPI swap curve flatteners.
- US: If our above-consensus unemployment rate forecast come to fruition, this should bias Treasury yields lower in the near-term. We recommend expressing this bullish view with curve steepeners: curves look less steep when we also adjust for the market’s medium-term inflation expectations and the Fed’s share of the Treasury market: initiate 3s/20s steepeners. We discuss historical bear steepening periods over the last 35 years, particularly other instances when these moves took place alongside Fed easing: overall, the curve tends to consolidate after a brief bout of steepening, and long-end yields tend to stabilize or move lower as the Fed eases further. We review the tenth annual Treasury market conference, focusing on the panel discussions. T-bill supply is about to turn positive and we see $270bn of net issuance in the Oct-Nov period. Front-end bills are in the richer quartiles of their recent ranges, and the combinations of positive supply and quarter-end dynamics support some cheapening in the near term; risks are more balanced further out the T-bill curve. Stay neutral TIPS but hold energy-hedged 5s/10s BE curve steepeners. A strike among ILA dockworkers appears likely which could disrupt supply chains and push up CPI inflation around the end of the year. The bear steepening of the curve in recent weeks is partly explained by moves in long term inflation expectations, which is also helping to spur second-principal component volatility higher - underweight volatility on 10-year tails versus 30-year tails, overweight 2-year tail volatility versus 5-year tails, and overweight 5s/30s YCSO volatility versus swaptions. Stay neutral on swap spreads outright, but initiate exposure to a steeper 7s/10s maturity matched swap spread curve. Turn tactically neutral on volatility on an outright basis ahead of next week’s data.
- Japan: Former Secretary-General Ishiba won the LDP leadership election. As the market priced in a Takaichi win scenario, we expect yields to reprice higher and curves to flatten in coming days. Keep 2s/10s JGB curve flatteners.
- Australia & New Zealand: Stay paid AUD 1s/2s IRS curve, and received AUD 5Yx5Y vs. US. Stay paid the Nov ’24/Feb ’25 RBNZ OIS spread ACGB Apr-2026s on ASW.
Overview
Idiosyncratic paces: it’s time to adjust
- Idiosyncratic macro dynamic came to the forefront of rates markets this week, with a notable outperformance of EUR rates in a bull steepening move, driven by a weak Euro area flash PMI for September and selective inflation data in France and Spain. Higher conviction in the broad disinflation process in the Euro area and downside risk on growth triggered a change in our ECB call. We reckon this is a shift in fundamentals and now expect the ECB to deliver back-to-back 25bp cuts starting in October, reaching 2% policy rate in June 2025, earlier than our previous call for September 2025. Risks are biased for even lower terminal even in the absence of a recession. We refresh our indices to capture the Intensity of Expected policy rate Normalisation (IEN) as a function of the amount of easing priced in the OIS curve and of the proximity of the trough. Across US, Euro area and UK current IEN indices are now pricing a more aggressive normalisation than in late December 2023, with lower terminal and earlier troughs. Bullish duration bias expressed mostly via option structures or long real yields in the Euro area, and long 5Y gilts in the UK.
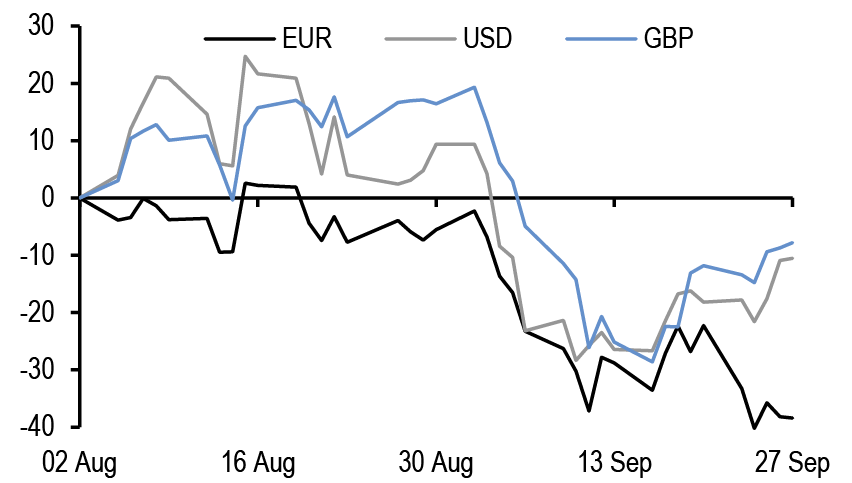
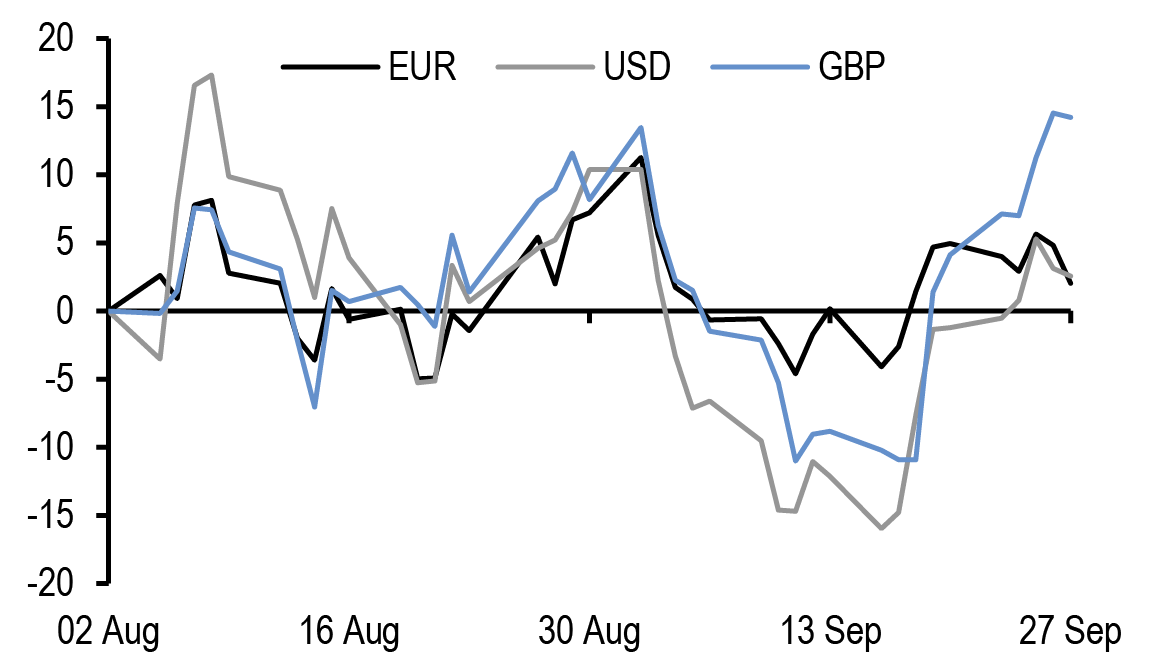
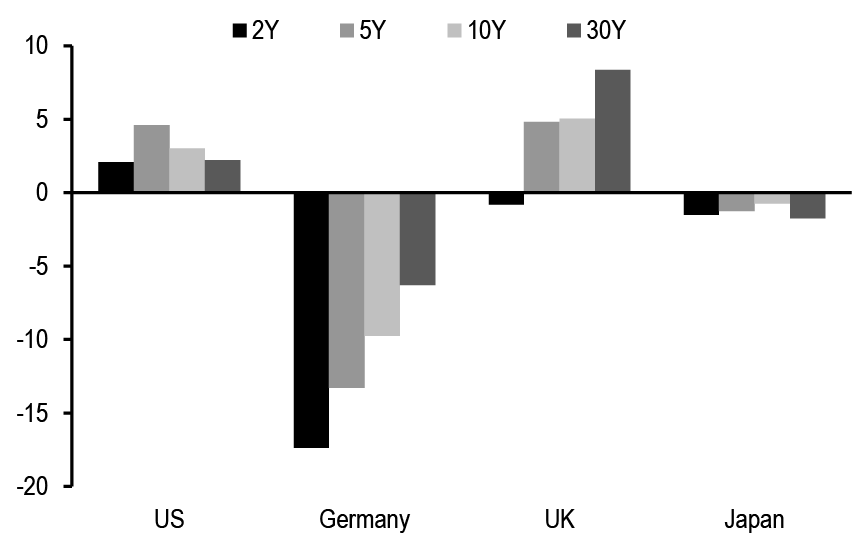
Idiosyncratic macro dynamic came to the forefront of rates markets this week with a notable outperformance of EUR rates in a bull steepening move ( Figure 1), led by a short-end rally of around around 17bp. The outperformance of the Euro area was driven by a weak flash PMI for September and selective inflation data in France and Spain. UK rates twist steepened with a 5-8bp sell-off at the long-end of the curve, while in the US rates sold off modestly relative to last week.
Figure 1: Idiosyncratic macro dynamic came to the forefront of rates markets this week with a notable outperformance of EUR rates in a bull steepening move
Cumulative change in 1Yx1Y OIS rate in EUR, USD and GBP; since Aug 2024; bp
Source: J.P. Morgan.
Cumulative change in in 5Yx5Y OIS rate in EUR, USD and GBP; since Aug 2024; bp
Source: J.P. Morgan.
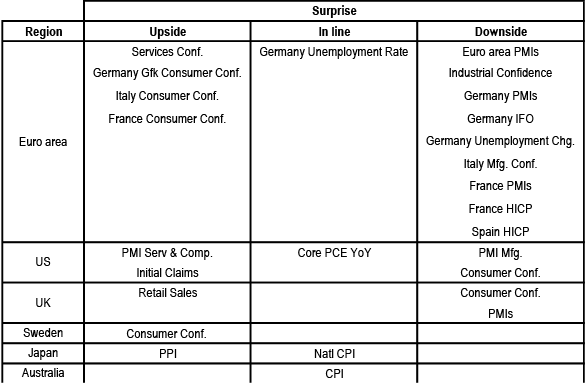
Euro area data was particularly in focus, given the release of the September PMIs, the consumer confidence readings, inflation data in France and Spain and the German employment report over the past week. The September PMIs delivered a disappointment, with the strongest weakness showing up in France and Germany; the German IFO also printed below expectations further reinforcing the PMI disappointment. While the weakness in the French survey could be rationalized as an Olympics-related retracement, the more acute miss in Germany (and the modest softening also in other countries) raises doubts over the growth outlook. Of particular concern was the weakness registered in the PMI employment index in Germany, which was further confirmed by the downside surprise in the unemployment data released later in the week. Indeed, while German production had been depressed for a while and services had been slowing down, the recent data indicate that this is now accompanied also by a softening in the labour market. Despite consumer confidence still being quite strong, we now believe that risks to growth are tilting. As discussed in Both sides now:Widening global growth tails, B. Kasman, 26 September, we continue to see around 35% probability of recession globally over the coming months, but the recent data indicate that the tail risks around our forecast are widening, being the lowest in the US but the highest in the Euro area. On the inflation side, CPI Spain and France considerably missed expectations, with energy prices being the major driver of the decline in both countries even though also core inflation dropped below expectations in Spain and services disinflation was noted in the French press release. We still have to see the inflation numbers for the rest of the Euro area, but we believe that the Spanish and French prints already suggest a higher conviction in the broad disinflation process in the Euro area.
All in all, we believe that this week’s data have moved the needle and give reason to believe that the ECB will have to break away from its gradual stance given the signs of weakening on the growth side. We have thus changed our ECB call (see ECB to go meeting-by-meeting, starting in October, G. Fuzesi, 27 September) and now expect the next ECB cut at the upcoming October meeting (vs. December previously) and consecutive 25bp cuts thereafter (while we had previously penciled in back-to-back cuts only from March 2025). Concerns about services inflation are likely still there, but there is a strong case for delivering cuts a bit more quickly to help avoid a more abrupt growth slowdown and thus a disorderly disinflation process. We believe that the Governing Council could easily shift its rhetoric and present the October cut as an “insurance” cut and not pre-commit to a particular path thereafter. We believe that the ECB will reach a terminal rate of 2% in June. We note that this remains our best guess for neutral rate, but there are risks that the ECB could cut rates even below 2%, even in absence of a recession, given the possibility of inflation undershooting due to a lower r*. Risks around medium-term inflation indeed remain balanced on both sides in the Euro area more than elsewhere.
Turning to central banks, this week the RBA left policy rates on hold at 4.35% with the overall delivery being perceived by markets as less hawkish relative to previous meetings given the absence of a discussion on rate hikes. The board seemed to indicate that they are not yet confident on inflation but they appeared less dismissive on rate cuts. Our economists continue to call for a start of easing in February 2025 given our expectation that inflation would annualize within the target band in 2H24; however, there are risks of an earlier cut if inflation slows at a faster than expected pace. On Wednesday, the Riksbank cut rates by 25bp in the morning to 3.25% and signaled rates would likely cut at the two remaining meetings of the year. The Riksbank communication was broadly dovish as they highlighted the possibility of a 50bp cut, even though this was not evident from the official rate path which showed 100% probability of two 25bp cuts in 2024. Finally, this week also the SNB cut the policy rate another 25bp, down to 1%.
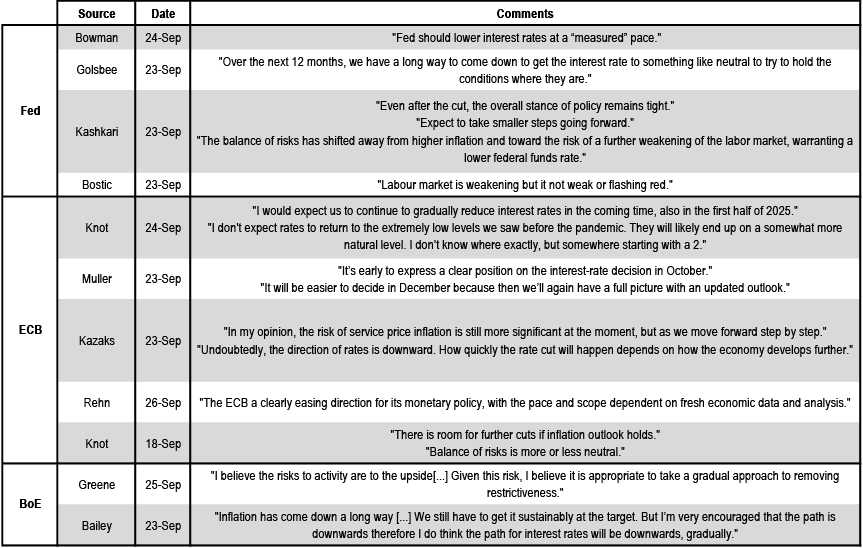
Over the past week, board members of ECB, Fed and BoE spoke at several scheduled events ( Figure 2). The message from the Fed broadly confirmed last week’s meeting delivery, with FOMC members indicating that the labour market is weakening but not yet weak. Board members mentioned that the 50bp cut was therefore intended to preserve labour markets from a substantial deterioration and that the upcoming cuts could possibly come in smaller steps. Across the ocean, ECB rhetoric over the week continued to indicate that the direction for policy rates is downward, although the pace of cuts will have to be determined based on the data with Governing Council members still being quite uncertain on an October cut, which is now our base case. In UK, the BoE commentary was broadly in line with the message delivered at last weeks’ meeting as MPC members continued to highlight that they do see themselves cutting rates further, although such easing will have to be “gradual” and “cautious”. It could be argued that, after the Fed 50bp cut, there is now more pressure on BoE to act more quickly; however, we believe that we would need to see a shift in the data, especially in the super core measure that is being closely watched by BoE, to have good chances of two consecutive cuts at the November and December meetings this year.
Finally, on a different note, investor focus in the Japanese markets shifted this week to the LDP leadership contest. The first round of the LDP election on Friday delivered a surprising turnaround with the victory of Ishiba over the Takaichi, who was seen to have good chances of winning. While Takaichi would favour fiscal expansion and oppose BoJ rate hikes, Ishiba is considered a relative hawk due to his support for fiscal consolidation and would not oppose the BoJ policy trajectory. Since the market had priced in a Takaichi win scenario, we expect yields to reprice higher and curves to flatten in coming days.
Figure 2: Central bank commentary from Fed, ECB and BoE continued to suggest that the path of rates going forward is clearly downwards, even though the pace of cuts over the coming months remains highly uncertain
Selected comments from Fed, ECB and BoE Board Members;
Source: Media articles, J.P. Morgan.
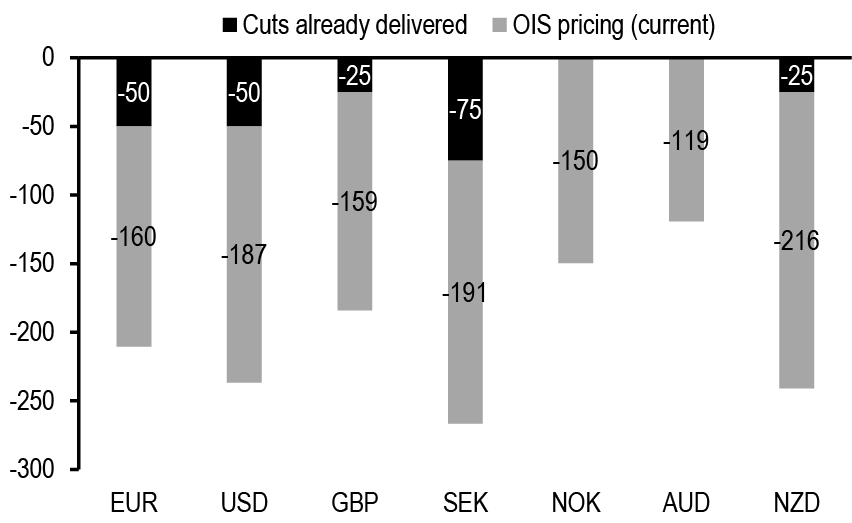
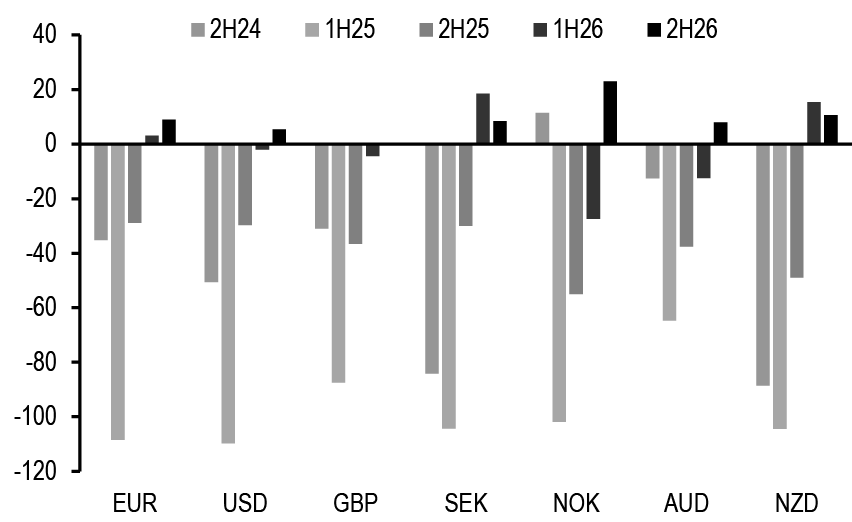
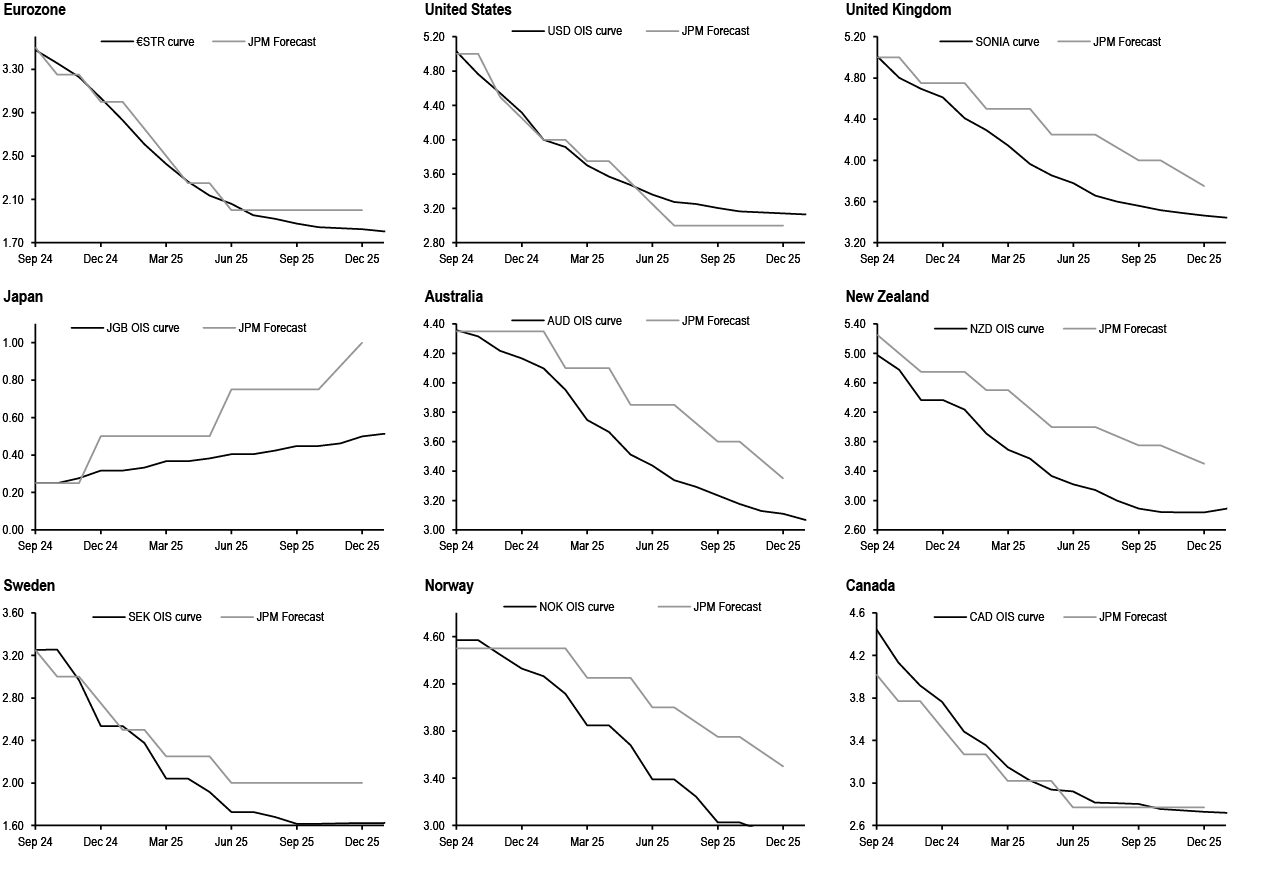
Looking at market pricing of policy expectations, we note that OIS markets have priced in expectations of a more aggressive easing to be delivered by the Fed, ECB and BoE relative to the start of the year ( Figure 3). Indeed, our Indicator of Expected monetary policy Normalisation (IEN), a measure that captures the intensity of the policy rate normalisation path priced in money markets as a blend of the speed (months to the trough of the cycle) and breadth of cuts (cumulative amount of easing expected until the trough of the cycle), has increased recently to its peaks since the beginning of the year for the G3 central banks. Across DMs, OIS markets are expecting that most central banks will have eased rates between 200bp and 250bp by the end of 2026 with a more aggressive expected pace of easing next year, especially from the Fed, and the cutting cycle likely to be concluded in 2H25 across most jurisdictions ( Figure 4). Norway and Australia are the exceptions to this as they are showing less cumulative cuts and a delayed easing cycle relative to others.
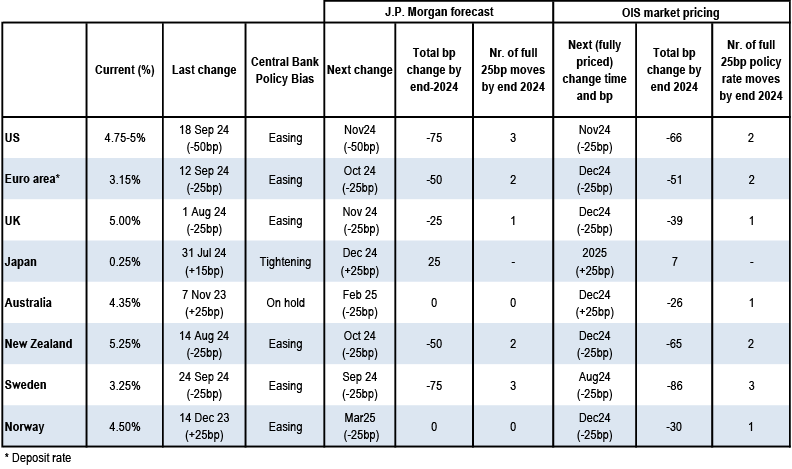
Overall, relative to our call, markets are pricing in less cuts for Fed by end-2024, around the same amount for ECB and more cuts for the other central banks ( Figure 5). In Japan, markets continue to be reluctant to price in more hikes for the BoJ, while we are still calling for a December hike.
Figure 3: OIS markets have priced in expectations of a more aggressive easing to be delivered by the Fed, ECB and BoE relative to the start of the year in terms of pace and breadth of the cutting cycle
J.P. Morgan Index of Expected policy rate Normalisation for Fed, BoE and ECB
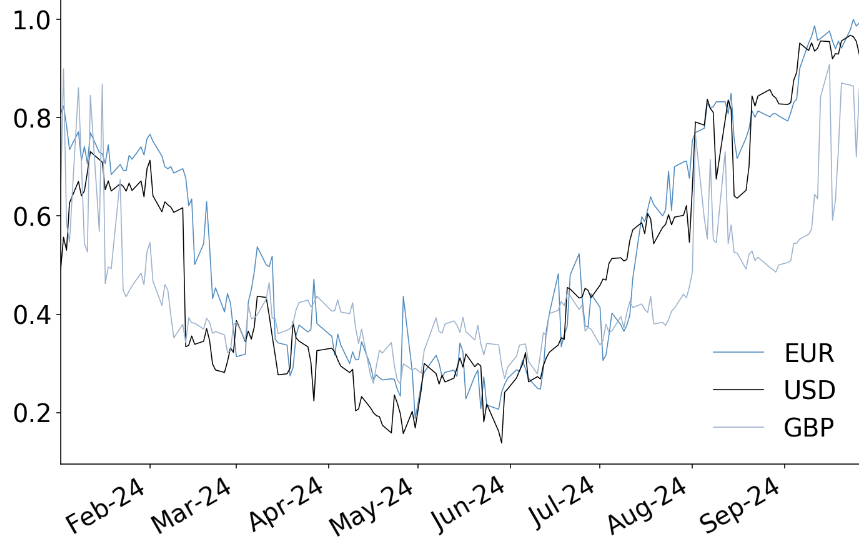
Note: To construct the IEN index, we first normalise the total amount of easing expected to be delivered over the whole easing cycle (i.e. the cumulative cuts priced in by OIS curves as well as those delivered so far) and the number of months to the expected trough. This means that the variables are scaled relative to their min and max since the last hike, i.e. (value – min)/ (max – min). We then compute the IEN index for each country as IEN = 1 – (0.5 * cumulative_easing_normalised + 0.5 * time_to_trough_normalised).
Source: J.P. Morgan.
Figure 4: OIS markets are expecting that most central banks will have eased rates between 200bp and 250bp by the end of 2026 with a more aggressive expected pace of easing next year, especially from the Fed, and the cutting cycle likely to be concluded in 2H25 across most jurisdictions
Cuts already delivered and cumulative easing priced in by the end of 2026 across DM OIS markets; bp
Source: J.P. Morgan.
Cumulative change in OIS rate priced in the money market curve for end-2024, mid-2025, end-2025, mid-2026 and end-2026; bp
Source: J.P. Morgan.
Figure 5: Relative to our call, markets are pricing in less cuts for Fed by end-2024, around the same amount for ECB and more cuts for the other central banks
Summary of current policy rates, J.P. Morgan forecast for next policy rate change and current market pricing in OIS over the next 36 months across DM central banks
Source: J.P. Morgan.
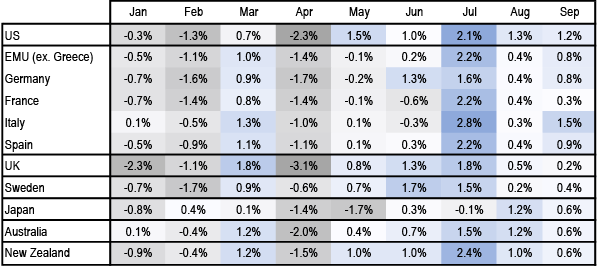
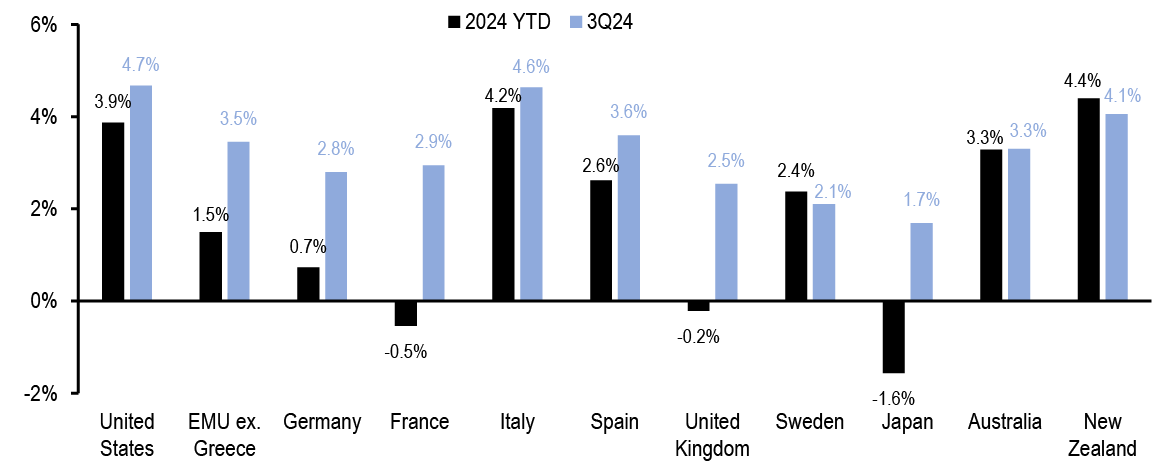
As the end of the quarter is approaching, we refresh our analysis of bond returns. We had already highlighted that the month of July delivered particularly strong returns for bond investors and we now note that, even though the pace of gains moderated, also August and September continued to positive bond performance. Therefore, despite the disappointing DM bond returns during the first part of the year, 3Q delivered a strong performance to rates investors, with July being the month with the highest YTD returns ( Figure 6). Overall, the positive 3Q returns outpaced the losses accumulated during 1H24 with larger 3Q returns than total YTD returns across all DM jurisdictions except Sweden and New Zealand ( Figure 7). The highest YTD bond returns were delivered in New Zealand (4.4%), Italy (4.2%) and US (3.9%), while in Japan (-1.5%), France (-0.7%), and UK (-0.2%) bond returns so far this year remain negative. From now until the end of the year, we still expect decent strong positive bond returns across DMs around 1-3% across most countries ( Figure 8). The highest returns over 4Q are expected in the UK (4.5%), while the lowest will be in Italy (-0.8%) and Australia (0%).
Figure 6: Despite disappointing bond returns across DM in the first half of the year, DM bonds delivered a strong performance in 3Q, with July being the month with highest YTD returns
Quarterly breakdown of bond returns for the country components of the JP Morgan Global Bond Index and projected return until the end of 2024; %

Source: J.P. Morgan.
Monthly breakdown of bond returns for the country components of the JPMorgan Global Bond Index; %
Source: J.P. Morgan.
Figure 7: The positive bond returns in 3Q broadly outpaced the losses of the first half of 2024 with the strongest YTD returns delivered in New Zealand, Italy and US…
Bond returns delivered in 3Q24 and total YTD bond returns for DM countries; %
Source: J.P. Morgan.
Figure 8: …From now until the end of the year, we still expect decent strong positive bond returns
Bond returns projected until the end of 2024; %

Source: J.P. Morgan.
Figure 9: This week EUR rates outperformed in a bull steepening move. UK rates twist steepened with a 5-8bp sell-off at the long-end of the curve while in US rates sold off modestly relative to last week.
Change in b/m yield since 20th September by region, bp
Source: J.P.Morgan.
Figure 10: Busy data calendar in the Euro area with PMI disappointing in France and Germany, broad weakness in German data and downside surprise in French and Spanish HICP
Actual print vs. consensus expectations since 20th September 2024
Source: Bloomberg Finance L.P.
Note: Jobless claims are reported as upside (downside) surprises if they are lower (higher) than consensus expectations. Inflation expectations are reported as upside (downside) surprises if they are higher (lower) than consensus.
Figure 11: Central bank policy rate expectations inferred from money market rates
Central bank policy rate expectations (1M forward OIS rates starting at month end) and J.P. Morgan policy rates forecasts*, %
Source: J.P. Morgan.
* Adjusted for the differential between policy rates and O/N OIS rates. For USD OIS, adjusted for the differential between the O/N OIS rate and the upper bound of the Fed funds target range.
Levels as of COB 26th September 2024.
Figure 12: Yield pick-up available via foreign bonds by country and investor currency, on a currency-hedged basis (3M rolling and maturity-matched hedges) and unhedged
Annualised yield pick-up* for euro-, yen-, US dollar- and sterling-based investors from foreign currency bonds vs. domestic bonds (German bonds for euro-based investors) of the same maturity, with no hedge, 3M rolling**and maturity-matched*** currency hedges; shaded regions for rolling and maturity-matched hedges show >1% yield pick-up (darkest shading), between 0.5% and 1%, and between 0% and 0.5% (lightest shading), %
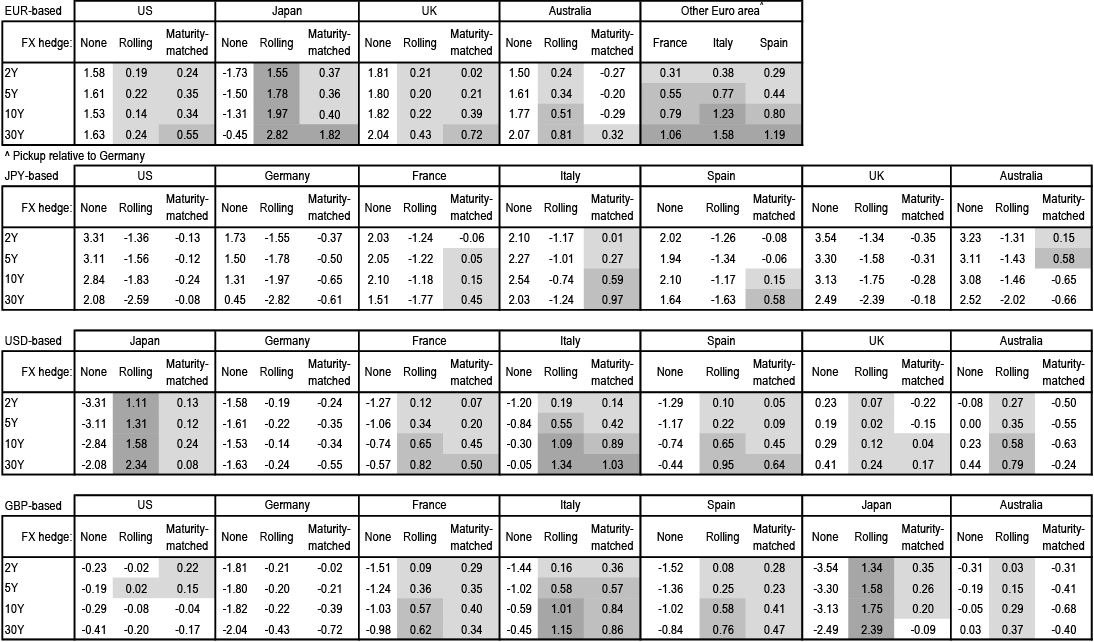
Source: J.P. Morgan. * Yield pick-up defined as foreign currency yield + hedge cost – domestic currency yield, using par govie curves (except Sweden, where we use benchmark bonds).** Cost of 3M rolling hedge defined as 3M FX cross-currency basis + domestic 3M swaprate (3s curve) – foreign-currency swaprate (3s curve).*** Cost of maturity-matched hedge defined as the maturity-matched FX cross-currency basis + domestic swaprate (3s curve) – foreign-currency swap rate (3s curve). Levels as at COB 26th September 2024.
Figure 13: Yield pick-up available via foreign bonds by country and investor currency, on a currency-hedged basis (3M rolling and maturity-matched hedges) and unhedged (EUR countries and SSA )
Annualised yield pick-up* for euro-, yen-, US dollar- and sterling-based investors from different Euro-based bonds of the same maturity, with no hedge, 3M rolling** and maturity-matched*** currency hedges; shaded regions for rolling and maturity-matched hedges show >1% yield pick-up (darkest shading), between 0.5% and 1%, and between 0% and 0.5% (lightest shading), %
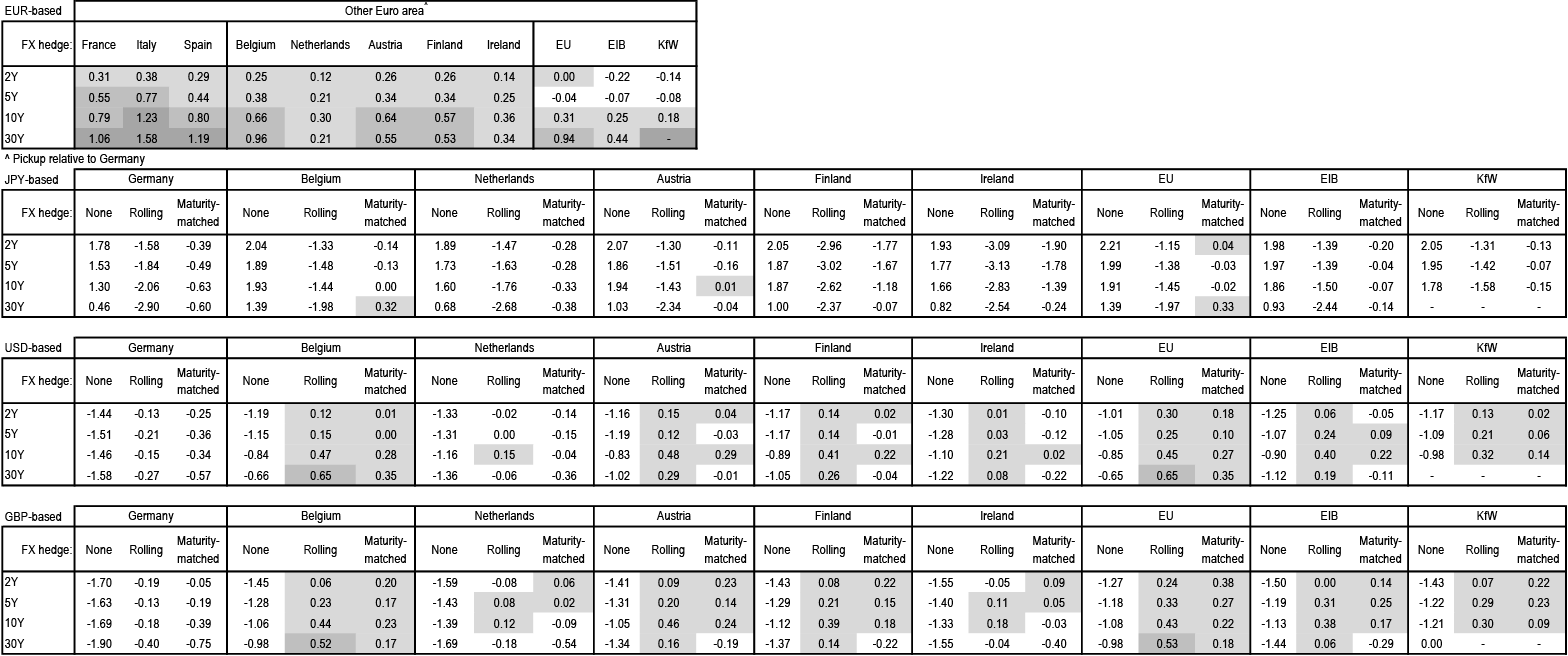
Source: J.P. Morgan.
* Yield pick-up defined as foreign currency yield + hedge cost – domestic currency yield, using par govie curves (except Sweden, where we use benchmark bonds).
**Cost of 3M rolling hedge defined as 3M FX cross-currency basis + domestic 3M OIS rate – foreign currency OIS rate.
*** Cost of maturity-matched hedge defined as the maturity-matched FX cross-currency basis + domestic OIS rate – foreign-currency OIS rate.
Levels as of COB 26th September 2024.
Figure 14: Current Global Rates trade recommendations
Changes are in bold and underlined
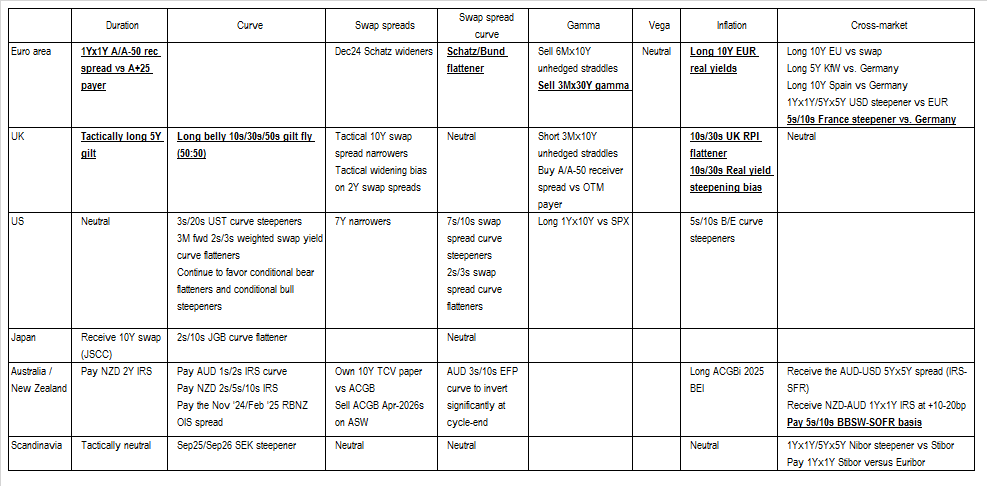
Source: J.P. Morgan.
Figure 15: 2024 trade performance summary
Hit rate* and average P/L** for all trades closed in 2024; bp of yield***
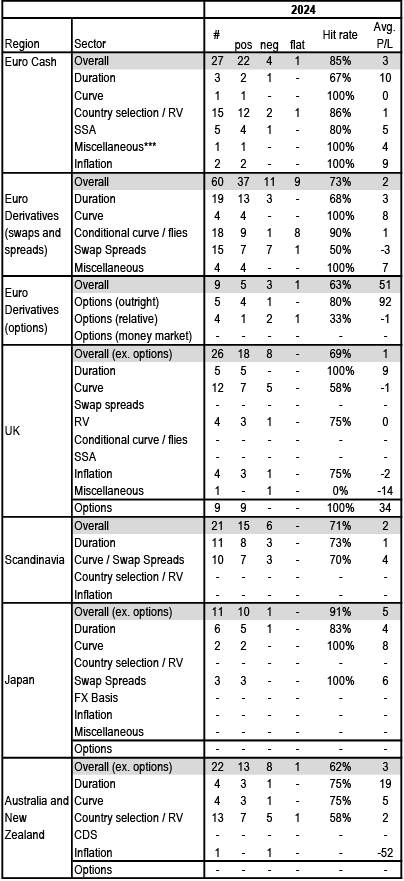
Source: J.P. Morgan.
* Hit rate defined as # positive trades / (total # trades - trades closed at flat).
** Avg. P/L across total # trades. Options trades are shown in bp of notional, except for money market trades which are shown in bp of yield and not included in avg P/L calculation.
*** Previously called CDS.
Note: For individual trade performance data, please see Global Fixed Income Markets Weekly: Trade Statistics, Fabio Bassi et al.
Table 1: Highlights from recent publications with hyperlinks
Source: J.P. Morgan
Euro Cash
Fundamental shift
- German yields declined sharply on large downside surprises on both growth and inflation front over the week
- Despite the sharp rally we still keep a bullish duration bias on Euro rates on risks of markets overshooting/pricing higher recession risks
- We continue to express OW duration bias via option structures and OW Euro real yields and will be looking to scale in outright duration OW on any retracement
- Over near-term OW front-end duration is a better long exposure than curve steepeners given steep valuations
- Maintain strategic OW intra-EMU/€-SSA stance with the Euro data developments this week adding further conviction in carry themes
- Hold OW 10Y Spain vs. Germany as benchmark OW intra-EMU exposures
- Also keep OW 10Y EU vs. swaps and OW 5-7Y KfW vs. Germany as medium-term OW €-SSA exposures
- France: stay neutral until there is clarity on the budget delivery; enter 5s/10s France steepener vs. Germany as low-beta hedge against disruptive French budget tail risk scenarios
- Italy: given strong fiscal performance, we shift lower our expected range of 10Y Italy-Germany spread to 120-150bp vs. 130-155bp previously; take profit on 10s/30s Italy flattener vs. Germany and long 5Y Italy CDS cash basis
- Belgium: now cheap; we find OW 10Y Belgium vs. 10Y France (60%) and 10Y Germany (40%) attractive
- Supply: around €26bn of conventionals via auction next week in France, Germany and Spain
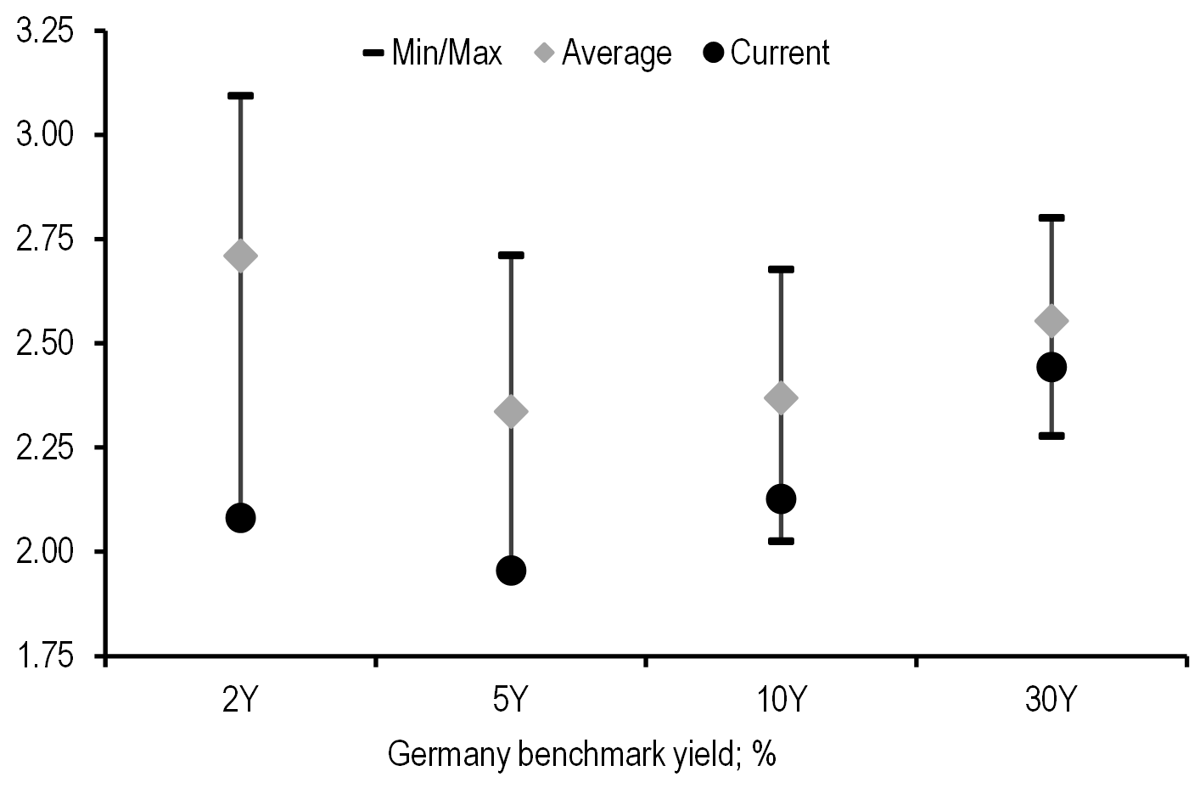
German curve sharply bull steepened, with short and intermediate yields making new YTD lows ( Figure 16), on large downside surprises on both growth and inflation front over the week (see here and here). German yields also sharply outperformed vs. DM peers.
Figure 16: German curve sharply bull steepened over the week with short and intermediate yields making new YTD lows
YTD statistics on German benchmark yield; %
Source: J.P.Morgan
This week in our view saw a fundamental shift in Euro area disinflation journey with sharp decline in PMIs adding further downside risk to growth but more importantly the large downside surprises in core CPI for France and Spain moving the risks on disinflation narrative from being balanced to clearly on the downside. Our economists now expect the ECB to cut 25bp in October and continue cutting at 25bp/meeting pace at lest until they reach 2% by June 2025 with increasing risks of them easing below 2%. Until last week our expectation was that under central scenario of gradual disinflation and soft landing ECB will stop at 2% with a recession scenario forcing them to ease below 2%. However, the increasing downside risks to inflation we see higher chances of the ECB easing below their expected neutral (2%) on risks of inflation undershoot even in absence of a recession. Indeed after the recent repricing money markets are now expecting high chances of ECB easing 25bp every meeting till mid-2025 with a terminal rate closer to 1.80%. Given our assessment above a terminal of 1.80% is broadly fair under our central scenario. However, at current level we don’t see market pricing enough risk premia for a recession scenario in current terminal pricing.
Overall, despite the sharp rally we still keep a bullish duration bias on Euro rates on risks of markets overshooting/pricing higher recession risks. We continue to express our OW duration bias via option structures (see European Derivatives) and OW Euro real yields (see here) and will be looking to scale in outright duration OW on any retracement.
The US payroll data will be the main event for the DM rates next week. Our economists expect a tick-up in unemployment to 4.3% and payroll around 125k, which would likely increase likelihood for Fed to deliver second 50bp cut at their November meeting. A weak labour data report next week would increase recession risks in the US with some pass through to the global economy also. We, therefore, would expect the market to start pricing a higher risk of a hard-landing (dovish) scenario in Euro area and likely pushing ECB terminal below 1.75%. In case of a strong payroll data, we expect the Euro rate sell-off/beta to US being limited given the fundamental shift in Euro area disinflation journey. Also despite the sharp outperformance of Germany vs. US over the past week, we still find US-Germany spread too tight (i.e. US yield expensive vs. Euro) after adjusting for relative money-market expectations and relative change of forecast revision indices ( Figure 17). The relative cheap valuations (Germany vs. US) further reduces the risk of material German sell-off on a strong payroll. We will be looking to enter OW 2Y German duration on any sell-off on back of strong payroll.
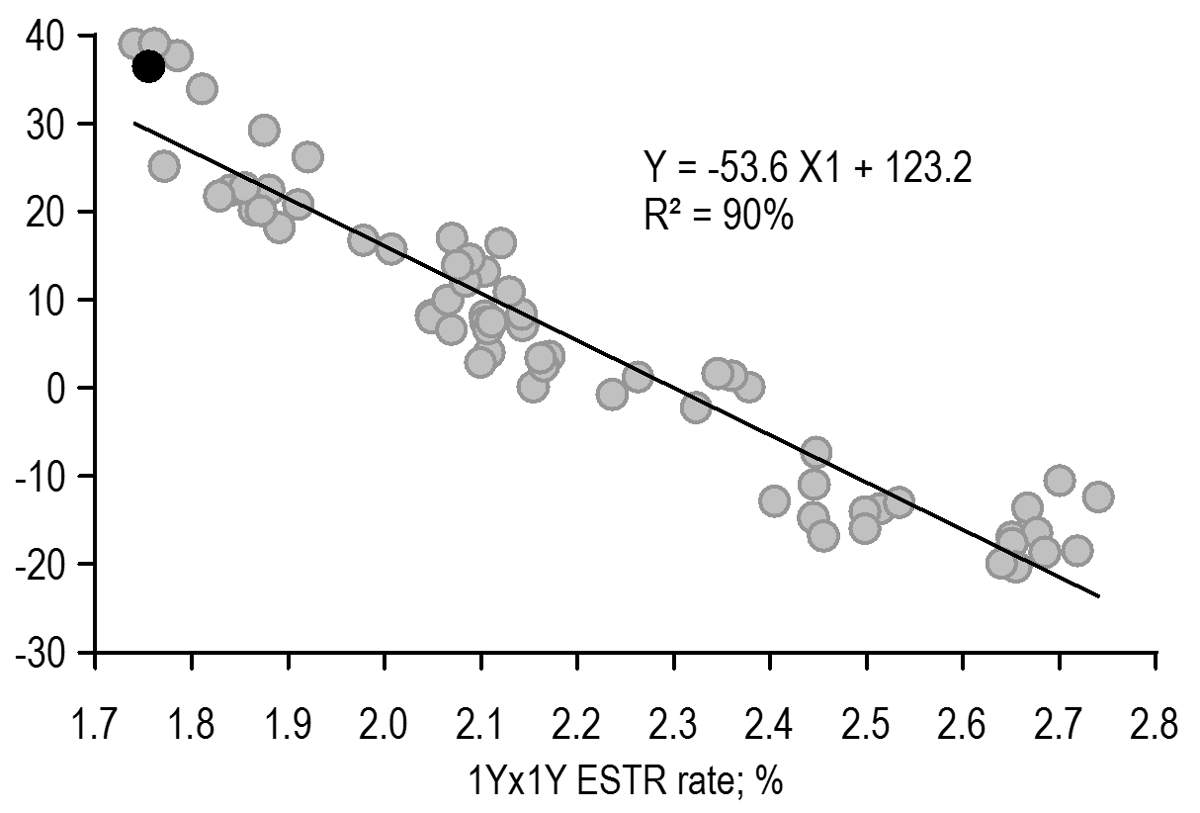
German curve bull steepened sharply over the week, in line with the expected bull steepening/bear flattening dynamics. Given our bullish duration bias we also have a strategic steepening bias. However, we still find 2s/30s curve too steep after adjusting for ECB monetary policy expectations ( Figure 18). Hence over the near-term OW front-end duration is better long exposure than curve steepeners given the steep valuations.
Figure 17: We still find US-Germany spread modestly tight (i.e. US yield expensive vs. Euro) after adjusting for relative money-market expectations and relative change of forecast revision indices
2Y US-Germany yield spread regressed against 1Yx1M USD-EUR OIS rate (X1) and US-Euro Forecast revision index (FRI, X2)*; past 6M; bp
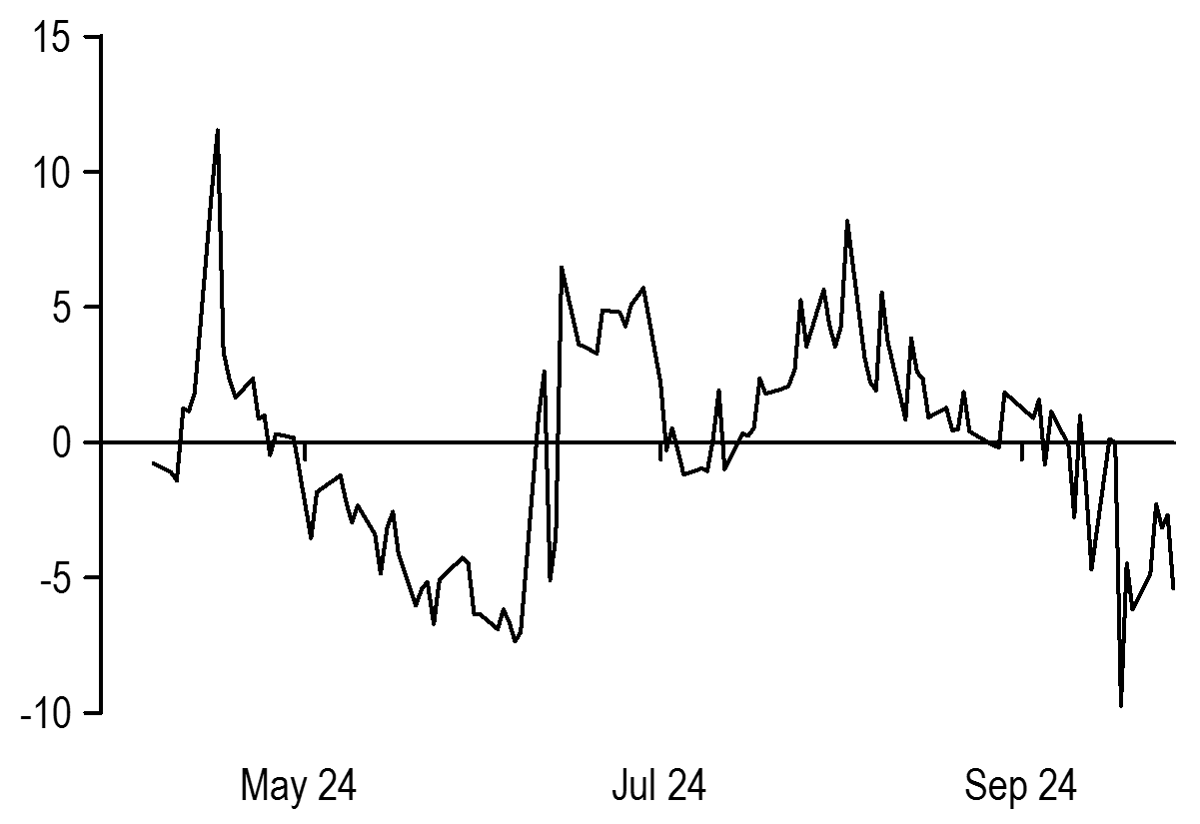
* 2Y US-Germany = 0.68*1Yx1M USD-EUR OIS – 10.5*US-Euro FRI + 280.1; R-squared: 96%
Source: J.P.Morgan
Figure 18: We still find 2s/30s curve too steep after adjusting for ECB monetary policy expectations
2s/30s German curve regressed against 1Yx1Y €STR rate; past 3M; bp
Source: J.P.Morgan
Intra-EMU spreads
Intra-EMU spreads moved in wide ranges over the week with Italy tightening sharply, France widening and rest of the spreads moving in tight +/-2bp range.
We maintain a constructive medium-term intra-EMU ex-France/€-SSA stance on expectation of ongoing focus on carry trades on back of easing financing conditions as ECB continues to gradually ease amidst declining supply pressures over the rest of 2024 given strong issuance front-loading and French political uncertainty remaining an idiosyncratic story with limited systemic risks. As discussed above, there has been a fundamental shift in Euro area disinflation journey, which is increasing confidence on ongoing ECB easing, thereby increasing further confidence on spread carry trades. The key near-term risk to our constructive outlook comes from sharp repricing of recession risks leading to broader risk-off sentiment across global risk markets. Our economists still assign low risk to Euro area economy going into sharp recession despite the recent weakness in the PMI (see here). A disappointing US payroll data next week could lead to recession risk repricing in the US and thus lead to broader risk-off tone in global markets. In our view widening on back of strong payroll would be good entry points to scale into OW spread exposures.
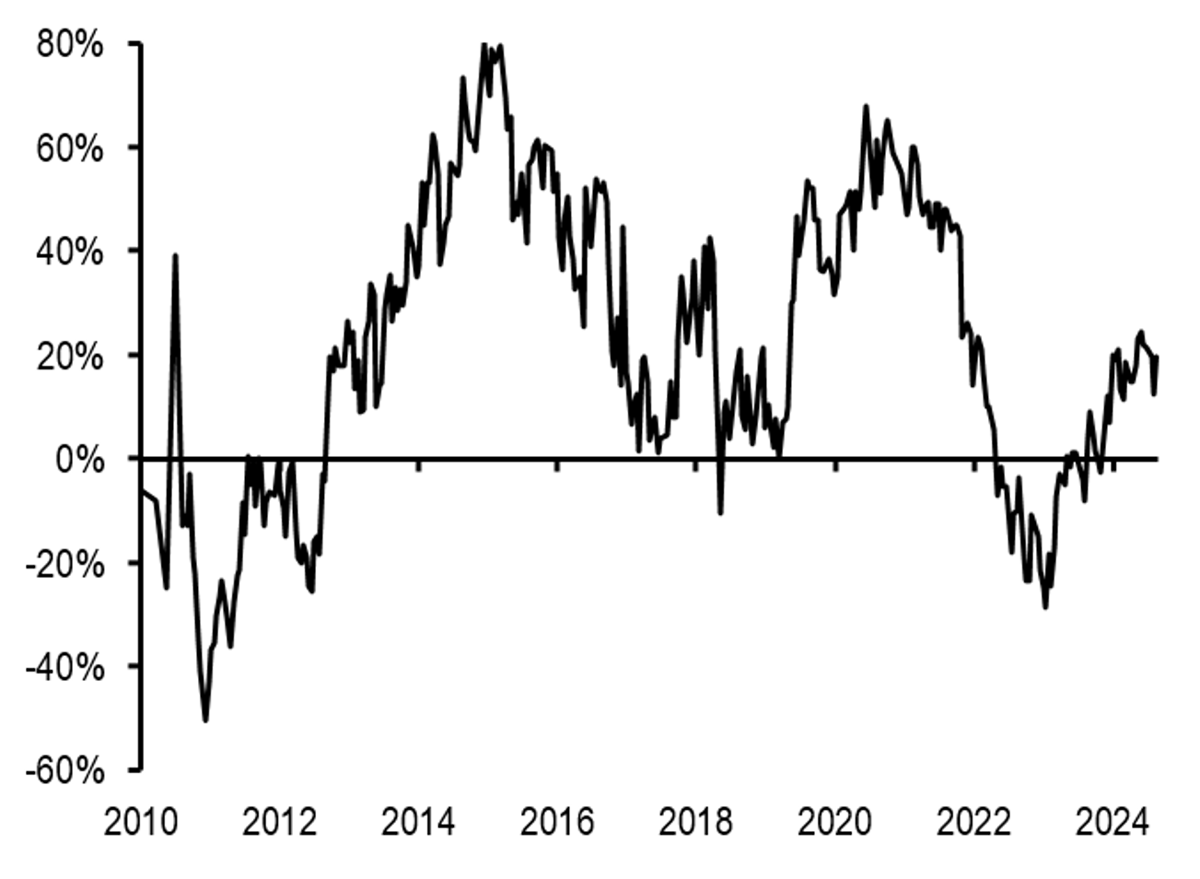
On positioning, as per our latest client survey, 26 September, European real money investors modestly increased their OW peripheral exposure over the past two weeks ( Figure 19). Investors’ current OW exposure is still close to the highest since early-2022 (before the beginning of the ECB’s tightening cycle), but remains well below the OW exposure witnessed during the PEPP period. We do not see this OW exposure as a material risk to carry exposures given the still modest size of the positioning.
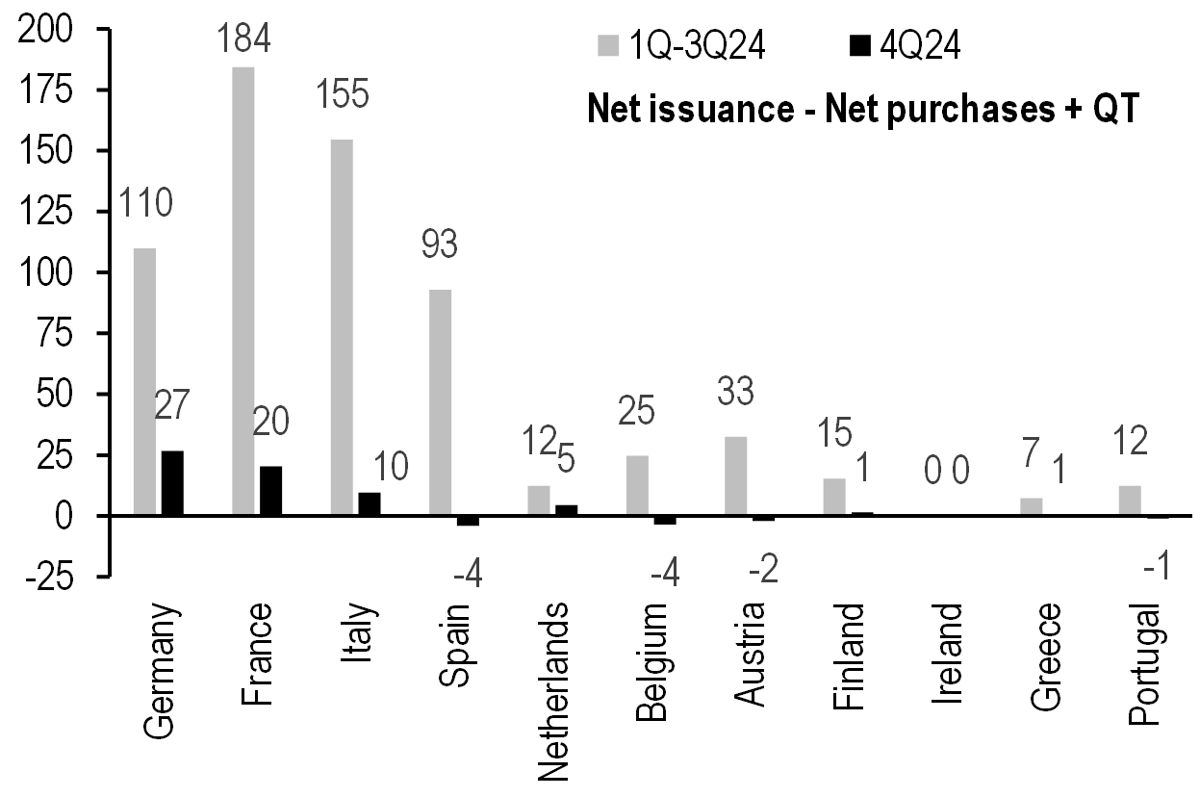
On issuance, as discussed in our Euro area government issuance 4Q24 update, we expect pressure on primary markets to ease materially in 4Q24 despite ongoing APP and partial PEPP QT ( Figure 20).
Figure 19: European real money investors are holding a modest OW peripheral exposure
Net exposure of Euro area investors to peripherals vs. core; %
Source: J.P. Morgan European Client Survey, 26 September
Figure 20: Pressure on primary markets to ease materially in 4Q24 despite ongoing APP & partial PEPP QT
J.P. Morgan estimates on supply, redemptions, ECB purchases by sovereign; central government bonds only, €bn
Source: J.P. Morgan
On French politics, PM Barnier announced the members of new French government on 22 September. As discussed in France: A new government and big fiscal challenge, R. Brun-Aguerre, 23 September, the government has weak support in the lower-house and will likely need support of National Rally (RN) to survive no confidence motions. The lower house will open on 1 October and PM Barnier is expected to lay out the government agenda. The left NFP coalition has argued that it would trigger a motion of no confidence then. We believe the government will survive such no confidence motion with abstention of RN this time. The key near-term economic issue is the 2025 budget which the government is planning to present during the week of 7 October. The recent commentary from the government suggests that the deficit for 2024 could be around 6% of GDP this year if no tightening measures are taken, instead of the 5.1% official forecast (a near €25bn gap). The recent developments broadly go in-line with the assessment we made when Macron nominated Barnier as PM in early September, that Barnier has a quite challenging task to deliver a fiscally prudent budget while avoiding a government collapse. Our base case remains that the Barnier government will eventually be able to deliver a 2025 budget which shows modest credible fiscal tightening and avoid rating downgrades from Fitch and S&P at their upcoming reviews. However,we remain of the view that market will maintain a cautious stance on France and will wait for clarity on budget delivery to gradually remove the political risk premia priced in current French spreads. Indeed, French spreads came under pressure this week, with 10Y spreads breaching 80bp level before retracing modestly, on concerns around large slippages in 2024 budget.
We also look at our sovereign risk index to assess French spread fundamental valuations over time. See Euro Cash 2H24 Outlook for details on the sovereign risk index framework. France has historically traded quite dear on our sovereign risk framework ( Figure 21), on average almost 25-30bp dear over long history. We attribute this persistent expensiveness to factors such as market liquidity, strong institutions, macro-financial stability, a deeper and stickier investor base, and availability of a liquid bond futures contract. Indeed, rating agencies have also highlighted France’s diversified economy, strong institutions and a record of macro-financial stability as factors behind rating France in the AA bucket despite having higher debt/GDP vs. similar rated peers. As discussed in our recent publications, the recent political developments weakened the robustness of France’s strong institutional and macro-financial stability pillars which have historically kept French spreads persistently dear vs. fundamentals, thus warranting a wider steady state level. After the widening over the past few weeks the residual of French spreads has almost fully corrected. In the disruptive tail risk scenarios (like Barnier govt. losing no-confidence vote before budget or 2025 budget not showing credible tightening), we can see the residual even moving into cheap territory: for instance, Italy has always traded on the cheap side on this framework, which likely reflects lingering political and rating risks.
Figure 21: France has always traded quite dear on our sovereign risk framework, but the residual has almost fully after the recent widening
J.P. Morgan sovereign risk model residual evolution for 10Y France-Germany spread, bp
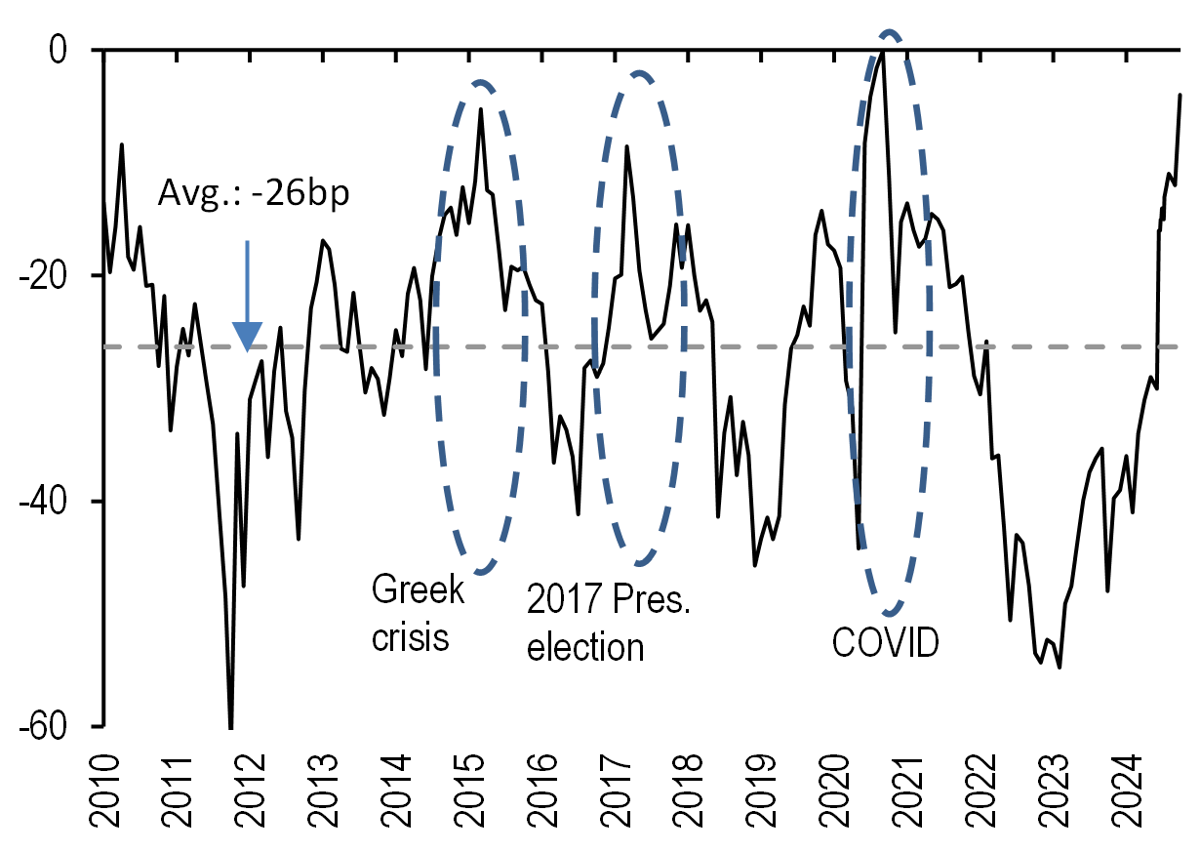
Source: See Euro Cash 2H24 Outlook for details on the sovereign risk index framework
Intra-EMU trading themes
We continue to hold OW 10Y Spain vs. Germany as benchmark OW intra-EMU exposure and also hold OW 10Y EU vs. swaps and OW 5-7Y KfW vs. Germany as medium-term OW €-SSA exposures. This week we enter 5s/10s France steepener vs. Germany as low-beta UW proxy. We also take profit on 10s/30s Italy flattener vs. Germany and long 5Y Italy CDS cash basis.
In France, as discussed above we maintain a cautious stance and stay neutral on spread until there is clarity on the budget delivery. Given the heightened uncertainty, we believe the market will likely overreact to negative news while underreact to a positive news, similar to the dynamics observed in recent days.
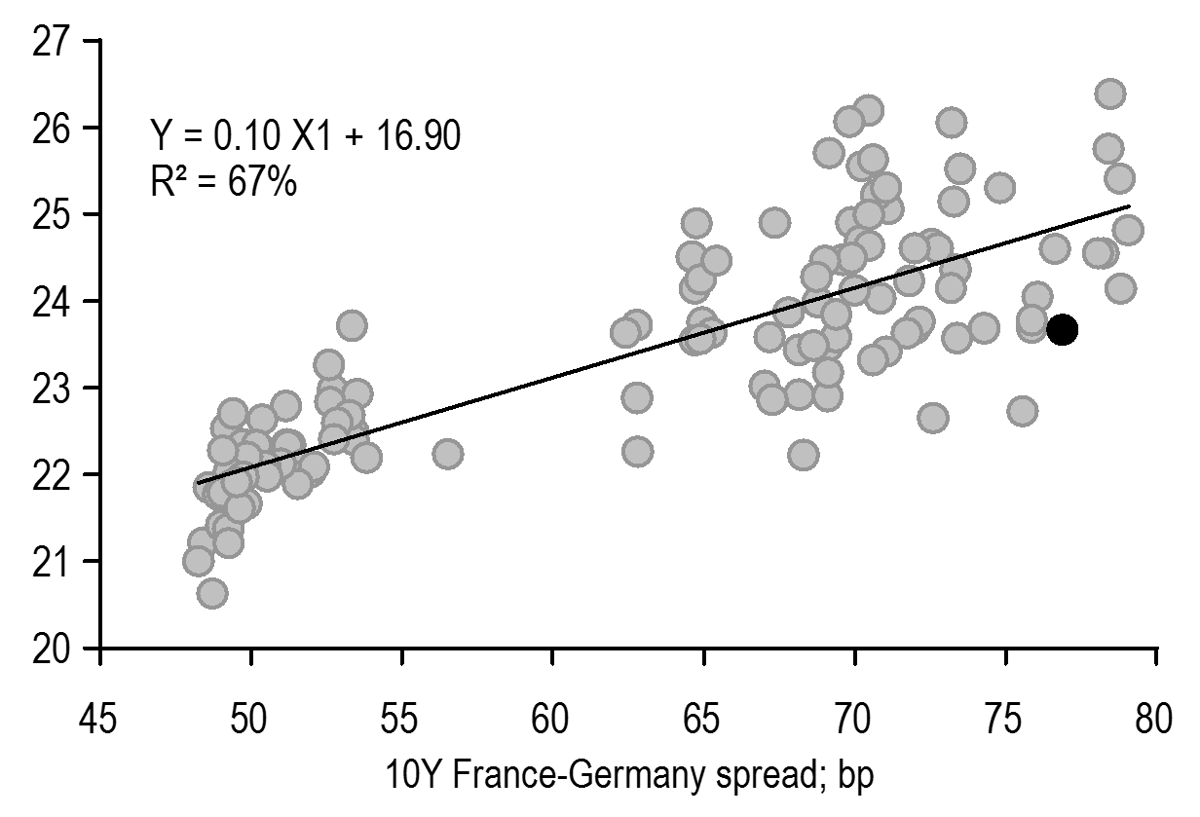
On French credit curve, we recommend 5s/10s France steepener vs. Germany as an attractive low-beta hedge against disruptive French budget tail risk scenarios and risks of potential rating downgrades. The 5s/10s box vs. Germany is trading more than 1bp too flat vs. level of spreads ( Figure 22). Also the box steepener has modest positive 3M carry (~1bp).
Figure 22: The 5s/10s France vs. Germany box is trading modestly flat vs. level of spreads: enter 5s/10s France steepener vs. Germany as low-beta France UW proxy
5s/10s France-Germany box regressed against 10Y France-Germany spread; bond specific; past 6M; bp
Source: J.P.Morgan
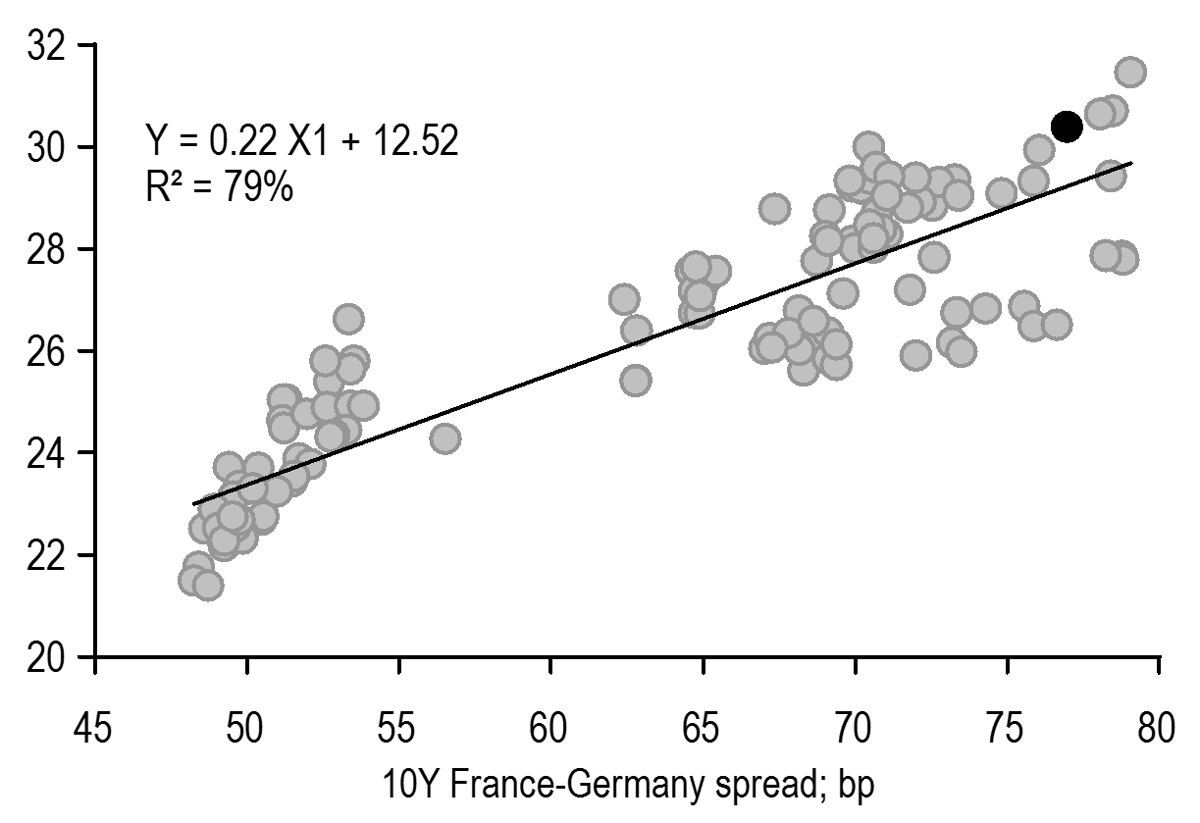
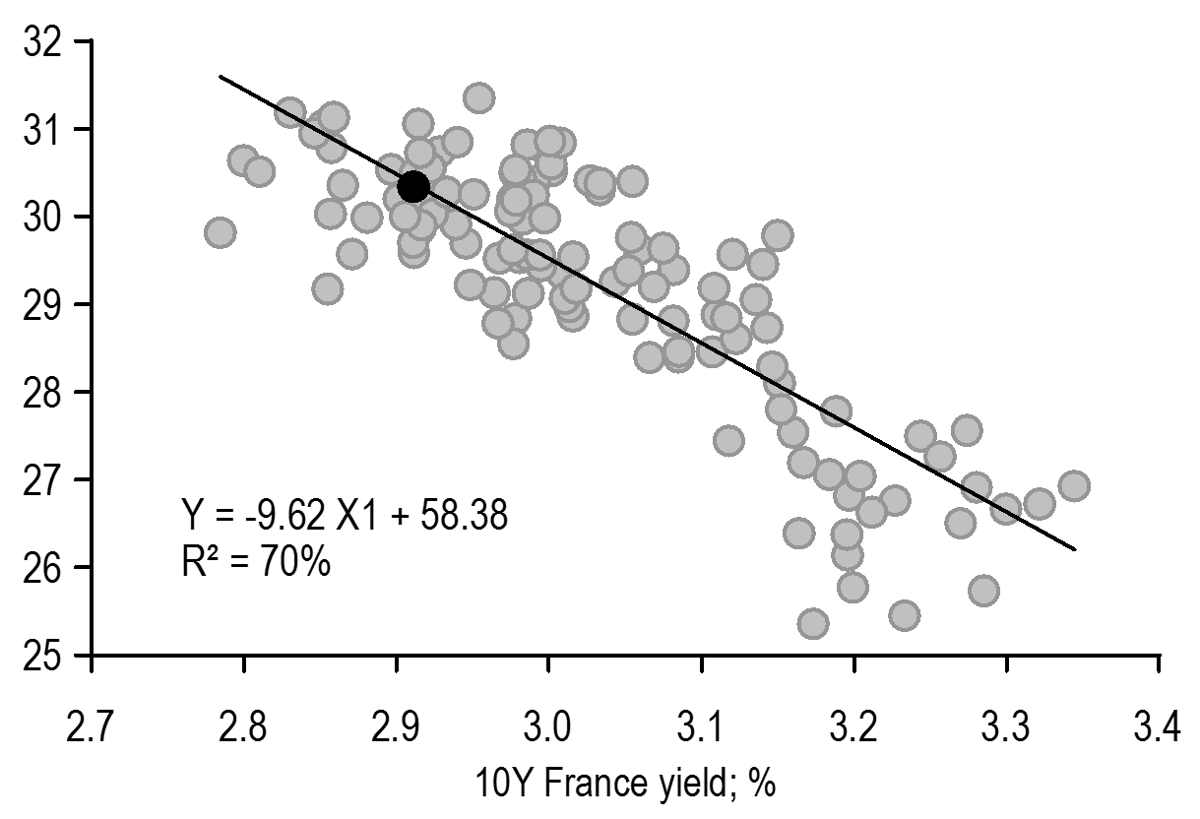
Also on French credit curve, the short-end spreads have outperformed in the recent widening move and we find the 3s/10s (3s/5s) boxes vs. Germany now trading on the steep side and are not attractive risk-off hedge any more ( Figure 23). Further out, the 10s/30s box has been negatively directional with level of 10Y yield and we find the box trading broadly fair ( Figure 24).
Figure 23: The 3s/10s (3s/5s) France vs. Germany box is now trading on the steep side and are not attractive risk-off hedge any more
3s/10s France-Germany box regressed against 10Y France-Germany spread; bond specific; past 6M; bp
Source: J.P.Morgan
Figure 24: 10s/30s France-Germany box is trading broadly fair vs. level of 10Y yield
10s/30s France-Germany box regressed against 10Y France yield; bond specific; past 6M; bp
Source: J.P.Morgan
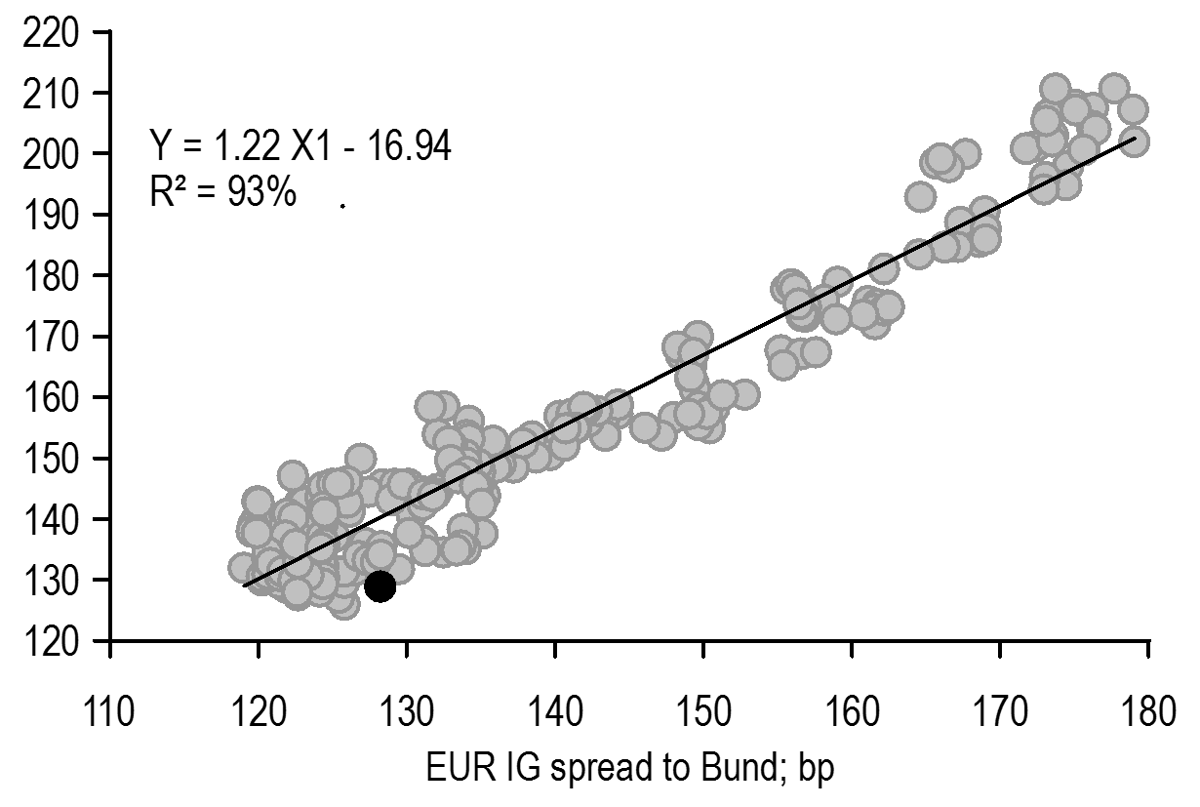
Italian spreads tightened sharply over the week on combination of better fiscal developments/news flow and broader risk-on tone in global markets. On fiscal side, the Italian Treasury this week highlighted that public finances are in more favourable situation than in government forecast in April. Also some sources media articles this week highlighted that 2024 budget deficit might come at 3.8% vs. previous target of 4.3%, and also that Italy will show an ongoing fiscal consolidation with deficit reaching below 3% by 2026. Given the positive news flow on fiscal side, we now see limited risk of noise around budget delivery. Also given the strong fiscal performance, we now shift lower our expected range of 10Y Italy-Germany spread to around 120-150bp vs. 130-155bp previously, to reflect lower fiscal noise risk and thus improvement in risk-adjusted carry. On a cross-market basis, Italian spreads are now screening more than 10bp too tight vs. other credit spreads ( Figure 25). Part of this relative expensiveness could be explained due to positive fiscal developments, but it is hard to explain the more than 10bp expensiveness fully.
On the Italian credit curve, we close 10s/30s Italy flattener vs. Germany at a small profit as the excessive steepness of the credit curve has now fully corrected ( Figure 26). We also close long 5Y Italy CDS basis at profit as during the sharp BTP narrowing this week the CDS leg lagged and thus pushing the basis sharply wider.
Figure 25: Italian spreads are now screening more than 10bp too tight vs. other credit spreads
10Y Italy-Germany spread regressed against EUR IG spreads to Germany; par rates used; past 12M; bp
Source: J.P.Morgan
Figure 26: The excessive steepness of the 10s/30s Italian credit curve has now fully corrected: take profit on 10s/30s Italy flattener vs. Germany
Residual from regressing 10s/30s Italy-Germany box against 10Y Italy-Germany spread*; past 3M; bp
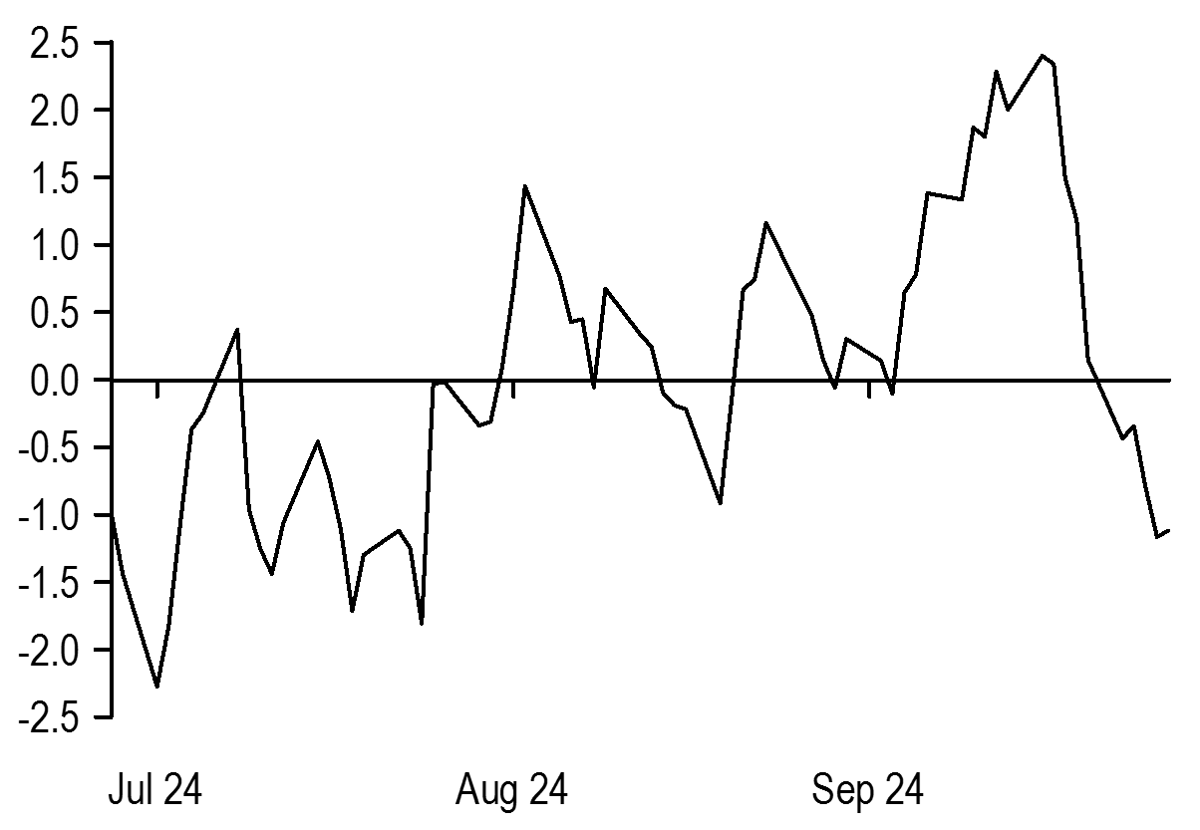
* 10s/30s = -0.17*10Y + 61.8; R-squared: 50%
Source: J.P.Morgan
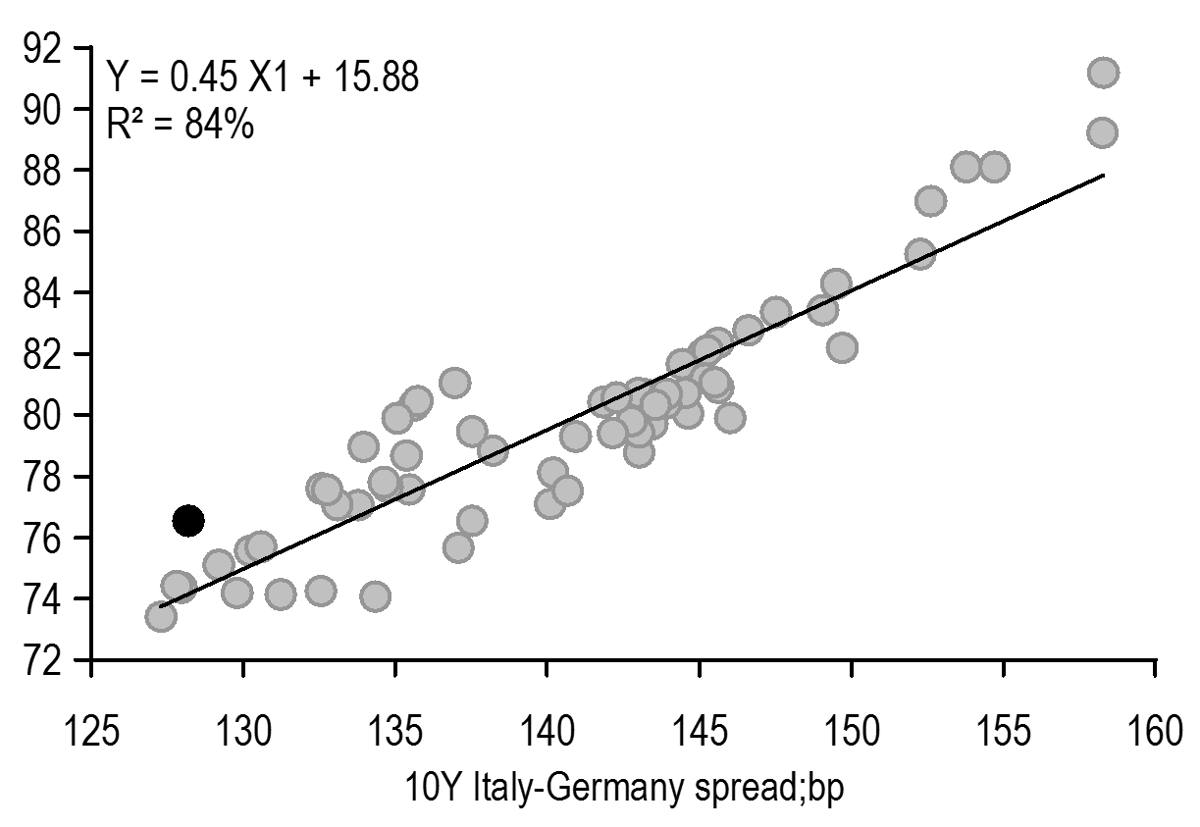
We hold OW 10Y Spain vs. Germany as our benchmark intra-EMU exposure. After the strong Italian tightening this week, Spanish spreads are now screening quite cheap relative to Italy ( Figure 27). Also, after the linker syndicate this year, Spain has covered more than 85% of 2024 issuance needs, based on our targets. We, therefore, would expect the auction sizes to gradually decline going forward, a supportive dynamic for our OW.
Figure 27: Spain is now screening quite cheap vs. Italy on recent relationship
10Y Spain-Germany spread regressed against 10Y Italy-Germany spread; par rates used; past 3M; bp
Source: J.P.Morgan
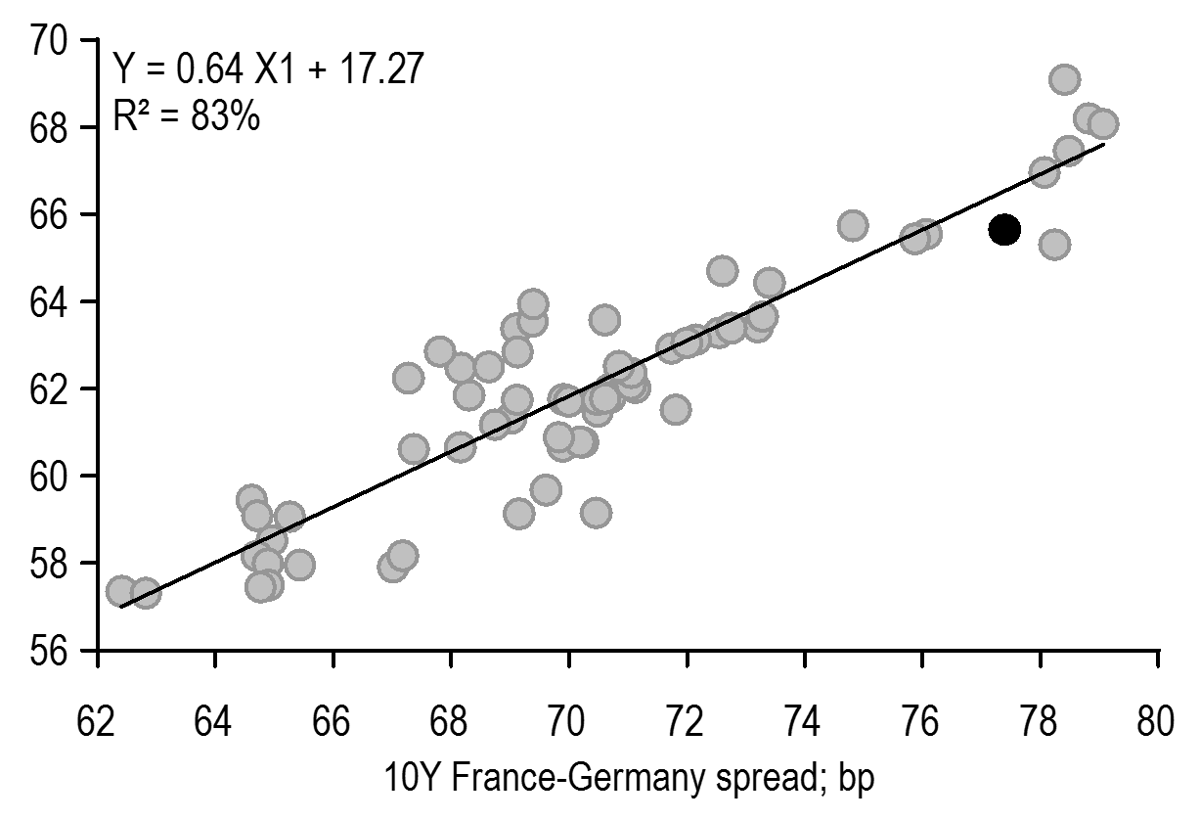
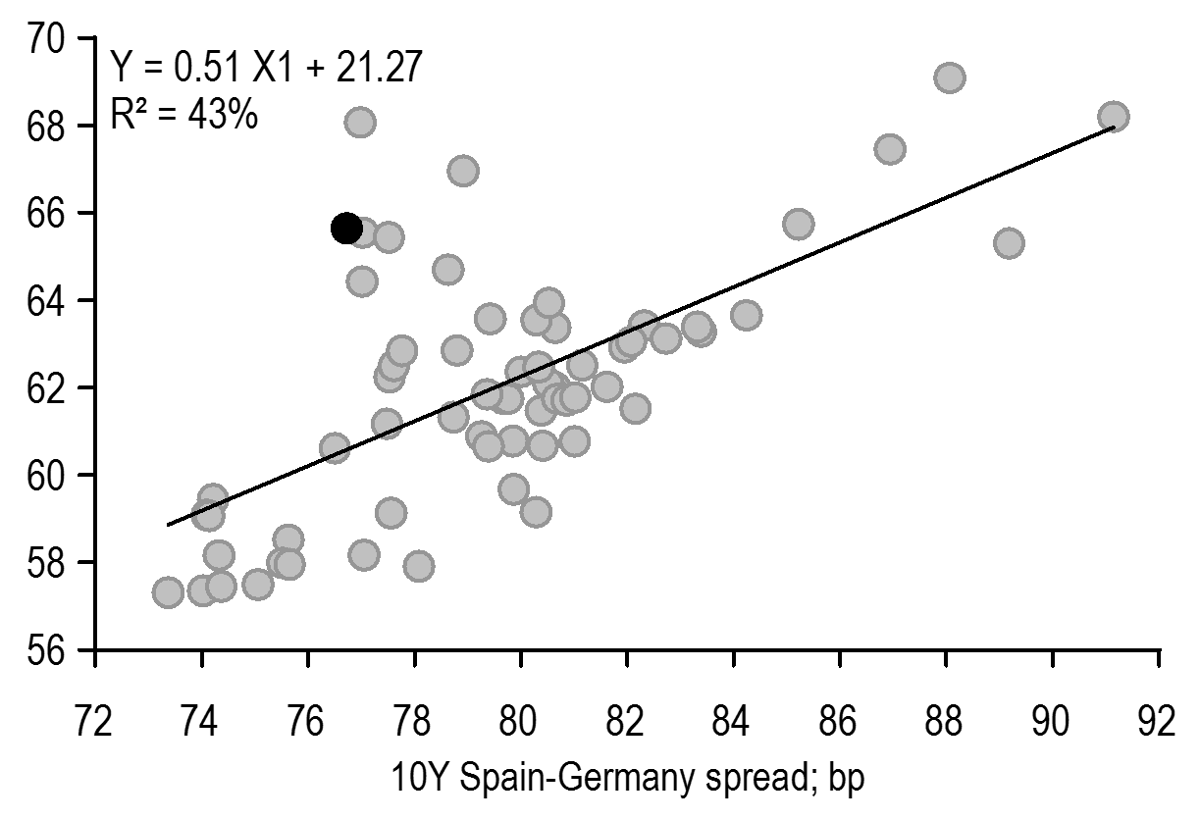
Belgian bonds tracked France with their recent ~60% beta and widened until Thursday before retracing partly on Friday ( Figure 28), whereas rest of the sovereign spreads, including other core, showed muted or even negative beta to France. This led to relative underperformance of Belgium vs. non-France peers and we now find Belgium cheap ( Figure 29). Given the idiosyncratic nature of the French uncertainty we find the recent high beta in a widening move excessive. We find OW 10Y Belgium vs. 10Y France (60%) and 10Y Germany (40%) attractive given our expectation of Belgium beta to France to decline in further France widening risk scenario.
Figure 28: Belgian bonds continued to track France with their recent ~60% beta and widened over the week…
10Y Belgium-Germany spread regressed against 10Y France-Germany spread; bond specific; bp
Source: J.P.Morgan
Figure 29: …thus leading to sharp relative underperformance vs. other peers
10Y Belgium-Germany spread regressed against 10Y Spain-Germany spread; bond specific; bp
Source: J.P.Morgan
Issuance
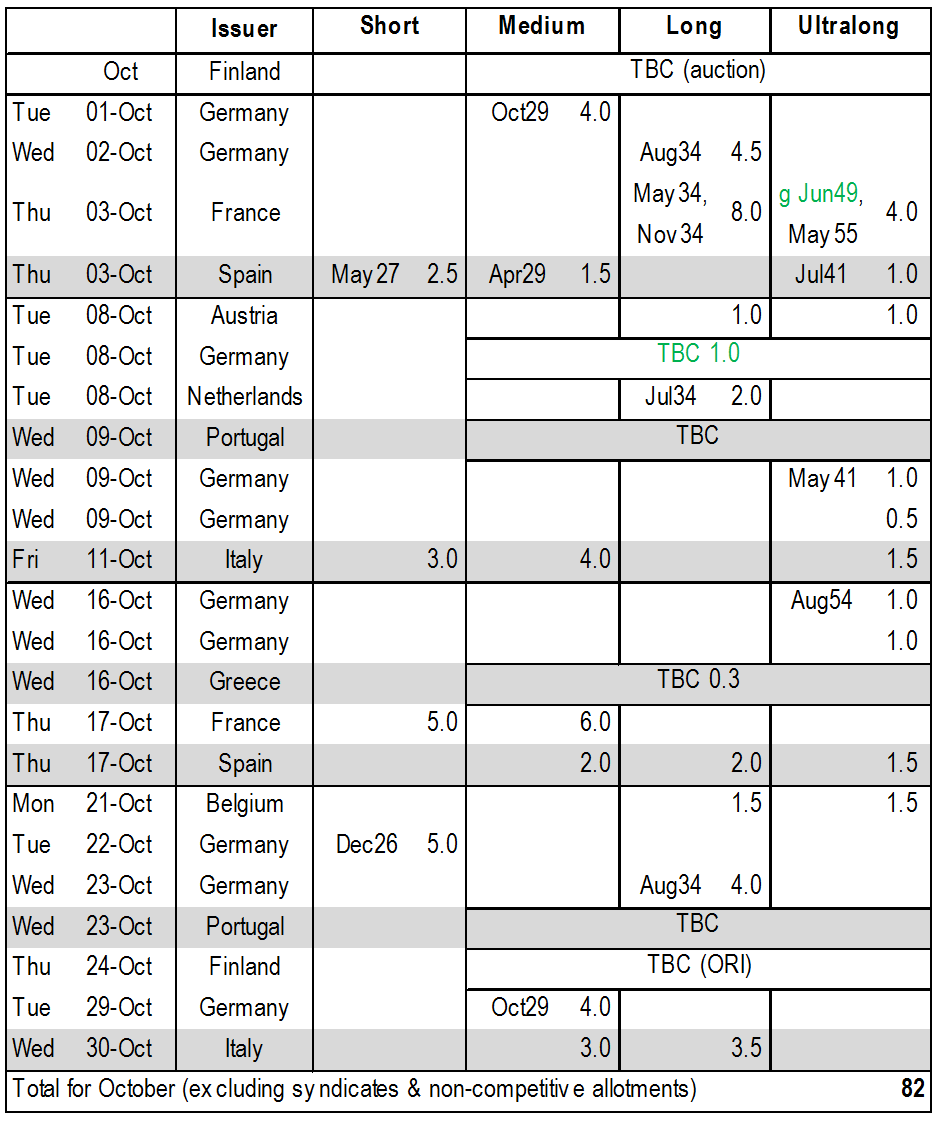
We expect around €26bn of conventional bond supply via scheduled auctions next week ( Figure 30). Conventional auctions are scheduled in Germany, France and Spain ( Figure 31).
Figure 30: We expect around €26bn of conventional bond supply via scheduled auctions next week
Total Euro area conventional bond issuance weekly volume on trade date basis; black indicating total conventionals issued only via auctions; grey indicating conventionals issued via syndicate, exchanges and private placements; light blue indicating next week expected issuance volume (auction only); weekly basis; €bn

Source: J.P. Morgan
Figure 31: Conventional auctions are scheduled in Germany, France and Spain next week
Euro area conventional bond issuance calendar until the end of October; official announcements and J.P. Morgan forecast; peripheral supply highlighted in grey, green bonds are marked in green; €bn
Source: Debt Management Offices, J.P. Morgan
Bobl Oct29: cheap
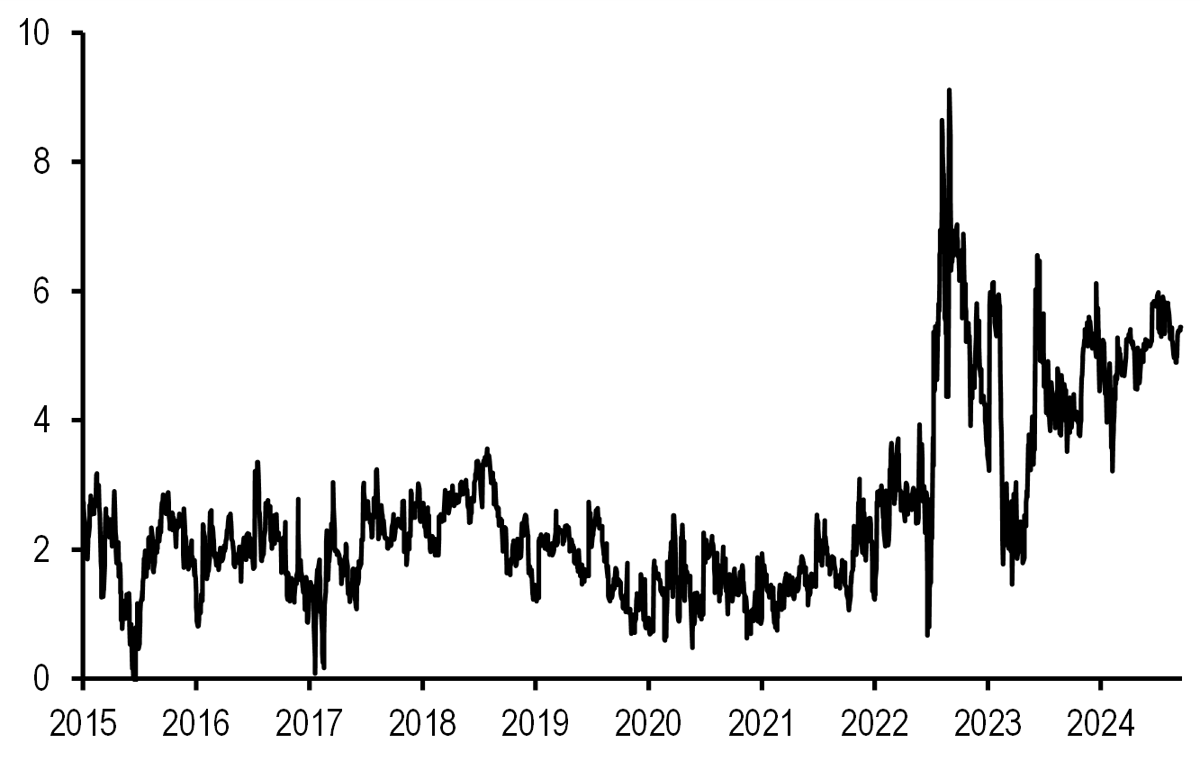
The current 5Y German benchmark is currently trading with a benchmark discount of around 5.8bp relative to surrounding bonds, on the cheap side as it continues to remain higher than the pre-2022 Bobl benchmark discount range of around 1-3bp ( Figure 32). Part of the Bobl relative cheapness comes from the expensiveness of old Bunds in this part of the curve. All the old Bunds in this sector are trading quite special in repo.
Figure 32: The current 5Y German benchmark is trading at around 5.8bp benchmark discount, higher than the pre-2022 Bobl benchmark discount range of around 1-3bp
Benchmark discount* on current 5Y Bobl; bp
* Benchmark discount is calculated as the difference between 5Y benchmark (Bobl) yield and interpolated yield calculated using surrounding
Source: J.P.Morgan
Bund Aug34: fair
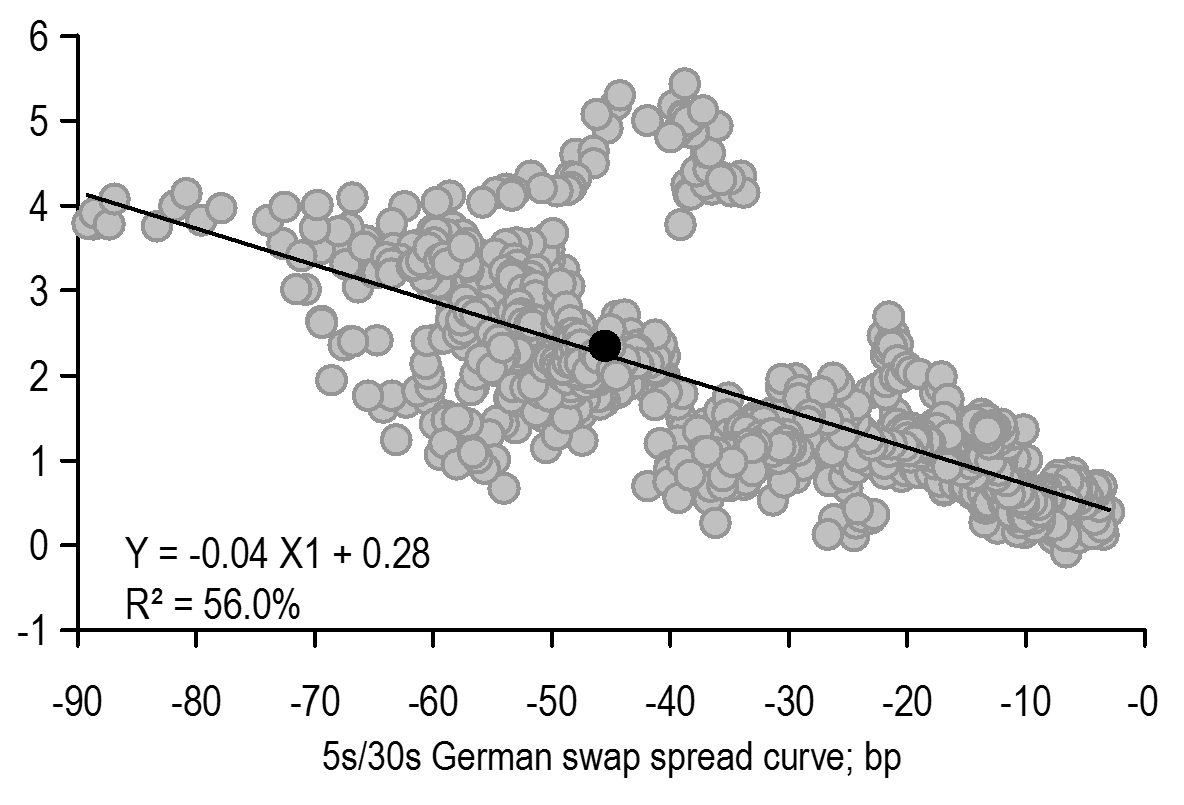
The 10Y German benchmark is trading with a benchmark roll (z-spread pick-up over the off-the-run Bund Feb34) of 2.3bp, broadly in line with the average of the 10Y Bund benchmark roll over the past 12M (2.1bp). The 10Y German benchmark roll continues to show some modest negative directionality to 5s/30s German swap spread curve over long run history and the Bund Aug34 benchmark roll appears broadly fair based on that relationship ( Figure 33).
Figure 33: The 10Y German benchmark roll continues to show some modest negative directionality to 5s/30s German swap curve over long history and is currently trading broadly fair
10Y German benchmark roll (z-spread pick-up over off-the-run) regressed against 5s/30s Germany swap spread curve; past 5Y; bp
Source: J.P.Morgan
OAT May34: fair
The OAT May34 underperformed modestly relative to surrounding bonds after the auction announcement on Friday and is now screening broadly fair based on our par curve fair value framework.
OAT Nov34: fair
The 10Y benchmark is trading with a benchmark roll (z-spread over the off-the-run OAT Nov33) of around 5.6bp, close to the average of the 10Y benchmark roll over the past 12M.
OAT green Jun39: modestly cheap
The 25Y green bond has been cheapening over the past few weeks and has moved from pricing a greenium of 3.5bp to 1.5bp now, at the upper-end of its range since issuance in January.
OAT May55: modestly dear
The 30Y French benchmark is trading with a benchmark roll (z-spread pick-up over the off-the-run May54) of around 3.4bp, on the lower-half of the benchmark roll range (3.1bp to 4.1bp) since issuance in February.
Bono May27: modestly cheap
The 3Y benchmark is currently trading on the Spanish curve with a benchmark discount of around 3.0bp relative to surrounding bonds, modestly cheap in our view.
Bono Apr29: modestly cheap
Following the auction announcement on Friday, the Bono Apr29 underperformed relative to surrounding bonds and is now trading modestly cheap on the Spanish curve based on our par curve fair value framework.
Bono Jul41: fair
The Bono Jul41 is trading broadly fair on the Spanish curve based on our yield vs. modified duration framework.
Trade recommendations*
New trades
- Enter 5s/10s France steepener vs. Germany
Enter short €50mn OAT Nov34 vs. long €86.5mn OAT Feb30 and long €48.1mn Bund Aug34 vs. short €89.9mn Bund Oct29 @ 20.3bp. 3M carry: 1.2bp and 3M slide: 1.2bp.
Closed trades
- Close long 5Y Italy CDS basis
Close long €25.0mn of 5Y Italy CDS vs. long €25mn BTP Feb29 vs. maturity matched swap @ 18.8bp; 3M carry: -1.2bp. P&L since inception (19 Jan 2024): 3.5bp - Close 10s/30s Italy flattener vs. Germany
Close long €50mn BTP Oct53 vs. short €99.0mn BTP Feb35 and short €40.1mn Bund Aug54 vs. long €94.0mn Bund Aug34 @ 34.4bp. 3M carry: -1.6bp and 3M slide: -0.6bp. P&L since inception (06 Sep 2024): 0.8bp.
Country selection & RV trades
- Keep long 10Y Spain vs. Germany
Keep long €50mn Bono Oct34 vs. short €48.9mn Bund Aug34 @ 78.6bp. 3M carry: 2.2bp and 3M slide: 0.6bp; P&L since inception (06 Sep 2024): 2.9bp.
SSA trades
- Keep long 10Y EU vs. swap
Keep long €25.0mn EU Dec34 vs. maturity matched swaps @ 41.3bp; 3M carry: 0.7bp and 3M slide: 0.5bp. P&L since inception (02 May 2024): -16.2bp. - Keep long 5Y KfW vs. Germany
Keep long €25.0mn KfW Apr29 vs. short €25.01 Bobl Apr29 @ 36.6bp, 3M carry: 2.0bp and 3M slide: 0.5bp. P&L since inception (17 July 2024): -3.1bp.
*Unless specified, all trades are priced as of 1PM on non-payroll Fridays and 2PM on payroll Fridays.
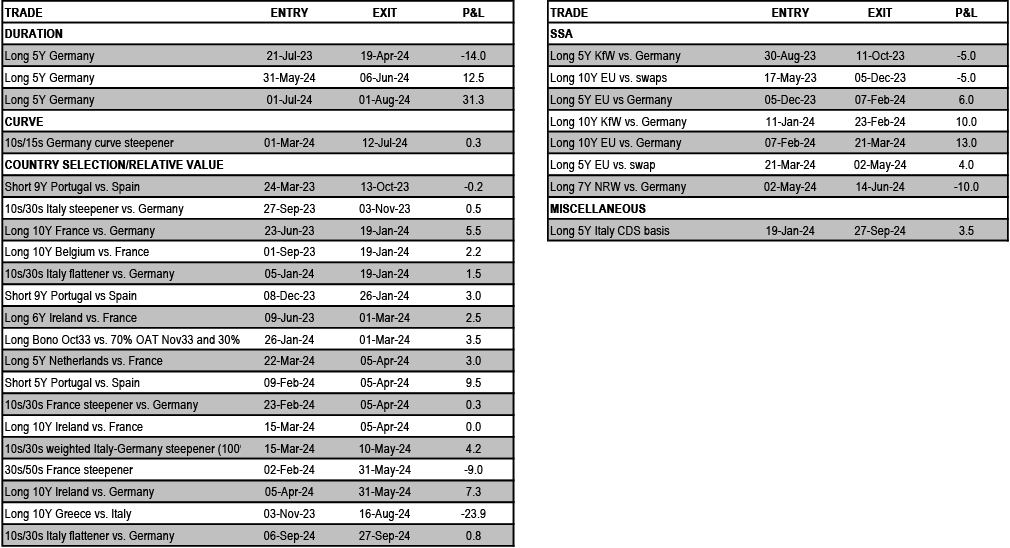
Trades closed over the past 12 months
European Derivatives
Long Duration Bias: Navigating ECB’s Disinflation and Rate Cut Trajectory
- Lower than expected inflation in France and Spain has increased our conviction on the overall disinflation journey. Along with a weak growth back drop, we now expect the ECB to deliver back-to-back cuts starting in October until we reach 2% by June. We see risk of a lower terminal rate even in absence of a recession
- The €STR curve is now pricing around 20bp and 52bp of cumulative cuts by October and December meetings and a cumulative 172bp of cuts by end-2025, in addition to the two 25bp cuts already delivered
- We favour receiving Dec24 ECB €STR on market pricing some risk of a jumbo cut if inflation next week disappoints as well
- We increase our conviction on medium term long duration bias. With a view that the risk of a large back-up in reds yield remains limited, we recommend buying 1Yx1Y A/A-37.5bp receiver versus selling A+25bp OTM payer at a net credit. Take profit in 1Yx1Y A/A-50bp receiver spread versus OTM payer
- Keep conditional bull steepeners in Mar25/Mar26 but take profit in 2s/5s
- Take profit and re-strike 2s/5s/10s conditional bull belly cheapener via 3M receivers
- 10s/30s swap curve is marginally too flat in our long-term model but is too steep in our short-term model versus 1Yx1Y €STR; keep 10s/30s swap curve flatteners hedged with long in reds as pure RV trade. Concerns around Dutch pension fund indexation flow could support some temporary flattening of the curve
- Bearish hedges: hold 3Mx(1Yx1Y) A/A+20 1x2 payer spread
- German Eurex swap spreads continue to trade narrow vs. historical levels, to show weak directionality to yield levels, with a broad modest drift narrower on further easing of financial conditions
- Schatz €STR swap spread continues to trade cheap vs. fundamental variables with investors’ positioning biased for narrowers on carry considerations, given declining beta to intra-EMU peripheral spreads to OAT/Bund spreads
- We hold Dec24 Schatz €STR swap spread widener as convex tactical risk-off hedge to our long carry/short vol portfolio, with directionality to intra-EMU expected to increase in a risk-off move driven by macro or geopolitical concerns
- Bund swap spread fair to a touch rich vs. fundamental drivers; medium term narrowing bias
- Initiate Dec24 Schatz/Bund €STR swap spread curve flattener
- Sell 3Mx30Y gamma with infrequent delta-hedging; hold shorts in 6Mx10Y unhedged straddles; bias towards 2s/10s volatility curve flatteners across tails
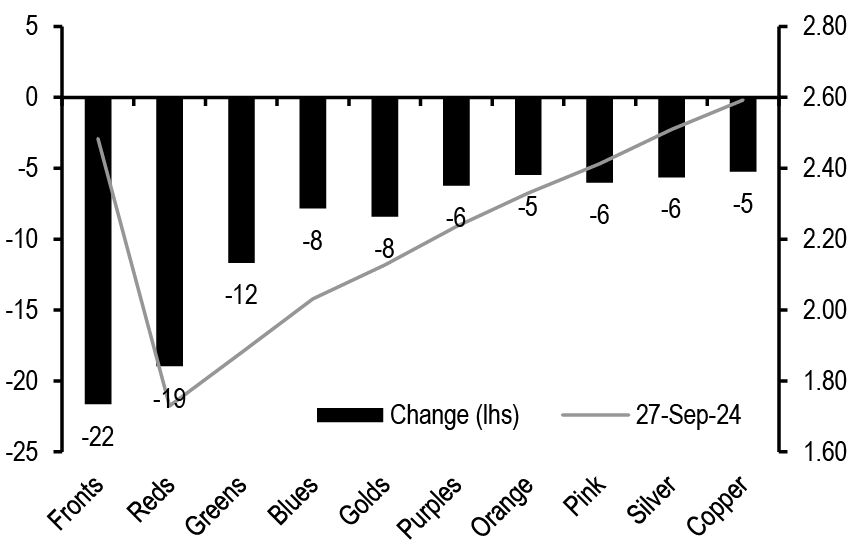
€STR 1Y forward yield curve bull-steepened sharply over the week; weak PMIs and German IFO followed by downside surprise in France and Spain inflation drove a large repricing of ECB easing expectations for the October meeting and fuelled the large rally at the front-end of the curve and consequent bull-steepening of the curve ( Figure 34). Anecdotal evidence suggests some profit taking in steepeners and bank related paying flows in the intermediate sector of the curve.
Figure 34: €STR forward yield overall increased with a decent bull-steepening of the curve
1W changes of various 1Y forward €STR yield (lhs, bp) versus 1Y fwd €STR curve (rhs,%)
Source: J.P. Morgan.
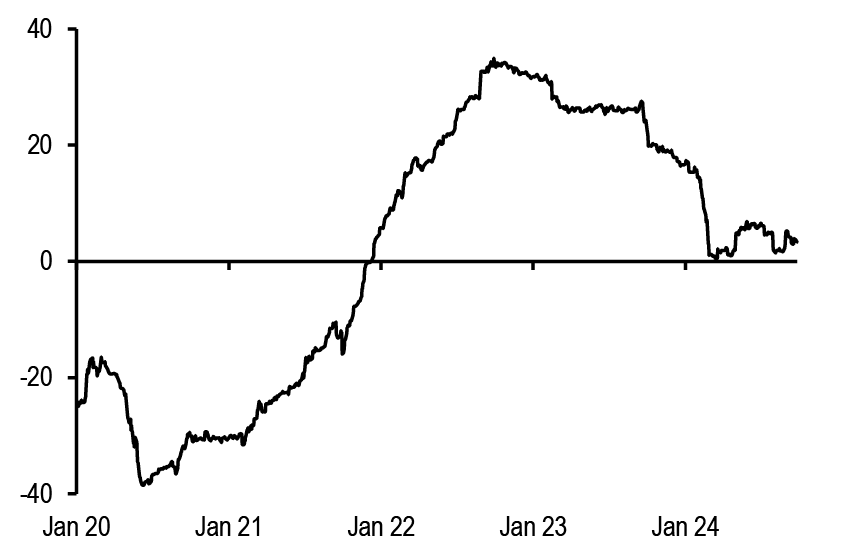
Figure 35: ECB commentary has been fairly neutral towards an October cut with broad consensus appearing for a December cut, in line with a “gradual” easing cycle
ECB hawk/dove score; since 1 Jan 2020; unitless
Source: J.P. Morgan.
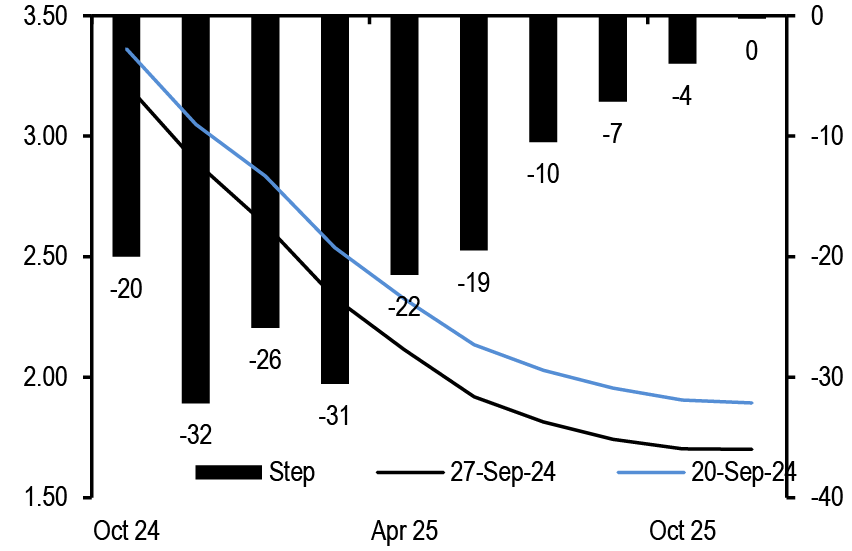
Euro area HICP (flash) for September and US payroll report are the highlights of next week and will go a long way in crystallizing the easing for the ECB and the Fed for their respective next meetings. HICP inflation is expected to fall in September due to favourable base effects whereas core and especially services are expected to remain sticky. However, a downward surprise, in line with that seen in France and Spain this week will tilt the scale towards an October cut from the ECB. ECB commentary has been initially broadly neutral towards an October cut with guidance towards gradualism and supporting next cut only in December (see Overview); our ECB hawk/dove score has been hovering close to 0 which indicates close to neutral stance from the speakers ( Figure 35). However, weak Euro area PMIs along with any negative inflation surprise could bolster the ECB’s confidence towards the disinflation process and shift towards weakening growth backdrop. Indeed, our revised call is now for the next cut in October with ECB delivering back-to-back cuts until we reach 2% in June 2025 with risk of still lower terminal rate, even in absence of a recession.
The €STR curve is currently pricing around 20bp and 52bp of cumulative cuts for the October and December ECB meetings and a cumulative 172bp of cuts by year-end 2025 ( Figure 36). We highlight the following. First, we favour receiving Dec24 ECB €STR as a tactical trade which is currently pricing 52bp of cut as we see risk of market pricing some probability of a jumbo cut from the ECB if inflation in Germany and consequently the Euro area disappoints further next week. We would consider outright longs in Dec24 ECB €STR if the pricing retraces back to 50bp, for example.
Figure 36: The €STR curve is pricing around 20bp and 52bp of cumulative cuts for the October and December meeting. We favour receiving Dec24 ECB €STR
ECB meeting steps for the €STR curve (rhs, bp) and current €STR curve (lhs, %);
Source: J.P. Morgan.
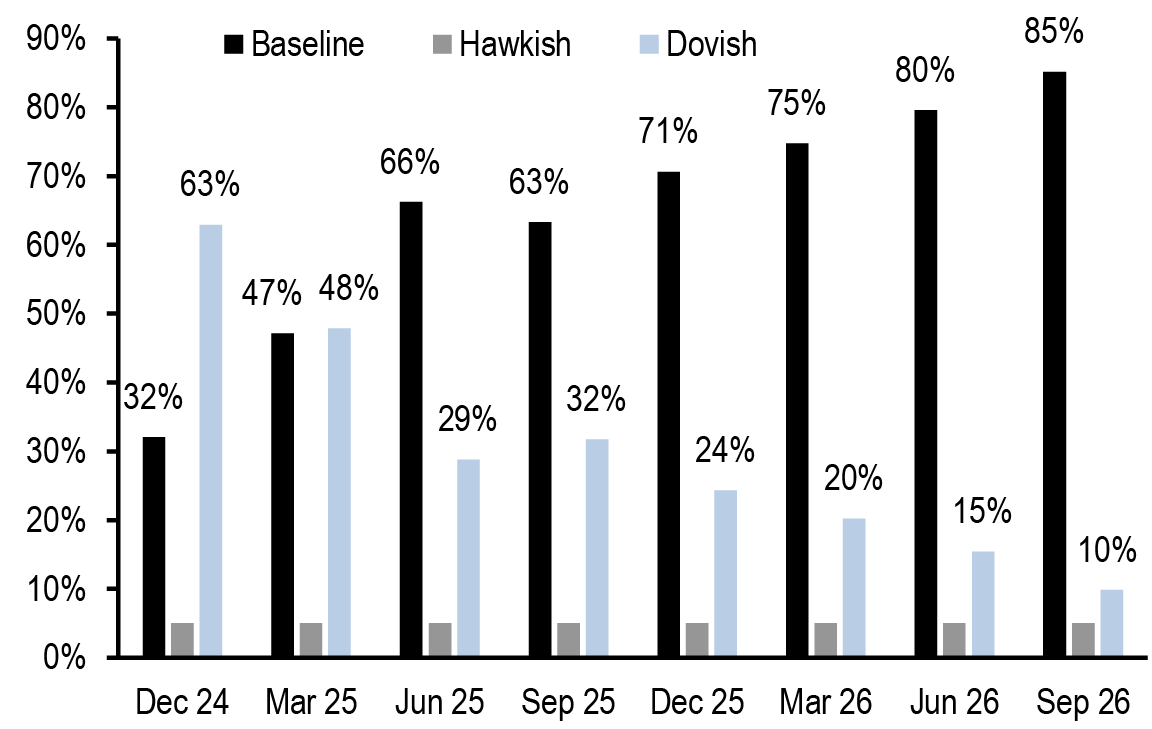
Figure 37: The €STR curve is priced closer to our dovish scenario over the next few meetings but then switches towards our baseline scenario further out
Estimated probability of the baseline/dovish scenario as implied by current €STR curve; %
Source: J.P. Morgan.
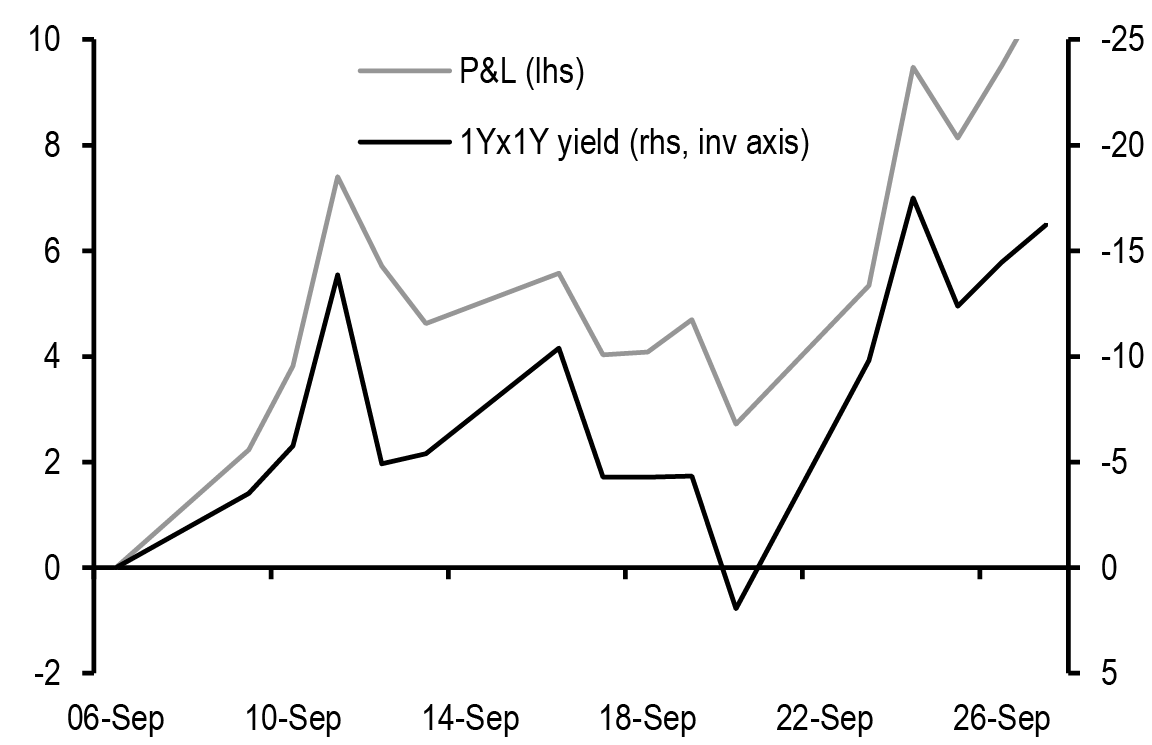
Second, the terminal rate (average over 2026 ECB meetings) priced in the curve is around 1.85%, with reds (1Yx1Y) €STR around 1.75%. The easing priced over the next few months is broadly in line with our revised call. With the risk profile in Euro area changing, both due to weaker growth backdrop and ongoing disinflationary trend with the potential of decline in services and core inflation as well, we see risks biased towards lower terminal rates. This should support a bullish duration bias. In other words, the terminal rate currently prices in some risk of a hard-landing scenario ( Figure 37). We believe that this is fair but cannot discount the risk of this increasing further as Euro area economy falters and/or there is heightened risk of an inflation undershoot the ECB is forced to take policy rates well below neutral level of rates. We keep our medium term bullish duration but keep these only via proxies ( Figure 38). To this effect, we take profit and re-strike our 1Yx1Y A/A-50bp receiver spread versus OTM payer ( Figure 39). As a new trade, we recommend buying 1Yx1Y A/A-37.5bp versus paying OTM payer. In the past, we have fully funded these receiver spreads via selling an equivalent OTM payer. A similar strategy would call for selling A+50bp payer for the package to be premium neutral. However, we superimpose our view that the risk of a 50bp backup in reds is now rather limited given macro backdrop and thus we reduce the moneyness of the payer to say A+25bp to enable us to express this bullish exposure at a net credit (see Trade Recommendations).
Figure 38: We keep medium term bullish duration exposure but only via proxies – receiver spread at the front-end funded via OTM payer offer attractive risk reward
ATMF strike, 3M carry, ATMF implied volatility, and OTM payer strike that would offset the cost of receiver spread; %

Data as of COB 26th Sep 2024.
Source: J.P. Morgan.
Figure 39: Take profit and re-strike 1Yx1Y receiver spread versus OTM payer
Cumulative P&L (lhs, bp of notional) versus change in underlying yield (rhs, bp, inverted axis)
Source: J.P. Morgan.
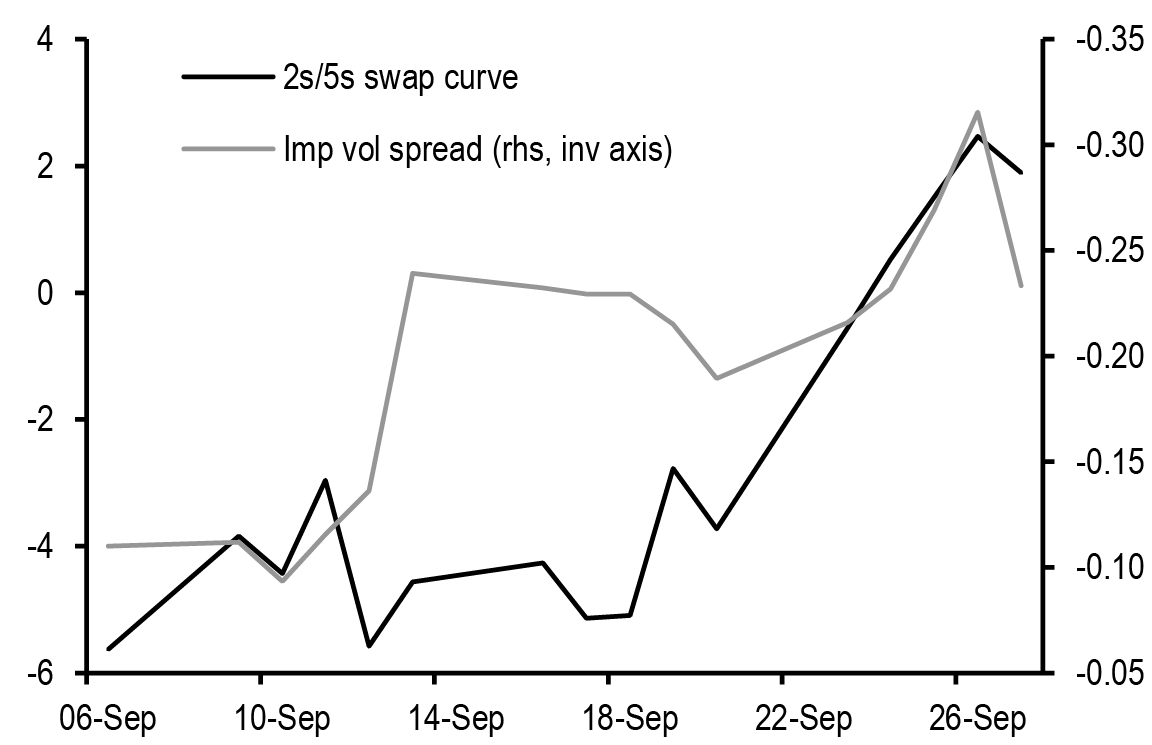
Figure 40: Take profit in 2s/5s conditional bull steepeners
Evolution of fixed dated 2s/5s swap curve (lhs, bp) and (3Mx5Y – 3Mx2Y) implied vol spread (rhs, inverted axis, bp/day); since 6thSep 2024
Source: J.P. Morgan.
Third, we continue to hold Mar25/Mar26 conditional bull steepeners via Euribor calls and midcurve calls. This reflects our view that market pricing of accelerated ECB easing is likely to be front-loaded.
For investors, who wish to position for some retracement in the current pricing, we find buying 97.125/97 1x2 Dec24 Euribor 1x2 put spread at close to flat attractive. Dec24 Euribor futures are currently around 97.15 and we see minimal risk of them rising 25bp higher to push through the upper barrier even if the ECB decides to skip an October cut. We also keep 3Mx(1Yx1Y) payer spread 1x2 as a bearish hedge that we had recommended a few weeks ago.
Further out, on the swap curve we have expressed a strategic steepening bias but have refrained from outright steepeners and instead focused on conditional bull steepeners via 2s/5s bull steepeners. The trade has benefitted from an overall bull-steepening of the swap curve and a relative richening of the 2Y volatility versus 5Y ( Figure 40). While the curve continues to exhibit a strong negative directionality versus yield, we also believe that the risk of a lower-for-longer dynamic is also increasing (not our baseline view and the probability for such an outcome is low at present) which could limit the extent of further steepening of the 2s/5s curve. Thus, we take tactical profit in our conditional 2s/5s bull-steepeners (see Trade Recommendations).
The 2s/5s/10s 50:50 swap fly has continued to gradually cheapen in the recent rally, broadly in line with our expectations; the spot 2s/5s/10s fly has cheapened around 10bp since inception (2ndAugust 2024) as 5Y swap yields are overall 20bp lower. We have conviction in this bull-belly cheapening dynamic and take profit and re-strike our 2s/5s/10s 50:50 conditional bull-belly cheapener via 3M receivers (see Trade Recommendations). Implied directionality is currently around 9% (pricing a belly richening dynamic in a rally) versus delivered directionality over the last 2M around -10% (measured using a linear regression of the 2s/5s/10s 50:50 fly versus 5Y over the last 2M) ( Figure 41).
Figure 41: The negative directionality of the 2s/5s/10s 50:50 swap fly is continuing to assert. Take profit and re-strike conditional bull-belly cheapeners via 3M receivers
2s/5s/10s 50:50 swap fly regressed against 5Y swap yield; since 1 Jan 2024; bp
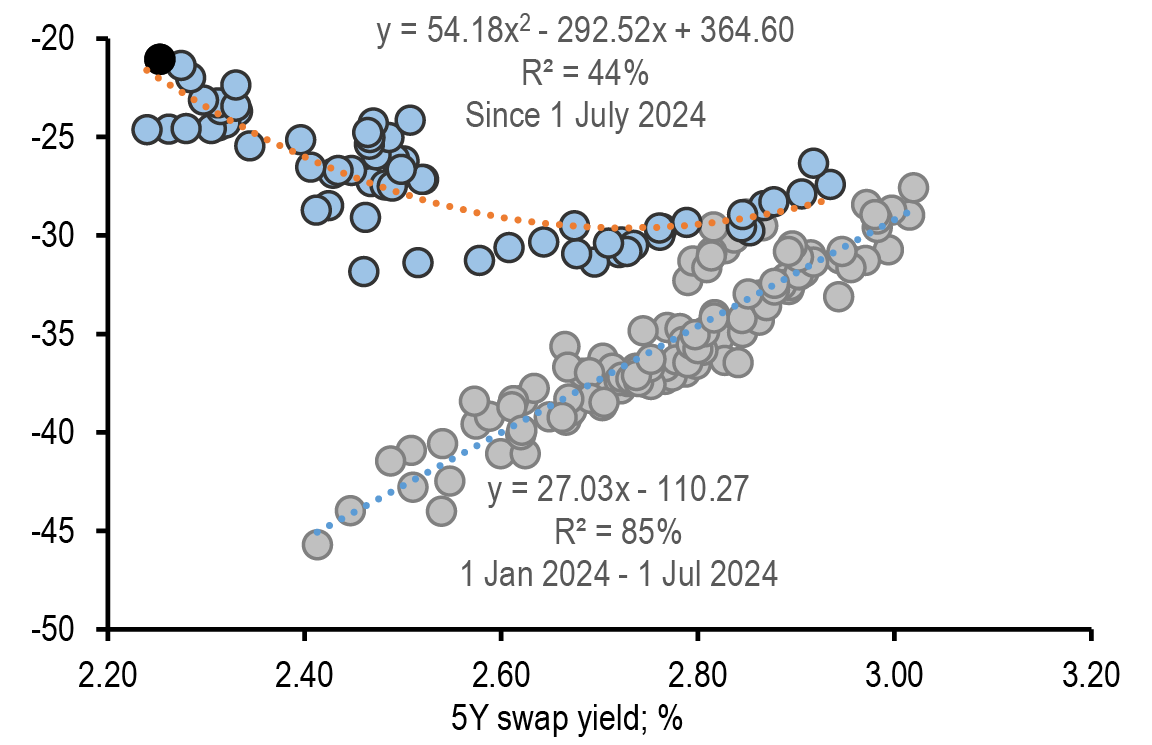
Source: J.P. Morgan.
2s/5s/10s 50:50 swap fly regressed against 5Y swap yield; past 2M; bp
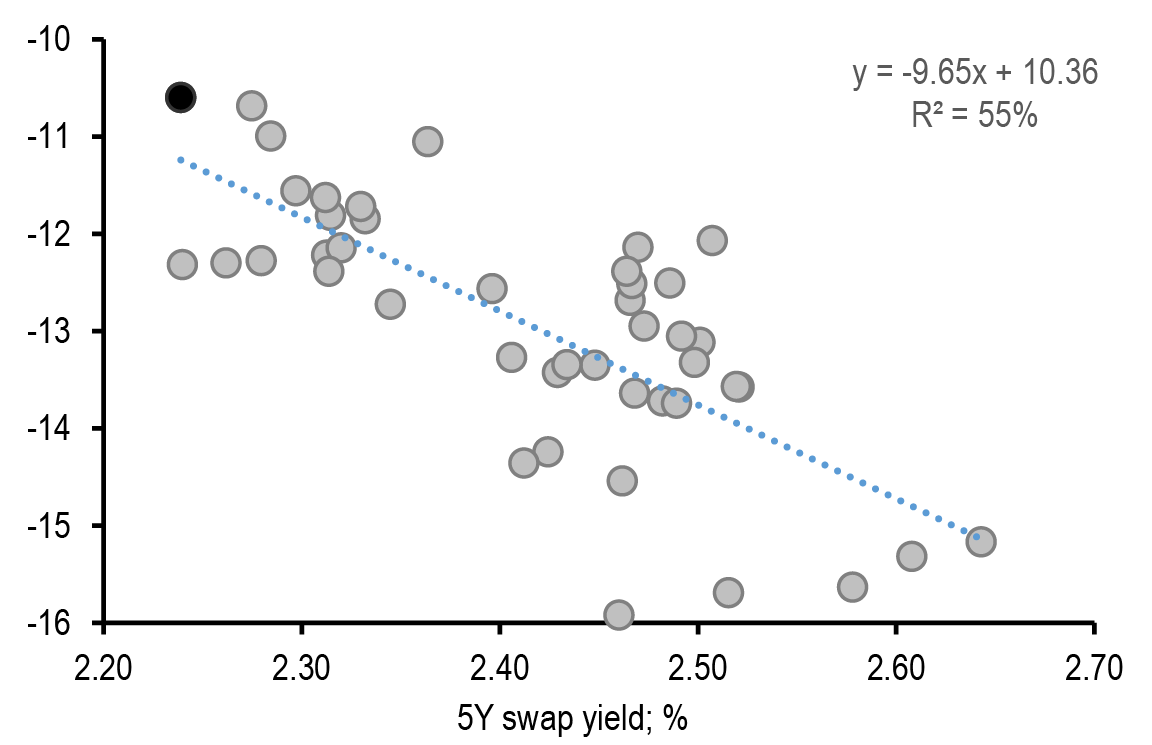
Source: J.P. Morgan.
The 10s/30s swap curve has steepened around 2-3bp over the week and is now hovering close to its steepest levels seen since the ECB started it hiking cycle in July 2022. On a fair value framework, the curve appears marginally too flat (around 4bp) ( Figure 42). As we have discussed last week, our medium-term view remains that of further steepening primarily driven by decline in front-end yields and a potentially steeper USD curve as well. However, over the short-term concerns around Dutch Pension flow indexation related receiving flows (curve flatteners) could modestly temper the overall expected steepening. In Figure 43, we show the indexation announced by top few funds in 2023 along with their funding ratios. To the best of our knowledge, none of these funds have announced the indexation for 2025 and are likely to do so over the course of 4Q24. However, we make the following considerations. First, given the sharp decline in inflation this year, we expect only modest indexation than the last two years. This should translate into limited receiving flows from these funds. Second, anecdotally these funds execute the corresponding hedging flows opportunistically and thus this time around could be spread out over the course of next few weeks. We recall than in the past these flows continue well beyond year end as well.
Figure 42: The 10s/30s swap curve appears marginally too flat in our long-term fair value model and we keep our medium-term steepening bias on the curve
10s/30s swap curve regressed against 1) 3Yx1Y swap yield (X1, quadratic fit); 2) ECB b/s as a % of GDP (X2);3) VIX (X3); 4) ECB hawkish pivot dummy (X4); and 5) 10s/30s USD swap curve (X5); since 1 Jan 2017; bp
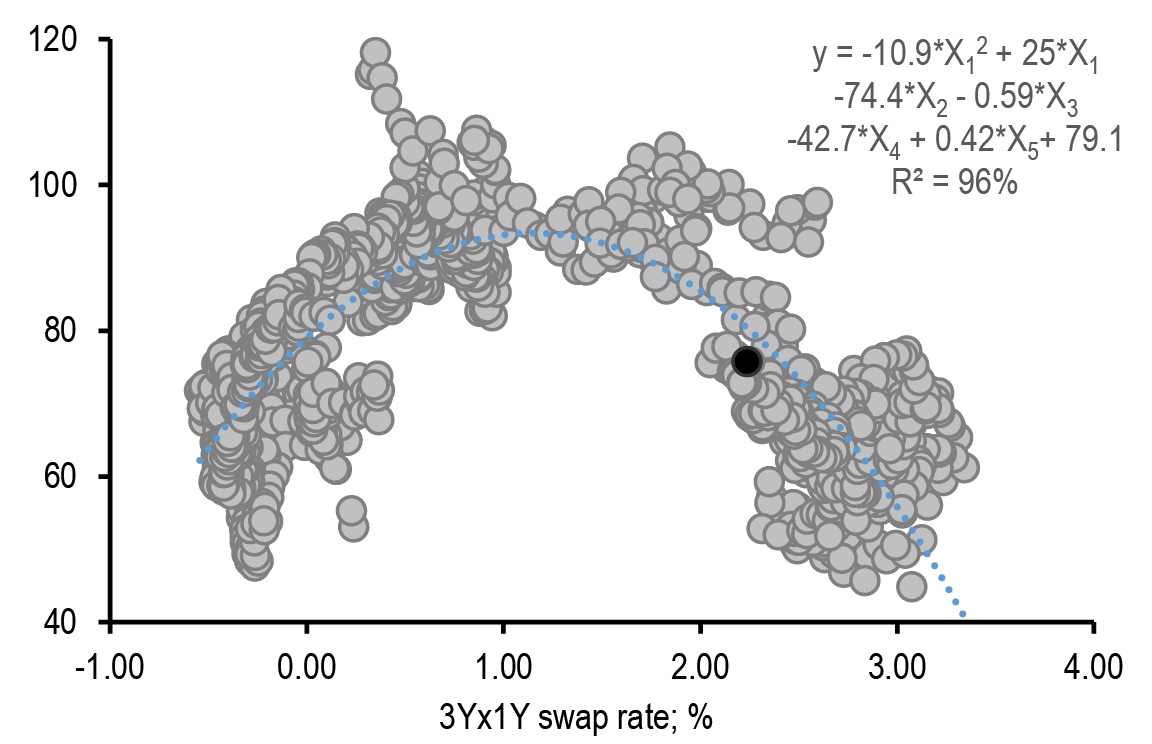
Source: J.P. Morgan.
Figure 43: Concerns around Dutch pension fund related indexation flow could temper the steepening over the short term although we believe that these flows are likely to be muted relative to last two years
Current funding ratios and indexation details for 2023 for top Dutch pension funds; %
| Dutch Pension Fund | 2024Q2 | 2023 | |||
| Policy funding ratio | Indexation | Announcement | Start date | Policy funding ratio | |
| ABP | 114% | 3.0% | 30-Nov-23 | 01-Jan-24 | 114% |
| PFZW | 111% | 4.8% | 10-Nov-23 | 01-Jan-24 | 112% |
| PMT | 110% | 3.2% | 05-Dec-23 | 01-Jun-24 | 110% |
| PME | 114% | 3.3% | 28-Nov-23 | 01-Jan-24 | 113% |
| Pensioenfonds Vervoer | 114% | 7.6% | 05-Dec-23 | 01-Jan-24 | 114% |
| BpfBouw | 126% | 0.0% | 24-Nov-23 | 01-Jan-24 | 125% |
| Detailhandel | 123% | 3.3% | 29-Nov-23 | 01-Jan-24 | 122% |
| PGB | 117% | 5.2% | 16-Nov-23 | 01-Jan-24 | 117% |
| BPL | 119% | 4.2% | 14-Dec-23 | 01-Jan-24 | 118% |
| Rabobank | 118% | 2.6% | 22-Jun-23 | 01-Jul-23 | 119% |
| Rail & OV | 132% | 0.0% | 01-Dec-23 | 01-Jan-24 | 130% |
| StiPP | 112% | 0.0% | N/A | 01-Jan-24 | 112% |
| ABN AMRO | 129% | 7.6% | N/A | 01-Jan-24 | 131% |
| ING CDC | 133% | 0.0% | 28-Aug-23 | 01-Jan-24 | 131% |
Last week, we had recommended tactical 10s/30s swap curve flatteners beta-hedged with longs in reds (16% risk) on RV considerations. The relative value has partially corrected but the curve still appears marginally too steep on a short-term regression basis ( Figure 44). Thus, we hold this as RV trade.
Figure 44: Hold 10s/30s swap curve flatteners beta hedged with longs in reds on RV considerations
3Mx(10s/30s) swap curve regressed against 1Yx1Y €STR; past 6M; bp
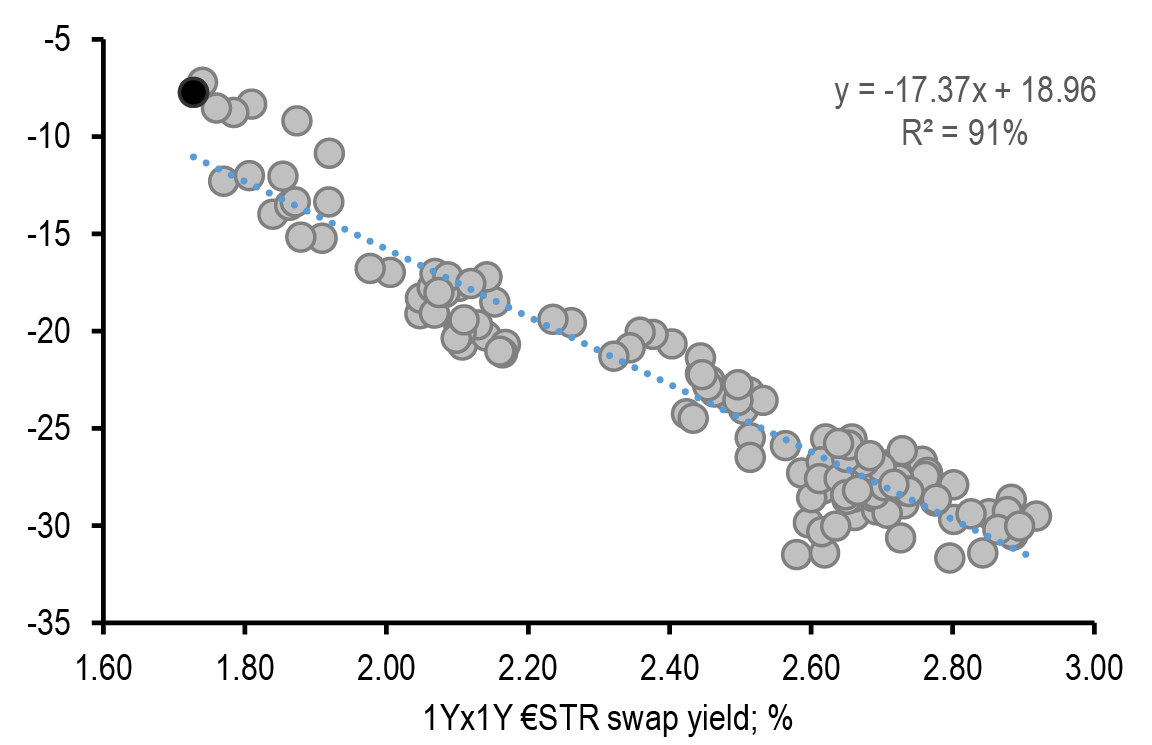
Source: J.P. Morgan.
Swap spreads
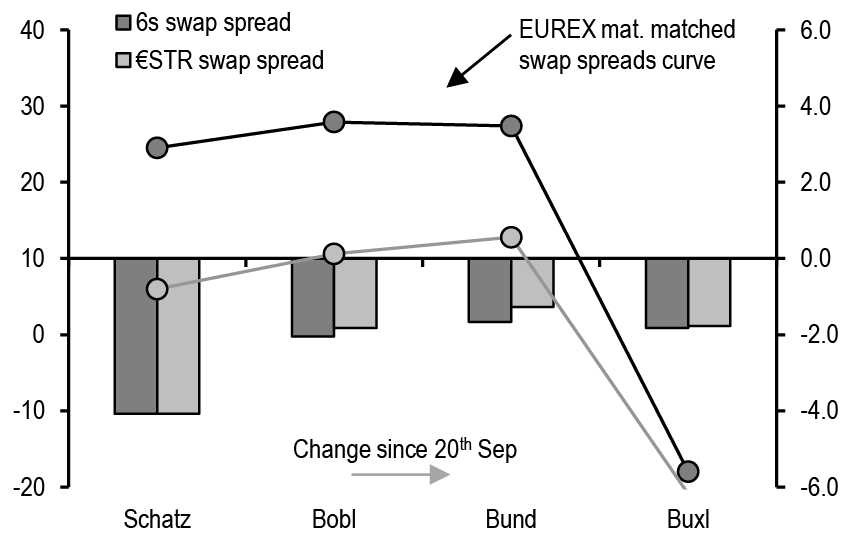
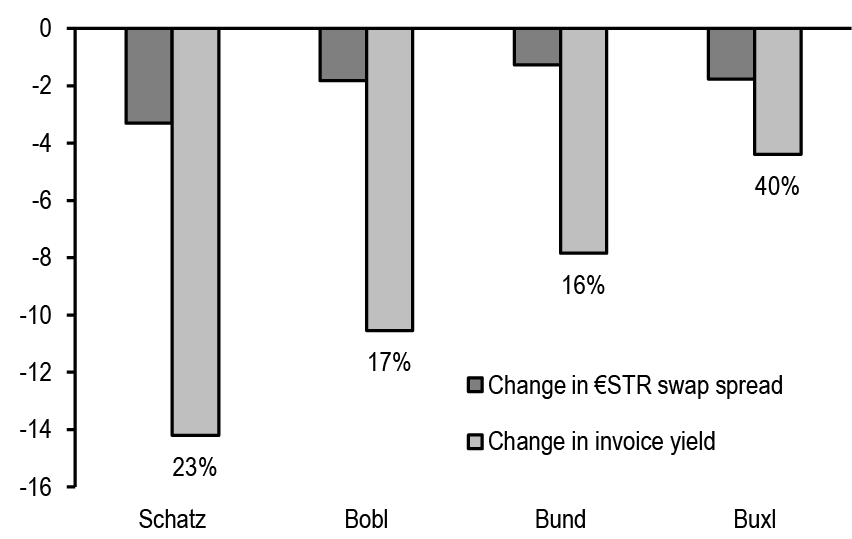
Over the past week German Eurex swap spreads were narrower across the curve with an underperformance of Schatz swap spread and a steepening of the swap spread curve ( Figure 45). Macro data over the week tilted decisively to the downside with weak flash PMI reading on Monday and significant downside surprise on inflation in France and Spain on Friday. These surprises triggered a large rally in €STR at the short end of the curve with market pricing a lower trough and a faster easing cycle (see Overview) and a significant bull steepening of the German curve, turning directionality of swap spreads to yield levels unusually positive ( Figure 46).
Figure 45: German Eurex swap spreads were narrower across the curve with an underperformance of Schatz swap spread and a steepening of the swap spread curve
Current level of Dec24 Schatz, Bobl, Bund, and Buxl maturity matched 6s and OIS (€STR) swap spreads and change since 20th September; bp
Source: J.P. Morgan.
Figure 46: Directionality of swap spreads has turned unusually positive across the curve with the German curve delivering a pronounced bull steepening primarily driven by sharp drop in Euro area PMI and downside inflation surprises
Changes since 20th September of Dec24 Schatz, Bobl and Bund €STR swap spreads and changes in respective invoice yields with ratio shown as percentage; bp
Source: J.P. Morgan.
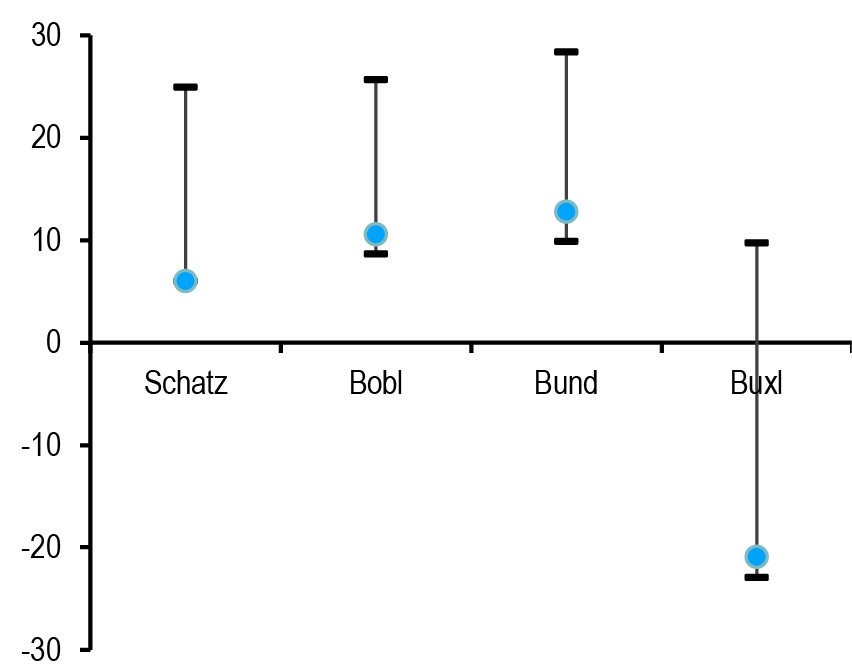
Valuation considerations remain broadly unchanged for German swap spreads. The narrowing dynamic has been a feature for most of 2024 and at current levels across the curve we are now hovering close to the YTD narrowest levels ( Figure 47). Long term technical and macro factors such as collateral availability and easing of financial conditions have contributed to most of the narrowing in 2024, with additional contribution from NIM hedging receiving flows from financial institutions. The directionality of swap spreads have been strongly negative in 1H24, as yield declined from the sharp rally into late 2023 as market was repricing the unwinding of the QE/scarcity story. In the last quarter the directionality of swap spreads to yield levels has been much weaker and more mixed ( Figure 48), with idiosyncratic bouts of flight to quality and risk aversion on one side (negative directionality with widening in a rally), and narrower swap spreads on easier financial conditions as market prices in a lower terminal rate (positive directionality with narrowing in a rally).
Figure 47: German swap spreads have been narrowing for most of 2024 and are now hovering close to their YTD narrowest levels
Current values of Schatz, Bobl, Bund and Buxl €STR swap spreads and range since 1 Jan; bp
Source: J.P. Morgan.
Figure 48: As highlighted in the past few weeks the directionality of swap spreads to respective German yields has been much weaker in 3Q24, as idiosyncratic flight to quality flows amidst a broad repricing of ECB easing expectations became more relevant drivers
Beta and r-squared of 2Y, 5Y, 10Y, 15Y and 30Y German b/m, Schatz, Bobl, Bund and Buxl swap spreads against respective benchmark and invoice yields since July 2024 and between late December 2023 and early June 2024; %
| Swap spread vs 6s | Since 01 Jul 2024 | Dec23 to Jun24 | ||
| Beta | R-Sqr | Beta | R-Sqr | |
| Schatz | 3 | 20% | -17 | 59% |
| 2Y | 6 | 41% | -16 | 55% |
| Bobl | 4 | 10% | -22 | 64% |
| 5Y | 4 | 12% | -22 | 67% |
| Bund | -1 | 1% | -33 | 63% |
| 10Y | 0 | 0% | -35 | 66% |
| 15Y | 1 | 0% | -53 | 77% |
| Buxl | -8 | 18% | -56 | 50% |
| 30Y | -8 | 17% | -51 | 62% |
Source: J.P. Morgan.
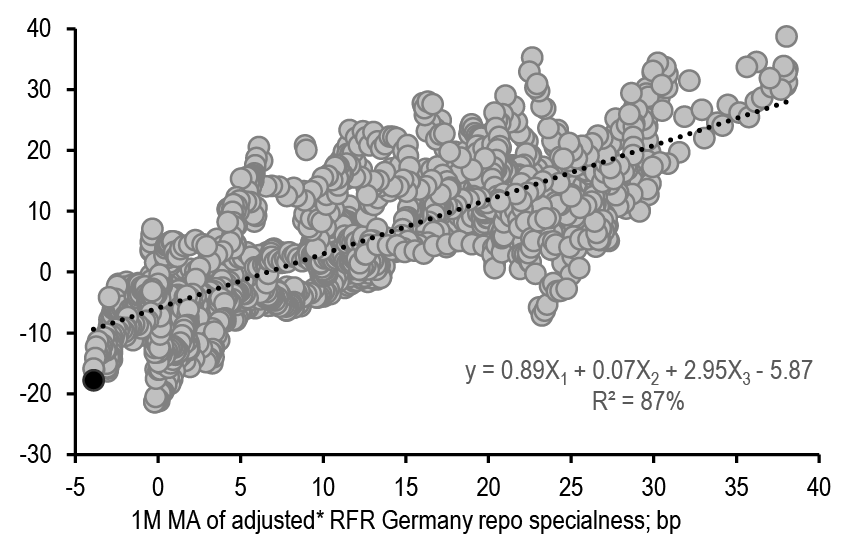
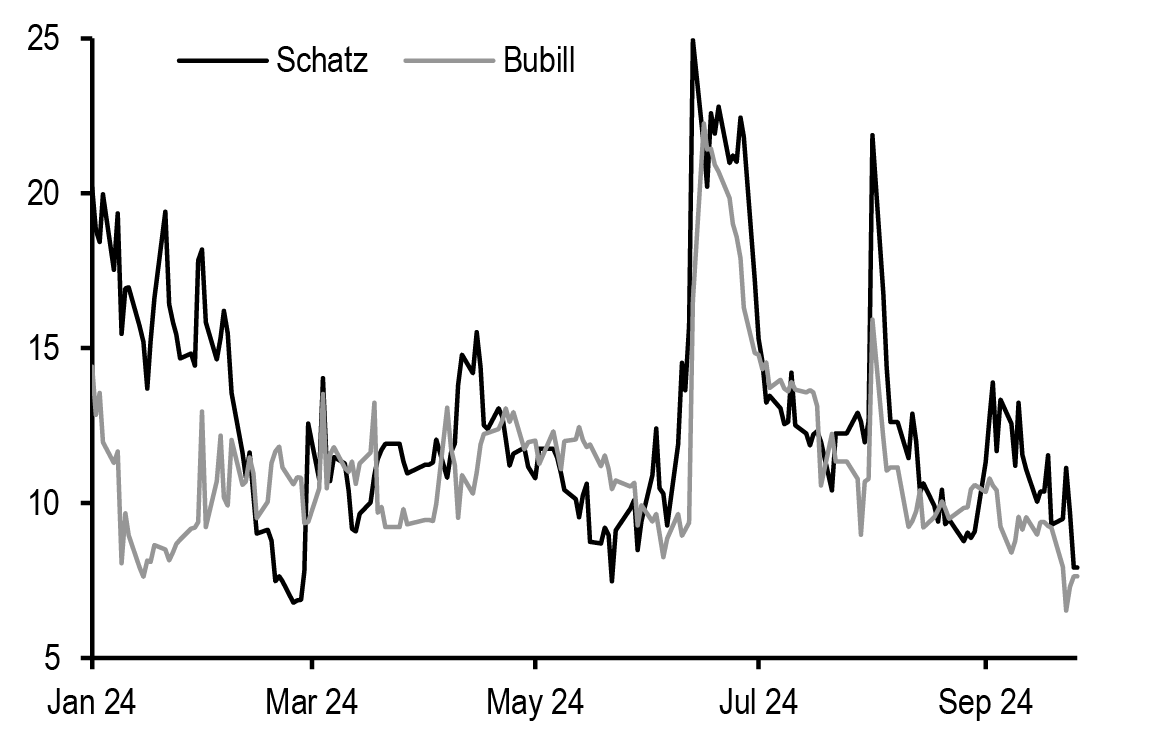
Schatz €STR swap spread continues to trade on the narrow side vs. fundamental drivers in our long-term revised fair value framework ( Figure 49). We discussed over the past few weeks the challenges in including OAT/Bund spread as regressor in our model. The repricing of French sovereign spreads on fiscal concerns has structurally changed in our view the empirical beta of Schatz swap spread. Investors’ positioning appears skewed towards narrower on carry and roll down considerations, although at current levels it appears quite limited ( Figure 50).
Figure 49: Schatz €STR swap spread continues to trade on the narrow side vs. fundamental drivers in our long-term revised fair value framework
Schatz invoice OIS swap spread (vs. €STR rolling 1st of delivery month) and model levels implied by regression against: 1) 1M MA of adjusted* RFR Germany repo specialness (X1); 2) 10Y BTP/Bund since the 2016 US Presidential election (X2); 3) 3Mx2Y EUR swaption volatility (X3); since 1 Jan 2015; bp
Source: * Excluding year-end effect from 23 December 2016 to 6 January 2017 and the year-end and quarter-end effect over the last business days of the quarters. Repo Funds Rate Germany (RFR Germany) is a daily euro repo index calculated from trades executed on the BrokerTec and MTS electronic platforms. All eligible repo trades are centrally cleared and RFR Germany is calculated and published by ICAP Information Services. RFR Germany is calculated with repo trades that use German sovereign government bonds. RFR Index source: Broker Tec and MTS trading.BrokerTec, MTS trading, and J.P.Morgan.
Figure 50: Investors’ positioning appears skewed towards narrower on carry and roll down considerations
Schatz €STR and Bubill 6M €STR swap spread; since 1 Jan 2024; bp
Source: J.P. Morgan.
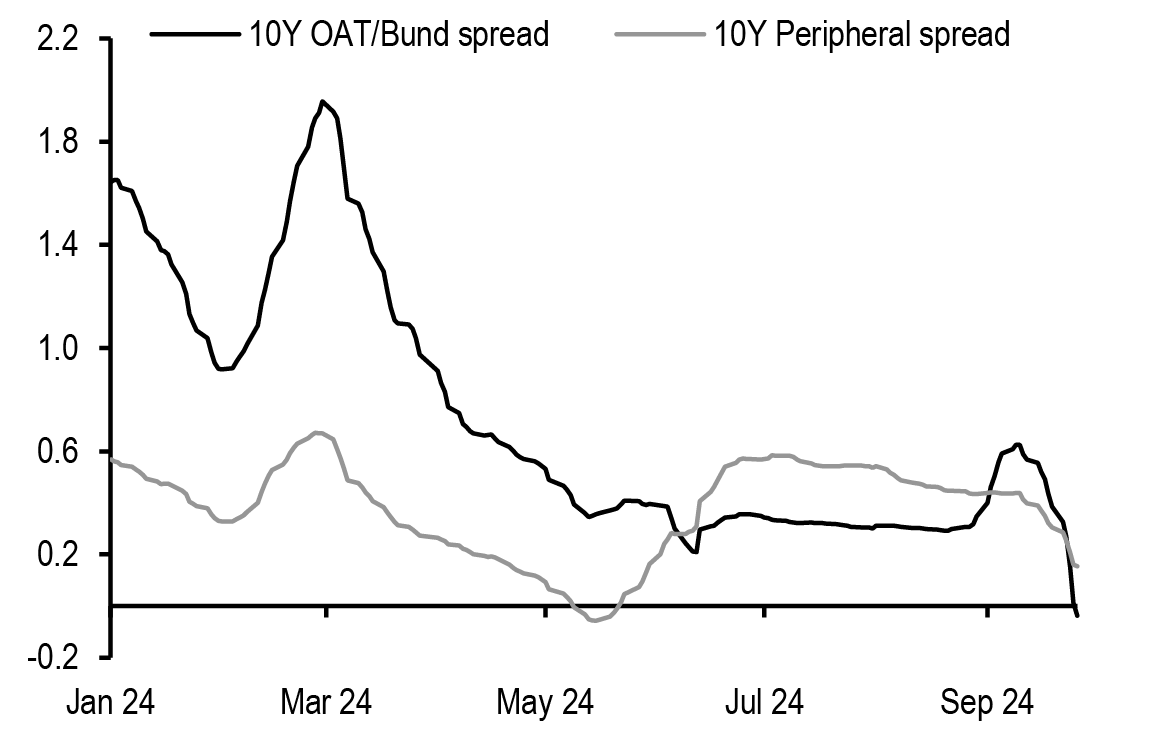
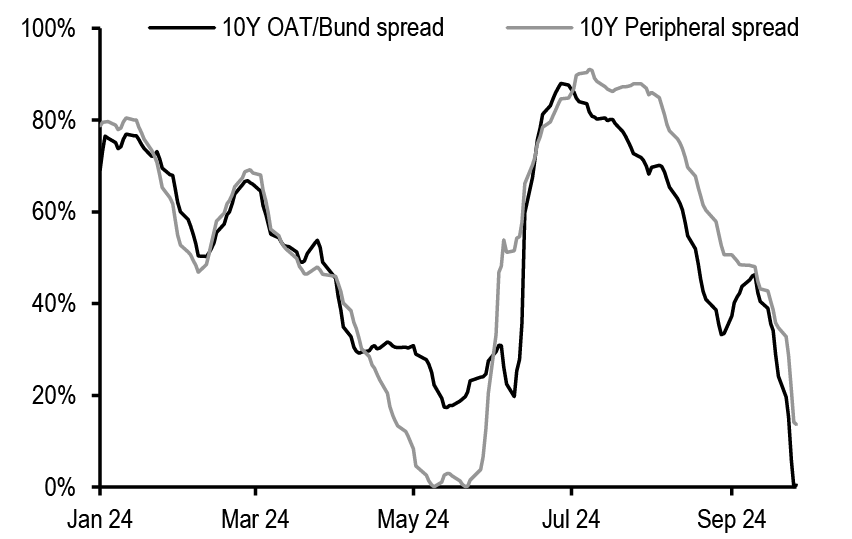
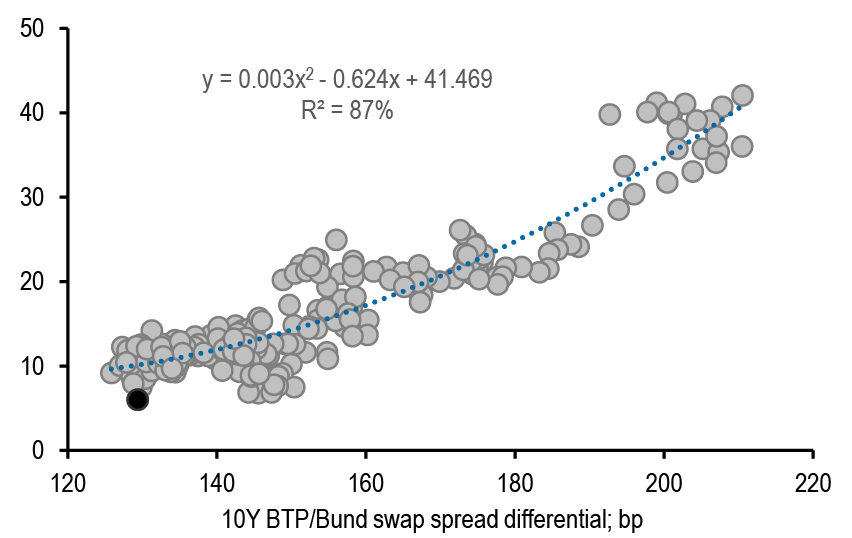
Looking at the directionality of swap spreads to OAT/Bund and peripheral spreads we note that the beta to OAT/Bund spread increased locally around the French elections but declined sharply recently along with similar but more modest decline of beta vs. peripheral spreads ( Figure 51). We acknowledge that the post QE period will deliver on average a lower sensitivity to intra-EMU spreads but nevertheless we continue to believe that Schatz €STR swap spread widener offer a convex hedge to intra-EMU tightener. This week we revised the expected trading range for 10Y BTP/Bund to 120-150bp and believe that the room from further narrowing in Schatz €STR appears limited around current levels ( Figure 52). In our portfolio of broad long intra-EMU spreads (see Euro Cash) we find Schatz €STR swap spread widener an attractive risk off hedge and continue to hold the trade, despite recent underperformance.
Figure 51: The beta to OAT/Bund spreads increased locally around the elections but declined sharply recently along with similar but more modest decline of beta vs. peripheral spreads
3M beta (lhs) and R2 (rhs) of Schatz OIS swap spread versus 10Y OAT/Bund spread and 10Y weighted peripheral spread; since Jan 2024;
Source: J.P. Morgan.
Source: J.P. Morgan.
Figure 52: We expect a 120-150bp trading range for 10Y BTP/Bund which would suggest limited narrowing in Schatz €STR swap spread from current levels
Schatz €STR swap spread regressed against 10Y BTP/Bund swap spread differential; since 1 Oct 2023; bp
Source: J.P. Morgan.
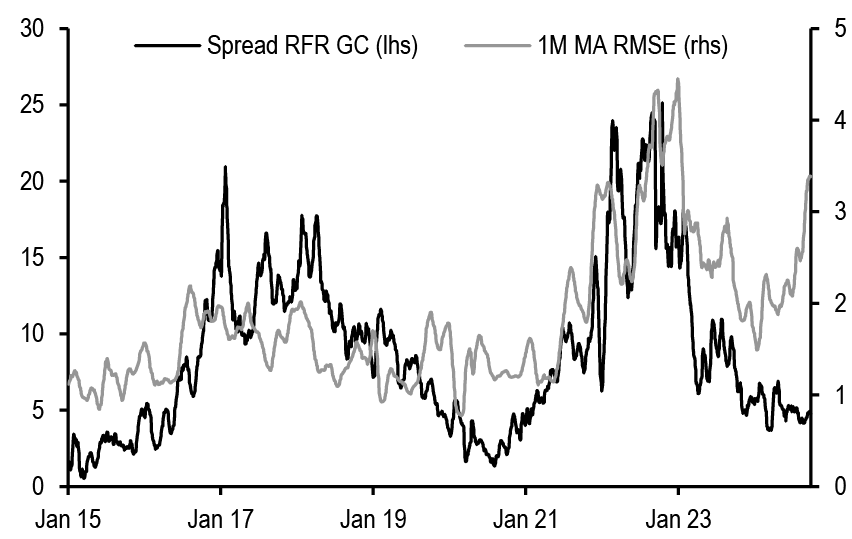
Looking into more details at the drivers, we find that funding rates continues to stay cheap on the German curve and they appear too cheap vs. underlying drivers such as flows of QE purchases, distortion on the German curve and proxy for international investors’ demand ( Figure 53). The residual vs. the model has increased over the past few weeks and is mostly explained by an increase in the distortion of the German curve, as measured by our Root-Mean-Squared-Error of the par curve ( Figure 54). This distortion has not triggered broad richening of German funding rates, with more selective idiosyncratic richening (most in short dated off-the-run Bund). However we believe it should limit further richening of funding rates from here.
Figure 53: Funding rates continues to stay cheap on the German curve and they appear too cheap vs. underlying drivers such as flows of QE purchases, distortion on the German curve and proxy for international investors’ demand
2W MA of German RFR richness to EONIA and model regressed against 1) average monthly ECB asset purchases (X1), 2) 1M MA of RMSE of German par fitted curve (X2), 3) dummy variable since they started buying bonds below the deposit rate (X3), 4) spread between RFR German repo rate and GC (X4) and 5) pick up of German repo by USD based account (X5); since Jan 2015; bp
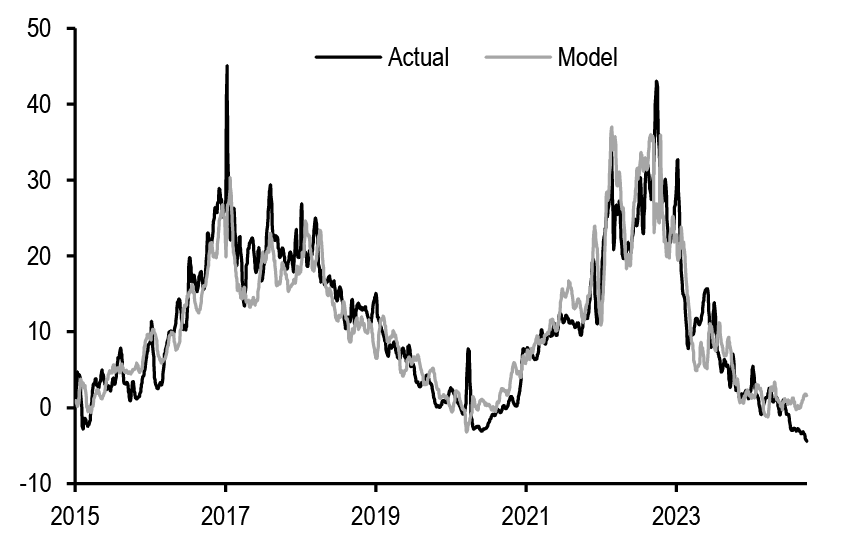
* Excluding year-end effect from 23 December 2016 to 6 January 2017 and the year-end and quarter-end effect over the last business days of the quarters. Repo Funds Rate Germany (RFR Germany) is a daily euro repo index calculated from trades executed on the BrokerTec and MTS electronic platforms. All eligible repo trades are centrally cleared and RFR Germany is calculated and published by ICAP Information Services. RFR Germany is calculated with repo trades that use German sovereign government bonds.
Source: BrokerTec, MTS trading, and J.P.Morgan.
Figure 54: The distortion on the German par curve has not resulted in a broad richening of German Repo Funds Rates, but should leave room for limited richening from here
2W MA of German RFR richness to EONIA (lhs) and 1M MA of RMSE of German par fitted curve (rhs); since Jan 2015; bp
Source: J.P. Morgan.
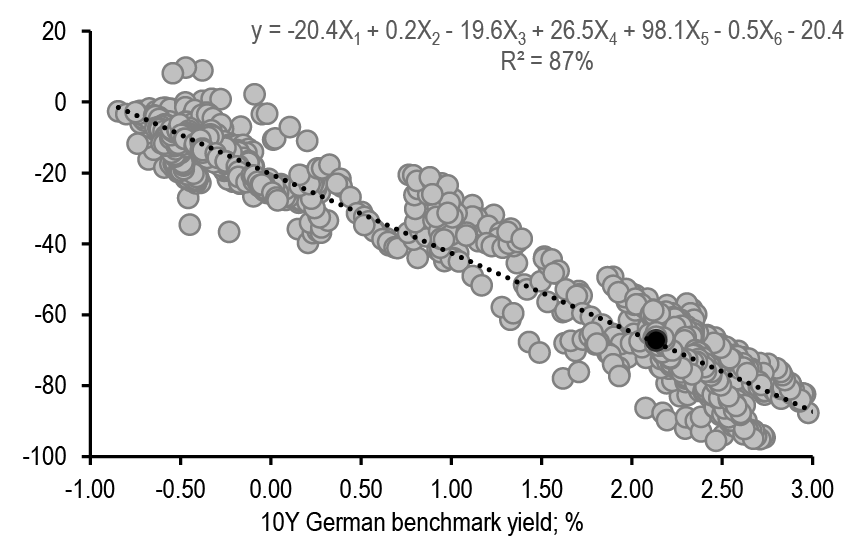
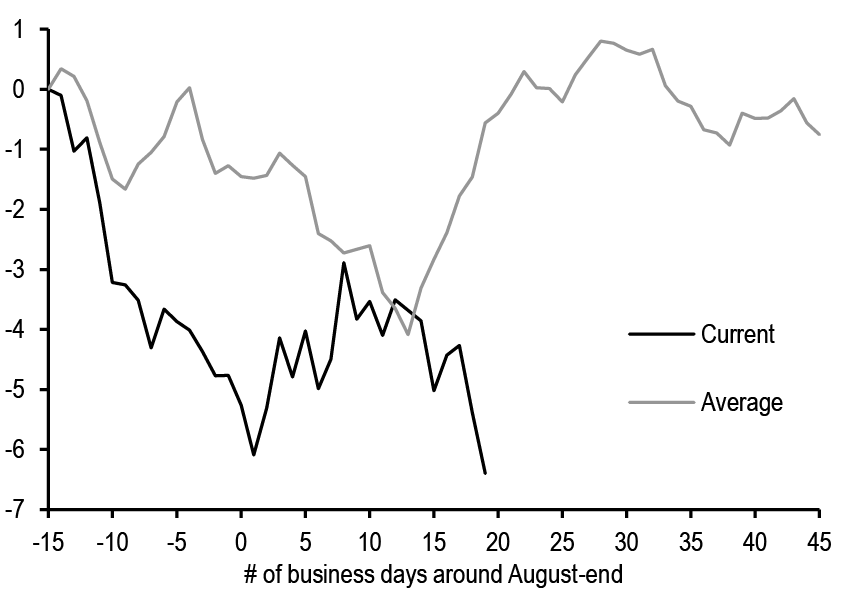
Further out the curve, Bund swap spread is trading fair to a touch too wide in our fair value model, with the value of the residual turning positive for the first time since early August ( Figure 55). The value of the residual is not large enough to warrant outright positioning in our view. Our bias in unchanged and would like to fade a widening move from current levels. We highlighted over the past few weeks how an earlier than usual seasonal pattern could actually trigger a modest rewidening when swapped issuance activity slows down after the seasonal September pick-up. Looking in details, we note that the seasonality of German swap spread around the typical issuance activity in September took place earlier with trough of swap spreads in late August rather than in mid-September, with mixed performance thereafter ( Figure 56).
With Bund swap spread marginally on the wide side in our fair-value framework, and given our widening bias in Schatz €STR swap spread as risk-off hedge we expect a flattening of the swap spread curve and initiate Dec24 Schatz/Bund €STR swap spread curve flattener ( Figure 57) (see Trade Recommendations).
Figure 55: Bund swap spread is trading fair to a touch too wide in our fair value model, with the value of the residual turning positive for the first time since since early August
Front Bund invoice swap spreads vs. 6s regressed against 1) 10Y German benchmark yield (X1), 2) 10Y weighted peripheral spread (X2), 3) a dummy variable to include the PEPP announcements in March 2020 (X3), 4) 1M OIS rate 2Y forward (X4), 5) ECB balance sheet as % of GDP (X5), 6) 1M moving average of fixed rate swapped issuance (X6); since 1 Jan 2019; bp
Source: ECB, Dealogic, and J.P.Morgan.
Figure 56: The seasonality of German swap spread around the typical issuance activity in September took place earlier with trough of swap spreads in late August rather than in mid-September, with mixed performance thereafter
10Y German benchmark swap spread vs. 6s around end of August; since 2015; bp
Source: J.P. Morgan.
Figure 57: Our widening bias in Schatz €STR swap spread as risk-off hedge should drive a flattening of the swap spread curve: initiate Dec24 Schatz/Bund €STR swap spread curve flattener
Schatz/Bund €STR swap spread curve regressed against a) Schatz €STR swap spread only (lhs) and b) Schatz €STR swap spread and dummy variable on European elections (rhs); since mid-Jun 2023; bp
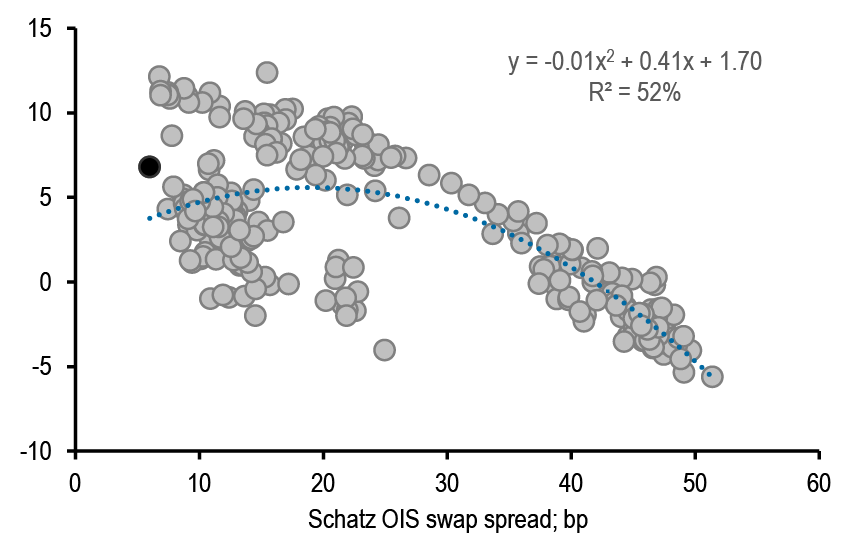
Source: J.P. Morgan.
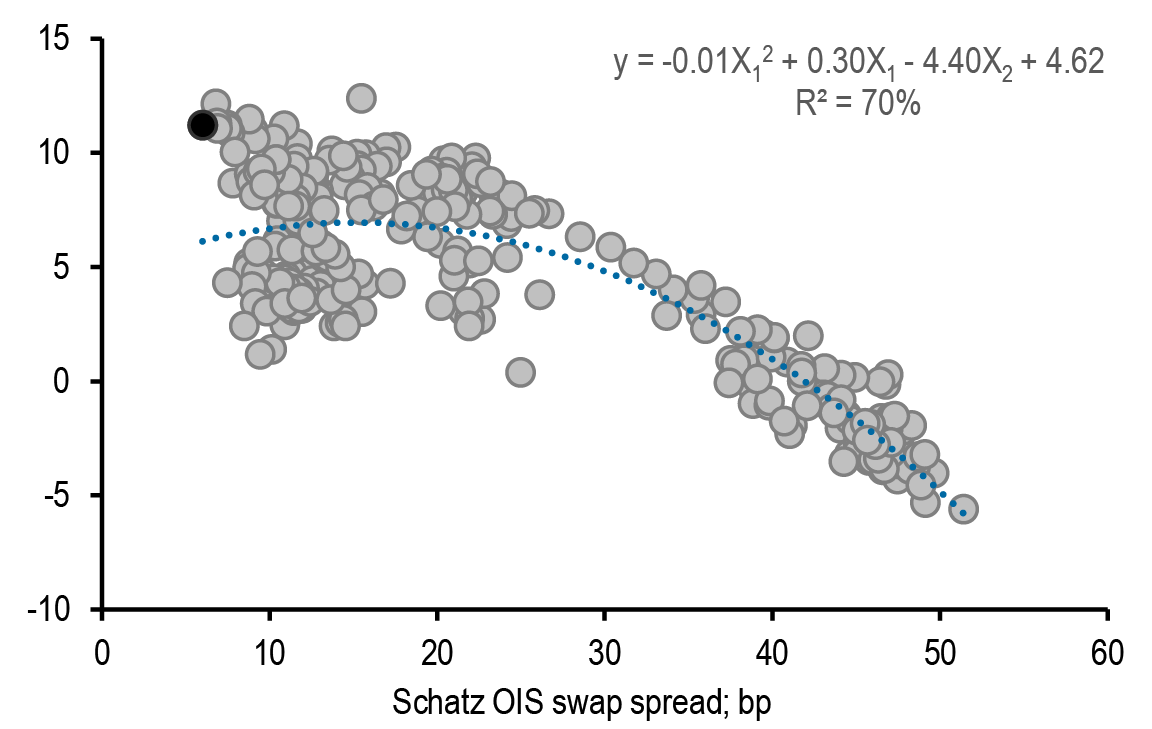
Source: J.P. Morgan.
Volatility
Implied volatility increased across the curve with a decent flattening of the volatility curve across tails ( Figure 58). The increase in volatility was driven primarily by weak PMIs and benign inflation print which has resulted market now pricing high probability of an October cut. The flattening of the volatility curve was in line with our expectations that we have been discussing over the past few weeks – any further increase in the easing priced in the curve is likely to be associated with a flatter volatility curve across tails. Delivered volatility on 1M lookback was mixed, increasing around 0.1-0.3bp/day in sub 10Y while declining around 0.3bp/day at the long-end of the curve.
Figure 58: Implieds increased across the curve with a decent flattening of the volatility curve across tails
3M expiry implied volatility on various tails, current and 1W ago (lhs) versus 1W change in implieds (rhs); bp/day
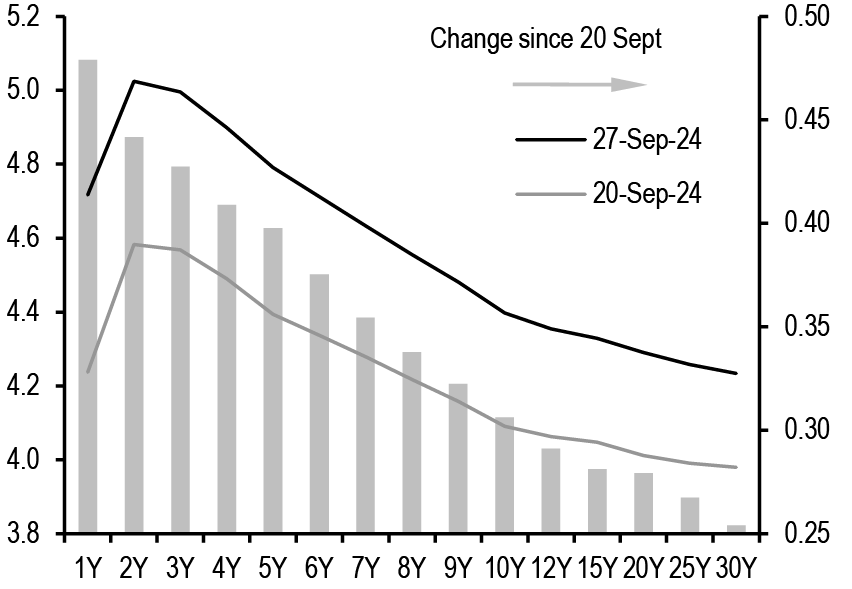
Source: J.P. Morgan.
Figure 59: Mean reversion in yields is strong at the long-end of the curve
3M delivered volatility for various swaps using different change frequencies; bp/day
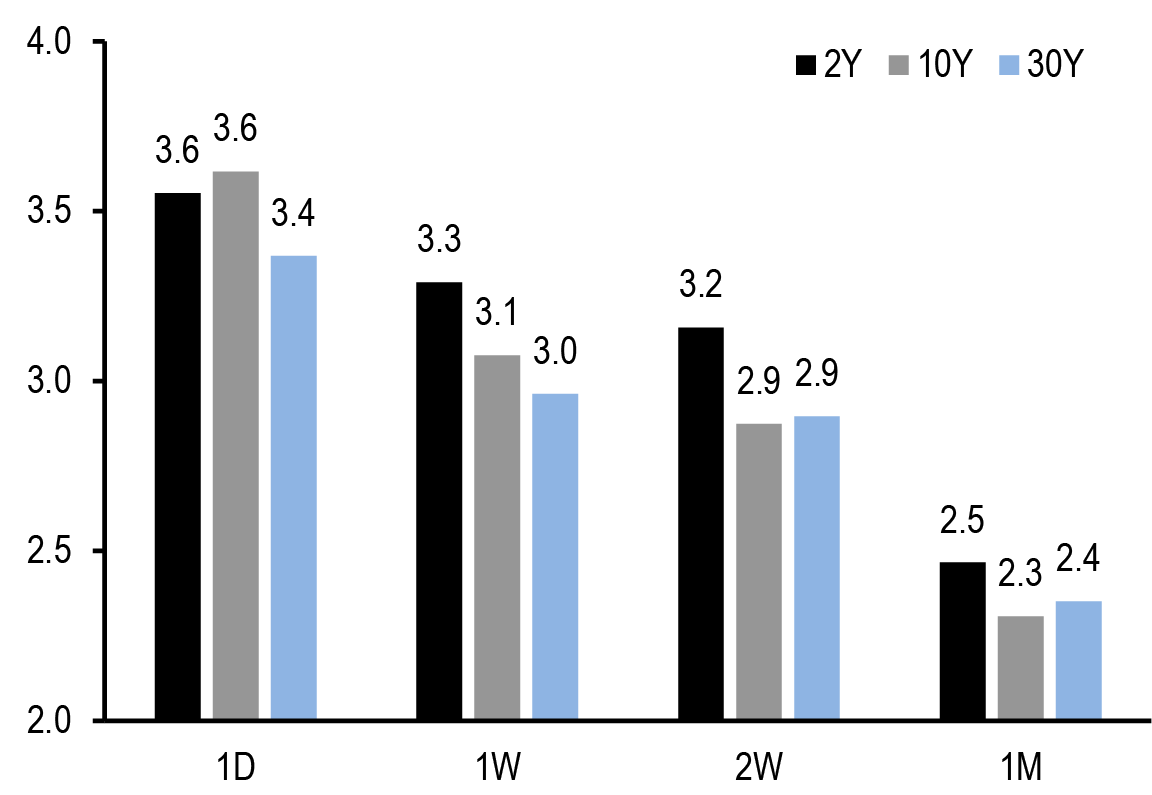
Source: J.P. Morgan.
We have been recommending short volatility positions at the long-end of the curve and reiterate our strong conviction on this view, even though implieds have increased modestly over the past week and the upcoming US payrolls next week could impart locally some temporary volatility. Our conviction on short volatility positions, especially at the long-end of the curve, is primarily driven by the fact that delivered volatility is low and more importantly expected to stay muted over the near term. This reflects our view that long-end rates are expected to remain rangebound and exhibit strong degree of mean reversion ( Figure 59). It will require significant repricing of ECB policy rate expectations in either direction for terminal rate pricing and consequently the long-end of the curve to move one way or another. In other words, macro volatility remains low which should support limited risk premium on the curve. This expectation of rangebound yield is the cornerstone of our conviction on short volatility positions at the long-end of the curve.
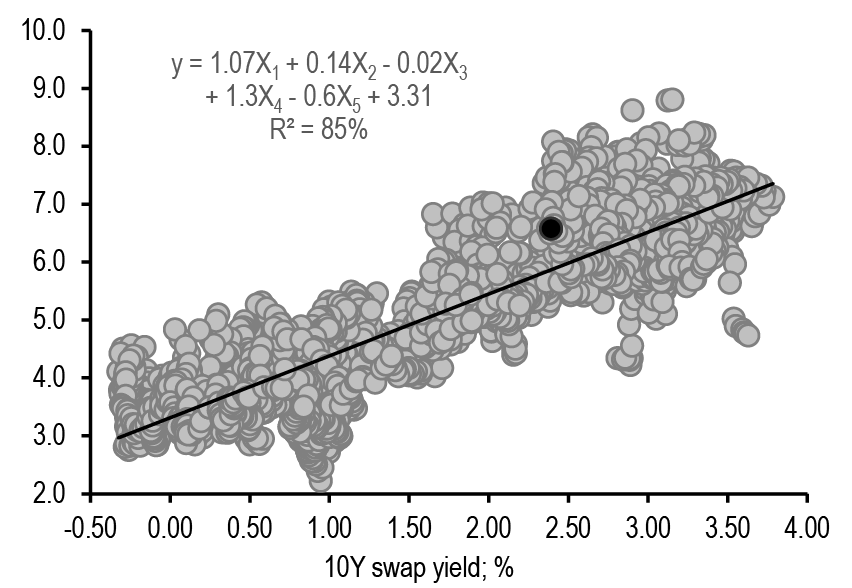
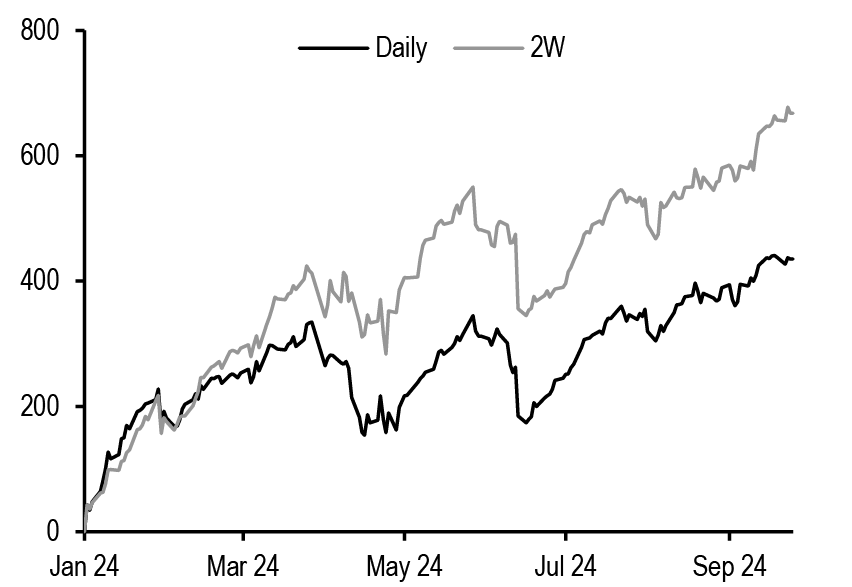
On valuations, long-end implieds appear too rich versus fundamental drivers in our long-term fair value model which uses swap rate, Euro area HICP inflation, GDP volatility, and ECB balance sheet (% of GDP) as regressors and run since 2010 ( Figure 60). An expected further decline in swap yield (see above) and lowering of inflation should put downward pressure on implied, as per this model. Support to short volatility positions also come from muted delivered volatility, which reduces further if we measure using low-frequency changes – an indication of strong mean reversion. Indeed, short gamma positions with infrequent delta-hedging would have yielded significantly higher returns on a YTD basis ( Figure 61).
Figure 60: Long-end implieds appear too rich versus fundamental drivers
3Mx10Y implied vol regressed against 1) 10Y swap yield (X1), 2) Euro area HICP inflation (X2),3) 1W MA of Bund market depth (X3), 4) ECB balance sheet as % of GDP (X4), and 5) ECB Dec22 dummy (X5, defined as 1 for dates after 16 Dec2022 and 0 before that); since 1 Jan 2010; bp/day
Source: J.P. Morgan.
Figure 61: Short gamma positions with infrequent delta-hedging have yielded significantly higher returns relative to daily delta-hedging on a YTD basis
Cumulative return from short 3Mx30Y gamma (daily and 10D delta-hedging rule); since 1 Jan 2024; bp of notional
Source: J.P. Morgan.
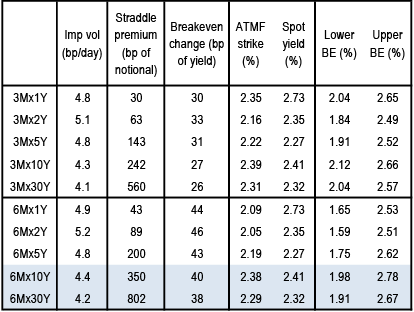
We keep our short volatility position in unhedged 6Mx10Y straddle that we had recommended a few weeks ago. These positions offer wide breakevens of (2.0%, 2.8%) at expiry to which we ascribe a low probability of breaching ( Figure 62). Assuming 10Y swap spread of around 25bp, this implies 10Y Bund yield is within (1.75%, 2.55%) versus current level of around 2.10%. Our baseline forecast for 10Y Bund yield is to be around 1.95% by end 1Q25 (6M expiry) and we anticipate Bund yields to potentially breach the lower barrier only if market starts to price elevated risk of a “hard-landing” scenario and an aggressive easing cycle – not our baseline view.
Figure 62: We stay short 6Mx10Y unhedged straddles on expectation of range bound yields and low probability of breaching the breakevens
Current implied volatility (bp/day), premium (bp of notional), breakeven change at expiry(bp of yield) and upper/lower breakeven range at option expiry (%);
Source: J.P. Morgan.
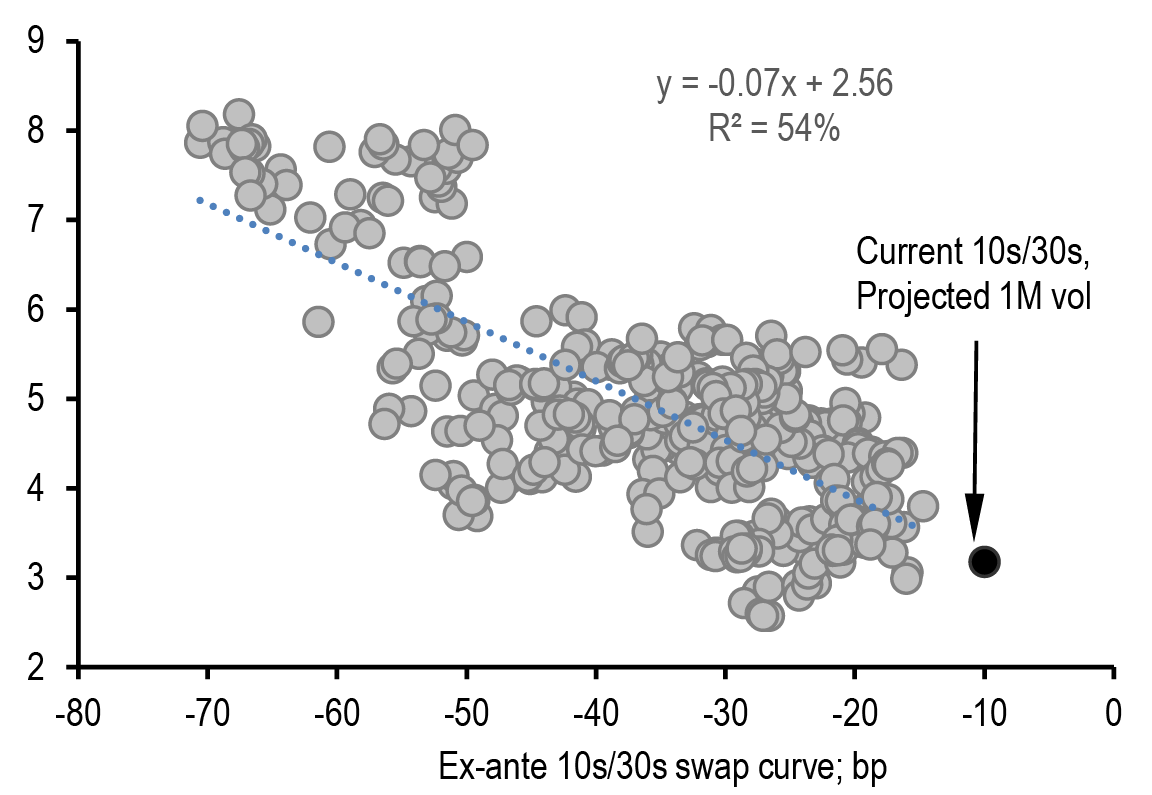
Figure 63: We expect delivered volatility of 30Y swaps to remain well below current implieds based on a relationship of delivered volatility versus ex-ante level of the 10s/30s swap curve
Rolling 1M delivered volatility of the 30Y swaps regressed against ex-ante level of 10s/30s swap curve; since 1 Jan 2023; bp/day
Source: J.P. Morgan.
We add to our short volatility bias by selling 3Mx30Y gamma with infrequent delta hedging (every two weeks or if the delta changes by 10%) (see Trade Recommendations). We expect implieds to remain sticky over the next week going into US payroll and then decline modestly from there. Our conviction on short gamma positions comes from an expectation of low delivered volatility. 1M delivered volatility of 30Y swaps has exhibited a strong negative correlation with ex-ante levels of the 10s/30s swaps ( Figure 63); a flatter curve has been associated with high risk premium and thus elevated volatility. Assuming this relationship holds, current level of 10s/30s swap curve suggests that delivered volatility over the next month is projected to be around 3.2bp/day versus current level of implieds at 4.3bp/day.
Similarly, we model returns from short 3Mx30Y straddles (daily delta-hedging) using ex-ante levels of implieds and 10s/30s swap curve ( Figure 64). On average, selling gamma at higher level of implieds has been profitable which suggests mean reversion of implieds. Similarly, selling gamma at flatter levels of the 10s/30s curve (large negative value) has yielded negative returns to short gamma positions as these are associated with higher level of delivered volatility (see above). Current level of implieds and 10s/30s swap curve suggest that short 3Mx30Y gamma (using daily delta-hedging) is expected to result in around 130bp of notional of profit over the next 3M. Superimposing our view of mean reversion and infrequent delta hedging biases this upside even higher.
Figure 64: We model 3Mx30Y returns using ex-ante levels of 3Mx30Y implied vol and 10s/30s swap curve. Current level for these variables imply short gamma is expected to be profitable over the next few months
Rolling 3M returns from selling 3Mx30Y gamma (daily delta hedging) regressed against ex-ante levels of 1) 3Mx30Y implied vol and 10s/30s curve; since 1 Jan2024
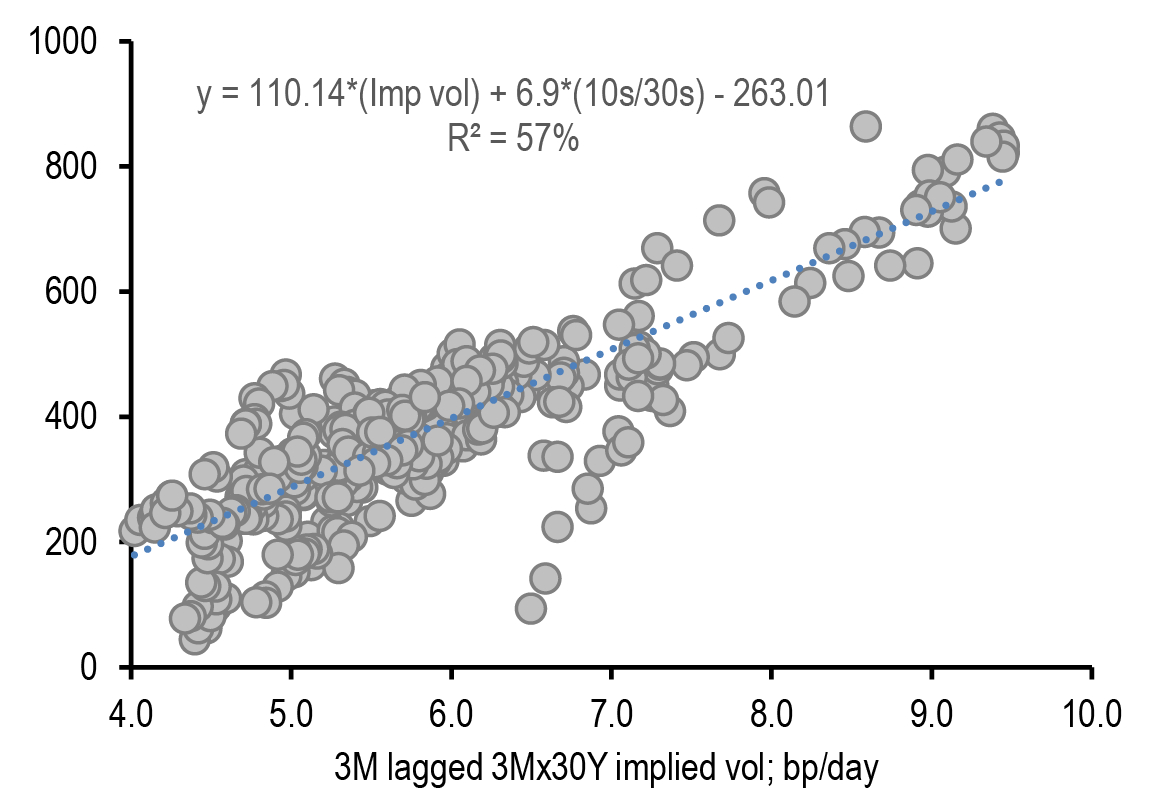
Source: J.P. Morgan.
Figure 65: Favour 2s/10s volatility curve flatteners across tails as a hedge against market pricing an aggressive and front-loaded ECB easing cycle
(3Mx10Y – 3Mx2Y) implied volatility spread; since 1 Jan 2023; bp/day
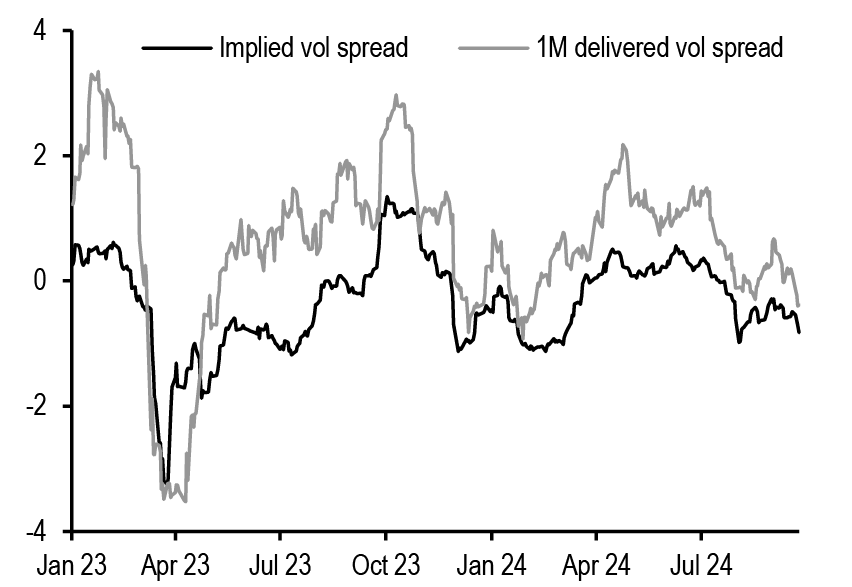
Source: J.P. Morgan.
Risk to our view could come from downside surprise in US payroll next week which could spur talks of US recession and exaggerated Fed action (but in line with our baseline view of a 50bp cut) and continued uncertainty around ECB October delivery. Nevertheless, we believe that upside to implieds is rather limited from here and thus risk-reward favours short gamma positions.
We have been favouring 2s/10s volatility curve flatteners across tails as a hedge against market pricing an aggressive and front-loaded ECB easing cycle. The 2s/10s implied vol spread (3M expiry) is currently near -0.6bp/day and could flatten further should central bank easing priced in escalate, in our view( Figure 65).
Trade Recommendations
Swap Curve
- Take profit and re-strike 1Yx1Y receiver spread versus short OTM payer
Buy €100mn 1.87%/1.49% 1Yx1Y receiver spread (notification date 29 Sep 2025, maturity date 1 Oct 2026) versus short €100mn 2.12% 1Yx1Y payer (ATMF+25bp) at a net credit of 6bp of notional;
Close longs in €100mn 2.16%/1.66% 1Yx1Y receiver spread (notification date 8 Sep 2025, maturity date 10 Sep 2026) versus short €100mn 2.55% 1Yx1Y payer with fixed-dated 1Yx1Y rate at 1.88%; P&L since inception (6th Sep 2024) 13bp of notional; - Take profit in 2s/5s conditional bull steepeners via 3M receivers
Close long €100mn 3Mx2Y 2.36% receivers (notification date 6th Dec 2024, maturity date 10th Dec 2026) versus selling €41.2mn 3Mx5Y 2.33% receiver (notification date 6th Dec 2024, maturity date 10th Dec 2029) to take profit in a conditional bull steepener at -3bp versus forward and spot spread of 2bp and -8bp, respectively; P&L since inception (12th Sep 2024): 7bp of notional; - Keep 1Yx1Y/5Yx5Y SOFR curve steepener versus €STR flattener
Keep received $413.4mn 1Yx1Y SOFR swap (swap start date 24 Sep 2025, swap end date 24 Sep 2026) versus paid $100mn 5Yx5Y SOFR swaps (swap start date 24 Sep 2029, swap end date 25 Sep 2034) (SOFR steepener) versus paid €364mn 1Yx1Y €STR swap (swap start date 24 Sep 2025, swap end date 24 Sep 2026) versus received €83.2mn 5Yx5Y €STR swaps (swap start date 24 Sep 2029, swap end date 25 Sep 2034) (€STR flattener) to remain in a cross market curve widener at -29bp versus entry level at -17.8bp; P&L since inception (20th Sep 2024): -10bp of yield; - Keep 10s/30s EUR flattener versus beta-weighted long in 1Yx1Y
Keep paid €100mn 3Mx10Y Euribor swap (100% risk, swap start date 24 Dec 2024, swap maturity date 27 Dec 2034) versus received €41.8mn 3Mx30Y Euribor swaps (100% risk, swap start date 24 Dec 2024, swap maturity date 24 Dec 2054) versus received €145.6mn 1Yx1Y €STR swaps (16% risk, swap start date 24 Sep 2025, swap maturity date 24 Sep 2026) to remain in a weighted spread at 19.6bp versus entry level at 20.2bp (weighted spread defined as 10s/30s curve + 16%*(1Yx1Y) yield); P&L since inception (20th Sep 2024): 0.6bp of yield; - Keep long 3Mx(1Yx1Y) A/A+25 1x2 payer spread
Keep long €100mn 1.98%/2.18% 3Mx(1Yx1Y) 1x2 payer spread (notification date 12 Dec 2024, midcurve start date 16 Dec 2025, maturity date 16 Dec 2026) with the fixed-dated 15Mx1Y rate at 1.97%; P&L since inception (12th Sep 2024): 0bp of notional; - Keep Mar25/Mar26 Euribor conditional bull steepener via Mar25 quarterly and 1Y midcurve calls
Keep long 1000 97.5 Mar25 3M Euribor midcurve calls (Mar25 Euribor futures at 97.47) versus short 1000 98.0 Mar25 1Y Euribor midcurve calls (Mar26 Euribor futures at 97.95) to remain in a bull steepener at -50bp versus forward curve at -47.5bp; P&L since inception (16th Aug 2024): -4cents; - Take profit and re-strike (2s/5s/10s) bull belly cheapener
Sell €100mn 2.16% 3Mx5Y receiver (ATMF strike 2.16%, notification date 27 Dec 2024, maturity date 31 Dec 2029) versus long €121.4mn 2.12% 3Mx2Y receiver (ATMF strike 2.12%, notification date 27 Dec 2024, maturity date 31 Dec 2026) and €26.4mn 2.33% 3Mx10Y receiver (ATMF strike 2.33%, notification date 27 Dec 2024, maturity date 31 Dec 2034) to enter into a premium neutral conditional bull belly cheapener at -13bp versus forward at -13bp;
Close short €100mn 2.326% 6Mx5Y receiver (ATMF strike 2.326%, notification date 3rd Feb 2025, maturity date 5th Feb 2030) versus long €121.2mn 2.382% 6Mx2Y receiver (ATMF strike 2.392%, notification date 3rd Feb 2025, maturity date 5th Feb 2027) and €26.4mn 2.43% 6Mx10Y receiver (ATMF strike 2.435%, notification date 3rd Feb 2025, maturity date 5th Feb 2035) to take profit in a conditional bull belly cheapener at -16bp versus forward at -10.2bp; P&L since inception (2nd Aug 2024): 9bp of notional;
Swap spread
- Enter Dec24 Schatz/Bund OIS swap spread curve flattener
Sell 1000 Dec24 Bund futures versus receiving €131.4mn maturity matched swaps (swap start date 10 Dec 2024, maturity date 15 Aug 2033) (Bund narrower vs €STR) versus buying 5642 Dec24 Schatz futures versus paying €600.4mn maturity matched swaps (swap start date 10 Dec 2024, maturity date 17 Sep 2026) (Schatz widener vs €STR) to enter a Sep24 Schatz/Bund €STR swap spread curve flattener at 6.6bp; - Keep Dec24 Schatz OIS swap spread widener
Keep long 1000 Dec24 Schatz futures versus paying €122.9mn maturity matched swaps (swap start date 6 Dec 2024, swap end date 17 Sep 2026) to remain in a Schatz spread widener at 7.9bp versus entry level at 11.8bp; P&L since inception (30th Aug 2024): -3.9bp of yield;
Volatility
- Sell 3Mx30Y gamma with infrequent delta hedging
Sell €100mn 2.26% 3Mx30Y straddles (notification date 27 Dec 2024, maturity date 31 Dec 2054) at 4.2bp/day. Delta hedge once every two weeks or if delta changes by 10%, whichever comes first; - Keep short 6Mx10Y unhedged straddles
Keep short €100mn 2.46% 6Mx10Y unhedged straddles (notification date 28 Feb 2025, maturity date 4 Mar 2035) at 4.5bp/day versus entry level at 4.6bp/day and 363bp of notional (4.65bp/day); P&L since inception (30th Aug 2024): 33bp of notional;
* P/L for open trades calculated using Thursday’s closes. New and closing trades are priced as of 1PM on non-payroll Fridays and 2PM on payroll Fridays.
Trades closed over the past 12 months
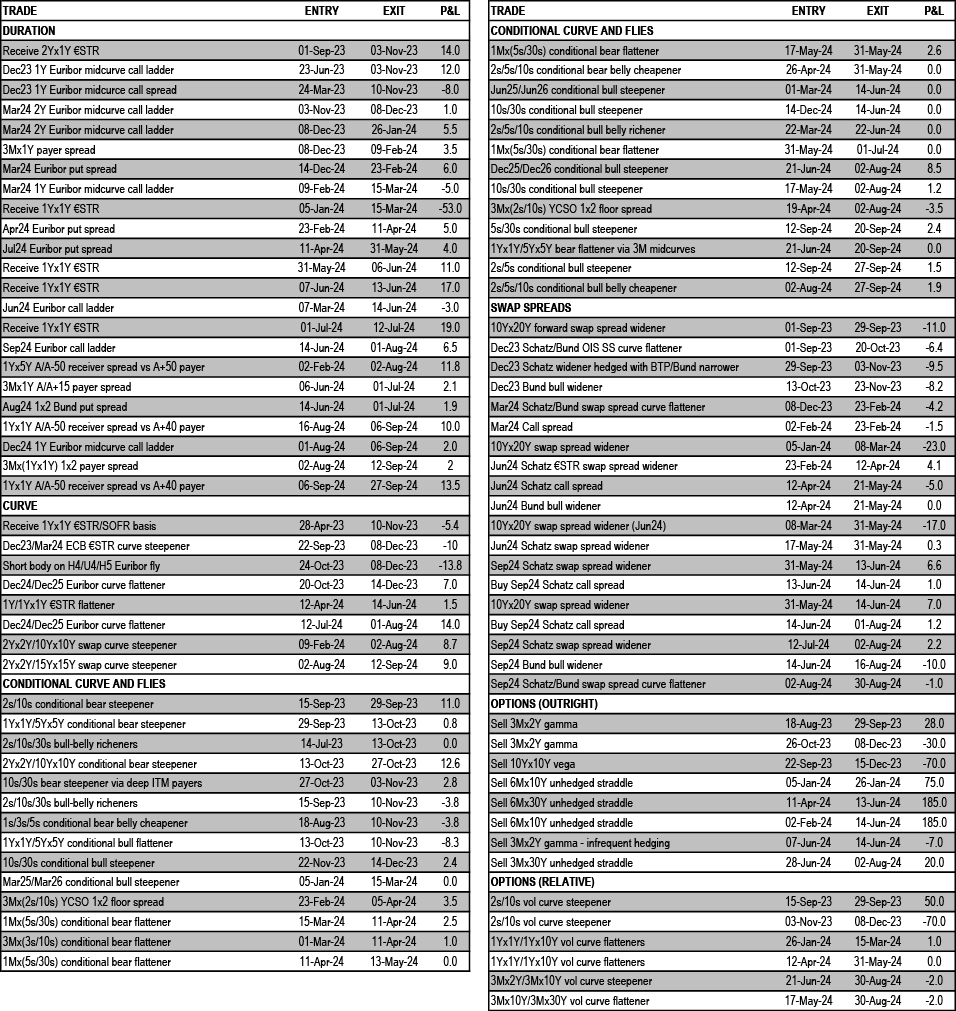
Source: J.P. Morgan.
Trades closed over the past 12 months
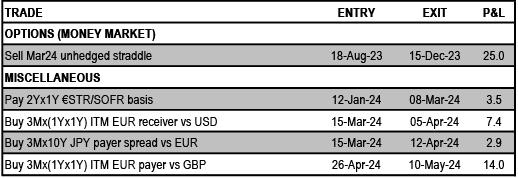
Source: J.P. Morgan.
United Kingdom
Fade to grey
- Gilt yields modestly sold-off this week and underperformed cross-market with the 10s/30s gilt curve steepening. In the absence of any top tier data the underperformance of UK rates was driven by increased market uncertainty on the upcoming budget delivery following the Labour party conference this week
- Front end valuations remain rich vs. our base-case BoE forecast of a 25bp/quarter pace of cuts but we don’t fade. We continue to recommend paying the belly of the Mar25/May25/Jun25 MPC OIS fly (50:50) given the BoE continues to sound relatively patient and cautious on the pace of monetary policy easing
- 1Yx1Y SONIA is around 3.50% with the 1Y gap forward curve in 2-6Y sector flat. We think the scope for a material sell-off in SONIA forwards in the 2Y sector is limited and see potential for BoE terminal rate pricing to move lower over the medium term
- Increased market concerns this week about Labour delivering a budget which incorporates large investment-driven gilt borrowing are somewhat overblown in our view and we think the Labour government will continue to want to be viewed as fiscally cautions and will not want to unnerve markets with its fiscal delivery. We see scope for the government to supplement a traditional debt measure with an additional fiscal rule that incorporates some measure of non-financial assets but doesn’t necessarily free up space for a large amount of investment spending
- From a relative valuation standpoint, 5Y gilts now look 15bp cheap on our high frequency model vs. 2Yx1Y SONIA – 2Yx1Y SOFR spread and adjusting for the level of 5Y UST yields. Given this, the flatness in the forward curve in the 2-5Y OIS curve and the likely market asymmetry around any downside surprise US labour market data we enter tactical longs in 5Y gilts
- Gilt issuance forecasts for next fiscal year are hard to pin down given uncertainty over any fiscal rule changes and tax decisions. We think gross gilt sales could be revised up to £285bn this fiscal year (£277.7bn currently).We tentatively pencil gross gilt sales around £270-275bn in FY25/26
- The 10s/30s gilt curve looks too flat on our long run model vs. front end yields, 30Y gilts and the slope of the 10s/30s UST curve however on a shorter history the 10s/30s gilt curve is 6bp too steep vs. the level of 10Y gilt yields
- We prefer to fade the cheapness in the 30Y sector of the gilt curve via buying the belly of the 10s/30s/50s gilt fly (50:50) which is at cheap levels historically and looks 5bp cheap on a level-and curve-adjusted basis vs. 10s/50s and 30Y yields
- In swaps, the 10s/30s SONIA curve is modestly too steep vs. high frequency drivers whilst 5Yx5Y/15Yx15Y SONIA curve is too flat
- We keep tactical 10Y swap spread narrowers given relative valuations
Gilt yields modestly sold-off this week and underperformed cross-market with the 10s/30s gilt curve steepening ( Figure 66). The large outperformance of German yields reflects the softer Euro area PMI and inflation data whilst in the absence of any top-tier data the underperformance of UK rates was driven by increased market uncertainty on the upcoming budget delivery following the Labour party conference this week.
The disinflation narrative in the Euro area has changed following this week’s data but there is little new in either the data or BoE commentary ( Figure 67) to suggest a shift away from the BoE’s cautious stance. Next week, the US labour market data will be the main event for the DM rates markets. Our economists expect a tick-up in unemployment to 4.3% and payroll around 125k, which would likely increase the likelihood the Fed deliver’s a 50bp cut at their November meeting. However, we think risks around any surprises to the labour market data are asymmetric for UK rates i.e. we see limited scope for yields to sell-off on stronger data with more potential for a larger rally in US and UK rates on weaker US labour market data.
At a domestic level, increased market concerns this week about Labour delivering a budget which incorporates large investment-driven gilt borrowing are somewhat overblown in our view and we think the Labour government will continue to want to be viewed as fiscal cautions and will not want to unnerve markets with its fiscal delivery. Given valuations and the relative underperformance this week we recommend entering tactical longs in 5Y gilts. At the very front end, we continue to pay the belly of the Mar25/May25/Jun25 MPC OIS fly. On the curve, we fade the long end underperformance and receive the belly of the 10s/30/50s gilt fly (50:50). We hold tactical 10Y swap spread narrowers given relative valuations.
Figure 66: Gilt yields are higher on the week, underperformed cross market with the 10s/30s gilt curve steeper given increased focus on UK fiscal delivery
Change in bond yields since 20 Sep; bp
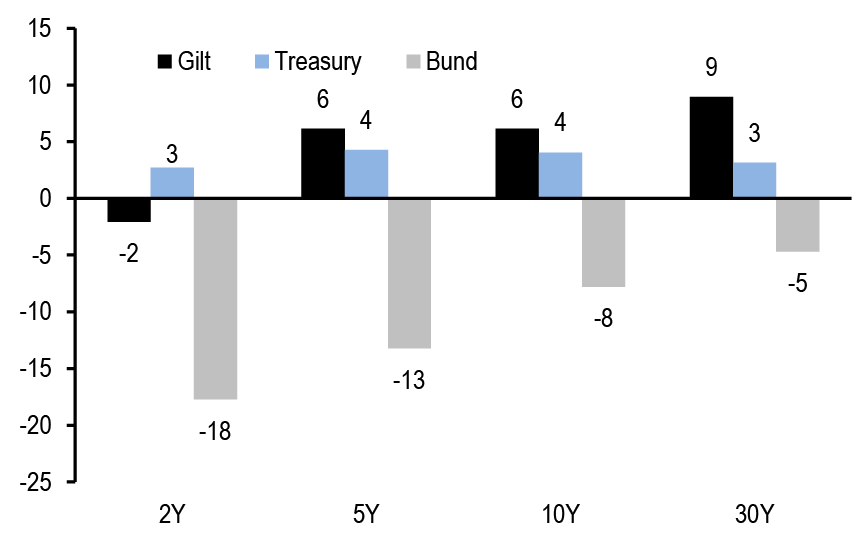
Source: J.P. Morgan.
Figure 67: There was little new in BoE commentary this week with MPC members highlighting a gradual approach to rate easing
Selected commentary from BoE speakers this past week
| BoE Commentary | |
| Megan Greene | "I believe the risks to activity are to the upside, which could suggest that the long-run neutral rate is higher and - all else equal - our stance of policy isn’t as restrictive as we had thought [...] Given this risk, I believe it is appropriate to take a gradual approach to removing restrictiveness" |
| “It’s certainly moving in the right direction but I wouldn’t get too excited” | |
| “We’re not surprised that it’s sticky. The biggest component of services inflation is labor, so as wages come down, hopefully inflation will come down.” | |
| Andrew Bailey | “Inflation has come down a long way [...] We still have to get it sustainably at the target and we have quite an unbalanced mix of components of inflation at the moment. But I’m very encouraged that the path is downwards therefore I do think the path for interest rates will be downwards, gradually." |
Source: BoE, J.P. Morgan.
BoE pricing is little changed this week with front end MPC OIS yields increasing a couple of bp. A 25bp cut is close to fully priced for November with over 100bp of cumulative cuts priced by next May and 150bp of cumulative easing priced by the end of next year. Front end valuations remain rich vs. our base-case BoE forecast of a 25bp/quarter pace of cuts but we don’t fade given these reflect some probability of faster BoE delivery given either increased hard landing risks or signs of increased easing in domestic UK inflation pressure. We continue to recommend paying the belly of the Mar25/May25/Jun25 MPC OIS fly (50:50) given the BoE continues to sound relatively patient and cautious on the pace of monetary policy easing.
1Yx1Y SONIA is little change on the week and is around 3.45% from 3.25% a couple of weeks ago. 1Y spot and forward SONIA yields are higher than 1Y USD forwards across the curve and we note that the 1Y gap forward SONIA curve is very flat around 3.40% between 1Yx1Y and 5Yx1Y SONIA ( Figure 68) compared to the more pronounced slope seen in the equivalent sector of the ESTR and SOFR curves. We acknowledge that sticky core services inflation and the patient and gradual easing rhetoric from the BoE will likely keep this SONIA forward curve relatively flat. However, given lingering hard-landing risks and asymmetry around the US labour market data, with 1Yx1Y SONIA remaining highly directional with 1Yx1Y SOFR ( Figure 69), we think the scope for a material sell-off in SONIA forwards in the 2Y sector is limited and see potential for BoE terminal rate pricing to move lower over the medium term.
Figure 68: 1Yx1Y SONIA is around 3.50% with the 1Y gap forward curve in 2-6Y sector flat
1Y spot and forward OIS curves; bp
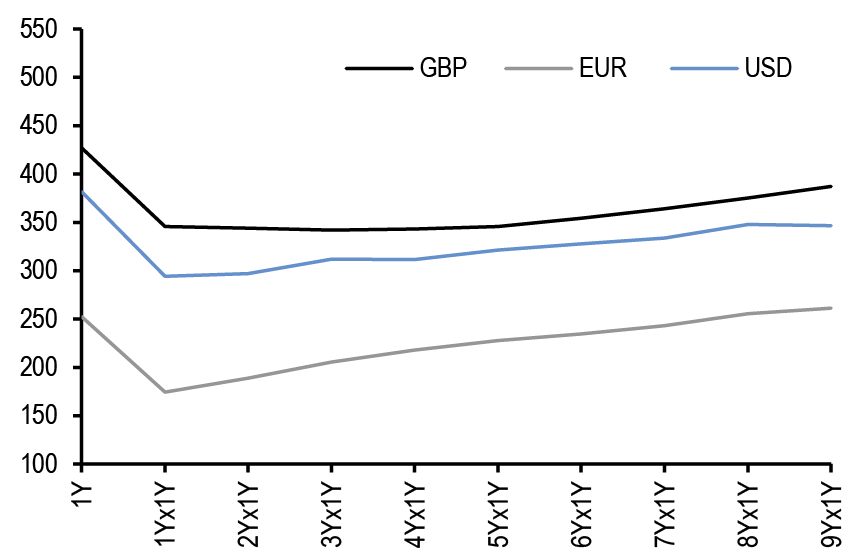
Source: J.P. Morgan.
Figure 69: 1Yx1Y SONIA remains highly directional with 1Yx1Y SOFR
1Yx1Y SONIA regressed against 1Yx1Y SOFR; past 3M; %
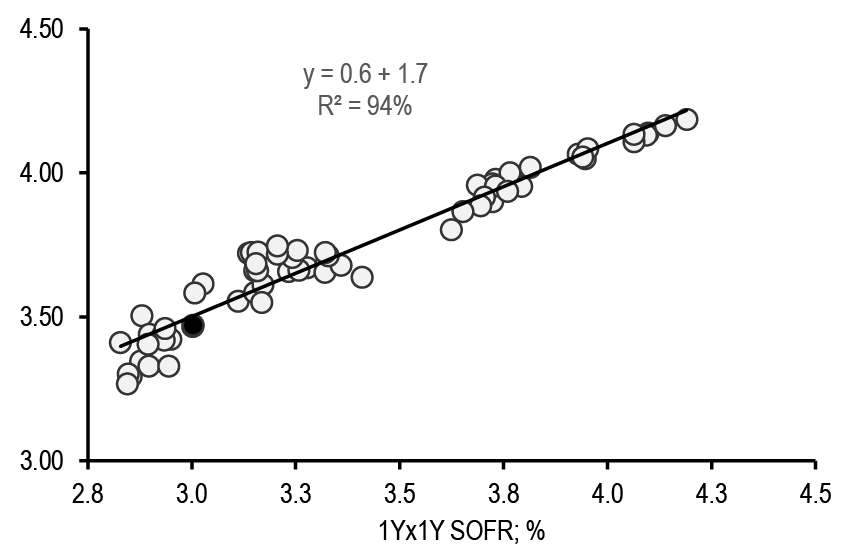
Source: J.P. Morgan.
The Labour Party Conference this week has generated renewed focus on the UK fiscal outlook as the government’s first budget since the election on 30 October approaches. A speech from Chancellor Reeves alongside various media reports have generated confusion around potential changes to the UK’s fiscal rules as well as opened up various interpretations on the impact of the Chancellor’s focus on investment. We continue to think that the Labour government will be very cautious on changing the debt rules and will deliver a measured approach on lifting investment spending. Fundamentally, we think the Labour government is very wary of its fiscal credibility and will be at pains to avoid any repeat of the Truss mini-budget and associated market dysfunction.
Our economist has discussed some of various debt rule alternatives and investment spending approaches (see here) and in terms of market reaction and impact we make the following points. Firstly, we acknowledge the government’s increased focus on investment spending could result in focus on a broader measure of debt such as PSNW (public sector net worth) or a measure of debt net financial liabilities. However, we would fully expect the government to maintain a robust fiscal anchor with a more traditional debt rule that has a direct link to financial markets and borrowing costs. As highlighted by the IFS in a paper last year (see here) whilst PSNW is a more comprehensive measure of all government assets and liabilities its inclusion of non-financial assets, such as the road network, adds difficult complications given these assets cannot generally be sold to be financing needs and are hard to value. We see scope for the government to supplement a traditional debt measure with an additional fiscal rule that incorporates some measure of non-financial assets but doesn’t free up space for a large amount of investment spending. Secondly, we see potential for the current debt target to be modified to exclude APF flows which we estimate would free up £17bn of extra headroom (on top of the approx. £9bn current headroom) which could be used to cancel all of the planned cuts to net investment spending over the next five years. Rolling the debt window also would allow for an extra £10bn of extra headroom per year. Thirdly, we think Labour will still want to deliver net tightening in fiscal policy next year and whilst there will be a focus on investment spending, we expect limited increases in projected borrowing over the coming years.
Given these uncertainties over potential changes to the fiscal rules there is limited visibility over gilt issuance projections for the next fiscal year. However, given our views above we expect only a limited increase relative to our existing forecasts. For current FY24/25, gross gilt sales are £277.7bn and we had projected gilt sales for FY25/26 at around £260bn. Given the current run-rate on borrowing the deficit for this fiscal year could be £15bn higher and hence gross gilt sales could be revised up to £285bn for FY24/25 We see scope for any increased gilt issuance this year vs. the current remit to be focused in the medium (7-15Y) sector and see potential for another medium sector syndication. We had projected gross gilt sales at £260bn in FY25/26 and with the debt window roll and potentially excluding AFP flows from the debt rule we now pencil gross gilt sales around £270-275bn in FY25/26.
5Y and 10Y gilt yields are 5-6bp higher on the week and underperformed cross market especially vs. Bunds, reflecting the increased focus on the upcoming budget. From a relative valuation standpoint, 5Y gilts now look 15bp cheap on our high frequency model vs. 2Yx1Y SONIA – 2Yx1Y SOFR spread and adjusting for the level of 5Y UST yields ( Figure 70) which is the largest relative cheapness over the past 12M. Given these relative valuations, the flatness in the forward OIS curve in the 2-5Y sector and the likely market reaction asymmetry around any downside surprise US labour market data we enter tactical longs in 5Y gilts.
Figure 70: 5Y gilts look almost 15bp cheap again on our high frequency valuation model; we enter tactical longs in 5Y gilts
Residual from regressing 5Y gilt yield vs. (2Yx1Y SONIA – 2Yx1Y SOFR) spread and adjusting for 5Y UST yield*; past 12M; bp
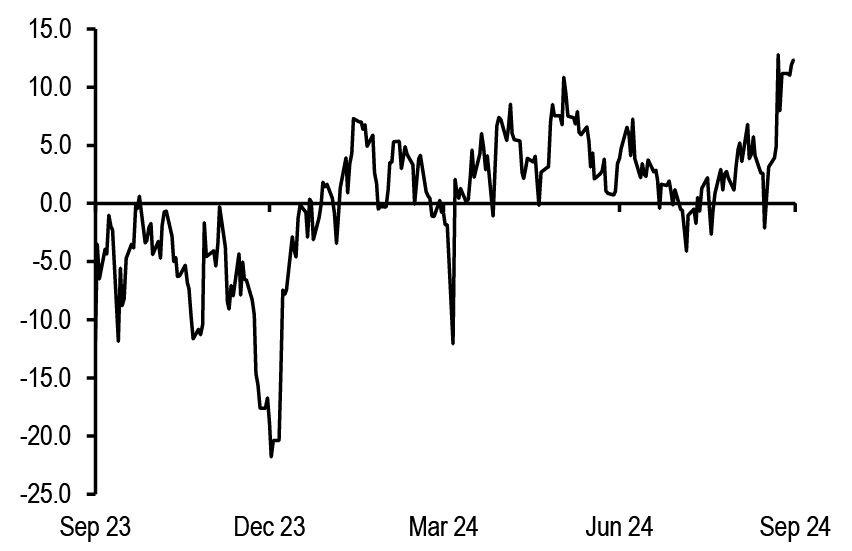
*5Y gilt = 0.48 * (2Yx1Y SONIA – 2Yx1Y SOFR) + 0.8 * 5Y UST + 0.55. R-squ: 96%, std. error: 5bp
Source: J.P. Morgan.
Figure 71: The 10s/30s gilt curve looks too flat on our long run model vs. front end yields, 30Y gilts and the slope of the 10s/30s UST curve…
Residual* from regressing 10s/30s gilt curve vs. 1Yx1Y SONIA, 30Y gilt yield and 10s/30s UST curve; past 12M; bp
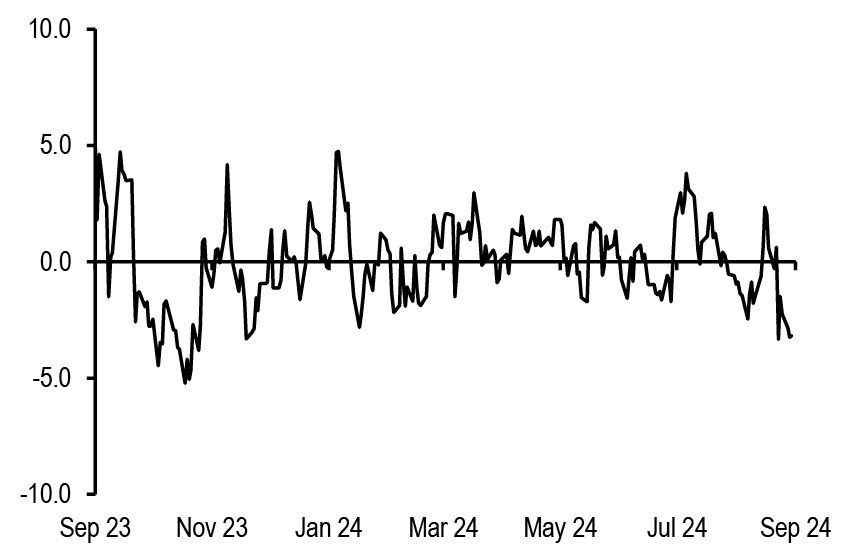
*10s/30s gilt = -0.3 * 1Yx1Y SONIA + 0.3 * 30Y gilt yield – 0.09 * 10s/30s UST + 0.25. R-squ: 92%, std. error: 2bp
Source: J.P. Morgan.
The 10s/30s gilt curve has steepened a couple of bp this week although is still a few bp flatter than the steep historical levels seen around 10 September. From a relative valuations perspective, the 10s/30s curve looks a few bp too flat vs. the level of 1Yx1Y SONIA, 30Y gilt yields and adjusting for the 10s/30s USRT curve ( Figure 71). However, in order to reflect the more recent budget focus and removing the impact of the 10s/30s UST curve we note that on a shorter-term regression the 10s/30s gilt curve looks 6bp too steep vs. the level of 10Y gilt yields ( Figure 72). The rolling beta of the 10s/30s gilt curve vs. the level of 10Y yields has been steadily become more negative although we note that there have been short periods where directionality of the 10s/30s curve vs. 10Y yields has weakened ( Figure 73).
Figure 72: …however on a shorter history the 10s/30s gilt curve is 6bp too steep vs. the level of 10Y gilt yields
10s/30s gilt curve regressed against 10Y gilt yield; past 3M; bp
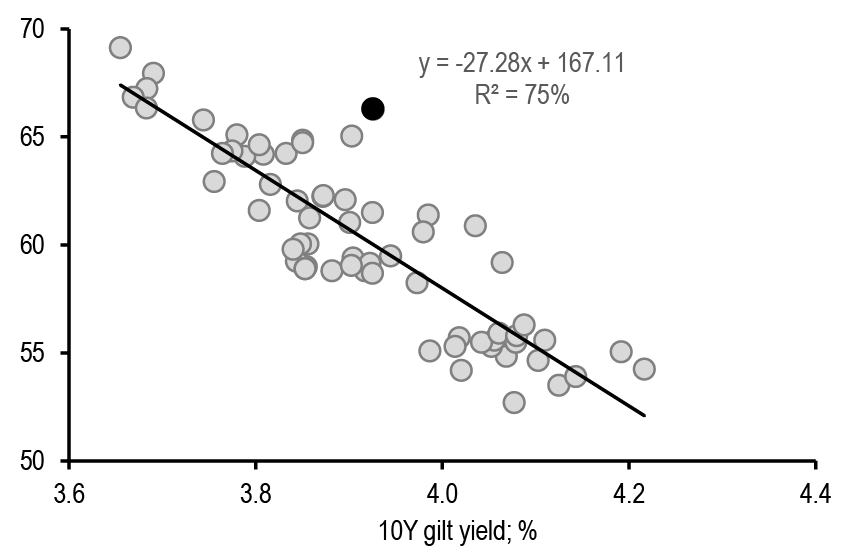
Source: J.P. Morgan.
Figure 73: The rolling beta of the 10s/30s gilt curve vs. the level of 10Y yields has steadily become more negative
Rolling 30D beta and R-squ from regressing 10s/30s gilt curve vs. 10Y gilt yields; past 6M
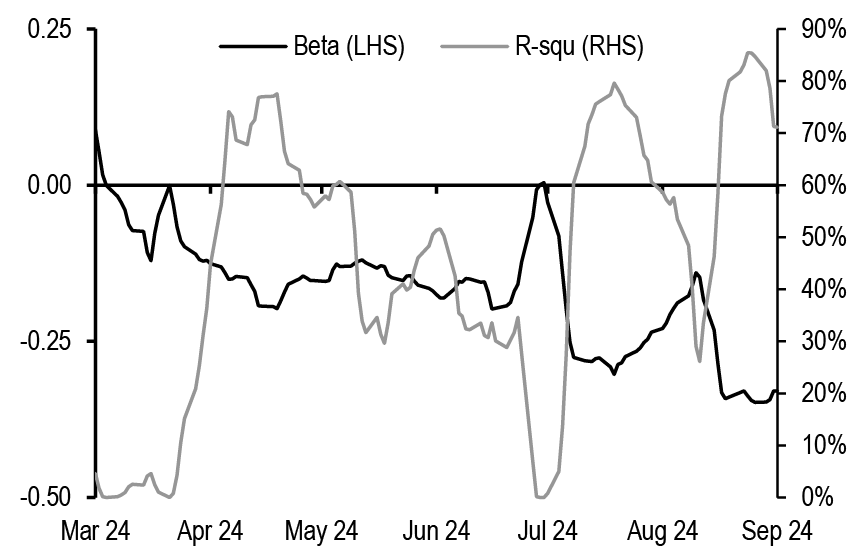
Source: J.P. Morgan.
We see scope for the 10s/30s gilt curve to flatten given relative valuations and our view that budget concerns are overpriced, however given our tactically bullish view on 5Y yields we prefer to fade the cheapness in the 30Y sector of the gilt curve via buying the belly of the 10s/30s/50s gilt fly (50:50). The 10s/30s/50s gilt fly is at cheap levels historically and looks 5bp cheap on a level-and curve-adjusted basis vs. 30Y yields and the 10s/50s curve ( Figure 74). For investors looking for steepening exposure on the UK curve as a bullish duration proxy we note that in SONIA space the 5Yx5Y/15Yx15Y SONIA curve us a few bp too flat vs. the level of 1Yx1Y yields and adjusting for implied volatility whilst the 10s/30s SONIA curve looks too steep vs. these drivers ( Figure 75).
Figure 74: The belly of the 10s/30s/50s gilt fly looks cheap on an outright and level-and-curve adjusted basis; we recommend buying the belly of the 10s/30s/50s gilt fly
10s/30s/50s gilt fly (50:50) and level-and-curve adjusted* 10s/30s/50s gilt fly (RHS); bp
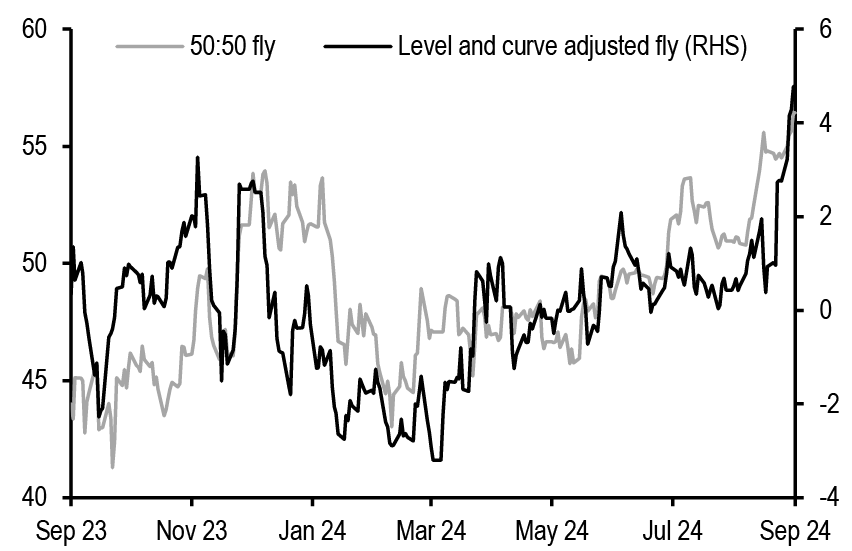
*Residual from regressing 10s/30s/50s gilt fly vs. 30Y yield and 10s/50s curve
10s/30s/50s = -0.02 * 30Y yield + 0.35 * 10s/50s curve + 0.5. R-squ: 78%, std. error: 1.5bp
Source: J.P. Morgan.
Figure 75: The 10s/30s SONIA curve is modestly too steep vs. high frequency drivers whilst 5Yx5Y/15Yx15Y SONIA curve is too flat
Residuals from regressing 1) 10s/30s SONIA curve vs. 1Yx1Y SONIA and 3Mx10Y implied vol, 2) 5Yx5Y/15Yx15Y SONIA curve vs. 1Yx1Y SONIA and 3Mx10Y implied vol; past 12M; bp
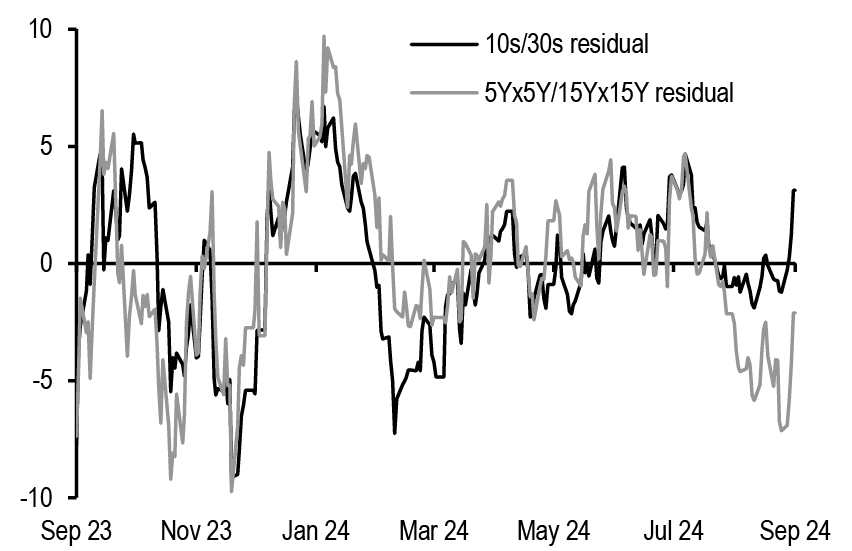
*10s/30s = -0.1 * 1Yx1Y SONIA – 0.03 * 3Mx10Y vol + 0.8. R-squ: 84%, std. error: 3bp
5Yx5Y/15Yx15Y = -0.12 * 1Yx1Y SONIA – 0.05 * 3Mx10Y vol + 0.8. R-squ: 84%, std. error: 4bp
Source: J.P. Morgan.
Trade recommendations
New Trades
- Enter long 5Y gilt (UKT Jul29)
Buy £100mn UKT 4.125% Jul29 @3.83%. 3M C+S is -6.7bp. - Buy belly 10s/30s/50s gilt fly (50:50)
Buy £50mn UKT 4.375% Jul54 vs. selling £49mn UKT 4.25% Jul34 and selling £38mn UKT 1.125% Oct73 (all nominal terms) @53bp. 3M C+S is +0.95bp.
Existing Trades
- Keep paying the belly of Mar25/May25/Jun25 (50:50) MPC OIS fly
Pay £100mn May25 MPC OIS vs receiving £42.7mn Mar25 MPC OIS and receiving £43.1mn Jun25 MPC OIS @-6.5bp. P/L since inception is -0.5bp (recommended 13 Sep) - Keep tactical 10Y swap spread narrower (UKT 4.5% Sep34)
Sell £75mn gilt UKT 4.5% Sep34 and receive £76.9mn maturity matched SONIA swap @34.3bp. 3M C+S is -1.8bp. P/L since inception is -0.5bp (recommended 13 Sep) - Stay long gilt Mar27 on ASW basis
Buy £50mn gilt 3.75% Mar27 on ASW basis@ 14.6bp. P/L since inception is -5.6bp (recommended 12 Jul) - Hold 10s/30s RPI curve flatteners
Stay long 10Y RPI swap vs short 30Y RPI swap @-28.5bp. P/L since inception is -0.5bp (recommended 26 Sep) - Keep long 1Yx5Y A/A-50bp receiver spread versus short OTM payer
Keep long £100mn 3.35%/2.85% 1Yx5Y receiver spread (notification date 22 Sep 2025, maturity date 22 Sep 2030) versus short£100mn 3.865% 1Yx5Y payer at -23bp of notional with ATMF 1Yx5Y rate at 3.45% versus entry level at close to flat premium. P/L since inception is -23bp of notional (recommended 20 Sep). - Stay short 3Mx10Y unhedged straddles
Stay short £100mn 3.52% 3Mx10Y unhedged straddles (notification date 6 Dec 2024, maturity date 6 Dec 2034) at 5.5bp/day versus entry level at 281bp of notional (5.32bp/day). P/L since inception is +14bp of notional (recommended 6 Sep).
*All existing trades priced as of 3.00pm UK 27th Sep 2024
Trades closed over the past 12 months
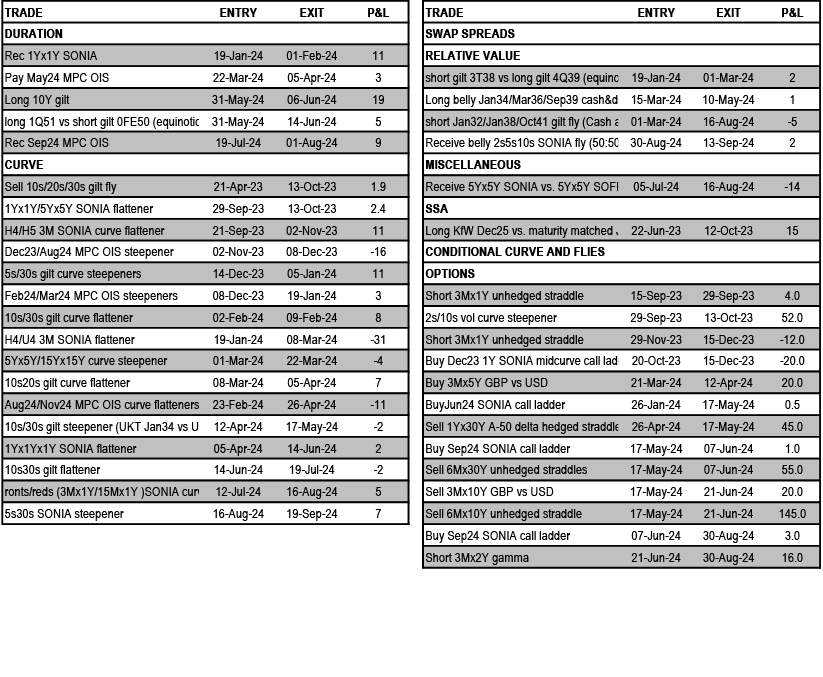
Treasuries
October...And kingdoms rise and kingdoms fall
- We think Treasury yields should be biased lower in the near-term, as a rising unemployment rate should increase the probability of a 50bp ease at the November meeting
- Curve valuations appear closer to fair after adjusting for Fed policy and inflation expectations. Steepeners offer value as a way to express a bullish view, particularly given where we are in the monetary policy cycle, and how supply-demand dynamics should bias term premium higher over the medium term: initiate 3s/20s steepeners
- We look deeper into bear steepening episodes. Over rolling one-month horizons, bearish steepening in 2s/10s has been more common than bullish steepening over the last 35 years. However, when we strip out the ZIRP era, we find a balance between both bullish and bearish steepening...
- Bearish steepening is a less frequent occurrence at the long end, especially when we strip out the low-rate era. We identify 6 other significant bear-steepening episodes: the curve tends to steepen for 6 weeks on average, peaking a month before long-end yields do. This was evident during the 1990, 2001, and 2008 easing cycles
- We review the tenth annual Treasury market conference, held at the New York Fed earlier this week. There was significant discussion on the asset manager preference for Treasury futures over cash bonds, the outlook for central clearing of Treasury cash and repo trades, and the evolving structure of the Treasury market
- T-bill net issuance should total $270bn over the next two months. Front-end T-bills are in the richest quartile of their recent ranges and we see room for cheapening in the near term given the combination of positive supply and quarter-end seasonal dynamics. Further out the curve , risks appear more balanced
Market views
Figure 76: OIS forwards priced in a more dovish Fed path on the back of Tuesday’s confidence survey data, but reversed these moves following better-than-expected data later in the week
Expected change in Fed funds effective rate by FOMC meeting implied by OIS forwards; bp
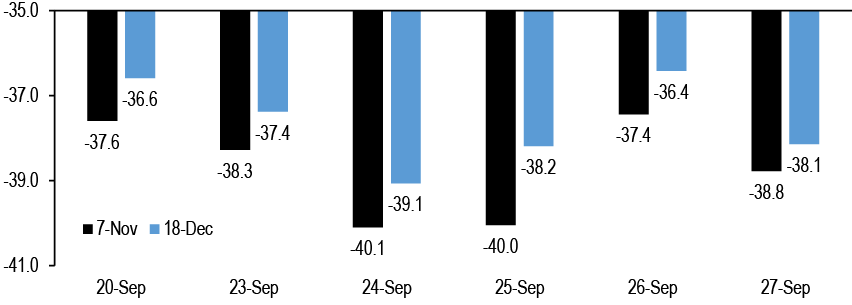
Source: J.P. Morgan
Treasury yields finished modestly higher as positive risk asset sentiment following strong stimulus measures in China outweighed mixed domestic data. Rates markets remain focused on labor market developments and the data we got on that front did not paint a clear picture. On the one hand, the labor market differential in the Conference Board confidence index dropped from 15.9% to 12.6%: our economists believe the latter points to a further increase in the unemployment rate, which would support their base case for another 50bp ease at the November meeting (US: Labor market concerns stand out in Sep confidence survey, Abiel Reinhart, 9/24/24). Indeed, following this report, OIS forwards priced in 40bp in easing for the November meeting for a total of 79bp for the remainder of the year, sending front-end yields lower ( Figure 76). However, markets reversed this move on Thursday, as initial claims fell to 218k (consensus: 223k), the lowest level since mid-May. Away from some of the recent seasonality-related statistical noise, claims are little changed from a year ago, which is a clear positive (see US: More positive news from initial claims, Abiel Reinhart, 9/26/24). Finally, yields retraced lower on Friday, after core PCE came in at 0.1% (consensus: 0.2%) (see US: Today’s data confirm moderate inflation, solid 3Q GDP, Abiel Reinhart, 9/27/24 ). Net of these factors, 2-year yields declined 1bp, while 5-, 10-, and 30-year yields rose 2bp, 2bp, and 3bp, respectively, this week.
Looking ahead, our focus will turn back to labor markets, with the release of the September employment report: we project nonfarm payrolls increased 125k over the month (consensus: 130k), and that the unemployment rate rose 0.1%-pt to 4.3% (see Economics). We think the risk skews toward a larger increase in the unemployment rate, given the narrowing in the labor market spread in the Conference Board consumer confidence earlier this week: a simple regression indicates that the latest decline in the differential implies a 15bps rise in the unemployment rate, which would round up to 4.4%, a new high for the cycle (see US: Labor market concerns stand out in Sep confidence survey, Abiel Reinhart, 9/24/24). Away from the headline data, it’s notable that payroll readings have been consistently revised lower, with the prior two months revised lower in 8 of the last 12 months.
Given this dynamic, we think yields are lower over the near term, as money markets price in a higher probability of our forecasted 50bp cut at the November FOMC meeting, as OIS forwards are pricing in 38bp at current. The cleanest way to play this is through duration longs, and we’ve been highlighting for the last week that most yield curves appear steep after controlling for the market’s medium-term Fed policy expectations. However, when we also adjust for the market’s medium-term inflation expectations and the Fed’s share of the Treasury market, most curve pairs look more fairly valued ( Figure 77).
Figure 77: Overall, curves appear steep relative to their fundamental drivers, but less so when we also adjust for the market’s medium-term inflation expectations and the Fed’s share of the Treasury market
Statistics for various Treasury curves over the last 3 years, with statistics from 3-year regressions on 1y1y OIS (%), 5Yx5Y TIPS breakevens (%), and Fed share of the Treasury market (%); bp unless otherwise indicated
| Curve | Last | Min | Max | Avg | % | R^2 | Partial betas | Residual | Z-score | |||
| 1y1y OIS | 5y5y BE | Fed share | 3m C+R | |||||||||
| 2s/5s | -6 | -78 | 78 | -20 | 73% | 67% | -0.30 | 0.64 | 0.02 | 12.1 | 0.6 | -15.7 |
| 2s/7s | 4 | -91 | 108 | -18 | 74% | 68% | -0.38 | 0.73 | 0.01 | 11.6 | 0.5 | -17.6 |
| 2s/10s | 19 | -109 | 129 | -20 | 77% | 70% | -0.46 | 0.80 | -0.01 | 15.1 | 0.6 | -19.8 |
| 2s/20s | 58 | -96 | 179 | 13 | 80% | 73% | -0.51 | 0.69 | -0.01 | 19.3 | 0.8 | -22.5 |
| 2s/30s | 53 | -119 | 184 | -2 | 84% | 77% | -0.58 | 0.80 | -0.03 | 17.5 | 0.7 | -20.7 |
| 3s/7s | 13 | -55 | 81 | -8 | 82% | 72% | -0.25 | 0.39 | -0.02 | 3.1 | 0.3 | -8.9 |
| 3s/10s | 27 | -76 | 103 | -10 | 87% | 75% | -0.33 | 0.46 | -0.03 | 6.6 | 0.5 | -11.1 |
| 3s/20s | 67 | -63 | 153 | 23 | 87% | 77% | -0.38 | 0.35 | -0.03 | 10.9 | 0.7 | -13.8 |
| 3s/30s | 62 | -86 | 158 | 8 | 87% | 83% | -0.45 | 0.47 | -0.05 | 9.1 | 0.6 | -12.0 |
| 5s/10s | 25 | -36 | 56 | -1 | 92% | 81% | -0.16 | 0.17 | -0.03 | 3.0 | 0.5 | -4.1 |
| 5s/20s | 64 | -23 | 106 | 32 | 91% | 74% | -0.21 | 0.05 | -0.03 | 7.3 | 0.8 | -6.8 |
| 5s/30s | 59 | -46 | 112 | 18 | 91% | 85% | -0.28 | 0.17 | -0.05 | 5.4 | 0.6 | -5.0 |
| 7s/10s | 14 | -21 | 22 | -2 | 97% | 84% | -0.08 | 0.07 | -0.02 | 3.5 | 1.3 | -2.2 |
| 7s/20s | 54 | -8 | 73 | 31 | 96% | 65% | -0.13 | -0.04 | -0.02 | 7.8 | 1.1 | -4.9 |
| 7s/30s | 49 | -37 | 79 | 16 | 95% | 82% | -0.20 | 0.08 | -0.03 | 6.0 | 0.9 | -3.1 |
| 10s/20s | 40 | 13 | 57 | 33 | 80% | 44% | -0.05 | -0.12 | 0.00 | 4.3 | 0.8 | -2.7 |
| 10s/30s | 35 | -18 | 57 | 18 | 90% | 75% | -0.12 | 0.00 | -0.02 | 2.5 | 0.5 | -0.9 |
Source: J.P. Morgan
Thus, given where we stand in the monetary policy cycle, as well as our view that term premium should rise over time as the rapid growth of the Treasury market outstrips the traditionally price-insensitive demand from the Fed, banks, and foreign official investors, steepeners are attractive, we just have to choose the right one. Figure 77 shows that, on margin, long-end steepeners offer more value than front-end steepeners, with current residuals very close to fair value. However, recently, steepeners with longs anchored in the intermediate sector have shown reduced sensitivity to changes in medium-term Fed expectations, while those with longs anchored closer to the front end have more stable and negative betas, implying these curves should steepen more for a given change in Fed policy expectations ( Figure 78). As a result, we think steepeners with longs anchored in the 3-year sector offer more value than those anchored in 5s or 10s.
Figure 78: Recently, steepeners anchored with longs in intermediates have shown reduced sensitivity to changes in medium-term Fed policy expectations
Rolling 3-month partial beta of various yield curves (bp) with respect to 1y1y OIS rates (%), after controlling for 5y5y seasonally-adjusted TIPS breakevens (%);
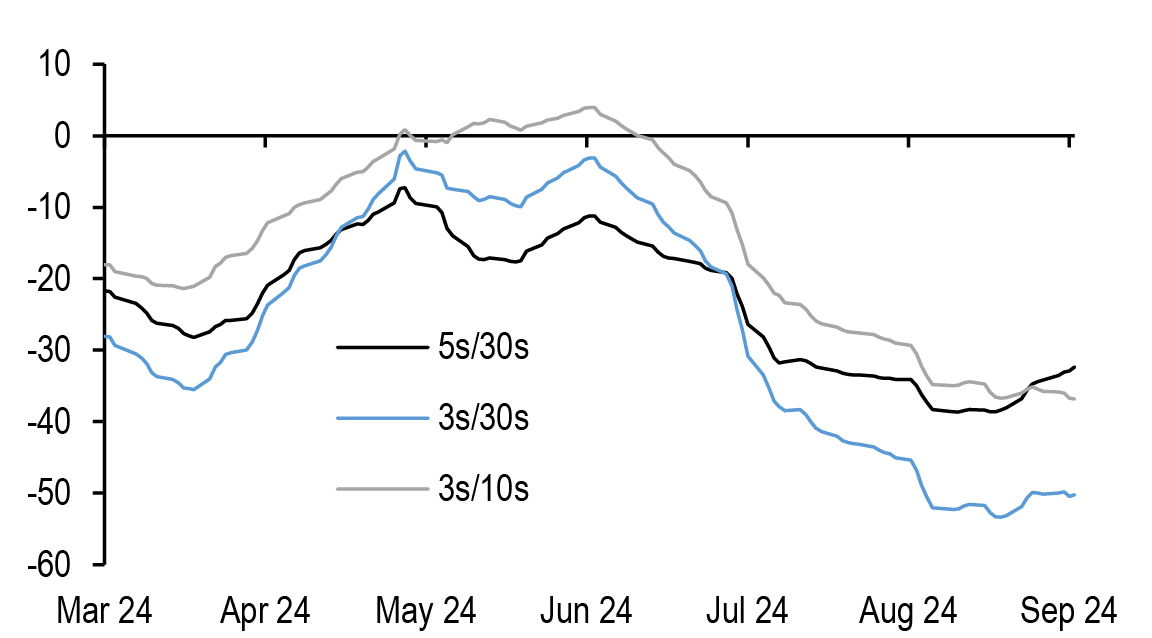
Source: J.P. Morgan
Figure 79: The 20-year sector looks rich along the curve even after adjusting for its extreme specialness in repo
1-month forward 10s/20s/30s Treasury butterfly regressed on 1-month forward 10s/30s Treasury curve (bp) and 1-month forward 20-year Treasury yields (%), regression over the last 6 months; bp
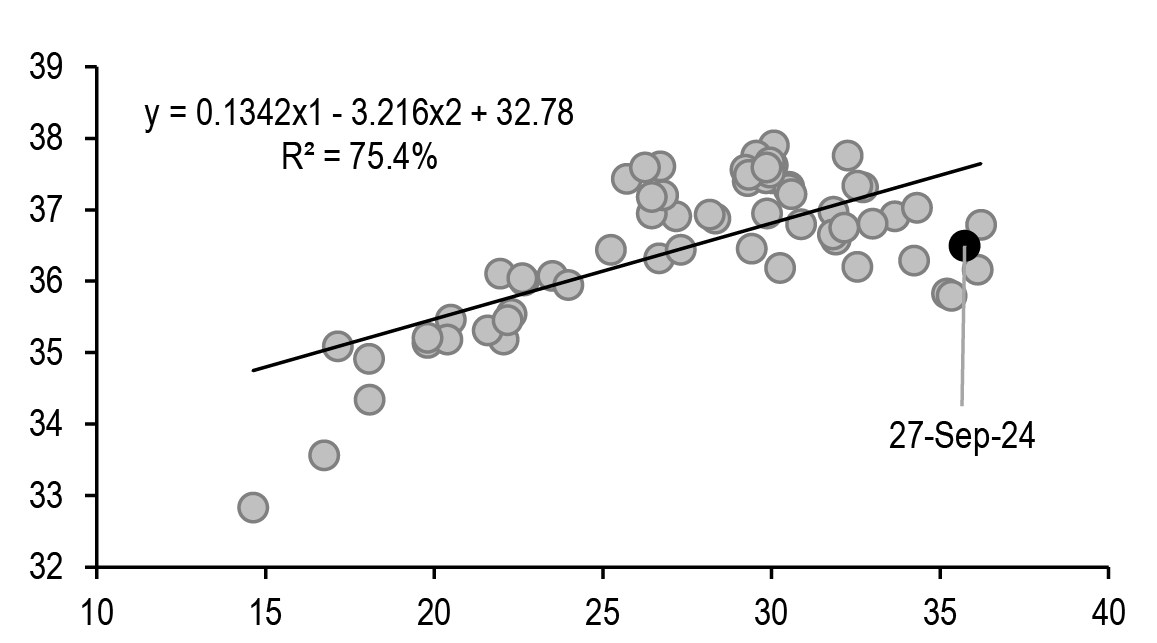
Source: J.P. Morgan
Finally, the table also shows that steepeners with shorts anchored in the 20-year sector offer more value than those anchored in the 30-year sector. To be fair, much of this richening has been driven by the extreme specialness of the current 20-year bond, which has been trading below -1% in overnight repo through this week, and significantly special in term repo as well. We would anticipate this specialness to ease somewhat next week after the settlement of the $13bn September reopening will grow the size of the issue by 80%. However, it’s notable that the 20-year sector appears rich even after adjusting for this specialness: Figure 79 shows that on a one-month forward basis, the 20-year sector appears rich along the curve, after adjusting for the slope of the curve and the level of rates. As a result, we recommend adding 3s/20s steepeners to position for a weaker employment report next week.
How common is bear steepening?
As we discussed in our latest weekly, the Treasury curve has begun to decouple from the market’s medium-term Fed policy expectations, as short-end yields have risen from their local lows prior to the FOMC meeting, but the curve has continued to steepen. It’s early to call this a trend, but alongside the behavior of other asset classes, it appears market participants view this “appropriate calibration” as a front-loading of easing that could extend the expansion and reduce the need to ease further in 2025. Should this action support better growth outcomes it could steepen the curve further (see Treasuries, US Fixed Income Markets Weekly, 9/20/24).
In the context of this nascent trend, we’ve been asked about the frequency and duration of historical bearish steepening episodes. We have examined 35 years of historical curve data, breaking curve movements into bullish or bearish steepening periods, with these regimes being defined by comparing changes in the curve over rolling one-month horizons with the changes in yields in the longer maturity point of the yield curve for both 2s/10s and 5s/30s ( Figure 80 and Figure 81). We use the full data sample back from 1989, and we also exclude periods when the Fed funds rate is below 1% (2009-2016 and 2020-2021). During the ZIRP eras, with policy rates at or close to the zero lower bound, the Fed augmenting policy accommodation via strong forward guidance , and QE impacting longer-term yields, the directionality of the curve shifted compared with higher rate regimes. Accordingly, given the strongly anchored nature of the front end, the long end tended to display relatively more volatility, resulting in bearish steepening and vice versa.
Figure 80: Over the last 35 years, it’s been more common for the 2s/10s curve to bearishly steepen than bullishly steepen over a one-month horizon, but when we exclude the ZIRP era, the type of curve steepening is more evenly split...
Total number of bullish- and bearish steepening days* in 2s/10s Treasury curve over a rolling 1-month basis since 1989, total regimes
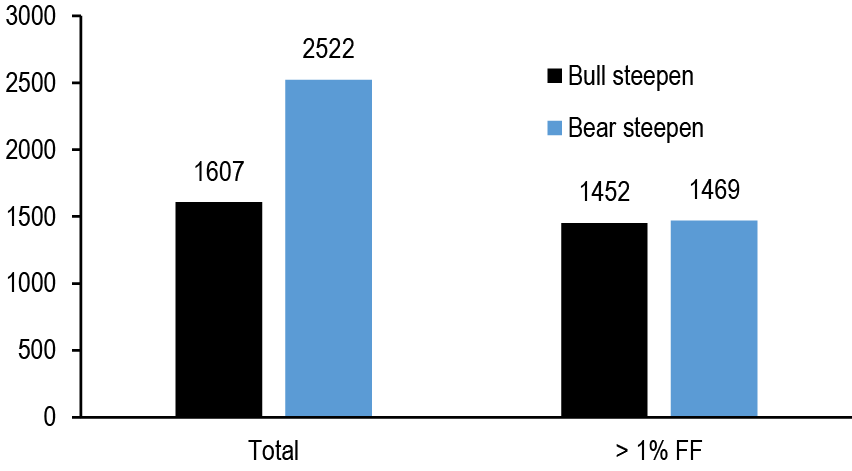
* Matching curve steepening days with changes in 10-year Treasury yields
Source: J.P. Morgan
Figure 81: ...while the long end has tended to display more traditional directionality, with a greater propensity to bullishly steepen in normalized rate environments
Total number of bullish- and bearish steepening days* in 5s/30s Treasury curve over a rolling 1-month basis since 1989, total regimes
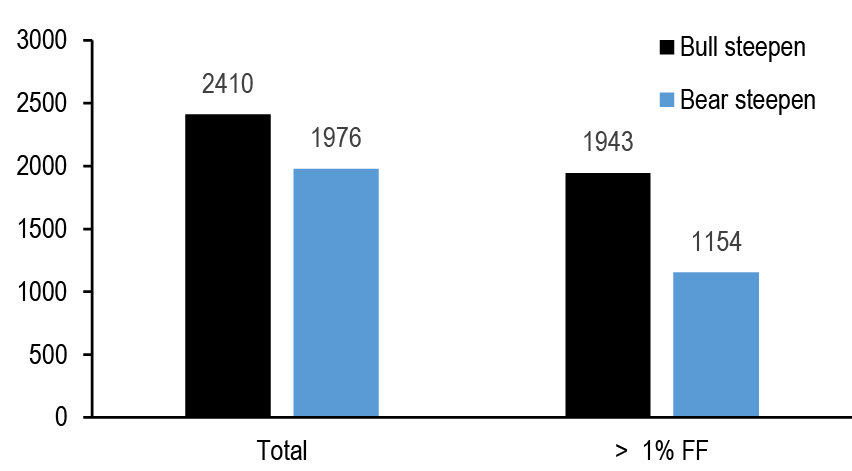
* Matching curve steepening days with changes in 30-year Treasury yields
Source: J.P. Morgan
Interestingly, the figures show that it’s not uncommon for the Treasury curve to steepen bearishly over rolling one-month periods: Figure 80 shows that 2s/10s has steepen bearishly (defined as 2s/10s steeper and 10-year yields higher) more frequently than bullishly over the last 35 years, by a ratio of 1.5:1. However, when we exclude the ZIRP eras, steepening is more evenly distributed between bullish- and bearish regimes over the period. Meanwhile, long-end curve dynamics are somewhat different, as bullish steepening has been a more common occurrence than bearish steepening, and this is even more apparent when we exclude the ZIRP periods ( Figure 81). Intuitively, we are not surprised by this observation: the market’s medium-term Fed policy expectations have always been the primary determinant of the slope of the long end, and they were well anchored at levels very close to zero during the low-rates era, biasing this curve toward more positive directionality with the level of rates over this period.
Using this data as a starting point, we tried to find occurrences when the curve steepened bearishly and have identified 6 episodes since 1989 (excluding the ZLB eras) when the 5s/30s curve has steepened for more than one month amid a rise in long-end yields. These instances were August-October 1990, March-April 2001, February-April 2006, January-February 2008, August-October-2018, and most recently July-October 2023. On average, in these episodes, 30-year yields rose at least 25bp from their local trough rising for more than two months, and the curve has tended to steepen alongside this rise in yields ( Figure 82). However, it’s notable that the steepening trend tends to be more fleeting, lasting only 6 weeks, on average. To be fair, these averages obscure the nuance of each individual episode, and we think it’s worthwhile to explore the episodes that occurred during Fed easing cycles to more closely align with the current environment.
Figure 82: Over the last 35 years, in normalized rate environments, bearish steepening episodes have lasted approximately 2 months on average
Cumulative change in 5s/30s Treasury curve (lhs) and 30-year Treasury yields (rhs) from local trough in 30-year yields before a period of at least one-month of bearish steepening*; bp both axes
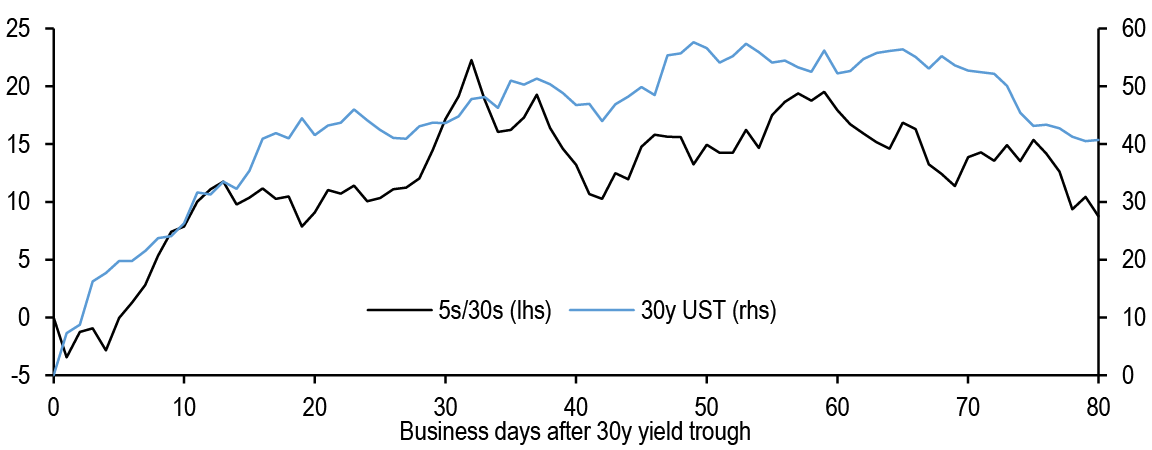
*Dates used: 8/1/1990, 3/22/2001, 2/22/2006, 1/23/2008, 8/23/2018, 7/19/2023
Source: J.P. Morgan
First, in 1990, the Fed eased in mid-July, kicking off the steepening trend, but then Iraq invaded Kuwait in early-August, and the steepening became bearish as oil prices doubled over a short period of time ( Figure 83). The curve would bearishly steepen through late-September, before oil prices reversed lower. Long-end yields reversed lower, but the curve maintained its steepness as the Fed would lower rates 100bp in late-1990. Second, the Fed eased 150bp over the first 3 months of 2001, including an inter-meeting 50bp ease to kick off the new year. Despite the surprise ease, the curve traded in largely rangebound fashion, but then began to steepen bearishly in early-spring, perhaps as the market began to perceive the Fed’s actions as credible ( Figure 84). Though long-end yields rose by more than 40bp over the next 6-8 weeks, the curve would become more rangebound.
Figure 83: In summer 1990, the steepening was precipitated by the Iraqi invasion of Kuwait, and the curve held it steepness even as long-end yields reversed lower
5s/30s Treasury curve (bp, lhs) versus 30-year Treasury yields (%, rhs) and Fed funds target rate (%, rhs)
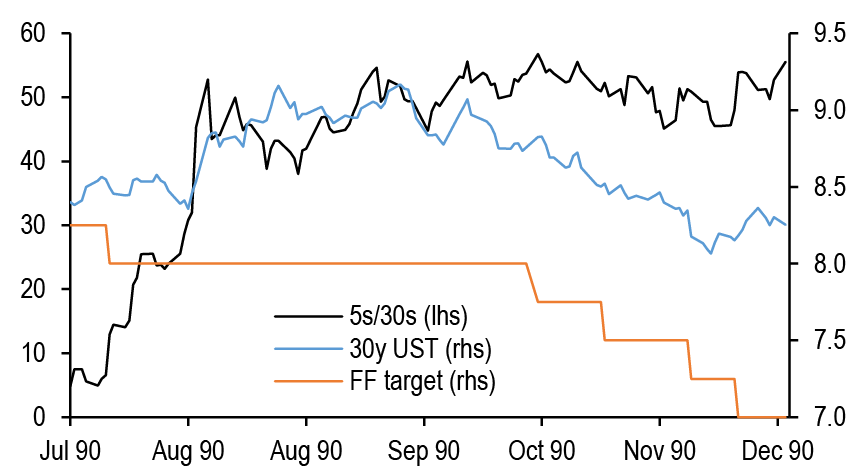
Source: J.P. Morgan
Figure 84: In 2001, long-end yields briefly rose and the curve steepened following 150bp of easing over a 2+ month period
5s/30s Treasury curve (bp, lhs) versus 30-year Treasury yields (%, rhs) and Fed funds target rate (%, rhs)
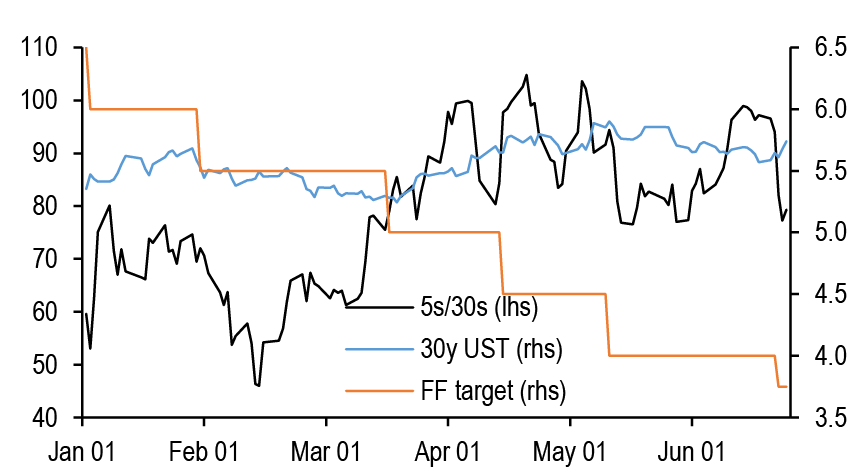
Source: J.P. Morgan
Finally, the briefest bout was in early-2008: the Fed eased by 75bp intermeeting after the Martin Luther King Holiday, in an attempt to stabilize financial conditions after a sharp trading loss at a French bank drove global equities sharply lower. The curve steepened in response to this aggressive action, but yields reversed about 40bp higher over the coming weeks, even though the Fed would ease a further 50bp at the next meeting ( Figure 85). However, this selloff was short-lived, as the Fed would ease 50bp in mid-March after the failure of Bear Stearns.
Figure 85: Similarly, in 2008, the curve briefly steepened to higher yields after the Fed’s 75bp ease, and continued to steepen as the Fed eased further
5s/30s Treasury curve (bp, lhs) versus 30-year Treasury yields (%, rhs) and Fed funds target rate (%, rhs)
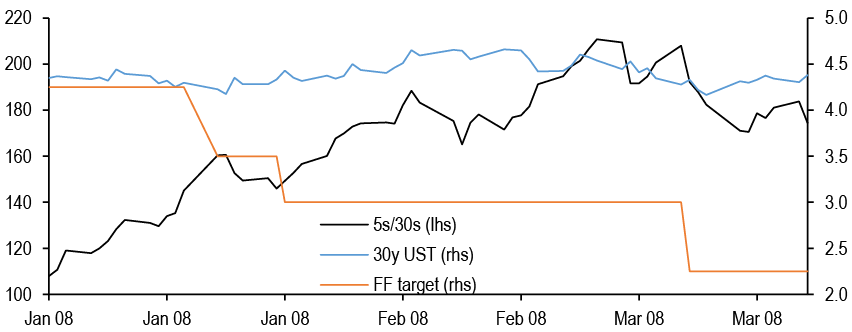
Source: J.P. Morgan
Though each of these episodes during easing cycles was unique, there’s one unifying theme, which is that the curve tends to consolidate after this brief bout of steepening, and that long-end yields tend to stabilize or move lower as the Fed eases further. Accordingly, it’s possible that this bearish steepening trend continues, over the near term, but for this steepening to be sustained, ultimately markets will need to price in deeper and faster easing to sustain this slope of the curve.
Reviewing the tenth annual Treasury market conference
Earlier this week, the Joint Member Agencies (Treasury, Federal Reserve Board, Federal Reserve Bank of New York, SEC, and CFTC) hosted the tenth annual Treasury market conference at the New York Fed. A number of senior officials from these agencies, as well as representatives from the primary dealer, investor, and academic community gathered to review developments in the Treasury market since the first conference was hosted nine years ago, borne out of the flash rally of October 15, 2014. The conference featured speeches from Chair Powell, New York Fed President Williams, Vice Chair for Supervision Barr, Secretary Yellen, SEC Chair Gensler, and a fireside chat with CFTC Chair Benham. Each of these speeches reiterated the importance of ensuring the Treasury market remains the deepest and most liquid bond market in the world, and emphasized the developments made by the Joint Agencies which were reviewed in last week’s Inter-Agency Working Group Report. These speeches are all available on the websites of the Joint Member Agencies, and we choose to focus on the themes across the panel discussions at the conference.
In somewhat of a mirror image to last year’s conference, which focused on the growth of the Treasury cash/futures basis trade, the first panel revolved around asset manager use of Treasury futures. Unsurprisingly, much of this discussion derived from a TBAC charge delivered at the February refunding. One panel member argued that structural asset allocation preference of active fixed-income managers creates a need to own Treasury futures persistently over time that cannot be explained by duration and curve overlay strategies. A number of factors drive this preference for futures.
First, asset managers tend to structurally overweight spread product to produce higher returns in their funds. To the extent that the duration of fixed income spread product tends to be shorter than that of Treasuries, this creates a structural need to own Treasury futures to maintain a duration profile close to their benchmark indices. Second, the Investment Company Act of 1940 (the “40 Act”) had limited mutual fund usage of repo borrowing to 50% of NAV, and repo incurs interest expense which must be reported separately, thus making asset managers who favor repo to futures appear to have higher expenses relative to their peers. Third, many separately managed accounts (SMAs) do not allow the use of repo. Finally, though rolling futures has its own costs and the persistent premium embedded in futures due to this flow creates costs, this remains an attractive strategy even with credit spreads at tight levels. Given the ongoing growth of the Treasury market, it is natural to expect the asset manager long in futures to continue to rise over time.
This preference was echoed by other end users, who also argued that over-the-counter derivatives such as bond forwards, and total return swaps on Treasuries (both index and individual CUSIPs) allowed for customization, which made these instruments preferable for hedging longer-dated insurance and pension liabilities, and offered more value than the richness of SOFR swaps. The discussion also delved into what could reduce the frictions in the market to close the gap between futures and bonds, and most participants argued regulators and supervisors would need to create indifference between futures and the use of Treasury repo, but given current market structure, this may be difficult. Overall, given that the levered basis trade is just the mirror image of the growth of asset manager longs in futures, the connotations for the basis trade were not as negative as previously discussed, but various panelists argued for more cross-margining across cash and futures products to help reduce the risk of a repeat of the deleveraging that occurred at the onset of the pandemic, in March 2020.
The second panel featured a discussion of central clearing of Treasury cash and repo trades in the wake of the SEC’s final rule adopted late last year. This panel focused on next steps before this rule takes effect in December 2025 for cash trades and June 2026 for repo trades. There was a significant discussion around access models for central clearing, as both futures and swaps have a “done away” model for trading, where there is an unbundling of execution and clearing, while the current model for Treasury repo only accommodates the “done with” model. The discussion revolved around the workflow needed to innovate to bring the “done away” model to Treasury repo. There was also a robust discussion about new entrants into this space, as the DTCC is the only clearinghouse in this space right now. Potential new entrants discussed the efficiencies of cross-margining in clearing Treasuries, while others emphasized the lessons learned from bringing central clearing to swaps more than a decade ago, and how separating execution and clearing would be key as competition would lower costs for market participants and enhance liquidity if it ultimately fosters the creation of “all to all” trading in Treasuries, which would be a complementary liquidity protocol to what currently exists in the Treasury market. Others argued that key differences between Treasuries and their derivative counterparts could create market segmentation as market-makers might need to offer different pricing for Treasuries cleared at different clearinghouses, as exists in the swaps market right now.
The final panel focused on the structure of the Treasury market through time, where it stands now, and where it may head over the next decade. The panel began with a stroll down memory lane on the experience of the “2014 flash rally” that was the driver behind the work done by the Inter-Agency Working Group to increase the resilience and safety of the Treasury market over the last decade. Moreover, the panel focused on three different topics, including intermediation in the Treasury market, transparency and clearing. On the first topic, multiple panelists argued that regulation, and in particular, the enhanced Supplementary Leverage Ratio (eSLR) has prevented dealers from growing their intermediation alongside the growth of the Treasury market, and also made their balance sheets less flexible than they were before the GFC. It was also noted how the temporary exclusion of reserves and Treasuries from the SLR calculation in 2020-2021 resulted in increased dealer intermediation in Treasuries. Panelists also touched on how liquidity has improved this year, but also cited the well-known relationship between liquidity and volatility, and how less liquid segments of the Treasury market, such as off-the-runs and longer duration Treasuries, exhibit weaker liquidity than on-the-runs. The Treasury’s buyback program has certainly been helpful in improving liquidity in off-the-runs, but was by no means a panacea in this market segment.
Panelists also discussed transparency in the Treasury market: one panelist argued that real-time transparency in off-the-runs would bring new entrants into this segment, thereby improving liquidity, but other panelists argued caution on this path, as it could dampen liquidity provisions in off-the-runs from existing intermediaries. Finally, an academic argued that the Fed should clear its Treasury trades with primary dealers, which would allow it to provide liquidity against Treasuries through the clearinghouse. This would have benefits, as the Fed would no longer worry about taking on counterparty credit risk outside of the primary dealers it supervises, and mean Fed liquidity facilities could reach a wider array of market participants.
T-bill update
T-bills outstanding have declined $117bn since Treasury started decreasing T-bill sizes earlier this month. During this period, Treasury also conducted four cash management buyback operations, for a total of $20bn, resulting in a commensurately smaller amount of reductions to T-bill sizes than would have otherwise been the case. Overall, paydowns and buybacks during this period evolved broadly in line with the expectations we outlined at the end of August (see Treasuries, U.S. Fixed Income Markets Weekly, 8/23/24).
Looking ahead to next week, net T-bill issuance will turn positive once again: this week, Treasury announced the first increases to T-bill auction sizes in nearly two months. Unlike the front-end focused summer adjustments, the upcoming increases will extend to every sector of the T-bill curve and will take auction sizes to historical highs across most T-bill tenors. This is not surprising, as it follows guidance Treasury provided in the August refunding: “over the course of October, Treasury anticipates increasing all bill auction sizes based on expected fiscal outflows.” We expect this period of positive bill supply to extend into November ( Figure 86). During this 2-month period, Treasury should raise roughly $270bn in T-bills. As a reminder, T-bill supply tends to be positive during the Oct-Nov period. This is due to the seasonality in the fiscal deficit: on a typical fiscal year, roughly 32% on the fiscal deficit takes place in the first two months, a seasonally weak period for Treasury receipts.
Figure 86: T-bill issuance will turn positive next week and remain positive for the next two months
Net T-bill issuance* (lhs; $bn) versus TGA balance (rhs; $bn)
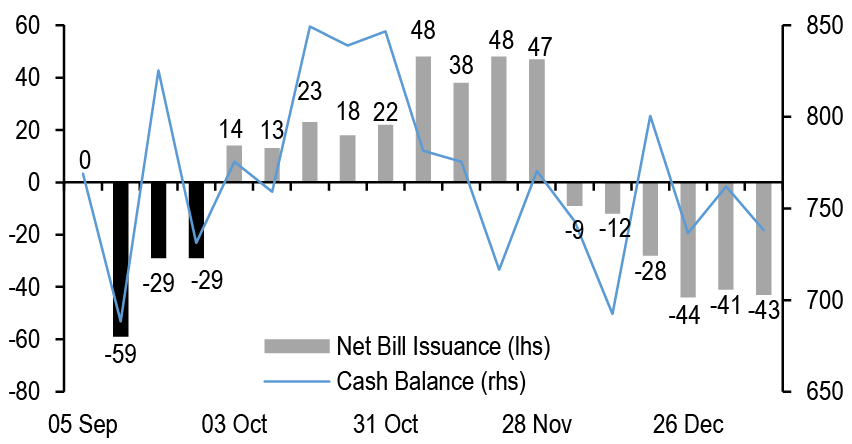
*Grey bars are J.P. Morgan forecasts
Source: U.S. Treasury, J.P. Morgan
Figure 87: Short-dated T-bills are in the richest quartiles of their recent ranges
T-bill/SOFR matched maturity spreads, current levels with 3-month statistics; bp unless otherwise indicated
| Maturity | Current | 3m chg | 3m high | 3m low | 3m avg | Percentile |
| 4-week | -16.6 | -16.6 | -1.2 | -26.2 | -8.2 | 9% |
| 8-week | -7.8 | -7.8 | 2.3 | -17.9 | -5.0 | 20% |
| 13-week | -8.3 | -8.3 | 4.7 | -10.6 | -2.7 | 7% |
| 17-week | -9.3 | -9.3 | 3.4 | -16.4 | -4.8 | 8% |
| 26-week | 5.4 | 5.4 | 8.4 | -7.1 | 2.5 | 65% |
| 52-week | 9.4 | 9.4 | 11.8 | -0.2 | 6.2 | 82% |
Source: J.P. Morgan
Turning to valuations, the reductions in front-end T-bill sizes appear to have contributed to the richening of this sector: Figure 87 shows that 1- to 3-month T-bills are in the richest quartiles of their recent ranges, and earlier this week traded at their richest levels since early summer 2023, right after the passage of the debt ceiling, when T-bill supply was relatively scarce. Additionally, rich valuations might also be explained by proximity to quarter-end, a dynamic that we observed last year and that has continued to play out in recent quarters: Figure 88 shows front-end T-bills tend to richen ahead of quarter-end and proceed to cheapen in the last days of the quarter and into the start of the new quarter (see Treasuries, U.S. Fixed Income Markets Weekly, 3/31/23). Looking ahead, the combination of quarter-end dynamics and the upcoming period of positive supply should allow the front-end of the T-bill curve to cheapen from current levels. However, deeply inverted money market curves might discourage liquidity investors from extending further out the curve, which should prevent a more meaningful cheapening in front-end bills (see Short-Term Fixed Income, U.S. Fixed Income Markets Weekly, 9/20/24). Additionally, as Figure 88 shows primary dealers typically take advantage of this seasonal dynamic, adding to T-bills during the move cheaper around quarter-end, which should also prevent a more significant cheapening.
Figure 88: 1-month bills tend to richen ahead of and cheapen around quarter-end, while 1-year bills remain range-bound...
Median changes in 1- vs 12-month T-bill/SOFR matched maturity spreads around quarter end over the last two years; bp
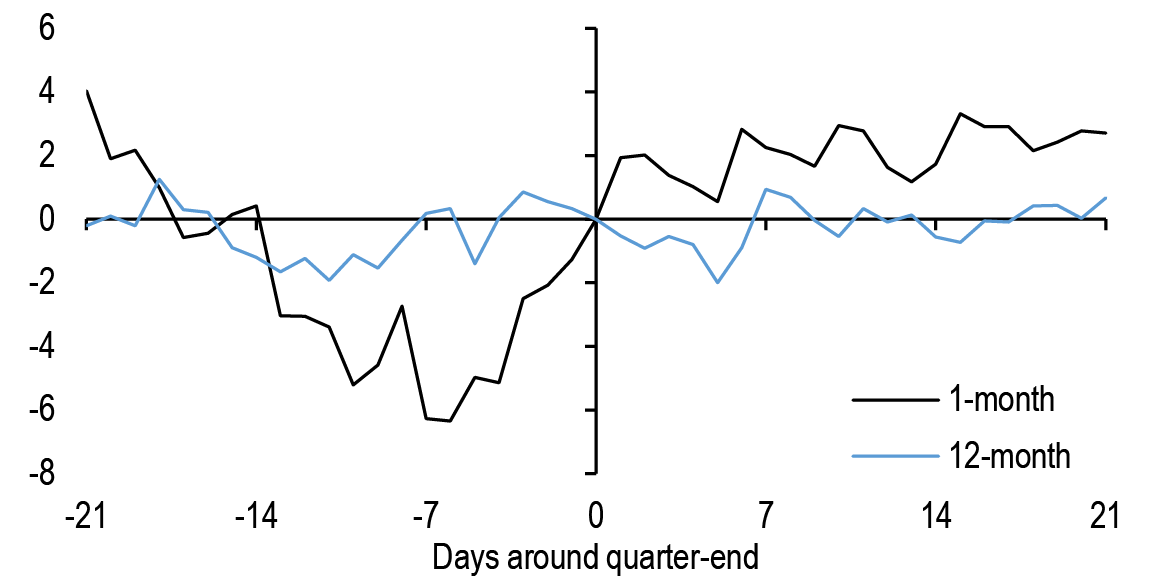
Source: J.P. Morgan
Figure 89: ...and primary dealers holdings of T-bills typically rise around quarter-end, as front-end bills cheapen
Average cumulative change in PD holdings of T-bills around quarter end (lhs; $bn) versus 1-month T-bill/SOFR matched maturity spreads over the last 2-years* (rhs; bp)
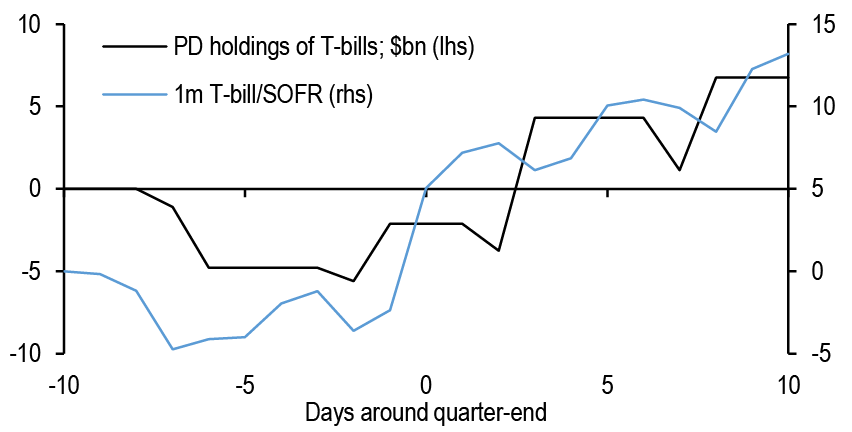
*excluding March 2023, when T-bill valuations were exceedingly rich and volatile amid debt ceiling dynamics
Source: Federal Reserve Board of New York, U.S. Treasury
Further out the T-bill curve, risks appear more balanced for a few reasons. First, valuations are close to the middle of their three month ranges. Second, as unlike front-end T-bills, longer-dates bills tend to remain range-bound around quarter-end ( Figure 89). Third, similarly to last month, positioning seems to be a neutral factor, as dealer inventories of T-bills remain stable and below recent averages ( Figure 90). Fourth, our derivatives colleagues also remain neutral swap spreads. However, upcoming record-sizes could be bearish for longer-date T-bills at the margin.
Figure 90: Primary dealers hold 1.1% of T-bills outstanding, below recent averages
Primary dealer holdings of T-bills as a share of T-bills outstanding; %
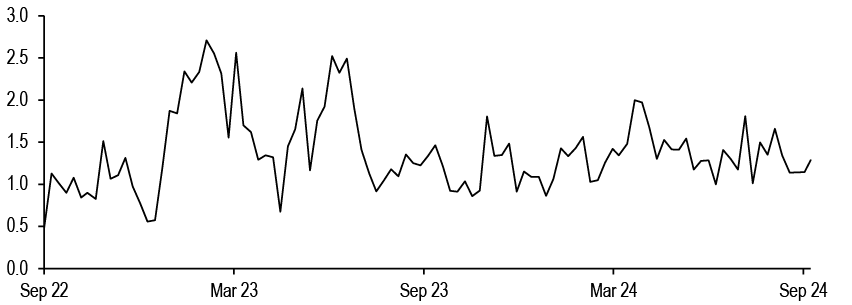
Source: Federal Reserve Board of New York, U.S. Treasury
Trade recommendations
- Initiate 3s/20s steepeners
- Buy 100% risk, or $180mn notional of T 3.375% Sep-27s (yield: 3.478%; bpv: $278/mn)
- Sell 100% risk, or $37.3mn notional of T 4.125% Aug-44s (yield: 4.15%; bpv: $1343/mn)
- Weighted spread is -67.2bp. One-month weighted carry is -4.5bp and roll is -0.6bp
- Maintain 91:100 weighted 3.125% Nov-41/ 2% Nov-41 flatteners
- Buy 91% risk, or $20mn notional of T 3.125% Nov-41s (yield: 4.02%; bpv: $1146/mn)
- Buy 100% risk, or $24.7mn notional of T 2% Nov-41s (yield: 4.121%; bpv: $1021/mn)
- (US Fixed Income Markets Weekly, 9/20/24: P/L since inception: -0.6bp)
- Maintain 75%/6% weighted 5s/10s/30s belly-cheapening butterflies
- Stay long 75% risk, or $43mn notional of T 4.625% Sep-28s
- Stay short 100% risk, or $33.3mn notional of T 3.875% Aug-33s
- Stay long 6% risk, or $1mn notional of T 4.125% Aug-53s
- (US Fixed Income Markets Weekly, 9/29/23: P/L since inception: -0.4bp)
- Maintain 23:84 weighted 2s/7s/10s belly-richening butterflies
- Stay short 23% risk, or $28mn notional of T 4.375% Jul-26s
- Stay long 100% risk, or $40.2mn notional of T 4.125% Jul-31s
- Stay short 84% risk, or $23mn notional of T 3.875% Aug-34s
- (US Treasury Market Daily, 8/21/24: P/L since inception: -1.6bp)
Figure 91: Closed trades in last 12 months
P/L reported in bp of yield unless otherwise indicated
| TRADE | ENTRY | EXIT | P/L |
| Duration | |||
| 5-year duration longs | 10/03/23 | 11/02/23 | 14.9 |
| 7-year duration shorts | 11/03/23 | 11/22/23 | -7.9 |
| 30-year duration shorts | 12/15/23 | 01/04/24 | 10.9 |
| 5-year duration longs | 01/19/24 | 02/01/24 | 25.3 |
| 5-year duration longs | 02/09/24 | 03/07/24 | 3.3 |
| Equi-notional 2s/5s flatteners | 05/31/24 | 06/06/24 | 16.0 |
| 5-year duration shorts | 06/14/24 | 07/01/24 | 21.9 |
| 30% 2-year duration short | 07/12/24 | 07/31/24 | -1.8 |
| Curve | |||
| 10s/30s steepener | 12/16/22 | 09/29/23 | 3.0 |
| 10s/30s steepener | 11/03/23 | 11/22/23 | -7.3 |
| 2s/5s flatteners | 12/08/24 | 05/17/24 | 6.0 |
| 5s/30s steepener | 11/22/23 | 09/06/24 | 26.4 |
| 3s/5s steepener | 09/04/24 | 09/06/24 | 3.1 |
| 3s/30s steepener | 09/06/24 | 09/18/24 | 0.2 |
| Relative value | |||
| 2.75% Aug-32/ 3.5% Feb-39 steepeners | 01/10/24 | 01/26/24 | 5.2 |
| 20s/ old 30s flatteners | 02/15/24 | 05/10/24 | -2.6 |
| 100:97 weighted 3.75% Apr-26/ 4.625% Sep-26 flatteners | 04/12/24 | 05/17/24 | 2.2 |
| 100:95 weighted 4% Feb-28 / 4% Feb-30 steepeners | 02/23/24 | 05/31/24 | -6.6 |
| 50:50 weighted 3s/5s/7s belly-richening buterflies | 03/15/24 | 06/14/24 | 2.1 |
| 100:98 weighted 4.75% Feb 37s / 4.5% Aug 39s steepeners | 06/14/24 | 07/12/24 | 2.6 |
| 100:95 weighted 0.625% Jul-26s / 1.25% Dec-26s steepeners | 07/12/24 | 08/14/24 | 1.5 |
| Number of positive trades | 16 | ||
| Number of negative trades | 5 | ||
| Hit rate | 76% | ||
| Aggregate P/L | 118.4 |
Source: J.P. Morgan
Interest Rate Derivatives
Waiting Game
- Near term Fed expectations remain where they were a week ago as markets await next week’s employment report, but the broader swap curve steepened again this week as yields rose at the back end. This apparent shift in swap yield curves’ exposure to front end Fed expectations is actually merely the result of the fact that multiple factors are at play. All four market factors in our yield curve models have seen significant variation in recent weeks, and collectively explain curve moves quite well
- Of particular note, the volatility of long run 5Yx5Y inflation expectations has recently been higher, making it an important second factor driving yield curves and longer maturity yields. Indeed, an unbundling of realized volatility into components stemming from each principal component suggests that realized volatility attributable to the second principal component (or PC2 vol) has been drifting higher, in step with the rise in the volatility of long term inflation expectations. At the same time, however, implied PC2 volatility has declined sharply, making it attractive to create long exposure to volatility of the second principal component. There are currently three attractive ways to do this …
- … sell 6Mx10Y swaption volatility versus buying 130% of the vega risk in 6Mx30Y swaption straddles …
- … overweight 6Mx2Y swaption volatility versus 6Mx5Y swaption volatility …
- … and overweight 5s/30s curve volatility via YCSOs versus a carefully weighted short in 6Mx5Y swaption volatility
- Funding conditions continue to tighten, T-bill supply is poised to turn positive for the next two months, and high grade corporate issuance and related swapping activity could pick up as we move towards mid-October. All of these will likely pressure spreads narrower, but there are important offsets. Asset-swapping front end USTs offers a significant pickup over IOR relative to OCI risk for banks, and such a receive-SOFR position is also an attractive way to position for a rise in SOFR and/or a curative cut in IOR if indeed repo rates drift much higher
- The attractiveness of front end asset swaps to banks is thus an important offset, as are cheap valuations, and we therefore remain neutral on swap spreads for now on an outright basis...
- ... the exception to this view is the 7-year sector, where we recommend initiating narrowers as 7-year spreads appear noticeably wide to fair value
- On a relative basis, position for a steeper 7s/10s swap spread curve due to its asymmetric exposure to 7s/10s UST yield curve flattening as well favorable entry levels. In addition, 2s/3s swap spread curve flatteners remain attractive
Waiting Game
In the period since last week's rate cut from the Fed, we have heard from several Fed speakers. Overall, speakers have signaled an increased focus on labor markets given that inflation appears to be on a downward trajectory, and have noted that weakness in labor markets can occur rather suddenly. Fed-speak is also consistent with a desire to frontload cuts, given that rates are significantly restrictive by most estimates and the lags in monetary transmission can be long. All in all, the broad tone is consistent with our own expectation of another 50bp rate cut in the November meeting (Figure 1). Data flow has been somewhat light, but mildly positive - durable goods and initial claims data remain positive, although consumer confidence has weakened (see Labor market concerns stand out in Sep confidence survey, A. Reinhart, 9/24/2024).
Figure 1: Fed-speak remains consistent with a desire to frontload cuts
Selected Fed-speak excerpts, 9/20/2024 - 9/27/2024

Source: J.P. Morgan., Bloomberg Finance L.P.
At the front end of the curve, Fed expectations have barely budged - forward 1M OIS rates at selected FOMC meeting dates are all within a few basis points of last week's closing levels (see top half of Figure 2), and are currently priced to less than a 50bp cut in November, which points to a degree of uncertainty around the near term pace of Fed easing. Indeed, our often-utilized tool of decomposing the Z4 SOFR futures implied probability distribution into intuitive weights on individual policy rate outcomes suggests that there is still considerable uncertainty around the policy path, with roughly similar weights on scenarios that are as much as 50bp apart (Figure 3). But whatever the uncertainty around near term Fed expectations, longer term yields generally rose over the course of the week and the curve steepened (see lower half of Figure 2). Indeed, the curve appeared to almost decouple from Fed expectations, as we noted last week (see From Dovish Pause to Hawkish Easing) and as our UST strategists discussed in a mid-week note this week. As they note in their conclusion, the history of such steepening episodes during easing cycles is that they tend to be brief, and longer term yields eventually drift back lower as Fed easing continues (see US Treasury Market Daily: How common is bear steepening?, J. Barry, et al., 9/25/2024).
Figure 2: In the past week, Fed expectations are mostly unchanged but the swap curve has twisted steeper
Forward 1M OIS rates and statistics at FOMC meeting dates as well selected statistics of SOFR swap rates, 9/20 - 9/27; %
| start | chg | end | min | mean | median | max | |
| Nov FOMC | 4.454 | -0.012 | 4.442 | 4.429 | 4.443 | 4.445 | 4.456 |
| Dec FOMC | 4.088 | -0.031 | 4.057 | 4.038 | 4.066 | 4.065 | 4.091 |
| Jan FOMC | 3.749 | -0.020 | 3.729 | 3.694 | 3.733 | 3.729 | 3.780 |
| 2025 Mid-year | 3.050 | 0.010 | 3.060 | 3.004 | 3.053 | 3.045 | 3.130 |
| 2025 Year-end | 2.835 | 0.016 | 2.851 | 2.798 | 2.844 | 2.836 | 2.910 |
| 1Y swap yield | 3.792 | -0.034 | 3.757 | 3.746 | 3.773 | 3.769 | 3.811 |
| 2Y swap yield | 3.367 | -0.012 | 3.355 | 3.328 | 3.363 | 3.359 | 3.413 |
| 5Y swap yield | 3.186 | 0.007 | 3.193 | 3.181 | 3.202 | 3.196 | 3.242 |
| 10Y swap yield | 3.270 | 0.014 | 3.285 | 3.270 | 3.291 | 3.283 | 3.321 |
| 30Y swap yield | 3.262 | 0.024 | 3.286 | 3.262 | 3.287 | 3.282 | 3.317 |
Source: J.P. Morgan.
Figure 3: There is still considerable uncertainty around the policy path, with roughly similar weights on scenarios that are as much as 50bp apart
Weights on YE24 policy rate scenarios representing a range of different Fed Funds rates, as calculated from a decomposition of the implied probability distribution associated with Dec 2024 SOFR futures*; 9/25
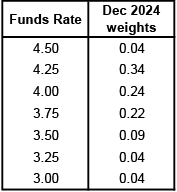
* We enumerate a list of scenario-specific Normal distributions with fixed standard deviations and means that are separated by 25bp, and then require the implied distribution to be a weighted combination of these individual distributions. The weights are then solved for, by fitting to the observed prices of calls and puts at various different strikes. For more details of our approach, see What’s the rush?.
Source: J.P. Morgan., CME
Our recent trading themes have implicitly reflected this expectation that the post-FOMC bear steepening is somewhat idiosyncratic in nature, because of which we recommended bear flatteners and weighted flatteners last week. But given a continuation of the trend into this week, we take a closer look at swap yield curve moves, and their drivers in recent weeks. Specifically, we look at changes in curves over the past 3 weeks (since the 6th of September) and attempt to decompose them into portions attributable to each factor used in our empirical fair value model for swap curves. We choose the past three weeks because that is a period that has seen all 4 major factors in our model move by 1-sigma or more in magnitude (Figure 4).
Figure 4: The past three weeks have seen significant moves in three out of four major drivers of swap yield curves
Normalized* move in 2Y inflation swap yield, 5Yx5Y inflation swap yield, 3Mx3M OIS rate and the Fronts Reds curve (proxied by 3Mx3M / 15Mx3M OIS curve), unitless ratio
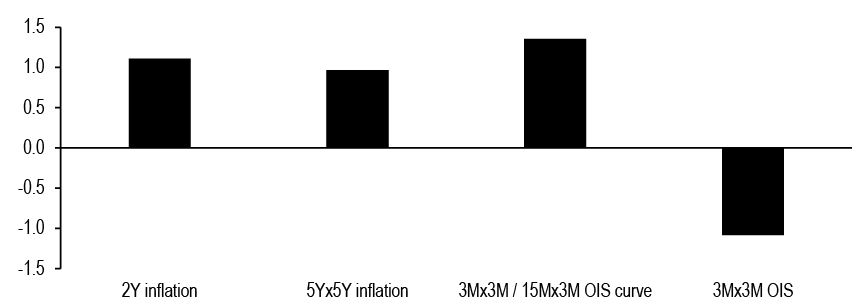
*Normalized move defined as move in the value of each driver, minus the 2Y mean of the driver, all divided by the 2Y standard deviation of 3 week changes of the driver
Source: J.P. Morgan.
It is worth noting that these moves in the drivers do not all point in the same direction - given the typical signs of the coefficients, the rise in short term inflation and the steepening of the Fronts/Reds curve in recent weeks ought to pressure swap curves flatter, while the rise in long term inflation expectations and the downward move in 3Mx3M OIS rates biases swap curves steeper. How do these influences net out for swap curves in various sectors? Figure 5 shows the impact of each driver , based on our fair value model (for simplicity we only show the impact of the drivers that changed over the past three weeks, but full details of our fair value framework can be found in our Interest Rate Derivatives 2024 Mid-Year Outlook), and the overall net impact on the curve. As can be seen, our fair value model has actually tracked the changes in the swap curve fairly well, especially for curves that are anchored in the front end and the belly. For example, spot 2s10s curve has steepened by 15bp in the past three weeks, with our fair value model successfully explaining almost all of that change. Lower short term rates and the rise in long term inflation expectations have produced enough of a steepening bias to explain the overall steepening move in recent weeks.
Figure 5: Our empirical fair value model for swap yield curves has been quite effective in explaining yield curve moves in recent weeks
Factor impact* for each of our swap yield curve fair value model** drivers, FV expected change*** and actual change in curve levels from 9/6 - 9/25; %
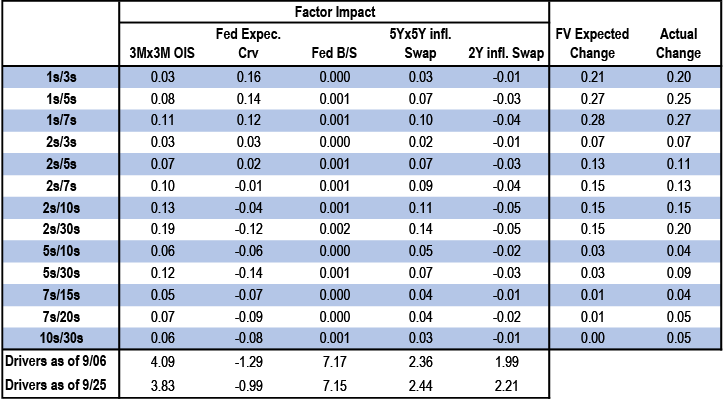
* Factor Impact is defined as the change in each of our fair value model drivers multiplied by their partial beta to each curve from our fair value model. For simplicity we only show the impact from the drivers that changed over the past three weeks.
** For details on our fair value framework for the swap yield curve, see Interest Rate Derivatives 2024 Mid-Year Outlook
*** FV expected change is defined as the sum of the factor impacts.
Source: J.P. Morgan., Federal Reserve H.4.
In short, a closer look at swap curve performance suggests that there is as yet no evidence of a break in fundamental relationships between swap curves and their drivers. But there is some evidence that the volatility of long term inflation expectations has risen, and it is emerging as an important second factor that is driving the curve (given that the numerical values of the partial coefficients with respect to 5Yx5Y inflation are much larger than other similar factors, even small moves in this variable suffice to produce a noticeable impact). This is evident in the fact that volatility of second principal component driving swap yields has risen roughly in step with the rise in the volatility of inflation expectations as seen in Figure 6. At the same time, the implied volatility of the second principal component has fallen as seen in Figure 7, which represents an opportunity (for a detailed discussion of how to define, calculate and trade the volatility of principal components see Trading Principal Factor Volatility).
Figure 6: Long term inflation expectations have been more volatile recently, and this factor is emerging as an important second factor driving swap curves, which may help explain the rise in the volatility of the second principal component …
Realized volatility of the second principal component* (left) and 3-month realized volatility of the 5Yx5Y inflation swap** (right), Mar 2024 - Current; bp/day
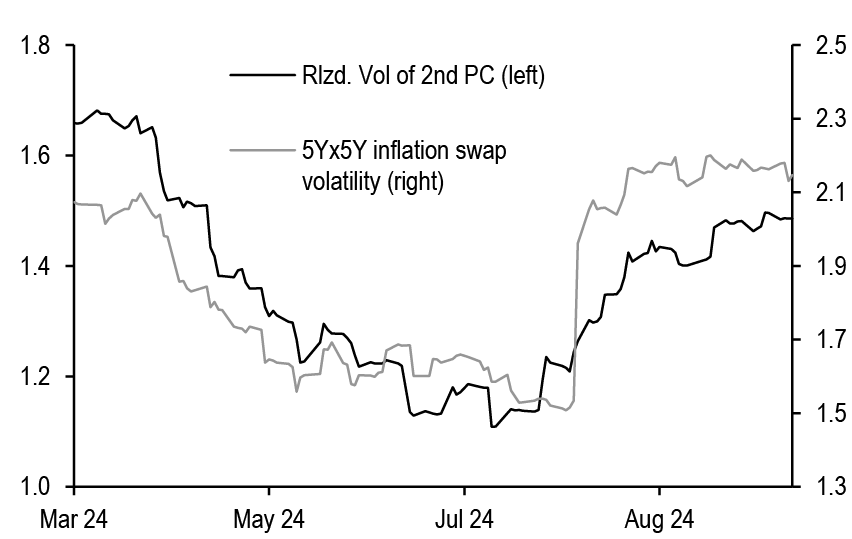
*Realized PC2 volatility is calculated as the square root of the sum square of the second principal component loadings, divided by the number of variables. Principal component loadings are calculated using 6M forward yields, and using 3-month history. For details on our approach to calculating principal component volatility, see Trading Principal Factor Volatility
**Calculated as 3-month standard deviation of daily changes of the 5Yx5Y inflation swap
Source: J.P. Morgan.
Figure 7: … but implied volatility of the second principal component has fallen in the past few weeks
Implied volatility of the second principal component*, Mar 2024 - Current; bp/day
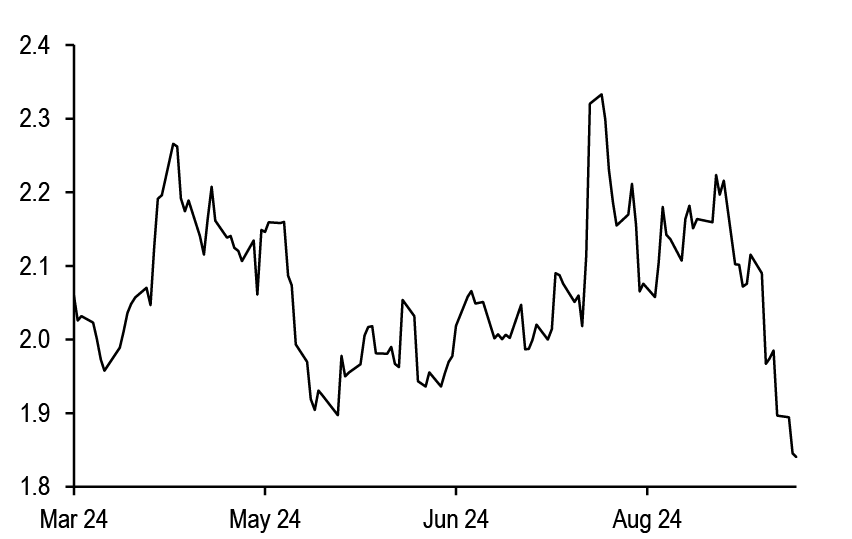
* Implied PC2 volatility is calculated as the square root of the sum square of the implied second principal component loadings divided by the number of variables.
For details on our approach to calculating principal component volatility, see Trading Principal Factor Volatility. For details on our approach to calculating implied principal components see i-PCA: Implied Principal Component Analysis
Source: J.P. Morgan.
This decoupling between implied and realized volatility of the second principal factor driving swap curves is the basis for three important trading themes as we head into next week. First, we continue to recommend initiating long exposure to second principal component volatility, given that implied second-factor volatility has sharply fallen even as realized volatility has risen. But how does an investor trade this seemingly abstract notion of volatility of the second principal factor? We have discussed this at length in a separate piece (Trading Principal Factor Volatility), but a quick and intuitive summary is as follows. If we assume that the bulk of the variation in rates is explained by two principal components, which are uncorrelated by design, then it follows that the volatility of any given rate can be decomposed into some weighted combination of the volatility of the first and second principal factors. In general then, we ought to be able to combine a long position in one tail with a carefully weighted short in another tail, to create long PC2 vol exposure while cancelling out the PC1 vol exposure. Currently, one attractive way to do this is via selling 6Mx10Y straddles versus buying 130% of the vega weight in 6Mx30Y straddles. As Figure 8 shows, 6M returns from this strategy has tracked the ex-post realized factor volatility minus ex-ante implied factor volatility differential reasonably well, attesting to the validity of such an approach to trading factor volatility. Therefore, we recommend this trade (see trade recommendations).
Figure 8: Returns from a strategy designed to isolate long exposure to PC2 volatility are indeed explained by the differential between ex-post realized factor volatility and ex-ante implied factor volatility
Rolling 6M returns from a long PC2 volatility position constructed using 6Mx10Y and 6Mx30Y swaption straddles* (left, bp/notional), versus the difference between ex-post realized PC2 volatility and ex-ante implied PC2 volatility ** (right, bp/day) , Sep 2023 - Sep 2024

* Weights on 6Mx10Y and 6Mx30Y straddles are chosen to isolate exposure to PC2 while hedging exposure to PC1 using the methodology outlined in Technical Appendix 2 of Trading Principal Factor Volatility. Options are delta hedged daily, and rolled monthly, and transaction costs are ignored.
** Implied PC2 volatility is calculated as the square root of the sum square of the second implied principal component loadings divided by the number of variables. Ex-post realized PC2 volatility uses 6-months of history
Source: J.P. Morgan.
A second trading theme that is inspired by the desire to create long exposure to second-factor vol is to buy short expiry volatility on 2-year tails versus selling 5-year tail volatility. We motivate this by first looking at the loadings of the principal components on various tails. As seen in Figure 9, 5- and 7-year tails have numerically insignificant loadings from the second principal component. This means that the volatility of 5- and 7-year tails derives almost entirely from the volatility of the first principal component. In contrast, 2-year tails have a first component loading that is comparable to the loading on 5s, but it also has a numerically significant loading from the second principal component. In other words, the volatility of 2-year tails stems from the volatility of the first as well as second principal factors. Thus, a 2s/5s tail switch can be a way to create exposure to second-factor volatility, while shedding unwanted exposure to the first factor's volatility. A methodologically "pure" way to construct this trade would require us to carefully weight the 6Mx5Y short in order to precisely cancel out the first factor's volatility. But we prefer the simplicity of a theta-neutral tail switch in this case. Therefore, we recommend buying 6Mx2Y swaption volatility versus selling a carry-neutral amount of 6Mx5Y swaption volatility (see Trade recommendations).
A third trading theme that stems from the same idea is to position for a decline in correlation. The relationship between falling correlation and rising second factor vol is easy to intuit - a hypothetical world where only the first factor moves and the second (and higher) factors have zero volatility would correspond to perfect correlation (since there is just one factor driving rates in multiple tenors). Thus, by extension, rising second factor volatility is likely to produce a fall in realized correlations between different tails, which in turn means that implied correlations are likely to fall as well. For example, one way to do this that is currently attractive is to buy 6M expiry single-look straddles on the 5s/30s curve paired with a 50% weighted short in 6Mx5Y straddles, as 5s30s implied correlation is at a significantly elevated level relative to history as seen in Figure 10.
Figure 9: Second principal component loading on 5-year and 7-year tails is near zero
Impact of a +1-sigma move in the first two implied principal factors* (the "level" and "curve" factors) on swap yields, 9/26/2024; bp
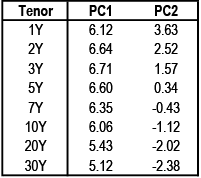
* Implied-PC loadings for 2Y, 5Y, 10Y, and 30Y are computed from an implied covariance matrix derived from options market information. Implied-PC loadings for non benchmark tenors are imputed from a regression on benchmark tenors. See i-PCA: Implied Principal Component Analysis for more details
Source: J.P. Morgan.
Figure 10: Implied correlation between 5- and 30-year tails is now at a historical high
Implied correlation between 5- and 30-year tails, inferred from 6M expiry single-look YCSOs; past 4 years history
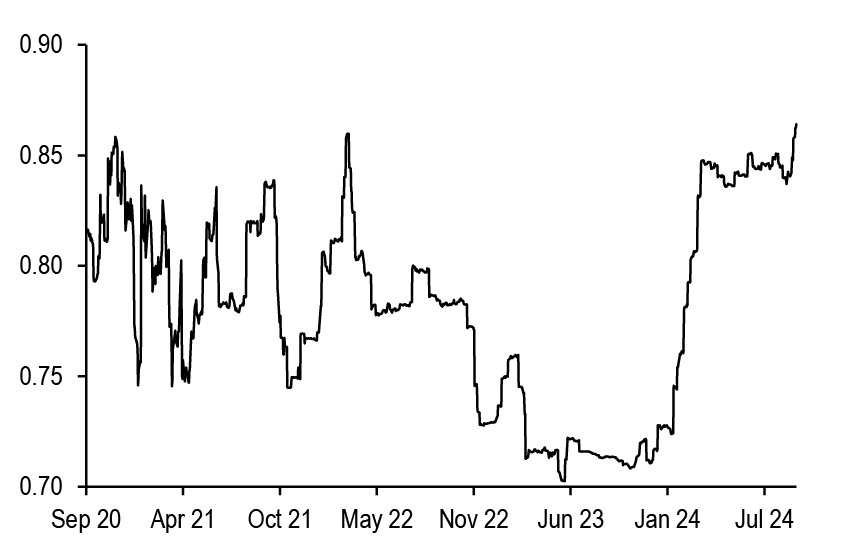
Source: J.P. Morgan.
Beyond these nuanced relative views, we turn neutral on volatility on an outright basis. In recent weeks, we had recommended a bearish view on shorter expiries in most sectors (except on short tails, where we recommended a neutral posture), premised in part on the expectation that markets would be in a lull until new information emerges. With the next employment report just a week away, the risk reward in short gamma positions will increasingly turn less favorable as we move through next week. At the same time, long gamma exposure is also not compelling, because of the fact that implieds continue to look rich to our estimates of fair value in most short expiry sectors. Therefore, we recommend turning tactically neutral on volatility across the board, while we await the passing of event risk from next week's employment report.
Swap spreads
Swap spreads continued their relentless narrowing this week, narrowing by 2bp in the front end, 1bp in 10s to 20s and close to flat in the long end as well as the 5- to 7-year sectors (Figure 11). When we view swap spreads through the lens of the term structure as we have done in the past, we can see that term funding premium (TFP) is essentially unchanged over the week but zero-duration spreads (ZDS) are narrower by about 1bp. (A quick note - on any given day, we can regress maturity matched swap spreads in all the benchmark tenors versus modified duration of the corresponding bonds. We define zero-duration-spreads as the intercept from this regression, and we define term funding premium as the negative of the slope. For a deeper discussion of these quantities, their interpretation and significance as well as their relevance to the outlook for swap spreads, see Term Funding Premium and the Term Structure of SOFR Swap Spreads).
Looking ahead, there are several factors that could pressure swap spreads narrower across the curve in coming weeks. One, funding conditions are continuing to tighten. Recently (see Hopscotch), we expanded upon an analysis by the Fed staff (see Scarce, Abundant, or Ample? A Time-Varying Model of the Reserve Demand Curve, Federal Reserve Bank of New York, May 2022 (Revised April 2024) and When Are Central Bank Reserves Ample?, Liberty Street Economics, 8/13/2024) to answer the questions of whether liquidity in the system is still ample. Specifically, we extended their idea by examining the beta of changes in the SOFR-minus-top-of-the-band differential versus percent changes in systemwide liquidity (defined as the total quantity of Reserves plus RRP balances). The intuitive idea behind examining this beta is that in a world of constrained liquidity, beta might be expected to be significantly negative, but the beta would likely be closer to zero when liquidity is abundant. As seen in Figure 12, this beta is now in significantly negative territory, albeit not yet as extreme as it has gotten in select episodes. This suggests that liquidity conditions are clearly becoming tighter. Persistently elevated GC repo rates (relative to RRP rates or SOFR) are another sign of tightening liquidity / financing conditions. The overnight GC repo rate, which first rose relative to RRP and IOR in late June, has struggled to normalize towards lower levels. We view this as another sign of tighter funding conditions, and such conditions are unlikely to change until QT's eventual halt, which we expect around year-end (see Cross currency basis 4Q24 Outlook: Narrowing bias on risk of earlier Fed QT pause and of faster easing on labour market weakness).
Figure 11: Swap spreads are narrower across the curve, with the front end underperforming
Selected statistics for maturity matched SOFR swap spreads, 9/20 - 9/27; bp
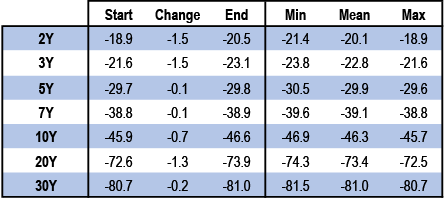
Source: J.P. Morgan.
Figure 12: An examination of the response of SOFR rates to overall systemwide liquidity suggests that funding conditions have tightened
10-day moving average of rolling 1Y beta of weekly changes in the SOFR-versus-top-of-band differential versus rolling percentage changes in systemwide liquidity*; bp per 1 pct point
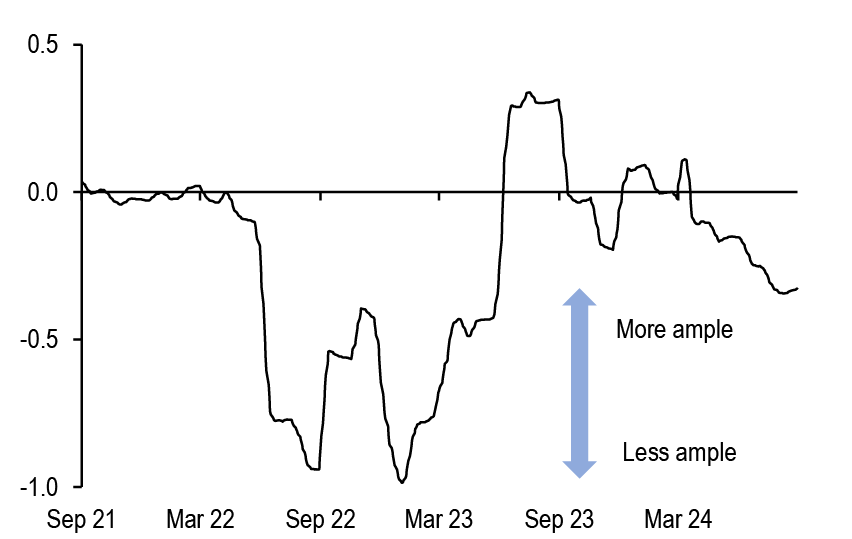
* Systemwide liquidity defined as the total of Reserves and RRP balances
Source: J.P. Morgan.
Two, at the same time that financing conditions continue to tighten, T-bill supply is poised to turn positive through October and November (US Treasury Market Daily: T-bill update, J. Barry et al., 9/26/2024). We've noted the relationship between T-bill supply and ZDS (and thus front end spreads) before. All else equal, the upward turn in T-bill supply is also likely to pressure front end spreads and zero-duration spreads narrower. Finally, further out the curve, a different dynamic could pressure spreads narrower. Although we may get a brief lull in HG issuance for the next week or two, it could pick up as we move beyond the second week of October as we get past banks earnings season (Figure 13). Such a pickup in high grade issuance is associated with narrowing pressure, since some fraction of this supply (especially from financial issuers) tends to get swapped to floating.
Thus far, all of these factors argue for a narrowing bias on swap spreads across the curve. But there are two important offsetting considerations. The first of these is valuations. Our revised fair value model for zero duration swap spreads suggests that ZDS is currently about 3bp narrow relative to fair value, which is about 1.25 times the standard error of this model. Any correction in this residual would bias swap spreads wider across the curve. Second, front end spreads are now narrow enough that they offer a sizeable pickup over IOR (nearly 15bp in the 2Y sector). This is quite attractive relative to the spread-risk involved in asset swapping front end US Treasuries. The attractiveness is only enhanced by the fact that this is a good way to position for a further tightening of liquidity conditions. The rise in SOFR rates which would occur in the event of a continued tightening of conditions would be beneficial to such a receive-SOFR position. So would any curative policy action, which might entail lowering IOR in order to incentivize bank lending in repo markets. Therefore, we think that banks will likely find it attractive to add USTs on asset swap, at least at the front end, perhaps after the end of the quarter. Indeed, it is worth keeping in mind that banks have already been steady buyers of USTs this year (Exhibit 14).
Figure 13: High grade issuance is likely to pick up as we move towards mid-October
High grade issuance cycled around days around September month end, past 4 cycles as well as current (Sep-24); $bn
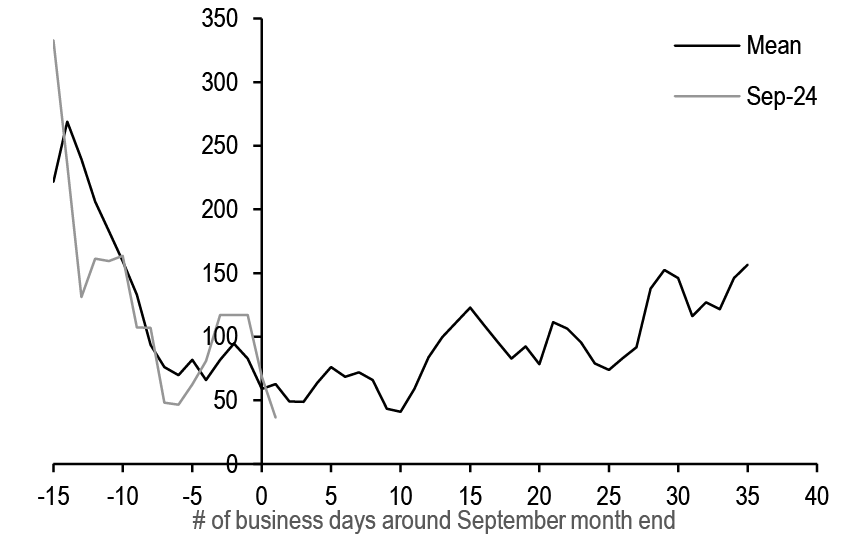
Source: J.P. Morgan.
Figure 14: Banks have been steadily adding USTs this year
Percent growth in bank holdings of USTs*; 2022-present; %
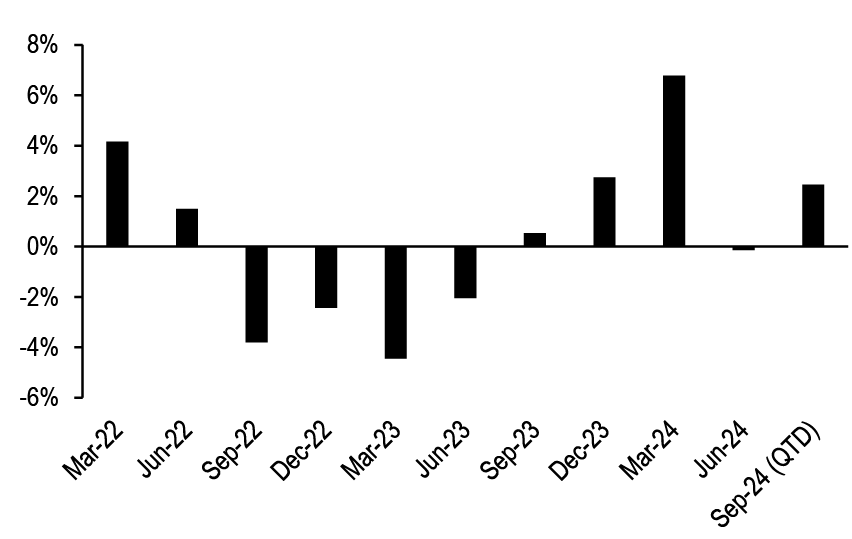
*Calculated as the percent change from the prior quarter
Source: J.P. Morgan., Federal Reserve H.8., FRED
Therefore, we think risks appear rather balanced overall, and we are therefore neutral on swap spreads on an outright basis.The one exception to our neutral view is the 7-year sector, where we recommend initiating narrowers. As Figure 15 shows, 7-year spreads stand out as being noticeably wide to fair value, and this could correct in coming weeks on the back of a pickup in issuance-related swapping as we move towards mid-October. Therefore, we recommend initiating 7-year maturity matched swap spread narrowers (see Trade recommendations).
We also continue to recommend taking advantage of several relative value opportunities across the spread curve. One, we continue to recommend 2s3s swap spread curve flatteners, which we first highlighted last week (see From Dovish Pause to Hawkish Easing), as it remains attractive. Another swap spread curve trade that also looks attractive is a 7s/10s spread curve steepener. As Figure 16 shows, this spread curve appears to offer asymmetric exposure to a flatter 7s/10s Treasury yield curve, given its propensity to steepen at an accelerating rate when the UST yield curve flattens. Moreover, the spread curve is currently too flat relative to its empirical relationship to the 7s/10s UST yield curve. Therefore, we recommend initiating 7s/10s swap spread curve steepeners, due to this combination of an attractive entry point and its asymmetric exposure to UST yield curve flattening (see Trade recommendations). At current market levels, the local beta with respect to the 7s/10s UST curve is close to zero, and therefore this spread curve steepener requires no curve hedge at inception.
Figure 15: Spreads look narrow to fair value with the exception of 7- and 30-year sectors
Residual from our fair value model* for maturity matched swap spreads, 9/26; bp
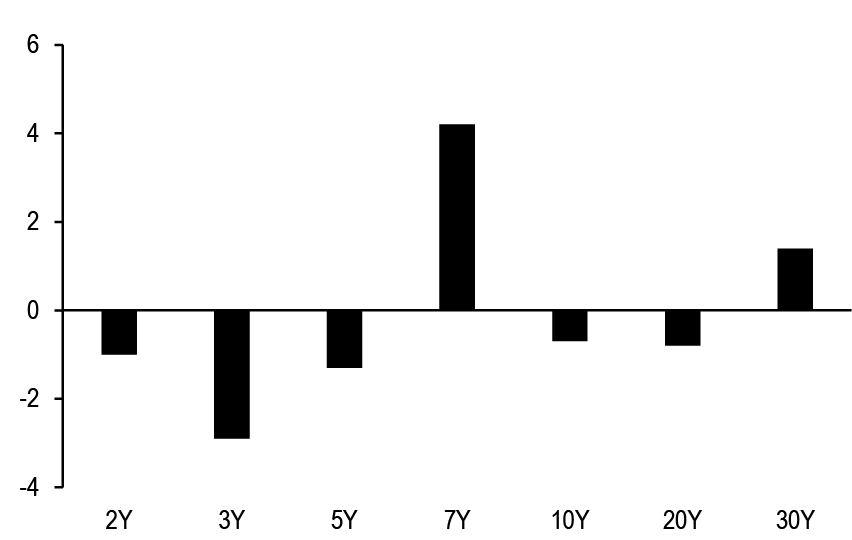
* Fair values are computed by adding our Term structure baseline swap spread values and our swap spread deviation relative to the term structure of swap spreads across each sector (see Term Funding Premium and the Term Structure of SOFR Swap Spreads for details)
Source: J.P. Morgan.
Figure 16: 7s/10s spread curve has the potential to asymmetrical steepen in the event of a flattening of the 7s/10s UST curve
7s/10s maturity matched swap spread curve, past 6m; bp
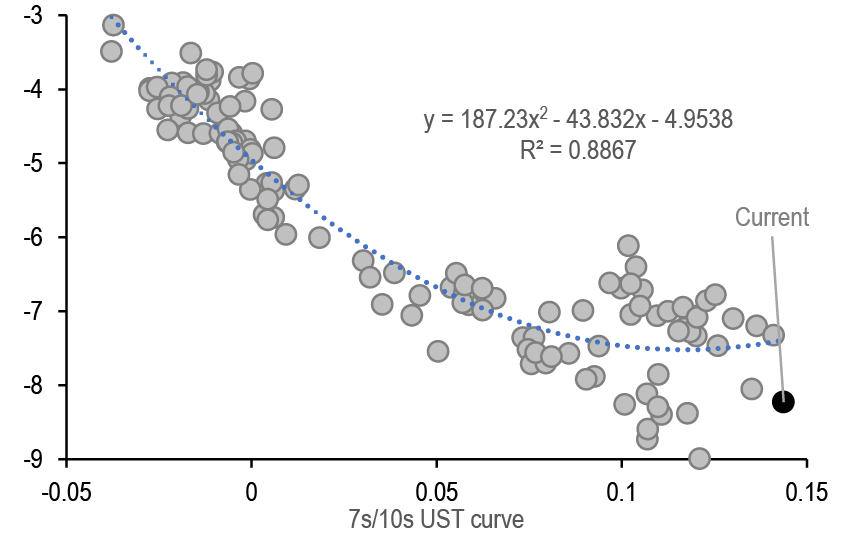
Source: J.P. Morgan.
Trading Recommendations
- Sell 6Mx10Y straddles versus buying 130% of the vega weight in 6Mx30Y straddles
Given that implied second-factor volatility has sharply fallen even as realized volatility has risen, we continue to recommend gaining long exposure to PC2 volatility. One attractive way to do this is to sell 6Mx10Y straddles versus 130% of the vega weight in 6Mx30Y straddles, where the vega weightings are designed to hedge out exposure to PC1 volatility while creating PC2 volatility exposure.
-Sell $100mn notional 6Mx10Y ATMF swaption straddles. (Notification date: 2025-03-27, swap tenor: 10Y, ATMF: 3.238%, strike: 3.238%, spot premium: 459.9bp per notional, forward premium: 470.0bp per notional, bpvol at inception: 6.23bp/day). Buy $58.6mn notional 6Mx30Y ATMF swaption straddles. (Notification date: 2025-03-27, swap tenor: 30Y, ATMF: 3.251%, strike: 3.251%, spot premium: 946.8bp per notional, forward premium: 967.4bp per notional, bpvol at inception: 5.78bp/day). This trade assumes active delta hedging every business day. - Buy 6Mx2Y swaption volatility versus selling a carry-neutral amount of 6Mx5Y swaption volatility
In a similar vein as above, this trade offers an attractive way to position for an increase in PC2 volatility. 2-year tails have a first component loading that is comparable to the loading on 5s, but it also has a numerically significant loading from the second principal component. In other words, the volatility of 2-year tails stems from the volatility of the first as well as second principal factors. Thus, a 2s/5s tail switch can be a way to create exposure to second-factor volatility, while shedding unwanted exposure to the first factor’s volatility.
-Buy $100mn notional 6Mx2Y ATMF swaption straddles. (Notification date: 2025-03-27, swap tenor: 2Y, ATMF: 3.025%, strike: 3.025%, spot premium: 119.4bp per notional, forward premium: 122.0bp per notional, bpvol at inception: 7.15bp/day). Sell $45mn notional 6Mx5Y ATMF swaption straddles. (Notification date: 2025-03-27, swap tenor: 5Y, ATMF: 3.078%, strike: 3.078%, spot premium: 264.0bp per notional, forward premium: 269.9bp per notional, bpvol at inception: 6.62bp/day). This trade assumes active delta hedging every business day. - Initiate 7Y maturity matched swap spread narrowers
While we are neutral on outright spreads on balance of risks, 7-year spreads stand out as being noticeably wide to fair value, and this could correct in coming weeks on the back of a pickup in issuance-related swapping as we move towards mid-October.
-Receive fixed in 3.625% Sep 30 2031 maturity matched SOFR swap spreads. Sell $100mn notional of the 3.625% Sep 30 2031 (yield: 3.604%, PVBP: $614.3/bp per mn notional), and receive fixed in $98.3mn notional of a maturity matched SOFR swap (coupon: 3.217%, PVBP: $624.6/bp per mn notional) at a swap spread of -38.7bp. - Initiate 7s/10s maturity matched swap spread curve steepeners
The 7s/10s maturity matched swap spread curve appears to offer asymmetric exposure to a flatter 7s/10s Treasury yield curve, given its propensity to steepen at an accelerating rate when the UST yield curve flattens. Moreover, the spread curve is currently too flat relative to its empirical relationship to the 7s/10s UST yield curve, making entry levels attractive.
-Receive fixed in 3.625% Sep 30 2031 maturity matched SOFR swap spreads. Sell $100mn notional of the 3.625% Sep 30 2031 (yield: 3.604%, PVBP: $614.3/bp per mn notional), and receive fixed in $98.3mn notional of a maturity matched SOFR swap (coupon: 3.22%, PVBP: $624.6/bp per mn notional) at a swap spread of -38.4bp.
-Pay fixed in 3.875% Aug 15 2034 maturity matched SOFR swap spreads. Buy $74.5mn notional of the 3.875% Aug 15 2034 (yield: 3.748%, PVBP: $824.1/bp per mn notional), and pay fixed in $72.9mn notional of a maturity matched SOFR swap (coupon: 3.285%, PVBP: $842.6/bp per mn notional) at a swap spread of -46.3bp. - Maintain Greens / 3Mx15Y flatteners (0.9:1.0 weighted)
P/L on this trade is currently 0.7bp. For original trade write up, see Fixed Income Markets Weekly 2024-09-20. - Maintain conditional exposure to a flatter 1s/5s swap yield curve (100:102 weighted) in a selloff using 3M expiry payer swaptions
P/L on this trade is currently 0.5bp. For original trade write up, see Fixed Income Markets Weekly 2024-09-20. - Maintain 2s/3s maturity matched swap spread curve flatteners
P/L on this trade is currently -0.5bp. For original trade write up, see Fixed Income Markets Weekly 2024-09-20. - Stay long 1Yx3Y straddles versus selling 105% of the vega risk in 1Yx10Y swaption straddles
P/L on this trade is currently -0.9abp. For original trade write up, see Fixed Income Markets Weekly 2024-09-20. - Maintain conditional exposure to a flatter 1s/3s swap yield curve in a selloff using 3M expiry payer swaptions
P/L on this trade is currently -5.2bp. For original trade write up, see Fixed Income Markets Weekly 2024-09-13. - Maintain conditional exposure to a steeper 2s/10s curve in a rally using 3M expiry receiver swaptions, financed by selling 24% risk-weighted receiver swaptions on 7-year tails
P/L on this trade is currently 0.7bp. For original trade write up, see Fixed Income Markets Weekly 2024-09-13. - Stay long 1Yx10Y swaption straddles on a delta hedged basis coupled with a weighted long in S&P 500 futures
P/L on this trade is currently -1.7abp. For original trade write up, see Fixed Income Markets Weekly 2024-09-13. - Maintain 3M fwd 2s/3s (1:1.1 weighted) swap yield curve flatteners
P/L on this trade is currently -3.7bp. For original trade write up, see Fixed Income Markets Weekly 2024-09-06. - Stay long 3Yx3Y versus short 10Yx10Y swaption straddles
P/L on this trade is currently -5abp. For original trade write up, see Fixed Income Markets Weekly 2024-09-06. - Maintain conditional exposure to a flatter 1s/7s swap yield curve in a selloff using 6M expiry payer swaptions
P/L on this trade is currently -6.2bp. For original trade write up, see Fixed Income Markets Weekly 2024-07-12. - Maintain 1:0.75 risk weighted 7s/10s maturity matched swap spread curve steepeners
P/L on this trade is currently -0.9bp. For original trade write up, see Fixed Income Markets Weekly 2024-05-31. - Continue to overweight 1Yx10Y straddles versus a gamma-neutral amount of 1Yx15Y straddles
P/L on this trade is currently -2.1abp. For original trade write up, see Fixed Income Markets Weekly 2024-05-03.
- Continue to overweight 6Mx5Y and 6Mx30Y swaption volatility (vega weights of 0.32 and 0.76, respectively) versus selling 6Mx10Y swaption volatility
P/L on this trade is currently -1.2abp. For original trade write up, see Fixed Income Markets Weekly 2024-04-05.
Closed trades over the past 12 months
P/L reported in bp of yield for swap spread, yield curve and misc. trades, and in annualized bp of volatility for option trades, unless otherwise specified
Note: trades reflect Thursday COB levels, and unwinds reflect Friday COB levels
| Trade | Entry | Exit | P/L |
| Spreads and basis | |||
| FV invoice spread wideners by buying FVZ3 and paying fixed in a forward starting swap |
9/8/2023 | 9/29/2023 | (2.2) |
| Initiate 10s/30s swap spread curve flatteners | 9/15/2023 | 10/13/2023 | 0.3 |
| 2Y spread narrowers | 10/13/2023 | 10/27/2023 | 1.2 |
| 5s/10s swap spread curve flatteners, paired with a 10% risk-weighted 5s/10s Treasury curve flattener | 10/13/2023 | 12/8/2023 | 1.2 |
| FV/UXY invoice spread curve flatteners , paired with a 10% risk-weighted FV/UXY Treasury futures curve flattener | 10/13/2023 | 12/8/2023 | 1.7 |
| Initiate swap spread narrowers in the 2Y sector | 11/3/2023 | 12/8/2023 | 3.9 |
| Initiate swap spread wideners in the 5Y sector | 11/3/2023 | 12/8/2023 | (3.2) |
| Initiate 20s/30s swap spread curve flatteners hedged with a 35% risk-weighted 20s/30s Treasury curve flattener | 9/29/2023 | 1/5/2024 | 0.2 |
| Initiate 3s/5s swap spread curve flatteners | 12/8/2023 | 1/5/2024 | 0.9 |
| Initiate swap spread wideners in the 5Y sector | 1/5/2024 | 1/19/2024 | 4.2 |
| Pay in 1.375% Nov ‘31 maturity matched swap spreads paired with 5% risk in 5s/10s OTR Treasury curve steepeners | 1/10/2024 | 1/26/2024 | 2.4 |
| Initiate 5s/30s swap spread curve flatteners | 12/15/2023 | 2/2/2024 | 3.8 |
| Initiate swap spread narrowers in the 30Y sector | 1/5/2024 | 2/2/2024 | 0.2 |
| Maintain a widening bias on swap spreads in the belly but switch to the 2.625% Feb 2029 issue | 1/19/2024 | 2/23/2024 | 2.4 |
| Maintain a widening bias on swap spreads in the belly using the 2.625% Feb 2029 issue, but hedge the narrowing risk from higher implied volatility with a long in 2Yx2Y swaption straddles | 1/19/2024 | 2/23/2024 | 2.7 |
| Initiate 2s/5s (100:60 weighted) maturity matched swap spread curve steepeners | 1/26/2024 | 2/23/2024 | (3.3) |
| Pay-fixed in 2.125% May ‘26 maturity matched swap spreads | 3/15/2024 | 3/22/2024 | 3.6 |
| Pay-fixed in 1.875% Jul ‘26 maturity matched swap spreads | 3/22/2024 | 4/5/2024 | 3.4 |
| Initiate 20s/30s 1.33:1 wtd maturity matched spread curve steepeners hedged with a 30% risk weighted 20s/30s steepener, but use an equi-notional blend of the Nov 53s and Aug 53s to create a synthetic approximate par bond in the 30Y leg | 2/23/2024 | 4/12/2024 | (2.5) |
| Initiate 30Y swap spread wideners | 3/15/2024 | 4/12/2024 | (0.1) |
| Pay in 4% Jan ‘27 maturity matched swap spreads | 4/5/2024 | 4/26/2024 | 2.2 |
| Initiate 10Y swap spread wideners using the Nov ‘33 issue | 3/8/2024 | 5/17/2024 | 0.9 |
| Initiate exposure to a steeper 7s/10s 1:0.75 weighted swap spread curve, and we recommend implementing the 7Y narrower leg with TYM4 invoice spreads | 5/10/2024 | 5/28/2024 | 0.3 |
| Initiate 1:0.9 risk weighted 20s/30s maturity matched swap spread curve steepeners | 5/31/2024 | 6/14/2024 | 3.9 |
| Initiate 5s/10s off-the-run swap spread curve steepeners (100:60 weighted) | 3/8/2024 | 7/12/2024 | (4.7) |
| Initiate 7s/10s swap spread curve steepeners paired with 25% risk in a 7s/10s UST curve steepener | 3/22/2024 | 7/12/2024 | (0.2) |
| Pay in Feb 2037 maturity matched swap spreads versus receiving in USU4 invoice spreads | 6/14/2024 | 7/12/2024 | 0.8 |
| Buy Feb 37s versus selling USU4 Futures | 6/14/2024 | 7/12/2024 | 2.7 |
| Pay-fixed in 1.875 Feb 2027 maturity matched swap spreads | 4/26/2024 | 7/26/2024 | (5.9) |
| Initiate 5s/30s spread curve flatteners | 5/3/2024 | 7/26/2024 | 5.1 |
| Pay-fixed in 4% Feb 2034 maturity matched swap spreads | 5/17/2024 | 7/26/2024 | (6.7) |
| Initiate 10s/30s swap spread curve flatteners | 7/26/2024 | 8/2/2024 | (0.8) |
| Initiate TU/TY invoice spread curve flatteners (1:0.35 weighted) | 6/7/2024 | 8/23/2024 | (6.3) |
| Pay-fixed in 4.625% Feb ‘26 maturity matched swap spreads | 5/31/2024 | 9/6/2024 | 0.3 |
| Pay-fixed in 4.375% Aug ‘28 maturity matched swap spreads | 5/31/2024 | 9/6/2024 | (1.8) |
| Initiate 10Y swap spread narrowers | 8/16/2024 | 9/6/2024 | 2.5 |
| Initiate 3s/7s swap spread curve flatteners | 8/16/2024 | 9/6/2024 | 1.4 |
| Initiate 0.875% June 2026 / 0.875% September 2026 swap spread curve flatteners | 8/16/2024 | 9/6/2024 | 1.3 |
| Initiate 5s/30s swap spread curve flatteners | 8/23/2024 | 9/6/2024 | (0.3) |
| Initiate 7s/20s weighted swap spread curve steepeners | 8/23/2024 | 9/20/2024 | 3.8 |
| Initiate 100:80 weighted 20s/30s maturity matched swap spread curve flatteners | 9/6/2024 | 9/20/2024 | 2.3 |
| Duration and curve | Entry | Exit | P/L |
| Initiate 3Y forward 2s/10s swap curve steepeners, paired with 1Y forward 1s/5s swap curve flatteners (33% risk weighted) | 09/22/23 | 09/29/23 | 5.0 |
| Initiate 2Y forward 2s/30s swap curve steepeners paired with equal risk in a 3M forward 2s/30s swap curve flattener | 08/25/23 | 10/20/23 | (32.1) |
| Initiate 3Y forward 3s/30s swap curve steepeners paired with 63% risk in a 3M forward 5s/30s swap curve flattener | 09/08/23 | 10/20/23 | (18.3) |
| Initiate M4/Z4 SOFR futures curve steepeners paired with 55% of the risk in H4/Z5 3M SOFR futures curve flatteners | 09/22/23 | 10/20/23 | (9.9) |
| Initiate conditional exposure to a flatter 2s/10s swap yield curve in a rally using 6M expiry receiver swaptions | 09/29/23 | 11/03/23 | (9.2) |
| Initiate 3M fwd 5s/10s swap curve flatteners paired with 2Y fwd 5s/10s swap curve steepeners (50:100 risk weighted) | 10/27/23 | 11/03/23 | 4.6 |
| Initiate conditional exposure to a flatter 5s/10s swap yield curve in a rally using 3M expiry receiver swaptions | 10/27/23 | 11/03/23 | 0.8 |
| Initiate 2Y fwd 2s/5s curve flatteners paired with 25% risk in a 1st/5th SOFR futures curve flattener | 11/03/23 | 11/22/23 | 5.8 |
| Initiate 6M fwd 5s/15s curve flatteners paired with equal risk in 3Y fwd 2s/15s steepeners | 11/03/23 | 11/22/23 | 4.6 |
| Buy the belly of a 40:65 weighted Z4/Z5/Z6 3M SOFR futures butterfly | 11/03/23 | 11/22/23 | 5.6 |
| Initiate 9M fwd 1s/10s flatteners paired with a 50% risk weighted long in March 2025 3M SOFR futures | 11/09/23 | 11/22/23 | 15.8 |
| Initiate 3Mx1Y / Greens weighted flattener (1:0.8 weighted) paired with 80% risk in a 3M forward 2s/10s swap curve steepener | 01/05/24 | 01/26/24 | 2.9 |
| Initiate U5/M6 SOFR futures curve flatteners paired with 110% of the risk in Z5/U6 3M SOFR futures curve steepeners | 12/15/23 | 02/02/24 | 1.6 |
| Buy the belly of a 35:65 weighted H5/H6/Z6 3M SOFR futures butterfly | 12/15/23 | 02/02/24 | 1.9 |
| Initiate 1Yx2Y / 3Mx30Y swap yield curve steepeners paired with 65% risk in a Reds / 10Yx5Y swap yield curve flattener | 01/19/24 | 02/02/24 | 1.1 |
| Receive fixed in the belly of a 6M forward 2s/7s/30s swap butterfly (40:69 weighted) | 01/19/24 | 02/02/24 | 0.1 |
| Initiate conditional exposure to a composite flattener in a selloff by buying 3Mx2Y payer swaptions (100% risk) versus selling 3Mx5Y and 3Mx30Y payer swaptions (24% and 100% risk respectively) | 02/02/24 | 02/23/24 | 14.3 |
| Buy H5 and Z5 3M SOFR futures contracts (30:100 weighted) versus selling U4 3M SOFR futures contracts (100% risk weight) and pay-fixed in 6M forward 10Y swaps (40% risk weight) | 02/09/24 | 02/23/24 | 5.8 |
| Initiate exposure to rising term premium by selling the belly of a 35/65 weighted 3M forward 5s/10s/15s butterfly | 12/08/23 | 03/08/24 | (1.5) |
| Initiate SFRM5 / Blues flatteners paired with a 110% risk weighted 3M forward 2s/10s steepener | 03/01/24 | 03/22/24 | 3.3 |
| Initiate 3M forward 3s/20s swap curve steepeners, paired with 85% of the risk in a SFRM5 / 3Mx10Y curve flattener | 03/08/24 | 04/05/24 | 3.2 |
| Initiate 2Y forward 2s/5s swap curve steepeners paired with 40% risk in 3M forward 2s/5s flatteners | 01/26/24 | 04/12/24 | (11.4) |
| Initiate conditional exposure to a flatter 2s/5s swap yield curve in a selloff using 3M expiry payer swaptions | 03/22/24 | 04/12/24 | 5.2 |
| Initiate conditional exposure to a flatter 18M/5Y swap yield curve in a selloff using 6M expiry payer swaptions | 04/05/24 | 04/12/24 | 3.1 |
| Initiate conditional exposure to a flatter 1s/5s swap yield curve in a selloff using 3M expiry payer swaptions | 02/23/24 | 04/26/24 | (9.4) |
| Initiate 1Y forward 2s/5s swap curve flatteners, paired with weighted longs in H5 and H6 3M SOFR futures (20% and 10% respectively) | 03/22/24 | 04/26/24 | (9.5) |
| Initiate SFRM5 / 3Mx5Y flattener, hedged with a 20% risk weighted long in Reds | 04/05/24 | 04/26/24 | (5.0) |
| Initiate 5th/9th SOFR futures curve flatteners hedged with a risk weighted amount 2Y forward 2s/5s swap curve steepeners | 04/12/24 | 05/03/24 | 3.0 |
| Receive in the belly of a 0.625/1.0/0.375 weighted 3M forward 2s/7s/20s swap butterfly, with an additional 15% risk weighted long in June 2024 3M SOFR futures | 02/23/24 | 05/17/24 | 2.7 |
| Initiate 3M forward 2s/3s swap curve flatteners hedged with a 14% risk weighted long in the M4 3M SOFR futures | 02/23/24 | 05/17/24 | 0.4 |
| Initiate 3M forward 5s/15s swap curve flatteners paired with 70% risk in a 2Y forward 2s/20s swap curve steepener | 03/22/24 | 05/17/24 | 2.8 |
| Buy the belly of a 2s/5s/15s weighted swap butterfly (50:50 weighted) | 04/12/24 | 05/17/24 | 2.4 |
| Initiate 3M forward 1s/3s swap curve flatteners, hedged with a 65% risk weighted long in the 3Mx3M sector and a 25% risk weighted short in the 15Mx3M sector | 05/03/24 | 05/17/24 | 2.1 |
| Buy the belly of a U5/M6/H7 SOFR Futures butterfly (-0.37:1:-0.63 risk weighted) | 03/01/24 | 05/31/24 | (0.7) |
| Initiate a Greens/Blues steepener paired with 55% of the risk in a SFRM5 / 3Mx5Y swap curve flattener | 03/15/24 | 05/31/24 | 2.2 |
| Buy the belly of a Z5/U6/H7 3M SOFR futures butterfly (-0.33:1.0:-0.67 risk weighted) | 04/19/24 | 05/31/24 | 1.8 |
| Initiate 12Mx3M / 3Mx10Y flatteners, paired with 33% risk in a 3Mx2Y receive fixed swap | 05/17/24 | 06/06/24 | 5.7 |
| Initiate 3M fwd 3s/15s flatteners paired with 85% risk in 2Y fwd 3s/30s steepeners | 05/17/24 | 06/06/24 | 4.5 |
| Initiate 3Mx1Y / 2Yx1Y forward swap curve flatteners as a bullish proxy | 05/31/24 | 06/06/24 | 11.5 |
| Initiate 3Mx1Y / 2Yx1Y swap curve flatteners paired with 45% risk-weighted pay-fixed positions in 3Mx5Y swaps | 05/31/24 | 06/06/24 | 0.0 |
| Initiate conditional exposure to a flatter 1s/2s swap yield curve in a rally using 1Y expiry receiver swaptions | 04/05/24 | 06/14/24 | 4.0 |
| Initiate Z5/U6 SOFR futures flatteners paired with H6/Z6 SOFR futures steepeners (0.85:1 risk weighted) | 03/01/24 | 07/12/24 | 1.8 |
| Initiate conditional exposure to a steeper 10s/20s swap yield curve in a selloff using 9M expiry payer swaptions | 03/15/24 | 07/12/24 | 4.0 |
| Initiate 3M forward 10s/15s swap curve steepeners paired with 25% risk in 3M forward 3s/7s flatteners | 04/26/24 | 07/12/24 | 3.5 |
| Initiate 3M forward 10s/30s steepeners (1:1.5 risk weighted) paired with M5/Z5 3M SOFR futures flatteners | 06/07/24 | 07/12/24 | 2.9 |
| Initiate 15Mx3M / 1YX1Y forward swap curve flatteners, paired with 20% of the risk in a long in 18Mx3M and a 24% risk weighted short in 3Mx5Y forward swaps | 05/03/24 | 08/02/24 | (1.3) |
| Receive in 3Mx3Y and 3Mx5Y swaps versus paying in 3Yx1Y and 12Mx3M swaps | 06/14/24 | 08/02/24 | (8.8) |
| Initiate a synthetic 6M forward 2s/10s swap curve steepener, constructed by replacing the 2Y leg with a 6Mx3M / 18Mx3M flattener | 07/12/24 | 08/02/24 | (28.9) |
| Initiate a synthetic 3M forward 5s/30s swap curve steepener, constructed by replacing the 5Y leg with a 3Mx3M / 3Mx2Y flattener | 07/26/24 | 08/02/24 | (18.1) |
| Initiate conditional exposure to a flatter 1s/2s swap yield curve in a rally using 6M expiry receiver swaptions | 07/26/24 | 08/02/24 | (8.8) |
| Options | Entry | Exit | P/L |
| Sell 2Yx2Y swaption straddles versus buying a vega-neutral amount of 1Yx10Y swaption straddles | 08/25/23 | 09/29/23 | 3.4 |
| Buy 1Yx10Y straddles versus selling 140% of the vega risk in 1Yx5Y straddles and buying 50% of the risk in 1Yx2Y swaption straddles | 08/25/23 | 10/13/23 | 3.2 |
| Sell 2Yx30Y swaption straddles versus buying a vega-neutral amount of 10Yx10Y swaption straddles | 09/08/23 | 10/13/23 | (4.5) |
| Sell 2Yx2Y swaption straddles versus buying a vega-neutral amount of 7Yx10Y swaption straddles | 09/15/23 | 10/13/23 | 3.0 |
| Sell 6Mx30Y swaption straddles with a pay fixed swap overlay | 09/22/23 | 10/13/23 | (11.6) |
| Sell 1Yx30Y swaptions straddles versus buying a vega-neutral amount of 5Yx30Y swaption straddles, paired with a 1Yx30Y pay-fix swap | 09/22/23 | 10/13/23 | (1.5) |
| Overweight 6Mx7Y swaption volatility versus a vega-neutral amount of 1Yx10Y swaption volatility | 10/13/23 | 11/03/23 | 3.5 |
| Buy 1Yx10Y swaption straddles paired with a receive-fixed swap overlay to hedge against a decrease in implieds due to lower yields | 10/27/23 | 11/03/23 | (1.1) |
| Initiate short gamma exposure in the 6Mx30Y sector | 11/03/23 | 12/08/23 | 7.9 |
| Sell 6Mx30Y swaption straddles versus buying a vega-neutral amount of 1Yx30Y swaption straddles | 11/03/23 | 12/08/23 | 0.4 |
| Initiate long gamma exposure in the 1Yx10Y sector | 12/08/23 | 02/23/24 | (2.1) |
| Initiate long exposure to 2Yx2Y volatility with a suitably weighted short in July Fed funds futures to hedge the downside risk from a fall in Fed-easing expectations | 01/05/24 | 02/23/24 | 2.6 |
| Overweight 2Yx2Y swaption straddles versus a vega-neutral amount of 5Yx5Y swaption straddles | 01/19/24 | 02/23/24 | 3.2 |
| Overweight 6Mx10Y swaption straddles versus selling 110% of the vega risk in 1Yx10Y swaption straddles | 01/26/24 | 02/23/24 | 1.3 |
| Buy 6Mx10Y straddles | 03/01/24 | 03/08/24 | (6.6) |
| Initiate longs in 6Mx10Y swaption implied volatility, delta hedged daily | 03/15/24 | 03/22/24 | (5.1) |
| Overweight 6Mx2Y swaption straddles versus a theta-neutral amount of 6Mx5Y swaption straddles | 01/19/24 | 04/12/24 | (8.8) |
| Sell 2Yx30Y swaption volatility versus buying 50% of the vega risk in 2Yx2Y swaption volatility , and pay fixed in 2Yx 10Y swaps to neutralize the bullish bias in this trade | 02/23/24 | 04/12/24 | 1.5 |
| Buy 6Mx10Y volatility versus 6M forward 6Mx10Y volatility, synthetically constructed via suitably weighted 1Yx10Y and 6Mx10Y swaptions | 04/05/24 | 04/12/24 | 3.2 |
| Buy 2Yx5Y swaption straddles on a delta hedged basis | 04/12/24 | 04/19/24 | 1.0 |
| Sell 6Mx10Y straddles on a delta hedged basis | 04/26/24 | 05/03/24 | 3.1 |
| Sell 6Mx15Y straddles on a delta hedged basis | 05/03/24 | 05/10/24 | (1.6) |
| Sell 1Yx2Y volatility versus buying a theta neutral amount of 1Yx5Y volatility | 05/17/24 | 06/06/24 | 0.6 |
| Initiate Fronts/Green curve flatteners, paired with delta hedged long volatility positions in the 1Yx10Y swaption sector | 05/31/24 | 06/06/24 | 5.6 |
| Initiate exposure to long curve volatility by buying 6Mx2Y and 6Mx10Y straddles (41:60 vega weighted) versus selling 6Mx5Y straddles | 12/08/23 | 06/07/24 | 1.1 |
| Buy 2Yx5Y swaption straddles on a delta hedged basis, versus 6Mx1Y / 18Mx1Y flatteners | 06/07/24 | 06/14/24 | 3.6 |
| Initiate outright shorts in 3Yx30Y swaption implied volatility, but delta hedge monthly or if rates move by over 25bp in either direction since the last delta hedge | 03/08/24 | 07/12/24 | (5.0) |
| Buy 1Yx30Y volatility versus 1Y forward 1Yx30Y volatility, synthetically constructed via suitably weighted 2Yx30Y and 1Yx30Y swaptions | 03/15/24 | 07/12/24 | (2.5) |
| Buy 65% risk weighted 1Yx10Y swaption volatility versus selling 1Y forward 2Yx10Y swaption volatility, synthetically constructed via suitably weighted 1Yx10Y and 3Yx10Y swaptions | 04/12/24 | 07/12/24 | (4.4) |
| Sell 6Mx10Y swaption straddles on a delta hedged basis, paired with a short position in Greens | 06/14/24 | 07/12/24 | 2.2 |
| Buy 1Yx5Y straddles versus selling vega-neutral amount of 5Yx5Y straddles | 07/12/24 | 08/02/24 | 4.7 |
| Buy A+100 1Yx5Y payer swaptions and sell A-100 1Yx5Y receiver swaptions, delta-hedged daily, to position for a correction in skew | 04/19/24 | 08/23/24 | (8.5) |
| Buy 6Mx5Y swaption straddles versus selling 150% of the vega risk in 6Mx30Y straddles | 07/12/24 | 09/13/24 | 2.2 |
| Initiate longs in 6Mx5Y swaption implied volatility on an outright basis, delta hedged daily | 08/02/24 | 09/13/24 | (8.5) |
| Others | Entry | Exit | P/L |
| Position for a widening in WN calendar spreads | 11/9/2023 | 11/22/2023 | 1.8 |
| Buy the USZ3/USH4 weighted calendar spread hedged with USZ3/WNZ3 Treasury futures curve flatteners | 11/9/2023 | 11/22/2023 | 0.2 |
| Position for a narrowing in FV calendar spreads | 11/9/2023 | 11/22/2023 | 0.3 |
| WN calendar spreads narrowers | 2/13/2024 | 2/23/2024 | (0.7) |
| UXY calendar spreads narrowers | 2/13/2024 | 2/23/2024 | (0.8) |
| TU calendar spreads narrowers | 2/13/2024 | 2/23/2024 | (0.3) |
| Sell the 4.75% Nov 2053 WNM4 basis, versus buying payer swaptions | 3/8/2024 | 4/12/2024 | 1.0 |
| Initiate calendar spread wideners in US Futures | 5/17/2024 | 5/28/2024 | (3.0) |
| Initiate calendar spread narrowers in UXY Futures | 5/17/2024 | 5/28/2024 | 0.4 |
| Initiate calendar spread narrowers in FV futures | 5/17/2024 | 5/28/2024 | 1.0 |
| Initiate calendar spread wideners in US Futures | 8/16/2024 | 8/23/2024 | (0.8) |
| Initiate calendar spread narrowers in FV Futures | 8/16/2024 | 8/23/2024 | (0.1) |
| Buy the USZ4 factor-weighted CTD basis | 9/13/2024 | 9/20/2024 | 2.4 |
| Buy the WNZ4 factor-weighted CTD basis | 9/13/2024 | 9/20/2024 | 1.0 |
| Total number of trades | 139 | ||
| Number of winners | 91 | ||
| Hit rate | 65% |
Japan
Steering through the market after the LDP leadership election
- The JPY swap and JGB curves bullishly steepened this week (as of 3 p.m. JST).
- Next week, the BoJ is set to announce the Rinban amounts for the October-December period. The gross monthly Rinban amount will be reduced by JPY400bn, down from JPY5.31tn. We believe there is a higher likelihood that the BoJ will choose to reduce Rinban purchases in the 3-5Y and 5-10Y buckets.
- Moving to the main event of the week—the ruling party LDP leadership election—former Secretary-General Shigeru Ishiba was elected as the new LDP president. In terms of policy, while Minister of State for Economic Security Takaichi has publicly opposed rate hikes and advocated for strategic fiscal spending, Ishiba has not clearly indicated his stance on economic policy during the leadership election. However, we believe Ishiba will not deviate significantly from the Kishida administration’s economic agenda. Additionally, he appears to be open-minded regarding BoJ rate hikes.
- Turning to market developments, investors appeared to be particularly attentive to the potential risks of a derailed BoJ normalization path and increased fiscal sustainability concerns in the event of a Takaichi administration. Conversations we have had with our clients leading up to the election also suggested that market participants were heavily focused on the risk of a Takaichi win. Consequently, it is not surprising to us that BoJ policy expectations receded materially, and the JPY swap and JGB curves bullishly steepened over the recent weeks. We expect the market to unwind the recent moves in coming days.
- On the curve, we would not be surprised if the 2s/30s and 10s/30s swap curves retrace back to early September levels, implying a flattening move of around 5bp.
- On delta, given that yields have likely declined on expectations of a Takaichi win, we believe the market will retrace yields higher in coming days. However, once the dust settles, we foresee that Treasury yields will be the primary driver of the JPY rates market for the foreseeable future.
- That said, on balance, we have a modest bearish bias on duration, considering where valuations and positioning stand. While we do not think it is attractive to express this view right now, if JPY rates rally measurably and continue to diverge from their fundamental drivers, we would consider entering bearish positions, barring any significant economic changes that would prompt the BoJ to end its normalization process.
- From a cross-asset perspective, USD/JPY has dropped back to around 143.00 after the election result was announced. Moreover, Nikkei futures have declined by more than 4% in the evening session as of 6:30 p.m. JST. All else equal, the appreciation of the JPY and the underperformance of equities indicate cash outflows from domestic bonds as public pension funds, such as GPIF, conduct mechanical and frequent rebalancing to maintain the target portfolio weights for each asset class. We will remain vigilant regarding dynamics around rebalancing.
Market view
The JPY swap and JGB curves bullishly steepened this week ( Figure 92; as of 3 p.m. JST). However, it is worth noting that the result of the runoff of the LDP leadership election came out after the market close (discussed later). Earlier this week, Governor Ueda’s less-hawkish-than-expected press conference last Friday drove yields lower, led by the front end ( Figure 93). Additionally, on Monday, Minister of State for Economic Security Takaichi made a strong statement against the BoJ’s rate hike. She also criticized a planned tax increase to fund extra defense spending as well as the government’s goal of achieving a primary balance surplus by FY2025, clearly indicating a stance towards fiscal expansion. Her remarks exerted bull steepening pressure on JPY rates. The steepening trend faced a temporary halt on Wednesday as the Rinban result for the 10-25Y sector was stronger than expectations. The 40-year auction on Thursday was in line with expectations, but the market failed to flatten the curve on the day.
Next week, the BoJ is set to announce the Rinban amounts for the October-December period. The gross monthly Rinban amount will be reduced by JPY400bn, down from JPY5.31tn. We believe there is a higher likelihood that the BoJ will choose to reduce Rinban purchases in the 3-5Y and 5-10Y buckets, as these categories have a higher percentage of gross Rinban relative to auction supply. In our view, the BoJ will likely refrain from cutting Rinban purchases in the super-long end this time around, opting to wait for the MoF to finalize its new issuance plan, which we continue to expect to be delivered next year.
Additionally, the Summary of Opinions from the September Monetary Policy Meeting (MPM) will be released on Tuesday, and Board Member Noguchi is scheduled to speak on Thursday. On the supply front, the 2-year and 10-year JGB auctions are set for Monday and Thursday, respectively. The 10-year auction will serve as a litmus test to determine whether the reconfirmation of inherent vulnerability in the super-long sector will have a sustained impact on investor behavior. Last week, we argued that banks might avoid using 10Y+ JGBs as instruments to earn carry and instead move down the curve to the long sector, contrary to recent activity. The auction results should provide some insights into this behavior.
Figure 92: JPY swap and JGB curves bullishly steepened this week
Change in yields between September 20 and September 27 (bp)
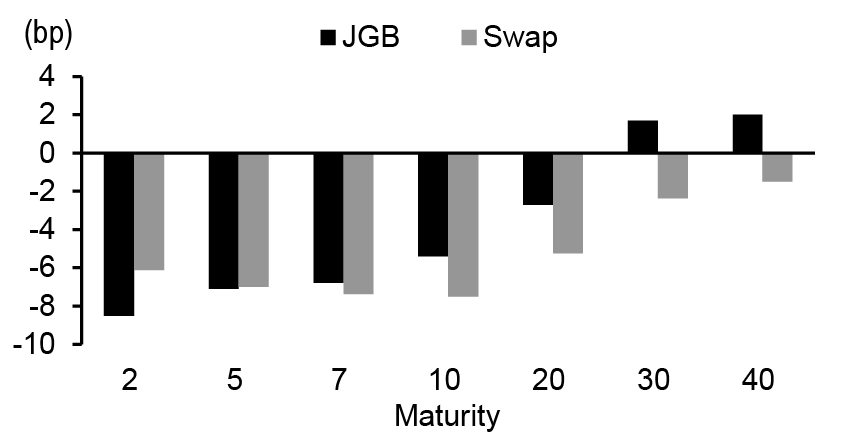
Source: J.P. Morgan. * As of 3 p.m. JST.
Figure 93: BoJ policy rate expectations receded materially this week
BoJ policy rate outlook based on OIS market expectations (TONAR)
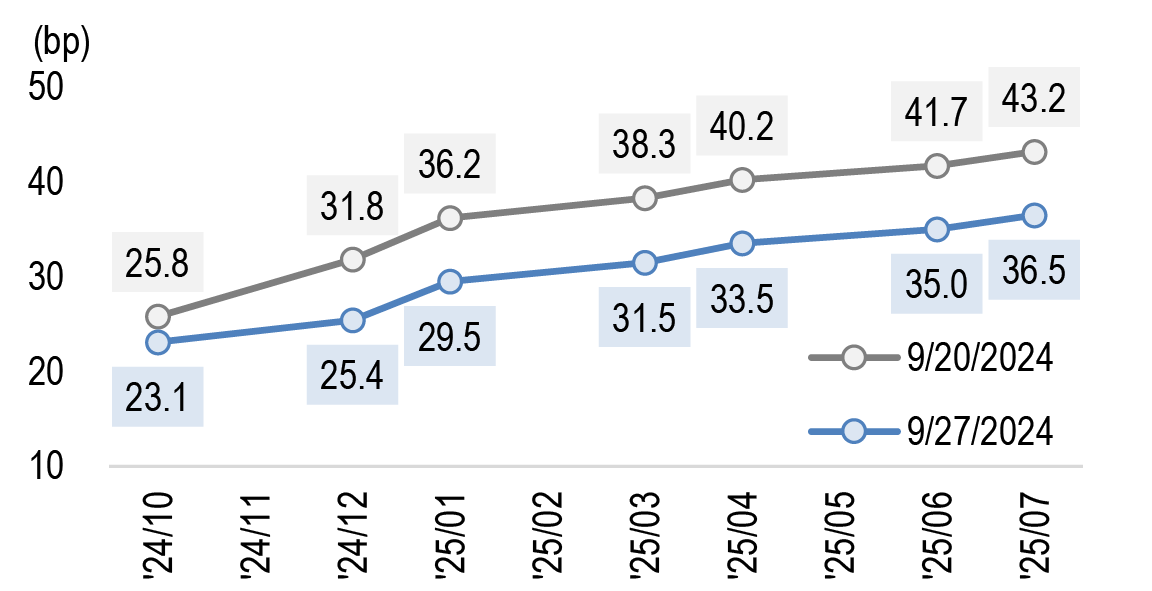
Source: J.P. Morgan. * As of 3 p.m. JST.
Moving to the main event of the week—the ruling party LDP leadership election—former Secretary-General Shigeru Ishiba was elected as the new LDP president ( Figure 94). He is set to become Prime Minister next week.
Figure 94: Former Secretary-General Ishiba won the LDP leadership election
2024 LDP leadership election results
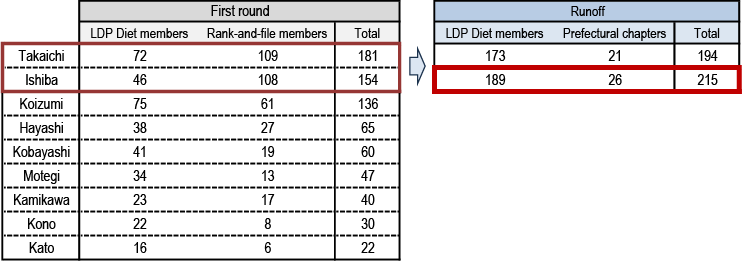
Source: NHK, J.P. Morgan.
In terms of policy, while Takaichi has publicly opposed rate hikes and advocated for strategic fiscal spending, Ishiba has not clearly indicated his stance on economic policy during the leadership election ( Figure 95). However, we believe Ishiba will not deviate significantly from the Kishida administration’s economic agenda. Additionally, he appears to be open-minded regarding BoJ rate hikes.
Figure 95: While Takaichi has publicly opposed rate hikes and advocated for strategic fiscal spending, Ishiba has not clearly indicated his stance on economic policy during the leadership election
Remarks on economic policy by Ishiba and Takaichi

Source: NHK, Bloomberg Finance L.P., J.P. Morgan.
Turning to market developments, investors appeared to be particularly attentive to the potential risks of a derailed BoJ normalization path and increased fiscal sustainability concerns in the event of a Takaichi administration. Conversations we have had with our clients leading up to the election also suggested that market participants were heavily focused on the risk of a Takaichi win. Consequently, it is not surprising that BoJ policy expectations receded materially, and the JPY swap and JGB curves bullishly steepened over the recent weeks. We expect the market to unwind the recent moves in coming days.
On the curve, both the JGB and JPY swap curves have steepened since mid-September ( Figure 96 and Figure 97). Historically, the 10s/30s JGB curve has struggled to stay above the 120bp handle, and given receding fiscal concerns, we believe it will flatten back. Similarly, the front end of the JGB curve appears very rich, suggesting that the 2s/30s curve should retrace some of the recent price action. In the swap space, the steepening trend was even more pronounced. We would not be surprised if the 2s/30s and 10s/30s swap curves retrace back to early September levels, implying a flattening move of around 5bp.
Figure 96: Curves have steepened since mid-September...
Cash: 2s/30s JGB curve (left) and 10s/30s JGB curve (right) (bp)
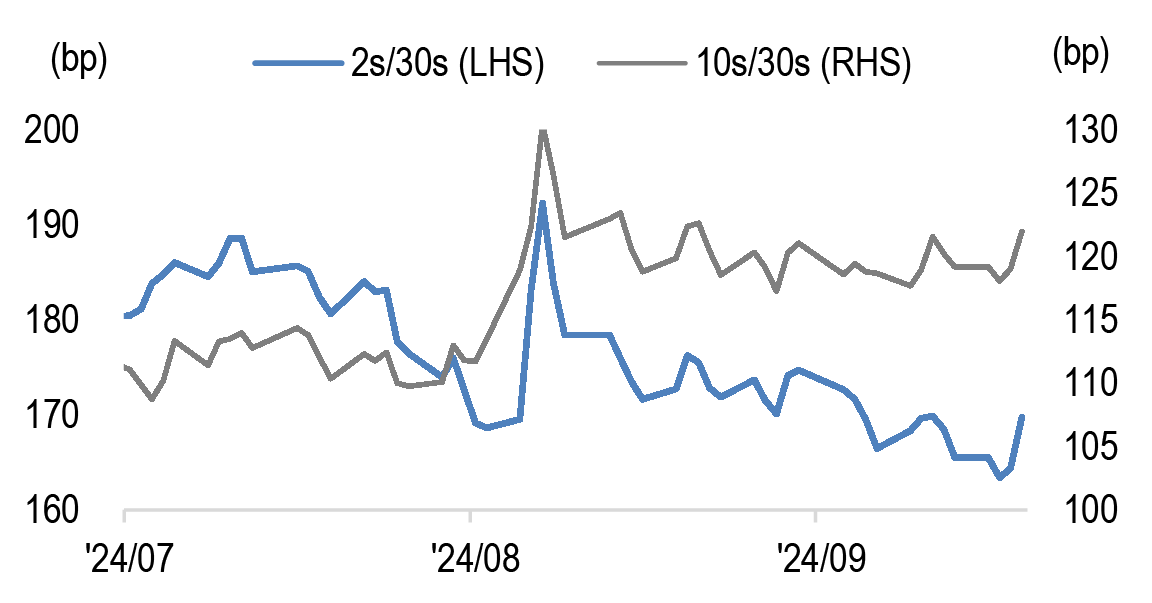
Source: J.P. Morgan.
Figure 97: ...but the move was even more pronounced in the swap space
Swap: 2s/30s swap curve (left) and 10s/30s swap curve (right) (bp)
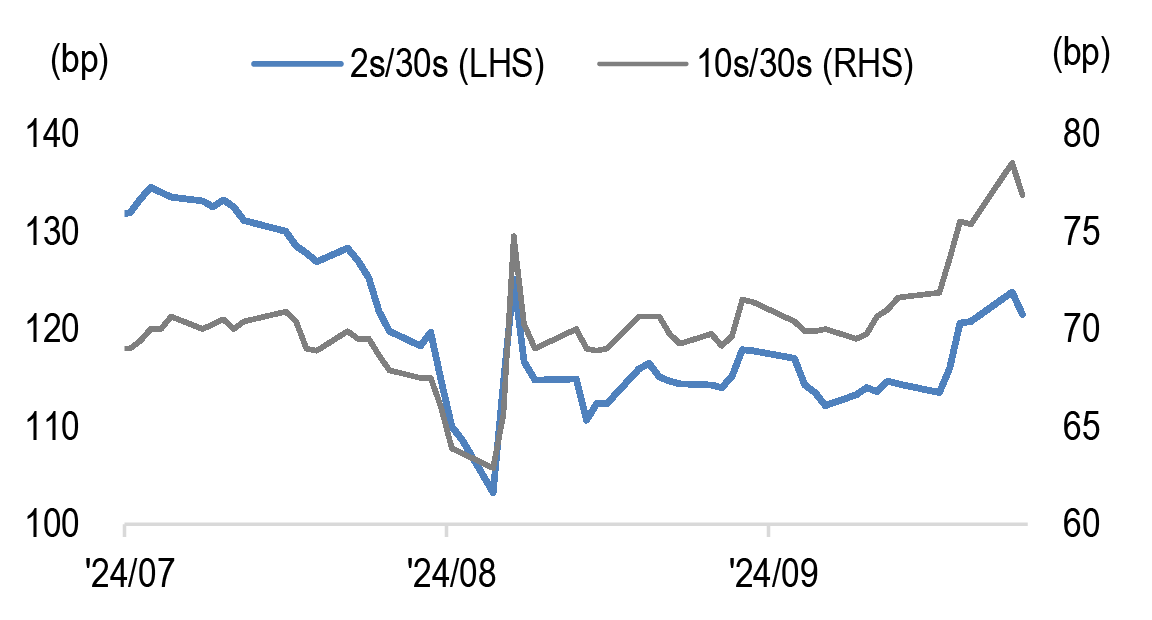
Source: J.P. Morgan.
On delta, given that yields have likely declined on expectations of a Takaichi win, we believe the market will retrace yields higher in coming days. However, once the dust settles, we foresee that Treasury yields will be the primary driver of the JPY rates market for the foreseeable future. As we have argued for some time, we do not anticipate the market will begin pricing in rate hike expectations in the next couple of months.
That said, on balance, we have a modest bearish bias on duration. Considering where valuations stand, some tenors appear to be on the richer end of the spectrum ( Figure 98). While we do not think it is attractive to express this view right now, given the near-term release of the September US NFP report, if JPY rates rally measurably (for example, if the 10-year JGB yield falls below 80bp) and continue to diverge from their fundamental drivers, we would consider entering bearish positions, barring any significant economic changes that would prompt the BoJ to end its normalization process.
At the very front end of the curve, our house view continues to anticipate a 25bp hike in December. We believe the Japanese rates space is meaningfully underpriced and expect repricing to occur down the road. However, in our view, it is not attractive to express repricing expectations now. Unless economic conditions change drastically, we would consider paying 1Yx1Y when it dips a few basis points below 50bp, but the upside of continuing to pay 1Yx1Y around 55bp is limited at this moment ( Figure 99).
Our modest bearish take on duration should be supported by positioning. Although there may be specific tenors with skewed positioning, short positions held by foreign investors in the cash space appear much smaller compared to early August ( Figure 100). In a similar vein, the outstanding balance of the BoJ’s Securities Lending Facility also remains at low levels, suggesting that the size of shorts in the market is much smaller. In the JGB futures space, foreigners’ positioning seems more or less neutral ( Figure 101). Therefore, we think the risk of a large short squeeze is lower than before.
Figure 98: Considering where valuations stand, on balance, we have a modest bearish bias on duration
Residual of our 10-year JGB model* (bp)
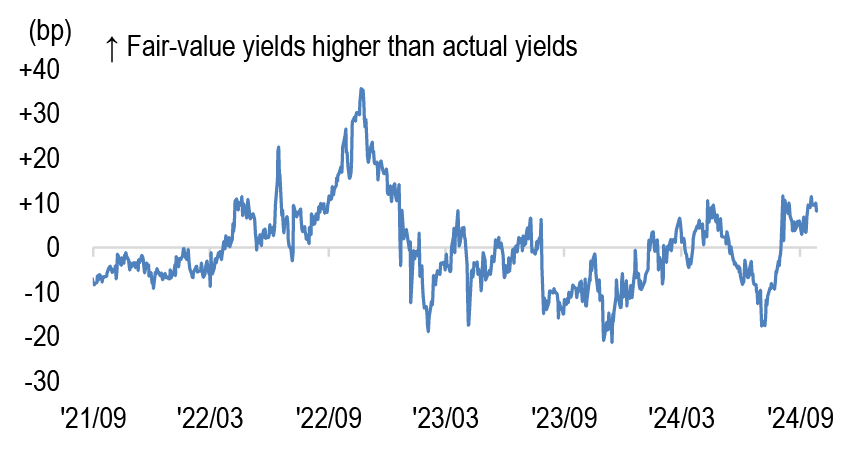
Source: BoJ, MoF, Bloomberg Finance L.P., J.P. Morgan estimates. *10-year JGB yields regressed on 3Mx3M JPY OIS (%), 10-year Treasury yields (%), and BoJ share of the three most recently issued 10-year JGBs outstanding (%); regression over the last 3 years. R-squared = 89.7%, S.E. = 9.5bp.
Figure 99: We would consider paying 1Yx1Y when it dips a few basis points below 50bp
Forward swap rates (%)
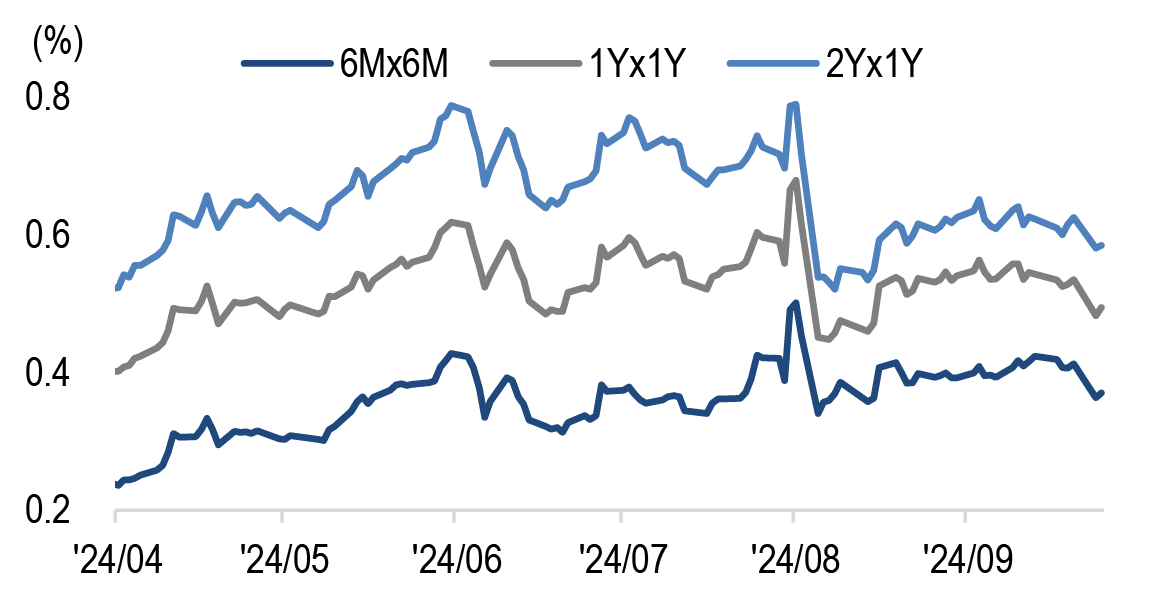
Source: J.P. Morgan.
Figure 100: Short positions held by foreign investors in the cash space appear much smaller compared to early August
Cash market: Weekly foreign investors’ net flows into long-term domestic bonds (JPY tn) (January 2023 = 0) (latest data point as of September 20)
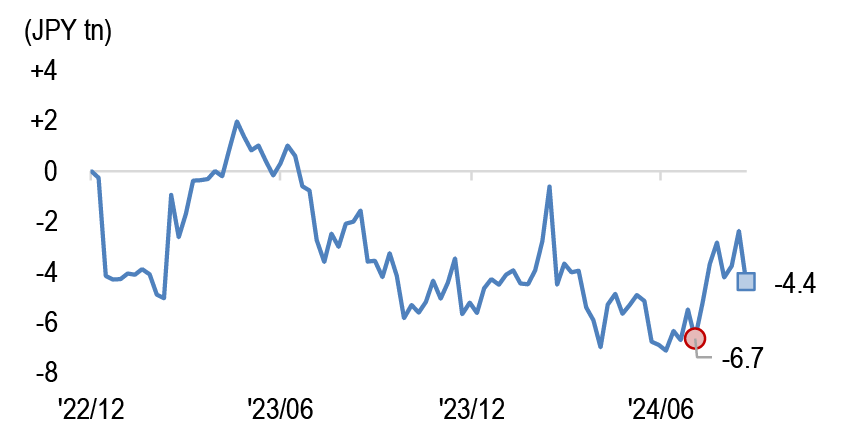
Source: MoF, J.P. Morgan.
Figure 101: Foreigners’ positioning in the futures market seems more or less neutral
JGB futures market: Foreign investors’ net position (JPM estimate) (latest data point as of September 20)
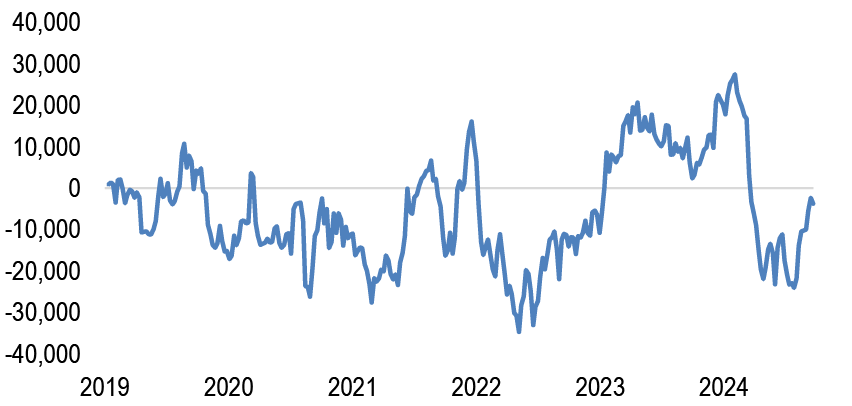
Source: JPX, J.P. Morgan estimates. * We arbitrarily set January 2019 as the base point.
From a cross-asset perspective, USD/JPY has dropped back to around 143.00 after the election result was announced. Moreover, Nikkei futures have declined by more than 4% in the evening session as of 6:30 p.m. JST ( Figure 102). All else equal, the appreciation of the JPY and the underperformance of equities indicate cash outflows from domestic bonds as public pension funds, such as GPIF, conduct mechanical and frequent rebalancing to maintain the target portfolio weights for each asset class ( Figure 103). Needless to say, JGB yields are likely to rise, so it is challenging to estimate rebalancing flows. We have previously noted that these cash outflows from domestic bonds are expected to have a more adverse impact on the super-long end sector, given its inherent vulnerability in supply-demand dynamics. We will remain vigilant regarding dynamics around rebalancing.
Figure 102: USD/JPY moved lower than Nikkei futures dropped after the announcement of the LDP leadership election
USD/JPY (LHS) and Nikkei futures (OSE) (RHS)
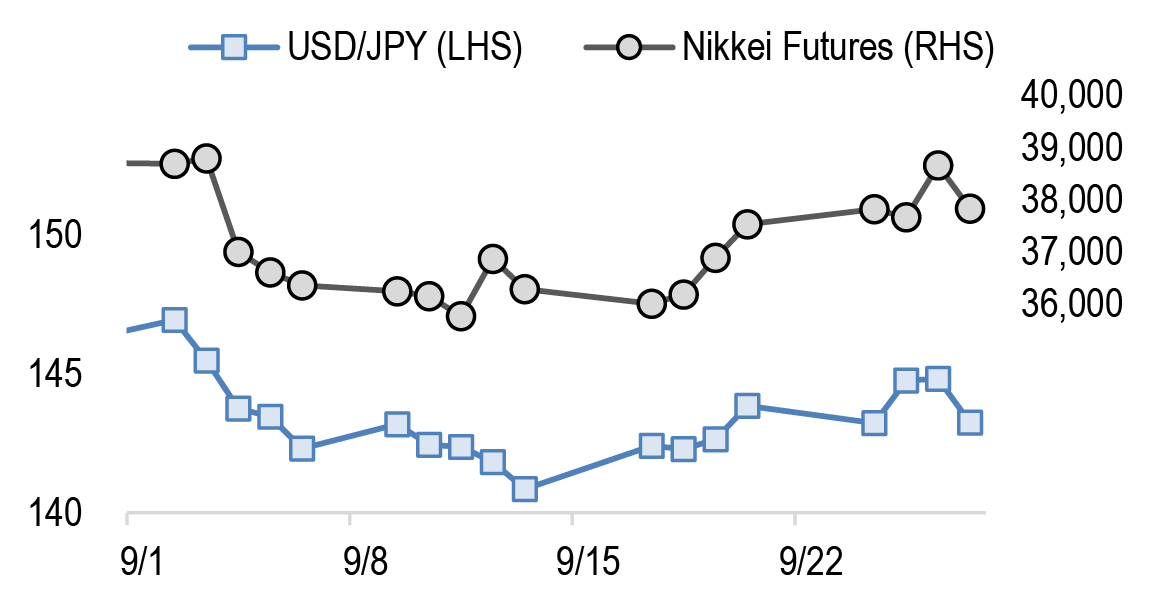
Source: Bloomberg Finance L.P., J.P. Morgan. * As of 5 p.m. JST.
Figure 103: All else equal, the appreciation of the JPY and the underperformance of equities point to cash outflows from domestic bonds
Performance of major index for each asset class (all denominated in JPY) (unitless unless otherwise stated)
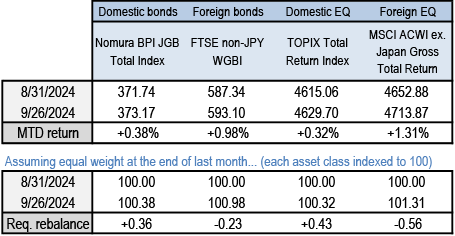
Source: Bloomberg Finance L.P., J.P. Morgan.
Trade recommendations
- 10Y swap spread narrower
Receive 10Y swap (JSCC) @ 0.940% vs. Short 10Y JB375 (maturity: 20 June 2034) @ 0.960%. P/L since inception is -2.5bp (recommended 2 August 2024) - 2s/10s JGB curve flattener
Long JPY10.0bn of 10Y JB374 (maturity: 20 March 2034) @ 0.860% vs. Short JPY48.5bn of 2Y JN459 (maturity: 1 April 2026) @ 0.275%. P/L since inception is +7.5bp (recommended 12 April 2024)
Figure 104: Closed trades in last 12 months
P/L reported in bp of yield unless otherwise indicated
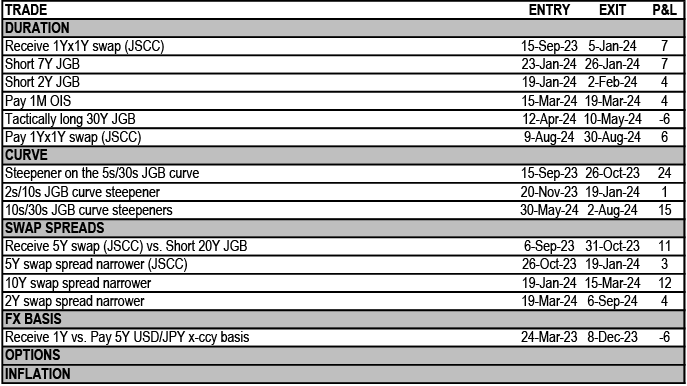
Source: J.P. Morgan.
Australia & New Zealand
Protesting, but not that much
- The RBA this week struck a balance: the board will ease on its own timeline and is not confident yet on inflation, but nevertheless appeared less dismissive of cuts overall
- AUD curve shape remains somewhat unusual with backloaded easing, and a sharp V-shaped forward structure from 2Yx1Y on
- We expect this to be resolved by steeper 1s/2s relatively soon, as either cuts have to be brought forward, or the reds are prone to cheapen on global dynamics
- Monthly CPI was softer and while it is overstating progress to the target, the fear factor around inflation is gone and works against breakevens; stop out of the long in the 2025 ACGBi BEI
- NZ yields have extended to new range lows; with the data having improved while current pricing implies a rapid shift to accommodative territory, pay 2Y NZD IRS
- The AUD funding complex is settling into its post-TFF equilibrium
- Local banks’ liquidity preference and funding activity to preserve LCR ratios are keeping intra-market bases elevated...
- ...and this helps anchor the front-end of the BBSW-SOFR curve
- Meanwhile, Kanga flows are fading as is their beta to 10Y basis, suggesting issuers are stepping back; pay 5s/10s BBSW-SOFR basis
- Trade portfolio: Pay 2Y NZD IRS. Stay paid AUD 1s/2s IRS, but close the long in 2025 ACGB BEI. Open a 5s/10s BBSW-SOFR steepener
Front-end Update: RBA takes a step toward easing, NZ cut pricing has overshot
The RBA took a balanced approach this week. As expected, the statement and Governor Bullock’s press conference pushed back on the idea that Fed cuts, and technical achievement of the inflation target in monthly CPI are sufficient to start their easing own easing cycle. However, the language still showed some evolution, becoming less strident about being on hold for the remainder of the year. The market has been happy to challenge RBA guidance and price a first cut by December, though the front-end rally nevertheless stalled a little this week ( Figure 105) reflecting global developments.
Figure 105: The front-end rally lost a little steam this week
AUD OIS _x1m forward yields, Bp weekly change and net over period.
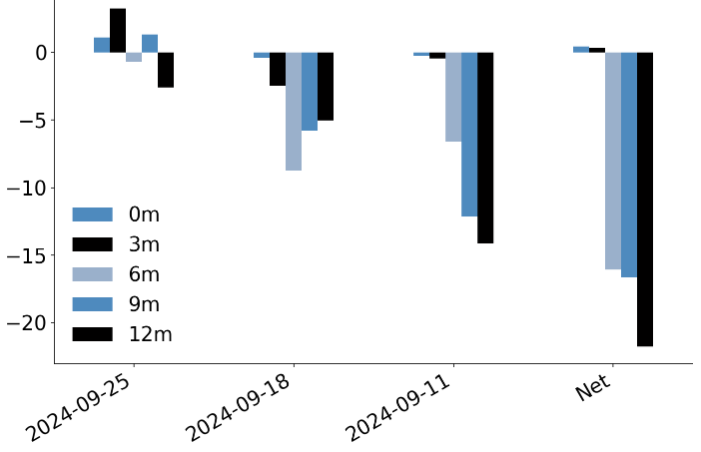
Source: J.P. Morgan.
Figure 106: Backloaded easing is matched by V shaped forwards beyond, which leaves 2s/5s unusually steep
X axis: AUD 1Y/1Yx1Y IRS (Bp); Y axis: AUD 2s/5s IRS (Bp)
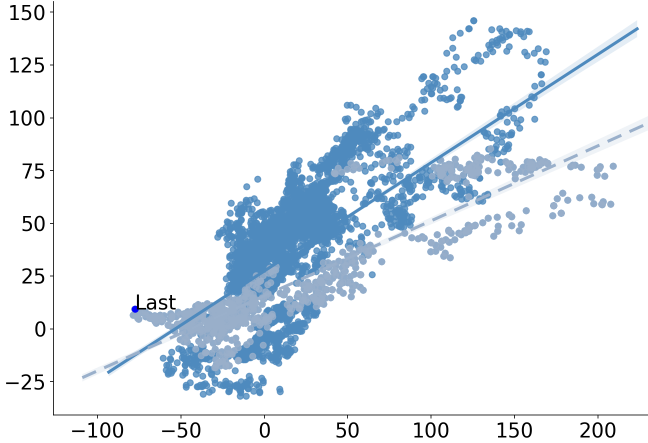
Dark blue is long-run sample, light blue is since the end of YCC (Oct-21).
Source: J.P. Morgan.
In our view, the idea of backdated easing has to give way to resolution sooner rather than later, either by delivery of more immediate and fulsome cuts, or a cheapening in the reds if terminal rates elsewhere in DM are reassessed. The unusual shape in the belly of the AUD curve conveys a similar tension, as relative to the inverted shape of 1Y/1Yx1Y, the 2s/5s curve is unusually steep ( Figure 106). Our inclination is that this will be resolved by a shift right, i.e. steeper 1s/2s, given that AUD swap curve RMSE has been most correlated with the very front-end.
Figure 107: Inflation surprises stabilized in early 2023, and year-ahead forecasts are converging to target with the passage of time
LHS: JPM annual inflation forecast (%); RHS: JPM Inflation Forecast Revision Index
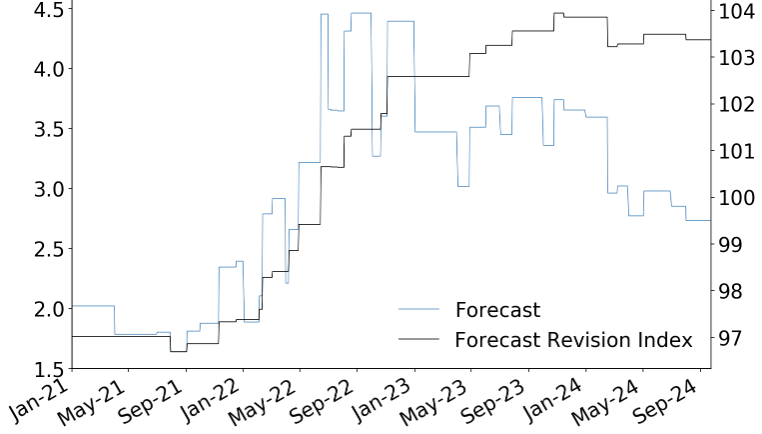
Source: J.P. Morgan.
Figure 108: NZD swap yields have hit new range lows, which looks all the more striking given the relatively recent RBNZ pivot and lack of certainty around the reaction function
NZD IRS yields (%), box-whisker for last 6m (range, median and IQR), blue marker is most recent
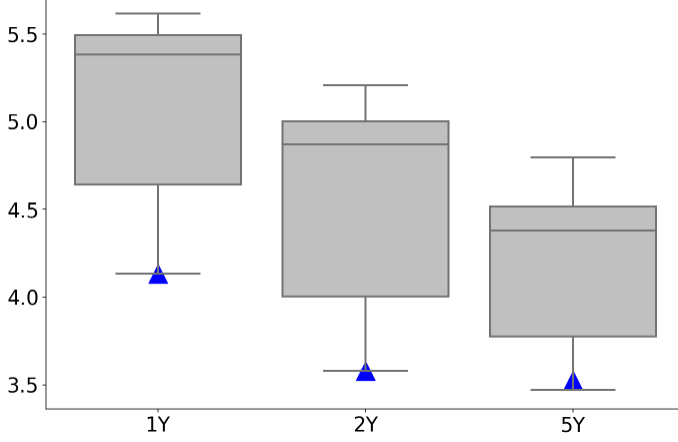
Source: J.P. Morgan.
This week’s monthly CPI indicator for August was in line with consensus while below our forecasts, with energy subsidies dragging more than expected. The monthly CPI is more volatile than the quarterly, and the drop to 2.7%oya somewhat overstates progress in achieving the inflation target, much as 2Q’s readings in the high 3s understated progress. Over the last eighteen months our inflation FRI has been stationary, with inflation converging toward target fairly linearly ( Figure 107). This path has still delivered consistently above what front breakevens have implied, but that continues to play out as a carry dynamic without prompting reassessment of pricing of the forward outlook. With the fear factor around inflation now largely diminished and subsidies/oil prices continuing to slow headline inflation near term, we stop out of our long in the 2025 ACGBi BEI (see also the Monthly Inflation Outlook).
Figure 109: On our full (>20 year) sample, NZD 1Yx1Y is approaching 2 standard deviations rich when fitted to central bank speeches and macro controls
1Yx1Y curve points, R^2 and residual (actual less fitted) from regression on HDSs and macro controls, using long-run sample
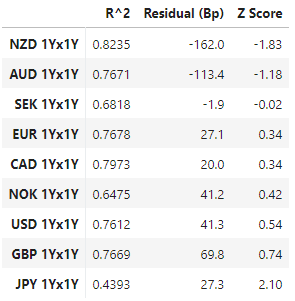
Source: J.P. Morgan.
Figure 110: The NZ employment PMI hit new expansion lows in June, but has since stabilized
PMI Index
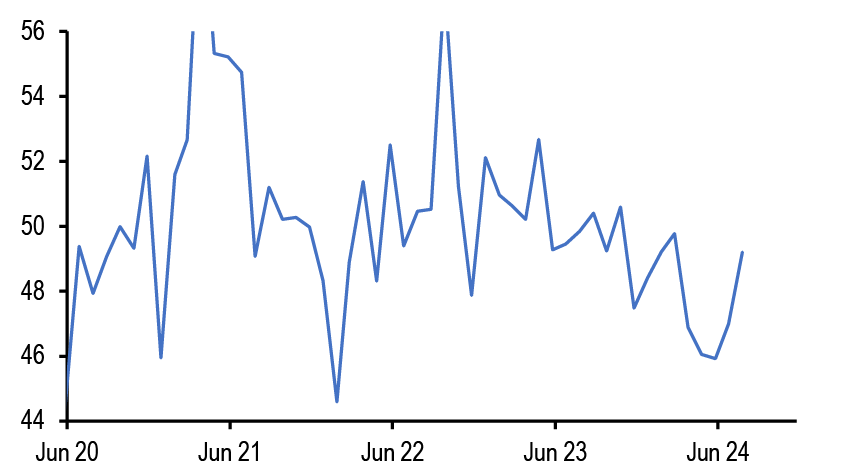
Source: BNZ, J.P. Morgan.
In NZ, the news flow has been light, but generally less bad than the data that triggered the first RBNZ cut last month. Having been bullish most of this year, we have turned relatively square lately and now see value in fading the richness of front-end yields at range extremes ( Figure 108). Pay 2Y NZD IRS: this point is now 30bp below the RBNZ’s short-run neutral measure, whereas the spot cash rate is 130bp above. For policy to average in accommodative territory over the next 2 years, from today’s starting point, the easing cycle will have to continuously deliver in very front-loaded fashion.
The pricing also requires the market to maintain its confidence that the RBNZ’s reaction function will shift further, beyond where it and other central banks have been signaling lately. For example on our long-run models, NZD is the richest front-end in DM when fit to Hawk Dove Scores and macro controls ( Figure 109). The rhetoric therefore has to move a lot further to vindicate the pricing. Similarly, local data also have not justified shifting from 25bp cuts to 50bp cuts; GDP beat RBNZ forecasts and the PMIs have rebounded somewhat from mid-year’s concerning trough ( Figure 110). Pay NZD 2Y IRS at 3.565%.
AUD Cross-Currency Basis Update: FRA-OIS drives a steepening impulse
The AUD/USD (BBSW-SOFR) basis curve has been steepening in the front-end, as the dust settles after maturity of the RBA’s bank Term Funding Facility (TFF). In contrast to other RFR basis curves, which have recently been governed more by the USD reserve outlook and relative monetary policy expectations, local liquidity has been more relevant lately for AUD/USD basis. AUD excess reserves have contracted more than 50% since the peak in early 2022, and by more than a third in the last six months, leading to idiosyncratic tightening in local funding conditions. Initially the liquidity withdrawal from TFF had been priced as purely an FX-OIS phenomenon. We have viewed this as overly simplistic, however, and the impact is now broadening out to AUD FRA-OIS, pulling the front-end of the BBSW-SOFR curve wider (i.e. lower, Figure 111) and renewing the divergence vs PC1 of other basis curves ( Figure 112).
Figure 111: Since the RBA’s TFF matured, the diminished AUD reserve base has transmitted to relatively wider FRA-OIS, steepening the BBSW-SOFR curve
AUD-USD BBSW-SOFR basis curve, snapshots last 3m
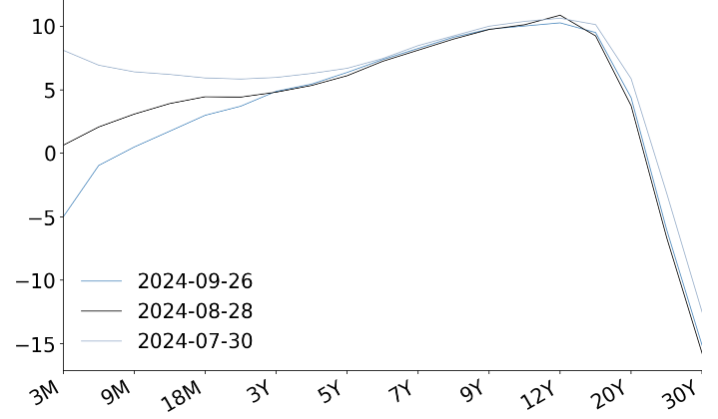
Source: J.P. Morgan.
Figure 112: Front-end widening is in contrast to the global dynamic, suggesting domestic drivers have been dominant
LHS: 6m AUD-USD BBSW-SOFR basis (Bp); RHS: PC1 of EUR, JPY, and GBP 6m basis (Unitless, inverted)
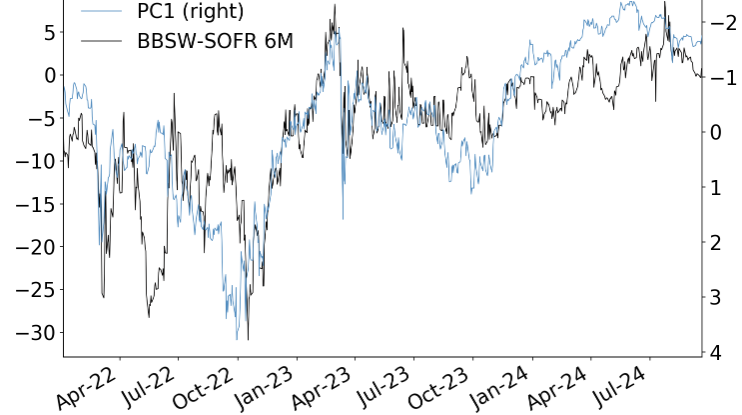
Source: J.P. Morgan.
Local banks have been preparing for TFF maturity and contraction in reserves by issuing more short-dated paper (both domestically and offshore), and holding more securities. While temporarily propping up LCR ratios, banks’ liquidity preference and terming out of liabilities has also meant reduced reserve velocity (see The Antipodean Strategist: Money Illusion), and require persistently wider levels in front-end BOB and 6s/3s basis ( Figure 113). Banks’ offshore issuance has been similarly elevated, while slipping to lower-than-average tenors. We expect this dynamic to persist, and such that the front-end of the BBSW-SOFR curve should be anchored at current levels and perhaps even biased a little steeper.
Figure 113: Banks’ desire to term out liabilities beyond the LCR window, alongside reserve hoarding, is keeping intra-market bases wide
LHS: AUD 1Y BOB (BBSW-OIS) basis; RHS: AUD 1Y 6s/3s basis (Bp both axes)
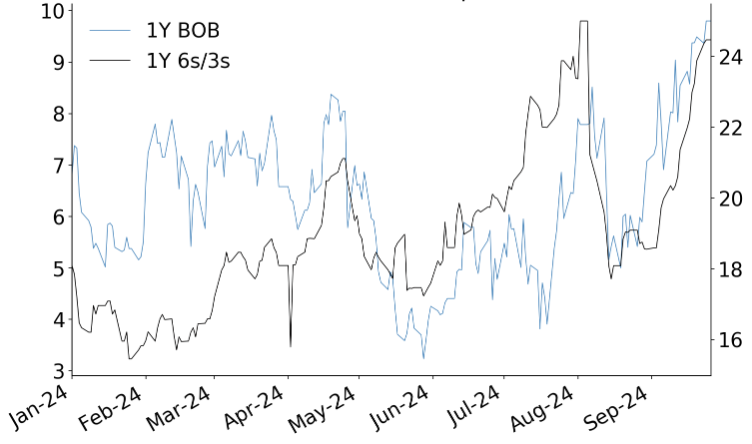
Source: J.P. Morgan.
Figure 114: For the 3Y sector and beyond, model BBSW-SOFR model residuals are near zero ...
AUD/USD BBSW-SOFR basis model residuals (Bp)
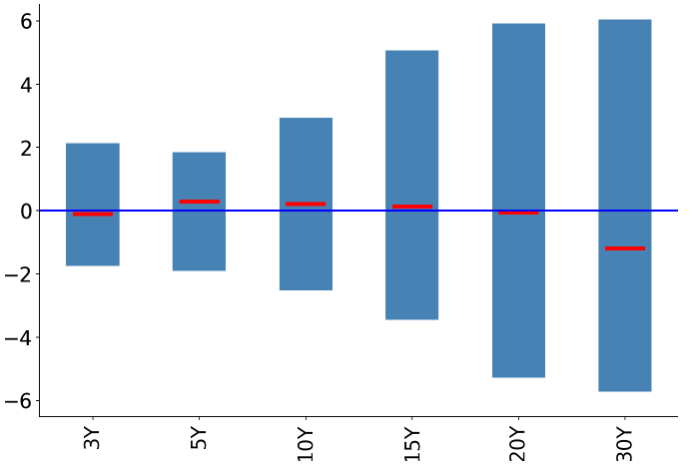
Models estimated separately using daily data on RBA surplus ES balances, JULI credit index, JACI index (face value of offshore issuance by AUD entities), PC1 and PC2 of EUR, JPY, GBP 6m basis, and 1m rolling sum of AUD entities’ offshore issuance flow, and Kanga flow. Red is current residual, Blue is range of residuals since Jan 2023.
Source: J.P. Morgan, Bloomberg Finance L.P.
For all but the very front-end of the curve, residuals on our models (based on ES balances, credit conditions, other issuance variables ( Figure 114) are not particularly striking at face value, and are flat across the term structure. Since the 1-2Y sector has widened substantially of late and is only now finding equilibrium at new liquidity levels, the relative flatness further out is somewhat surprising, and seems an under-reaction to the new front-end curve shape. The economy’s shift back to current account deficit territory represents a return to “normal” as a net demander of foreign capital. Much of the resulting hedged issuance flows come through domestic banks’ foreign funding requirement. Though shorter-end activity has been firm, in our view, this program still needs to be rebuilt further in the belly of the curve and beyond.
Figure 115: … but it has been a very solid year for onshore issuance ...
AUD issuance by non-AUD entities by calendar year, YTD and extrapolating using seasonal factors
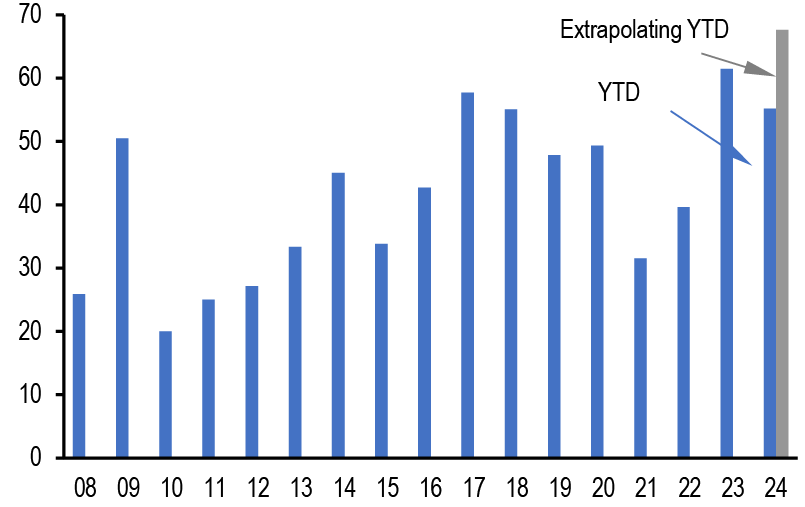
Source: Bloomberg Finance L.P., J.P. Morgan.
Figure 116: …and these AUD-denominated flows are now waning just as their beta to basis collapses, suggesting belly/longer-end basis is too wide
1m rolling beta of 10Y BBSW-SOFR basis to offshore and onshore issuance
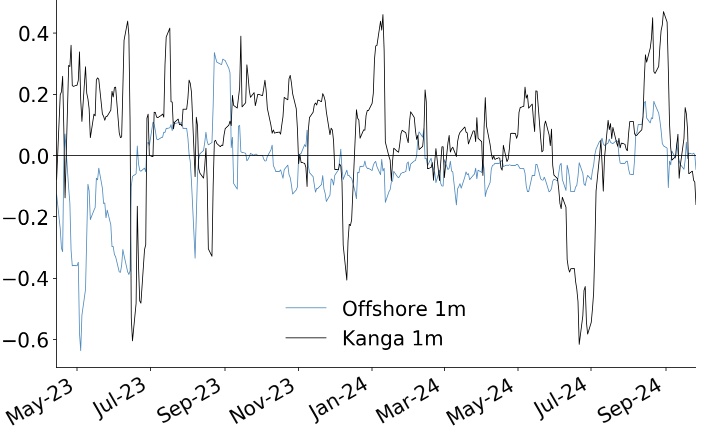
Using 1m rolling sum of AUD entities’ issuance in non-AUD currencies, and foreign entities’ issuance in AUD.
Source: Bloomberg Finance L.P., J.P. Morgan.
Moreover, this has been a strong year for both offshore and Kanga issuance ( Figure 115)… but it has been a very solid year for onshore issuance ... ). Quite large opposing forces have therefore been required to sustain curve shape in the belly and longer-end. Given that onshore AUD issuance by foreign entities tends to be more opportunistic, it can easily be crowded out by domestic local currency issuers, and less attractive basis curve shape. Waning Kanga issuance and a collapse in the beta of 10Y basis level to Kanga flows ( Figure 116) more recently suggest foreign issuers are indeed starting to step back from AUD issuance. This leaves the broader curve somewhat vulnerable and we enter a 5s/10s BBSW-SOFR steepener.
Summary of main views
| Duration | Curve | Swap spreads | Swap spread curve | Inflation | Cross-market |
| Pay NZD 2Y IRS | Pay AUD 1s/2s IRS curve | Own 10Y TCV paper vs. ACGB | AUD 3s/10s EFP curve to invert significantly at cycle-end | Receive NZD-AUD 1Yx1Y IRS at +10-20bp | |
| Pay the Nov '24/Feb '25 RBNZ OIS spread | Sell ACGB Apr-2026s on ASW | Receive the AUD-USD 5Yx5Y spread (IRS-SFR) | |||
| Pay 5s/10s BBSW-SOFR curve | |||||
Trade recommendations
- Pay NZD 2Y IRS
Pay 25K DV01 NZD 2Y IRS at 3.565%. - Pay 5s/10s AUD-USD (BBSW-SOFR) basis
Pay 25K DV01 10Y BBSW-SOFR basis at +9.6bp, receive 25K DV01 5Y BBSW-SOFR basis at +6.0bp, a spread of +3.6bp. - Sell ACGB Apr-2026s on ASW
Sell 25K DV01 ACGB Apr-2026s on ASW, at a spread of -12.9bp. P/L since inception (5 Sep): +1.4bp - Pay the AUD 1s/2s IRS curve spread
Receive 25K DV01 AUD 1Y IRS (Q-Q) at 4.03%, pay 25K DV01 AUD 2Y IRS (Q-Q) at 3.71%, a spread of -32.3bp. P/L since inception (29 Aug): -4.0bp - Pay the Nov ’24/Feb ’25 RBNZ OIS curve spread
Receive 25K DV01 November 2024 RBNZ OIS at 4.42%, pay 25K DV01 February 2025 RBNZ OIS at 3.98%, a spread of -44.5bp. P/L since inception (15 Aug): -1.6bp - Receive the AUD-USD 5Yx5Y IRS spread
Receive 25K DV01 AUD 5Yx5Y IRS (S-S) at 4.35%, pay 25K DV01 5Yx5Y USD swap (SFR) at 3.41%, a spread of +94.9bp. P/L since inception (15 Aug): +0.3bp - Own TCV Nov-2034 vs. ACGB May-2024
Buy 25K DV01 TCV Nov-2034 at 5.30%, sell 25K DV01 ACGB May-2034 at 4.35%, a spread of +95.2bp. P/L since inception (9 May): +5.5bp - Long 2025 ACGBi BEI
Long 25K DV01 2025 ACGBi breakeven at 2.90%. Closed at 2.38%. P/L since inception (6 Dec): -52.0bp
Note: One star (*): high-conviction trade and no star: moderate-conviction trade. Closed trades marked as at submission, existing trades marked as of the close of business (Sydney) on 26 September 2024.
Forecasts
| Current | Dec-24 | Mar-25 | Jun-25 | Sep-25 | |
| United States | |||||
| Fed Funds | 5.00 | 4.25 | 3.75 | 3.25 | 3.00 |
| 2-year note | 3.56 | 3.40 | 3.05 | 2.90 | 2.70 |
| 10-year note | 3.78 | 3.55 | 3.50 | 3.45 | 3.40 |
| 2s10s curve (bps) | 23 | 15 | 45 | 55 | 70 |
| Australia | |||||
| RBA cash rate | 4.35 | 4.35 | 4.10 | 3.85 | 3.60 |
| 90-day rate | 4.43 | 4.20 | 3.95 | 3.70 | 3.45 |
| 3-year yield | 3.51 | 3.70 | 3.50 | 3.40 | 3.30 |
| 10-year yield | 3.95 | 4.05 | 3.90 | 3.80 | 3.80 |
| 3-year swap spread (bps) | 7 | 15 | 15 | 15 | 15 |
| 10-year swap spread (bps) | 7 | 10 | 10 | 10 | 10 |
| 3s10s curve (bps) | 44 | 35 | 40 | 40 | 50 |
| AUS-US 10-year spread (bps) | 16 | 50 | 40 | 35 | 40 |
| New Zealand | |||||
| RBNZ OCR | 5.25 | 4.75 | 4.50 | 4.00 | 3.75 |
| 90-day rate | 4.90 | 4.60 | 4.10 | 4.00 | 3.60 |
| 2-year bond | 3.84 | 3.90 | 3.60 | 3.50 | 3.50 |
| 10-year bond | 4.25 | 4.30 | 4.20 | 4.30 | 4.20 |
| 2s10s swap curve | 32 | 30 | 50 | 75 | 65 |
| NZ-US 10-year spread | 47 | 75 | 70 | 85 | 80 |
| Foreign Exchange | |||||
| AUD/USD | 0.69 | 0.67 | 0.68 | 0.69 | 0.69 |
| NZD/USD | 0.63 | 0.61 | 0.61 | 0.62 | 0.62 |
| EUR/USD | 1.11 | 1.05 | 1.12 | 1.12 | 1.15 |
| USD/JPY | 145 | 142 | 141 | 140 | 139 |
| AUD/JPY | 99.2 | 95.1 | 95.9 | 96.6 | 95.9 |
| NZD/JPY | 90.8 | 86.6 | 86.0 | 86.8 | 86.2 |
| AUD/NZD | 1.09 | 1.10 | 1.11 | 1.11 | 1.11 |
Source: J.P. Morgan. Current values are from Bloomberg Finance L.P.
Trades closed last 12M
| TRADE | ENTRY | EXIT | P&L |
| DURATION | |||
| Pay Jun-23 RBA OIS | 16-Mar-23 | 20-Apr-23 | 26.5 |
| Pay Nov-23 RBA OIS | 03-Aug-23 | 25-Oct-23 | 8.0 |
| Pay Dec-23 RBA OIS | 25-Oct-23 | 26-Oct-23 | -3.8 |
| Receive NZD 1Yx1Y IRS | 08-Jun-23 | 02-Nov-23 | -6.9 |
| Pay Dec-23 RBA OIS | 08-Nov-23 | 06-Dec-23 | -3.0 |
| Receive Aug '24 RBNZ OIS | 08-Nov-23 | 14-Dec-23 | 42.4 |
| Receive Aug '24 RBNZ OIS | 29-Feb-24 | 11-Jul-24 | -2.2 |
| Receive NZD 2Yx1Y IRS | 21-Mar-24 | 18-Jul-24 | 36.1 |
| Receive AUD 1Yx1Y IRS | 18-Jul-24 | 01-Aug-24 | 31.0 |
| Receive August '24 RBNZ OIS | 01-Aug-24 | 15-Aug-24 | 11.4 |
| CURVE | |||
| AUD 3s/10s EFP box flattener | 09-Feb-23 | 10-Apr-23 | 1.7 |
| ACGB 3s/10s futures flattener | 20-Apr-23 | 10-May-23 | 3.5 |
| Sell belly of ACGB Nov-24/Nov-29/Nov-32 fly | 18-Aug-22 | 08-Jun-23 | -38.0 |
| Sell belly of ACGB Nov-25/Apr-26/Sep-26 fly | 22-Jun-23 | 03-Aug-23 | 0.6 |
| Receive belly of NZD 2s/3s/10s IRS fly | 23-Mar-23 | 02-Nov-23 | 33.8 |
| Sell ACGB 3s/10s futures curve | 25-Oct-23 | 08-Nov-23 | 3.5 |
| Receive belly of AUD 3s/5s/10s IRS fly | 22-Feb-24 | 26-Apr-24 | -4.2 |
| AUD IRU4/U5 bill flattener | 13-Jun-24 | 18-Jul-24 | 10.0 |
| Pay NZD 2s/5s IRS curve | 18-Jul-24 | 01-Aug-24 | 4.2 |
| Paid belly of NZD 2s/5s/10s IRS fly | 01-Aug-24 | 12-Sep-24 | 11.4 |
| COUNTRY SELECTION/RELATIVE VALUE | |||
| NZD/USD 1Yx1Y/2Yx1Y BKBM-SOFR flattener | 02-Mar-23 | 16-Mar-23 | -2.2 |
| Receive 6Mx6M BBSW-SOFR basis | 22-Nov-23 | 02-Mar-23 | -2.9 |
| Short ACGB Apr-24s vs maturity-matched OIS | 09-Jun-22 | 08-Jun-23 | 19.5 |
| NZD-AUD 1Yx1Y IRS spread narrower | 23-Feb-23 | 08-Jun-23 | 24.5 |
| Long IRM4 vs SFRM4 | 10-May-23 | 06-Jul-23 | 33.0 |
| AUD 3s/10s EFP box flattener | 16-May-23 | 17-Aug-23 | 1.0 |
| Receive 12M BBSW-SOFR basis | 13-Apr-23 | 08-Nov-23 | 0.9 |
| Long NZGB Apr-33 vs UST 3 3/8 May-33 | 13-Jul-23 | 08-Nov-23 | 21.7 |
| Sell ACGB Sep-26 vs receiving 3Y OIS | 12-Oct-23 | 18-Jan-24 | 4.3 |
| Paid 1s/5s BBSW-SOFR basis | 20-Jul-23 | 22-Feb-24 | -7.6 |
| Paid 1s/2s BKBM-SOFR basis | 08-Nov-23 | 22-Feb-24 | -2.0 |
| Long IRU4 vs SFRU4 | 25-Oct-23 | 22-Feb-24 | 42.0 |
| Paid AUD 1Yx1Y IRS, received 1Yx1Y SFR | 21-Mar-24 | 11-Apr-24 | -36.0 |
| Paid May '24 RBA OIS, received Apr '24 RBNZ OIS | 18-Jan-24 | 11-Apr-24 | -1.6 |
| NZD-AUD 2s/5s IRS box steepener | 22-Jun-23 | 11-Apr-24 | 6.6 |
| Own TCV Nov-2034s on ASW | 07-Mar-24 | 18-Apr-24 | 0.0 |
| Pay AUD 10Y EFP | 04-Apr-24 | 26-Apr-24 | 1.0 |
| Pay the belly of AUD 1s/2s/3s IRS | 14-Dec-23 | 09-May-24 | 5.1 |
| Pay the AUD-USD 2s/5s/10s spread (IRS-SFR) | 07-May-24 | 13-Jun-24 | 4.4 |
| Receive the NZD-AUD 1Yx1Y IRS spread | 09-May-24 | 27-Jun-24 | 15.6 |
| Own NZGB Apr-2033s on ASW | 18-Jan-24 | 29-Aug-24 | -4.8 |
| INFLATION | |||
| Long 2025 ACGBi BEI | 14-Sep-23 | 26-Oct-23 | 11.3 |
| Long 2025 ACGBi BEI | 06-Dec-23 | 25-Sep-24 | -52.0 |
Source: J.P. Morgan. Note: Past performance is not indicative of future results.
Interest rate forecasts
| 27-Sep | Dec-24 | Mar-25 | Jun-25 | Sep-25 | YTD chg. (bp) | 27-Sep | Dec-24 | Mar-25 | Jun-25 | Sep-25 | YTD chg. (bp) | |||||
| US | Fed funds | 4.75-5.00 | 4.00-4.25 | 3.50-3.75 | 3.00-3.25 | 2.75-3.00 | - | UK | Base rate | 5.00 | 4.75 | 4.50 | 4.25 | 4.00 | - | |
| SOFR | 4.82 | 4.10 | 3.60 | 3.10 | 2.85 | - | 2Y bmk yield | 3.95 | 3.80 | 3.60 | 3.40 | 3.15 | 35 | |||
| 2Y bmk yield | 3.62 | 3.40 | 3.05 | 2.90 | 2.70 | -63 | 5Y bmk yield | 3.83 | 3.65 | 3.50 | 3.30 | 3.10 | 48 | |||
| 5Y bmk yield | 3.55 | 3.30 | 3.05 | 2.95 | 2.85 | -28 | 10Y bmk yield | 3.98 | 3.85 | 3.75 | 3.65 | 3.55 | 37 | |||
| 10Y bmk yield | 3.78 | 3.55 | 3.50 | 3.45 | 3.40 | -8 | 30Y bmk yield | 4.58 | 4.40 | 4.35 | 4.30 | 4.25 | 44 | |||
| 30Y bmk yield | 4.11 | 3.90 | 3.95 | 3.95 | 3.95 | 9 | 2s/10s bmk curve | 4 | 5 | 15 | 25 | 40 | 2 | |||
| 2s/10s bmk curve | 16 | 15 | 45 | 55 | 70 | 55 | 10s/30s bmk curve | 60 | 55 | 60 | 65 | 70 | 7 | |||
| 10s/30s bmk curve | 33 | 35 | 45 | 50 | 55 | 18 | 2s/30s bmk curve | 63 | 60 | 75 | 90 | 110 | 9 | |||
| 2s/30s bmk curve | 49 | 50 | 90 | 105 | 125 | 72 | vs. SONIA | 2Y swap spread | -14 | -8 | -8 | -10 | -15 | -21 | ||
| 5Y swap spread | -8 | -1 | -3 | -5 | -10 | -10 | ||||||||||
| 10Y swap spread | -35 | -33 | -35 | -35 | -40 | -3 | ||||||||||
| 30Y swap spread | -76 | -75 | -75 | -80 | -85 | 2 | ||||||||||
| Euro area | Refi rate | 3.65 | 3.15 | 2.65 | 2.15 | 2.15 | - | Japan | Policy rate | 0.25 | 0.50 | 0.50 | 0.75 | 0.75 | - | |
| Depo rate | 3.50 | 3.00 | 2.50 | 2.00 | 2.00 | - | 2Y bmk yield | 0.38 | 0.65 | 0.60 | 0.90 | 0.85 | 33 | |||
| 3M Euribor | 3.33 | 3.00 | 2.50 | 2.00 | 2.00 | -58 | 5Y bmk yield | 0.49 | 0.80 | 0.75 | 1.00 | 0.95 | 28 | |||
| 2Y bmk yield | 2.09 | 2.00 | 1.85 | 1.75 | 1.65 | -29 | 10Y bmk yield | 0.85 | 1.10 | 1.05 | 1.25 | 1.20 | 24 | |||
| 5Y bmk yield | 1.97 | 1.90 | 1.80 | 1.75 | 1.70 | 4 | 20Y bmk yield | 1.67 | 1.90 | 1.80 | 2.00 | 1.90 | 29 | |||
| 10Y bmk yield | 2.15 | 2.10 | 2.00 | 1.95 | 1.90 | 13 | 30Y bmk yield | 2.06 | 2.25 | 2.15 | 2.35 | 2.20 | 43 | |||
| 30Y bmk yield | 2.47 | 2.40 | 2.35 | 2.35 | 2.35 | 22 | 2s/10s bmk curve | 48 | 45 | 45 | 35 | 35 | -9 | |||
| 2s/10s bmk curve | 5 | 10 | 15 | 20 | 25 | 42 | 10s/30s bmk curve | 121 | 115 | 110 | 110 | 100 | 19 | |||
| 10s/30s bmk curve | 32 | 30 | 35 | 40 | 45 | 9 | 2s/30s bmk curve | 169 | 160 | 155 | 145 | 135 | 10 | |||
| 2s/30s bmk curve | 38 | 40 | 50 | 60 | 70 | 51 | ||||||||||
| vs. 6s | 2Y swap spread | 23 | 34 | 34 | 32 | 32 | -21 | Australia | Cash rate | 4.35 | 4.35 | 4.10 | 3.85 | 3.60 | - | |
| 5Y swap spread | 27 | 32 | 32 | 30 | 30 | -22 | 3Y bmk yield | 3.49 | 3.70 | 3.60 | 3.40 | 3.40 | -12 | |||
| 10Y swap spread | 23 | 26 | 26 | 24 | 24 | -23 | 10Y bmk yield | 3.95 | 4.05 | 4.00 | 3.80 | 3.80 | 0 | |||
| 30Y swap spread | -18 | -16 | -14 | -12 | -10 | -25 | ||||||||||
| New Zealand | Cash rate | 5.25 | 4.75 | 4.50 | 4.00 | 3.75 | - | |||||||||
| 10Y spread | Austria | 50 | 50 | 45 | 45 | 45 | -8 | 2Y bmk yield | 3.67 | 3.90 | 3.60 | 3.50 | 3.50 | -91 | ||
| to Germany | Belgium | 62 | 55 | 50 | 50 | 50 | 3 | 10Y bmk yield | 4.26 | 4.20 | 4.00 | 4.10 | 4.10 | -9 | ||
| (curve adj.) | Finland | 53 | 50 | 45 | 45 | 45 | -2 | |||||||||
| France | 79 | 65 | 60 | 60 | 60 | 26 | Sweden | Repo rate | 3.25 | 2.75 | 2.25 | 2.00 | 2.00 | - | ||
| Greece | 95 | 100 | 100 | 90 | 90 | -11 | 2-year govt | 1.68 | 1.70 | 1.55 | 1.45 | 1.40 | -59 | |||
| Ireland | 36 | 35 | 35 | 35 | 30 | 2 | 10-year govt | 1.95 | 1.90 | 1.85 | 1.80 | 1.80 | -8 | |||
| Italy | 131 | 145 | 140 | 140 | 140 | -36 | ||||||||||
| Netherlands | 29 | 25 | 25 | 25 | 25 | -2 | Norway | Depo rate | 4.50 | 4.25 | 4.00 | 3.50 | 3.25 | - | ||
| Portugal | 56 | 60 | 60 | 60 | 60 | -7 | 2-year govt | 3.32 | 2.80 | 2.55 | 2.35 | 2.20 | -26 | |||
| Spain | 78 | 75 | 70 | 70 | 70 | -18 | 10-year govt | 3.79 | 3.00 | 2.85 | 2.75 | 2.65 | 52 | |||
| Wtd. peri. spread | 108 | 115 | 110 | 110 | 110 | -28 | ||||||||||
| EU | 65 | 52 | 45 | 40 | 40 | -2 |
* Levels as of 1:00pm London time.
Marketable sovereign bond* and bank debt** redemptions
| Japan | Austria | Belgium | Finland | France | Germany | Netherlands | Core*** | ||||||||
| Sov. | Sov. | Banks | Sov. | Banks | Sov. | Banks | Sov. | Banks | Sov. | Banks | Sov. | Banks | Sov. | Banks | |
| Jan-24 | 3 | 0 | 1 | 0 | 0 | 0 | 0 | 0 | 3 | 13 | 2 | 15 | 2 | 28 | 8 |
| Feb-24 | 3 | 0 | 0 | 0 | 1 | 0 | 1 | 31 | 11 | 23 | 5 | 0 | 5 | 54 | 23 |
| Mar-24 | 20 | 0 | 0 | 0 | 1 | 0 | 1 | 41 | 8 | 20 | 4 | 0 | 3 | 61 | 16 |
| Apr-24 | 3 | 0 | 0 | 0 | 0 | 5 | 1 | 0 | 8 | 24 | 4 | 0 | 0 | 29 | 13 |
| May-24 | 3 | 0 | 1 | 0 | 0 | 0 | 0 | 37 | 6 | 23 | 2 | 0 | 2 | 60 | 12 |
| Jun-24 | 23 | 0 | 1 | 15 | 0 | 0 | 2 | 0 | 8 | 17 | 6 | 0 | 2 | 32 | 19 |
| Jul-24 | 3 | 12 | 1 | 0 | 1 | 0 | 2 | 21 | 5 | 0 | 2 | 17 | 1 | 50 | 11 |
| Aug-24 | 3 | 0 | 0 | 0 | 0 | 0 | 1 | 0 | 9 | 23 | 5 | 0 | 1 | 23 | 16 |
| Sep-24 | 21 | 0 | 0 | 0 | 0 | 4 | 0 | 0 | 2 | 17 | 1 | 0 | 2 | 21 | 5 |
| Oct-24 | 3 | 12 | 1 | 13 | 0 | 0 | 0 | 0 | 7 | 23 | 5 | 0 | 1 | 48 | 14 |
| Nov-24 | 3 | 0 | 0 | 0 | 1 | 0 | 0 | 38 | 7 | 0 | 3 | 0 | 1 | 38 | 11 |
| Dec-24 | 20 | 0 | 0 | 0 | 1 | 0 | 2 | 0 | 1 | 16 | 3 | 0 | 1 | 16 | 8 |
| Total | 109 | 24 | 5 | 28 | 3 | 9 | 11 | 168 | 74 | 199 | 42 | 32 | 19 | 460 | 156 |
| Greece | Ireland | Italy | Portugal | Spain | Periphery**** | US | UK | Sweden | |||||||||
| Sov. | Banks | Sov. | Banks | Sov. | Banks | Sov. | Banks | Sov. | Banks | Sov. | Banks | Sov. | Banks | Sov. | Banks | Sov. | |
| Dec-23 | 0 | 0 | 0 | 0 | 29 | 5 | 0 | 0 | 18 | 2 | 47 | 7 | 324 | 25 | 36 | 9 | 0 |
| Jan-24 | 0 | 0 | 0 | 0 | 14 | 6 | 6 | 0 | 0 | 3 | 20 | 9 | 281 | 13 | 0 | 2 | 0 |
| Feb-24 | 0 | 0 | 8 | 0 | 23 | 1 | 0 | 0 | 0 | 5 | 31 | 6 | 193 | 24 | 24 | 8 | 0 |
| Mar-24 | 2 | 0 | 0 | 0 | 26 | 2 | 0 | 0 | 21 | 6 | 49 | 8 | 305 | 26 | 36 | 2 | 0 |
| Apr-24 | 0 | 0 | 0 | 0 | 30 | 2 | 0 | 0 | 19 | 5 | 49 | 7 | 286 | 20 | 0 | 16 | 0 |
| May-24 | 0 | 0 | 0 | 1 | 0 | 0 | 0 | 0 | 0 | 10 | 0 | 11 | 188 | 25 | 0 | 9 | 0 |
| Jun-24 | 0 | 0 | 0 | 1 | 16 | 3 | 0 | 0 | 18 | 8 | 34 | 12 | 313 | 24 | 26 | 1 | 0 |
| Jul-24 | 0 | 0 | 0 | 1 | 13 | 3 | 0 | 0 | 0 | 3 | 13 | 7 | 275 | 13 | 0 | 3 | 0 |
| Aug-24 | 0 | 2 | 0 | 0 | 36 | 1 | 0 | 0 | 0 | 2 | 36 | 5 | 184 | 17 | 46 | 4 | 0 |
| Sep-24 | 0 | 0 | 0 | 0 | 21 | 3 | 0 | 0 | 24 | 3 | 45 | 6 | 288 | 20 | 0 | 2 | 0 |
| Oct-24 | 0 | 0 | 0 | 0 | 18 | 0 | 0 | 0 | 0 | 4 | 18 | 4 | 284 | 7 | 0 | 5 | 0 |
| Nov-24 | 0 | 0 | 0 | 0 | 37 | 0 | 0 | 1 | 16 | 5 | 53 | 6 | 180 | 13 | 0 | 11 | 0 |
| Total | 2 | 3 | 8 | 3 | 263 | 26 | 6 | 1 | 116 | 56 | 395 | 88 | 3101 | 228 | 166 | 72 | 0 |
Note: In billions of local currency except for Japan which is in ¥trillions
* Marketable bonds include: conventionals, linkers, floaters zero coupons and international bonds.
** Maturities in all currencies and jurisdictions and include secured, unsecured and securitised issuance, including MTNs but excluding short-term (maturity of less than one year) and self-funded deals (deals where there is only one bookrunner and it is also the issuer). The data also include any government guaranteed issuance by the banks but no direct issuance by government or government sponsored institutions.
*** Austria, Belgium, Finland, France, Germany and Netherlands.
**** Greece, Ireland, Italy, Portugal, Spain.
Source: J. P. Morgan, Dealogic, Bloomberg
Event Risk Calendar
| Month | Date | Country | Event |
| Sep '24 | 30 | Columbia | Banrep rate announcement |
| Oct '24 | 2 | Poland | NBP rate announcement |
| 4 | Romania | BoR rate announcement | |
| 7 | Israel | BoI rate announcement | |
| 9 | New Zealand | RBNZ rate announcement | |
| 16 | Thailand | BoT rate announcement | |
| 17 | Chile | BCCh rate announcement | |
| 17 | Euro Area | ECB rate announcement | |
| 23 | Canada | BoC rate announcement | |
| 26 | Mexico | Banxico rate announcement | |
| 25-27 | World | World Bank/ IMF meeting | |
| 31 | Japan | BoJ rate announcement | |
| Nov '24 | 5 | Australia | RBA rate announcement |
| 5-6 | United States | US election date | |
| 6 | Malaysia | BNM rate announcement | |
| 7 | United Kingdom | BoE rate announcement | |
| 7 | United States | FOMC rate announcement | |
| 7 | Norway | Norges Bank rate announcement | |
| 14 | Mexico | Banxico rate announcement | |
| 18-19 | World | G20 Summit | |
| 25 | Israel | BoI rate announcement | |
| 27 | New Zealand | RBNZ rate announcement | |
| Dec '24 | 10 | Australia | RBA rate announcement |
| 11 | Canada | BoC rate announcement | |
| 12 | Euro Area | ECB rate announcement | |
| 17 | Chile | BCCh rate announcement | |
| 18 | United States | FOMC rate announcement | |
| 18 | Thailand | BoT rate announcement | |
| 19 | United Kingdom | BoE rate announcement | |
| 19 | Japan | BoJ rate announcement | |
| 19 | Mexico | Banxico rate announcement | |
| 19 | Norway | Norges Bank rate announcement |
Fact sheet / Sovereign ratings
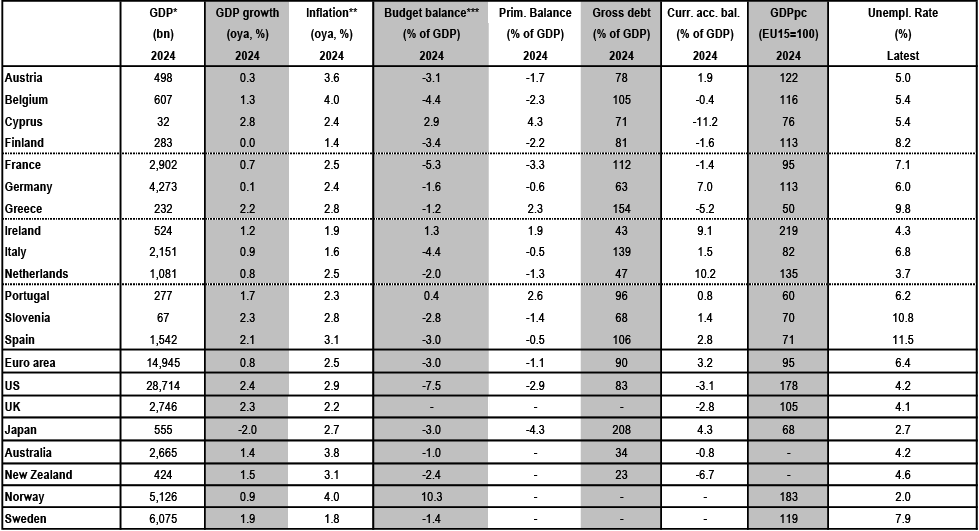
*Local currency, Japan: trillions
**HICP; National index if not available
*** Net lending (+) or net borrowing (-)
Source: EC European Economic Forecast Spring 2024, Ameco, CBO, OBR and ILO State Secretariat for Economic Affairs SECO.
For Japan data: Cabinet Office, Ministry of Finance, Ministry of Internal Affairs and Communications.
For Australia and New Zealand data: Australian Treasury, RBA, NZ Treasury, RBNZ. For Australia, budget, gross debt and nominal GDP data are for FY24
Sovereign rating
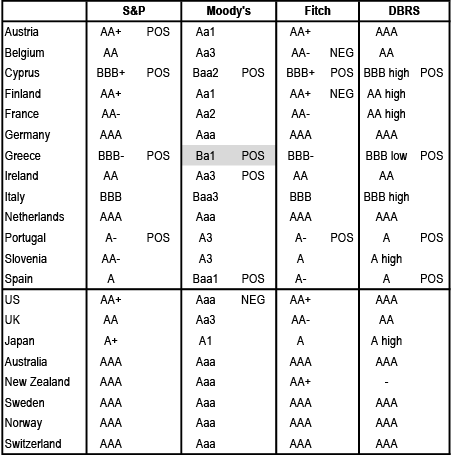
Source: S&P, Moody’s, Fitch, DBRS and Bloomberg Notes: Grey highlight represents below IG; “*” represents under watch. NEG - negative outlook, POS – positive outlook, DEV - developing outlook, blank represents stable outlook. Rules for a country to be excluded from an IG index are as follows: 1) J.P. Morgan’s EMU IG index requires any 1 of 3 credit ratings (S&P’s, Moody’s, Fitch) to be below IG. 2) Bloomberg AGG requires 2 of the above 3 credit ratings to be below IG. 3) FTSE WGBI requires both S&P and Moody’s rating to be below IG.
Eurozone rating action calendar
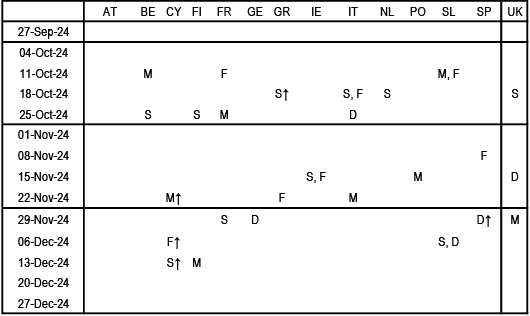
Source: S&P , Moody’s, Fitch, DBR
Legend: “S”: S&P, “M”: Moody’s, “F”: Fitch, “D”: DBRS, “↓” - negative outlook, “↑" – positive outlook; “*” – under watch.
J.P. Morgan Global Rates Strategy
| New York | ||||
| Jay Barry | MD | US Rates Strategy | (1-212) 834 4951 | john.f.barry@jpmorgan.com |
| Phoebe White | ED | US Rates Strategy | (1-212) 834-3092 | phoebe.a.white@jpmorgan.com |
| Srini Ramaswamy | MD | US Rates Derivatives Strategy | (1-415) 315-8117 | srini.ramaswamy@jpmorgan.com |
| Teresa Ho | MD | US Fixed Income Strategy | (1-212) 834-5087 | teresa.c.ho@jpmorgan.com |
| Ipek Ozil | ED | US Rates Strategy | (1-212) 834-2305 | ipek.ozil@jpmorgan.com |
| Afonso Borges | VP | US Rates Strategy | (1-212) 834-4349 | afonso.borges@jpmorgan.com |
| Pankaj Vohra | VP | US Fixed Income Strategy | (1-212) 834 5292 | pankaj.x.vohra@jpmchase.com |
| Philip Michaelides | Associate | US Rates Strategy | (1-212) 834-2096 | philip.michaelides@jpmchase.com |
| Liam Wash | Associate | Fixed Income Strategy | (1-212) 834-5230 | liam.wash@jpmchase.com |
| Holly Cunningham | Analyst | US Fixed Income Strategy | (1-212) 834-5683 | holly.cunningham@jpmorgan.com |
| Arjun Parikh | Analyst | US Rates Strategy | (1-212) 834-4436 | arjun.parikh@jpmchase.com |
| London | ||||
| Fabio Bassi | MD | Head of European Rates Strategy | (44-20) 7134-1989 | fabio.bassi@jpmorgan.com |
| Francis Diamond | ED | UK Rates & European Inflation Strategy | (44-20) 7134-1504 | francis.diamond@jpmorgan.com |
| Khagendra Gupta | ED | European Rates Derivatives Strategy | (44-20) 7134-0486 | khagendra.x.gupta@jpmorgan.com |
| Aditya Chordia | ED | Euro Cash Strategy | (44-20) 7134-2132 | aditya.x.chordia@jpmorgan.com |
| Elisabetta Ferrara | Associate | Rates Strategy | (44-20) 7134 2765 | elisabetta.ferrara@jpmorgan.com |
| Frida Infante | Associate | Rates Strategy | (33 1) 8703 2581 | frida.infante@jpmorgan.com |
| Matteo Mamprin | Associate | Rates Strategy | (44-20) 7134-0329 | matteo.mamprin@jpmorgan.com |
| Alex Pharaon | Analyst | Rates Strategy | (44-20) 7134-2669 | alexander.pharaon@jpmorgan.com |
| Tokyo | ||||
| Takafumi Yamawaki | ED | Head of Japan Rates Research | (81-3) 6736-1748 | takafumi.yamawaki@jpmorgan.com |
| Hiroki Yamamoto | Associate | Japan Rates Research | (81-3) 6736-1757 | hiroki.yamamoto@jpmorgan.com |
| Sydney | ||||
| Ben Jarman | ED | Head, AU/NZ Economics, Rates & FX Strategy | (61-2) 9003-7982 | ben.k.jarman@jpmorgan.com |
| Tom Kennedy | ED | AU/NZ Economics | (61-2) 9003-7981 | tom.kennedy@jpmorgan.com |
| Jack P Stinson | Analyst | AU/NZ Economics | (61-2) 9003-7632 | jack.p.stinson@jpmorgan.com |
Global Market Movers
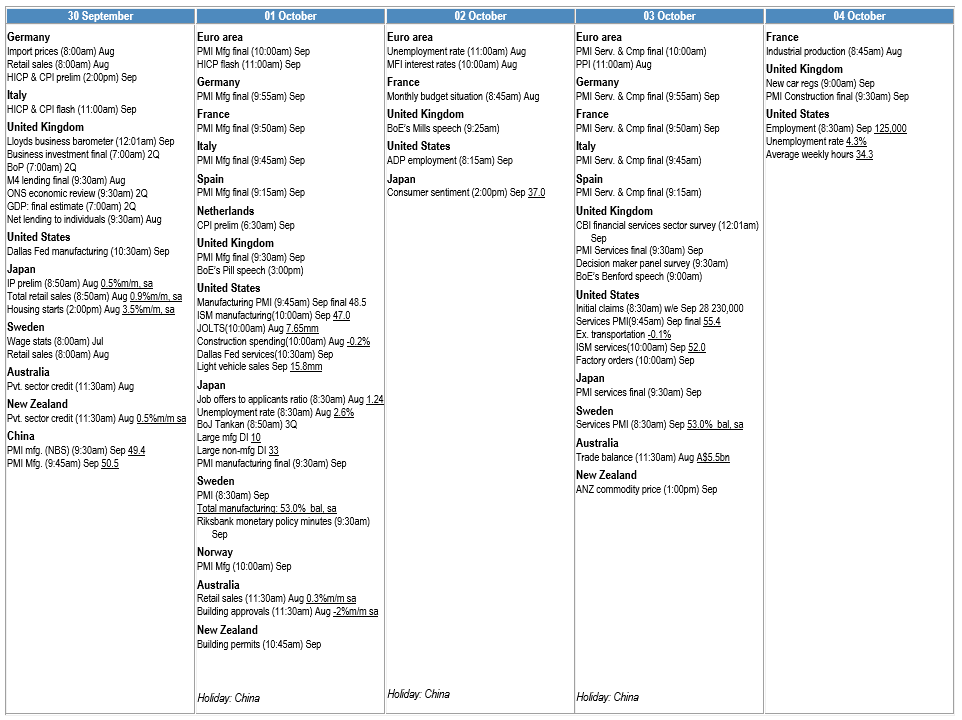

Selective list as of 27 September 2024. Forecasts are m/m, nsa, unless stated & times are local. Telephone your J.P. Morgan representative for an update/more details.
Highlighted data are scheduled for release on or after the date shown. Times shown are local.