Quantitative & Derivatives Strategy
The J.P. Morgan View : Megacap rally masks ‘high for long’ worries
May 1, 2024
The J.P. Morgan View : Megacap rally masks ‘high for long’ worries
This document is being provided for the exclusive use of blake@sandboxfp.com.
01 May 2024

Update (first published 29 April 2024) (See disclosures for details)

This material is neither intended to be distributed to Mainland China investors nor to provide securities investment consultancy services within the territory of Mainland China. This material or any portion hereof may not be reprinted, sold or redistributed without the written consent of J.P. Morgan.

The J.P. Morgan View

Megacap rally masks ‘high for long’ worries

J.P. Morgan does and seeks to do business with companies covered in its research reports. As a result, investors should be aware that the firm may have a conflict of interest that could affect the objectivity of this report. Investors should consider this report as only a single factor in making their investment decision.

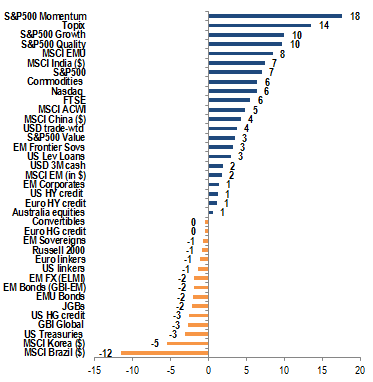
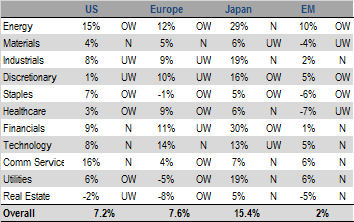
YTD returns by asset

Source: J.P. Morgan.

Cross-Asset Strategy: While Q1 earnings remain in focus this week, beyond this we remain concerned about the repeat of last summer’s drawdown, where the Growth-Policy tradeoff could move away from the Goldilocks narrative, together with a continued risk of concentration reversal, too steep projections for earnings acceleration this year, and positioning unwind. The strong momentum in consumer spending prompted our economists to revise up 2Q24 US growth to a 2.5%ar from 1.5%. Ahead of the FOMC meeting, we see Powell’s opening remarks echoing recent comments that 1Q24 data haven’t increased its confidence of getting back to its 2% target, so we stay neutral on outright duration and prefer 5s/30s steepeners. In the Euro area, stronger than expected domestic data contributed to the sell-off, though our economists expect the April inflation print to show continued disinflation, so we prefer duration proxies such as curve steepeners in 10s/15s Germany and 2Yx2Y/10Yx10Y EUR. Despite broader market volatility, US HG spreads are still near YTD tights and are modestly tighter on the month, as the resilient underlying technicals within HG are limiting its consequences to spreads. In Euro HY, we remain unenthusiastic about valuations, but with the strong technical only easing modestly, we lower our spread target. The USD’s bull run is consolidating. Concerns around the outsized jump in USD positions are valid, but the latter is loose as a contrarian USD signal, so we focus on the maturation of the monetary divergence narrative in US-RoW forward rate pricing. Commodities are not a deflationary force anymore; commodities represented ⅔ of the drop in the US headline CPI inflation from its 2022 peak, but that trend is reversing as the broad commodity complex rebounded and the rally may have another 10%+ to run.

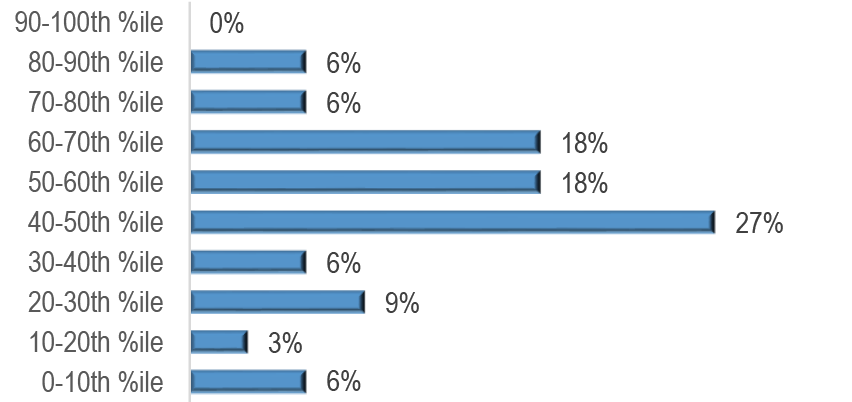
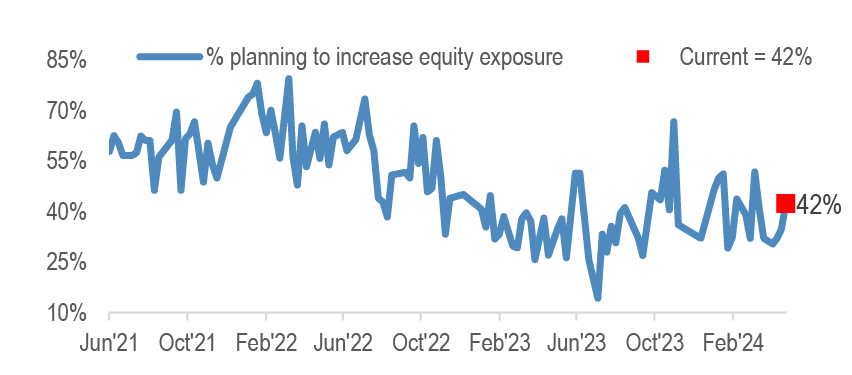
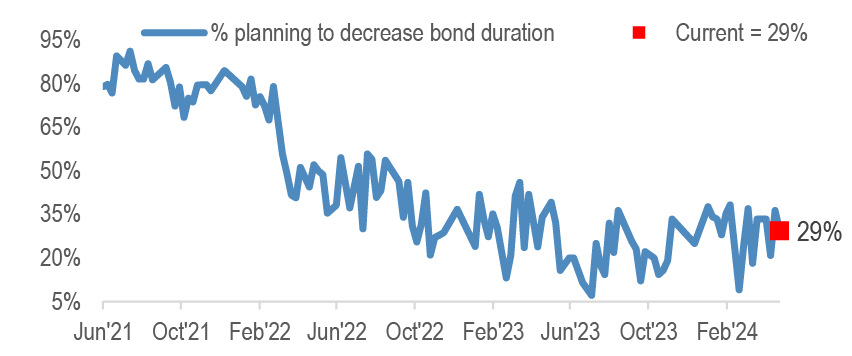
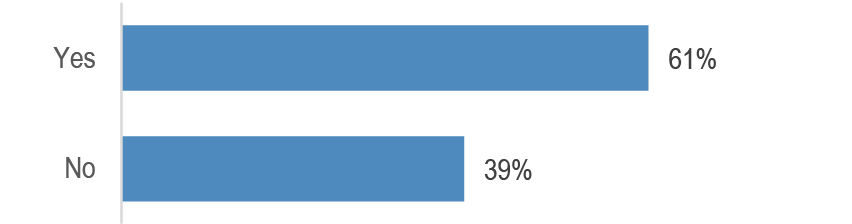
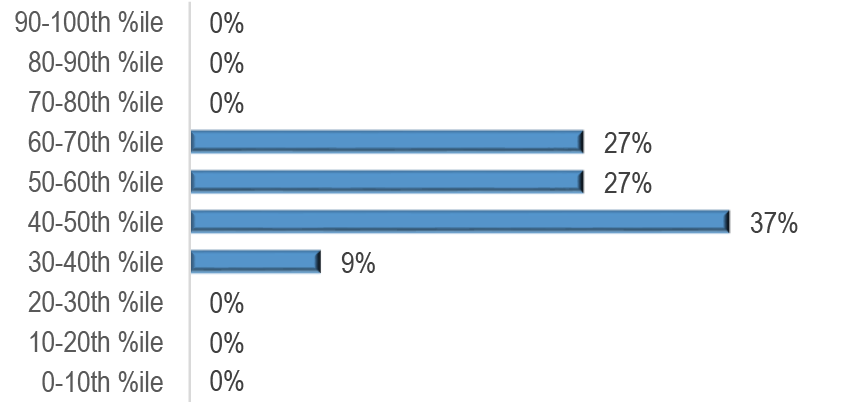
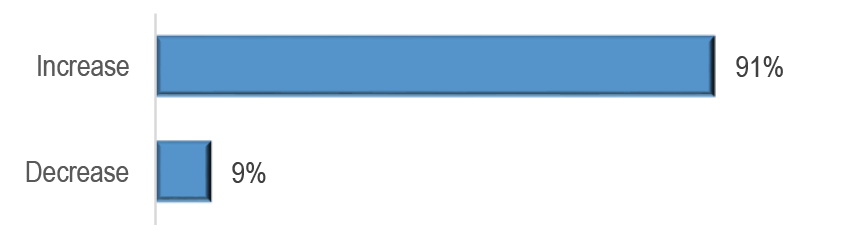
JPM Clients’ View: Click here to take this week’s survey. This week we poll investors on USD, Q1 earnings and the BoJ, in addition to our running sentiment questions. Our last survey results indicated: (1) equity exposure/sentiment among respondents is ~49th percentile on average; (2) 42% planned to increase equity exposure, and 71% to increase bond duration near term; (3) most respondents believe the recent correction isn’t over and look for a drawdown of 10%, and on average they expect the VIX to trade around 18 over the rest of Q2; (4) 47% believe Fed hawkishness will be a drag for EM; (5) 61% expected the BoJ to intervene in the Yen within the next few months.

Megacap rally masks ‘high for long’ worries: The downside surprise on US Q1 GDP and upside surprises on inflation send a negative message that is pressuring the ‘soft landing’ narrative and continues to point to ‘high for long’ risks. While the worry for risk markets is overheating that jeopardizes rate cutting, the recent GDP print heads in a stagflationary direction relative to market expectations.

Upcoming Catalysts: China PMI (4/29); Euro CPI, Q1 GDP (4/30); FOMC, US Mfg PMI/ISM, ADP report, BoJ March minutes (5/1); US Durable Goods/Trade Balance, Euro Mfg PMI (5/2); US Payrolls, services PMI/ISM (5/3).

Cross-Asset Strategy

Economics

Despite US 1Q shortfall, raising DM GDP growth forecasts as US consumers and Europe surveys impress. Slower government spending growth and a rise in consumer energy prices contributed to a slowing in US growth last quarter but GDP details show the US expansion stands on strong footing and will remain a positive for global demand. A net trade drag related to a rebound in imports is a key contributor to the 1Q24 moderation. However, domestic final sales have been tracking a steady 3%ar gain in recent quarters, and the US consumer shook off large income drags from rising taxes and inflation last quarter as the household saving rate fell further. Rather than a source of concern, we view this fall as a reflection of healthy fundamentals as both wealth and labor income are rising at a strong pace. Accordingly, our US team raised its forecast for current quarter GDP growth to 2.5%ar.

Anticipation that a broadening in global growth would be accompanied by sticky inflation is the key to our high-for-long rates narrative, and there is now strong evidence that the global disinflation process has stalled. A US gap between core CPI and PCE inflation closed with both baskets rising at about a 4.5%ar in the first three months of the year. The Euro area saw a similar rebound in core inflation to a 3.8%ar. The early year inflation spike likely overstates its underlying trend, and we look for global core CPI to moderate to a 3.1%ar this quarter. Much of this slide should be concentrated in the DM economies.

BoJ signals it will remain gradual amid sluggish recovery. In last week’s BoJ policy meeting, Governor Ueda delivered dovish guidance. The BoJ adjusted its inflation forecasts to around 2% across all forecast periods and added some ambiguity in its guidance on JGB purchases, but did not commit to any immediate reduction to the pace of buying. We draw two messages from the meeting: 1) the BoJ will remain committed to gradualism as long as Japan’s macroeconomic outlook remains uncertain; 2) by downplaying the importance of the Bank’s commitment to maintaining the “current pace” of JGB purchases, we think the BoJ has introduced further flexibility into its balance sheet policy. We continue to think that the pace of future purchases will decelerate (GDW, Apr 26th).

Equities

Eurozone delivering on an improving risk-reward. At the overall market level, we remain concerned about the repeat of last summer’s drawdown, where the Growth-Policy tradeoff could move away from the Goldilocks narrative, together with a continued risk of concentration reversal, too steep projections for earnings acceleration this year, and position unwind. We don’t expect Eurozone to directionally decouple from the US, but we see an improved relative risk-reward for Eurozone equities versus the US due to: 1) The sector neutral P/E discount is near the largest pre COVID. Total equity yield vs bond yield is much more attractive in Eurozone than in the US. 2) ECB is set to start cutting ahead of the Fed, and by a greater magnitude, and PMI momentum is improving in Eurozone vs the US. 3) Tactically better China performance will help Eurozone vs the US trade. 4) The risk of extreme concentration and momentum unwind is much bigger in the US. Notably, small caps begin to perform better post the start of ECB cuts ( Equity Strategy , Apr 28 th ).

We are in the busiest weeks of the Q1 reporting season, with a third of companies having reported in both the US and in Europe, so far. S&P 500 Q1 ’24 blended EPS projections were cut by an additional 3% in the last month, and are not showing signs of a customary inflection higher as yet. This feeds into our concern that earnings estimates for this year are likely too high, and are at risk of further downgrades. 79% of S&P 500 companies that have reported beat EPS estimates. EPS growth for these companies is at +6% y/y, surprising positively by 8%. Top-line growth is printing at +3% y/y, surprising positively by 1% (Equity Strategy, Apr 25th).

We have come up with our Japan Core 30 Basket that we expect to outperform the market over the next 5-10 years. Japanese stocks have room to rise thanks to structural changes, but we think the market is in a stock selection phase. Using a bottom-up approach, we selected promising, future-oriented stocks in sectors where Japan has advantages and are plays on such themes as semiconductors and AI, automation and labor saving, digital, and decarbonization, which address such challenges as population decline (Japan Equity Strategy & Cross Sector, Apr 22nd).

Bonds

Bonds sold off again last week amid stronger than expected PMIs. In the US, the strong momentum in consumer spending prompted our economists to revise up 2Q24 growth to 2.5% annualized from 1.5%. Ahead of the FOMC meeting, we see Powell’s opening remarks echoing recent comments that 1Q24 data haven’t increased its confidence of getting back to its 2% target. While markets have priced out cuts and yields are trading cheap, we stay neutral on outright duration and prefer 5s/30s steepeners to position for eventual easing as well as higher term premia.

In the Euro area, stronger than expected domestic data contributed to the sell-off, though our economists expect the April inflation print to show continued disinflation. We retain a medium-term bullish view, but prefer proxies such as curve steepeners in 10s/15s Germany and 2Yx2Y/10Yx10Y EUR swaps and option structures such as Jun24 1Y Euribor midcurve call ladders. In the UK, yields are higher on a combination of MPC commentary and UK PMIs; we pare back bullish proxies and unwind Aug24/Nov24 MPC flatteners, but keep 1Y/1Yx1Y SONIA curve flatteners.

In EM, local yields now look cheap in much of Latam and EMEA EM after a sell-off, but risks remain binary ahead of coming CPI prints. As a result, we stay neutral local bond duration overall, with selective OWs via Brazil, Colombia, Uruguay, Czechia and Poland, offset by a short duration overlay and UW in Thailand (EM Fixed Income Focus, Apr 25th).

Credit

Despite broader market volatility, US HG spreads are still within 5bp of their YTD tight and are modestly tighter on the month. This is not to say HG has been completely immune to this volatility but thus far the resilient underlying technicals within HG are limiting its consequences to spreads. Namely, HG inflows have slowed significantly as rate vol has picked up and total return losses hover around -3% YTD, but on the flipside supply has also slowed significantly. In our view, there is good reason for HG to continue to outperform on a relative basis against a ‘higher for longer’ backdrop. The key risk of course is if this shifts to a discussion of the possibility of further rate hikes instead. In this scenario, we think the still strong HG technicals would likely weaken significantly (CMOS, Apr 26th).

We remain unenthusiastic about valuations, but with the strong technical only easing modestly, we lower our Euro HY spread target to 400bp. Euro HY credit spreads excluding the widest 10% of bonds have compressed below 300bp, a level that has rarely been breached since the GFC (European Credit Weekly, Apr 26th). European HY issuer net debt / EBITDA fell by 0.2x to 4.5x over 4Q23, reversing the first-half bounce in leverage. Adjusting for composition effects, earnings delivery was soft. Revenues and EBITDA declined 5% and 3%, and net debt increased 1.4% y/y, although gross debt fell by 0.5%. Interest coverage continued to moderate, dropping 0.25x in 4Q23 to 5.4x, with BBs seeing the fastest improvement (HY Talking Points, Apr 23rd).

Currencies

Grappling with a mature USD uptrend. The USD’s bull run is consolidating after a 3% surge since early March. Concerns around the outsized jump in IMM USD positions are valid, but the latter is loose as a contrarian USD signal. Of greater import, in our view, is the maturation of the monetary divergence narrative in US-RoW forward rate pricing. The neutralization of stark early ’24 asymmetry in USD rates/FX valuations and positioning is also running into a pivotal period of US dataflow that carries almost binary risks for the Fed cycle this year, leading us to tactically trim USD length. A dovish BOJ hold puts paid to hopes of a monetary policy short-circuit for Yen weakness, but intervention threat is likely to render USD/JPY buying a noisy proposition.

Trade Recommendations:Reduce USD longs via USD/CHF cash, but keep USD/CHF call spread. Enter NOK/SEK cash longs. Take-profit-stop hit in long SEK/CZK cash. Hold USD longs vs GBP, CAD, CNH, EUR into the FOMC meeting. Keep CHF/JPY digital put. Stay MW EM FX (FXMW, Apr 26th).

Commodities

Commodities are not a deflationary force any more. Commodities were responsible for ⅔ of the drop in the US headline CPI inflation from a peak of 9.1% in June 2022 to 3.4% in December 2023. In this sizeable 570bp fall in inflation, oil alone contributed a 300bp decline, with drop in agricultural prices delivering another 100bp. In a reversal of the trend, and directionally in line with our view, the broad commodity complex is up 8% from February lows and the rally may have another 10%+ to run. Our top 3 buy recommendations, in order: US HH natural gas, copper, and gold. Our base case on oil is unchanged, with a bullish risk bias. Six powerful structural shifts are likely behind the unfolding rally: 1) return of industrial policies, 2) rise of strategic stockpiling, 3) de-dollarization and the shift in gold’s ownership base, 4) race to secure 34 critical minerals, 5) AI demand for energy and metals, and 6) populism and breakdown in the theoretical project incentive model in copper (Global Commodities, Apr 25th).

Nearly all clients at CESCO Copper Week were structurally bullish copper over the medium-term, though near-term, there was still a sense that the current copper rally may be running ahead of the fundamental story. Chinese demand has clearly been dented by higher prices for now but most participants did not view it as symptomatic of a broader miscalculation on underlying Chinese end use, but rather a more temporary pause in purchasing with demand eventually acclimatizing to higher price levels. By 2028, we currently see a need for an additional 1.4 mmt of new copper supply. Last year, new project sanctions amounted to a measly ~350 kmt. Given the lead time necessary to even bring on more incremental capacity, we think we are in a critical window where time is running out to get projects going to avoid a serious shortfall in supply. Our view, which we sensed was in the back of many producers’ minds, is that in the absence of a stronger supply response, copper prices will search higher for a level where enough demand is destroyed in order to rebalance the market. In our current thinking, a price level around $14,000-15,000/mt likely incentivizes more significant substitution and accelerates copper intensity thrifting (Metals Weekly, Apr 24th).

JPM Clients’ View

Click here to take this week’s survey

This week, we poll investors on USD, Q1 earnings and the BoJ, in addition to our running survey questions on equity positioning/sentiment, and intentions for near-term changes to equity allocation and bond duration. The results from the last survey are shown below.1

Figure 1: What is your current equity positioning or sentiment in historical terms, expressed from most bearish (0th percentile) to most bullish (100th percentile)?

Source: J.P.Morgan

Figure 2: Are you more likely to increase or decrease equity exposure over the coming days/weeks?

Source: J.P. Morgan.

Figure 3: Are you more likely to increase or decrease bond portfolio duration over the coming days/weeks?

Source: J.P. Morgan.

Figure 4: Is the recent correction in risk assets likely to continue and, if so, how large of a drawdown do you ultimately expect on the S&P 500?

Source: J.P. Morgan.

Figure 5: What do you expect the VIX to average over the rest of Q2?

Source: J.P. Morgan.

Figure 6: Do you believe Fed hawkishness will cause a material growth drag in Emerging Markets?

Source: J.P. Morgan.

Figure 7: Do you expect Japan to intervene to support the Yen within the next few months?

Source: J.P. Morgan.

JPM Clients’ View - This Week’s Interim Survey Results

The charts below show interim results from this week’s survey, collected over the first ~24 hours it was live. The survey remains open here, and we will show updated results in the next J.P. Morgan View publication

Figure 8: What is your current equity positioning or sentiment in historical terms, expressed from most bearish (0th percentile) to most bullish (100th percentile)?

Source: J.P.Morgan

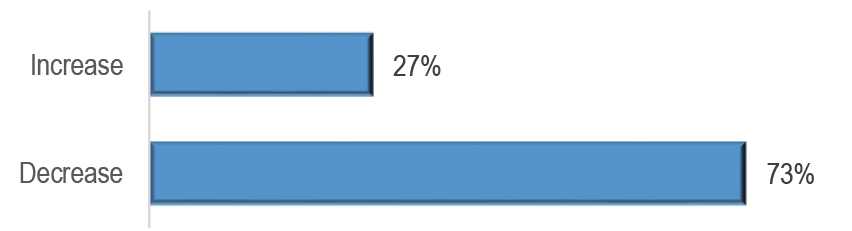
Figure 9: Are you more likely to increase or decrease equity exposure over the coming days/weeks?

Source: J.P. Morgan.

Figure 10: Are you more likely to increase or decrease bond portfolio duration over the coming days/weeks?

Source: J.P. Morgan.

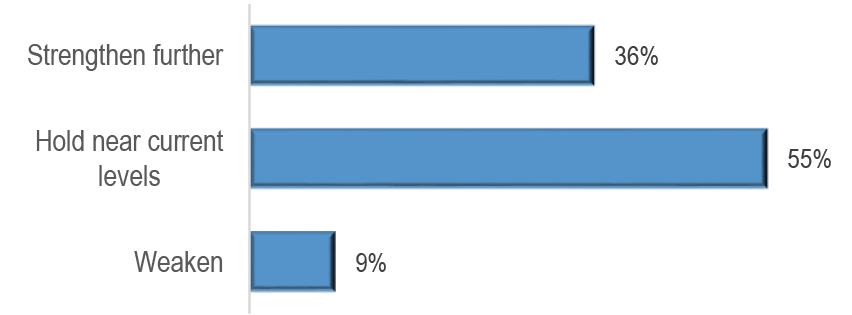
Figure 11: What do you expect the US dollar to do over the next 2-3 months?

Source: J.P. Morgan.

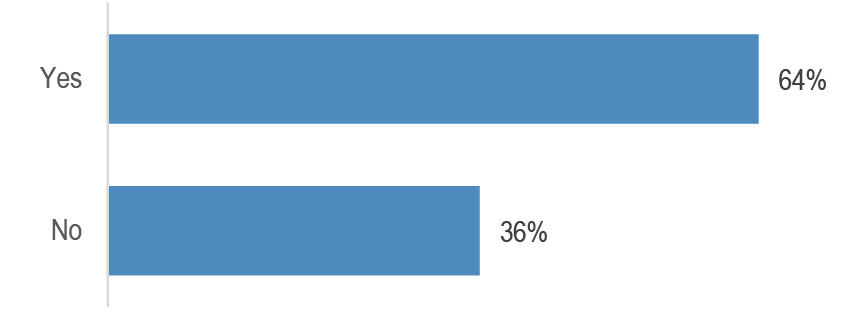
Figure 12: Do you believe dollar strength will be a headwind for risk assets this year?

Source: J.P. Morgan.

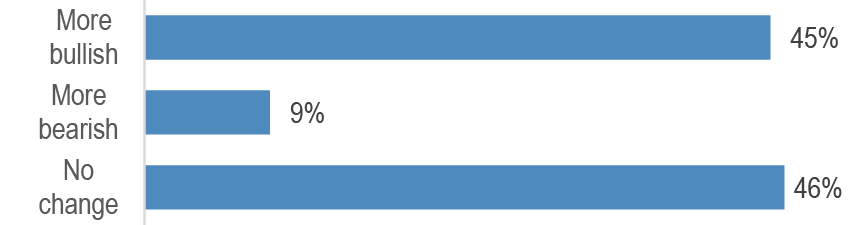
Figure 13: Have Q1 earnings announced so far made you more bullish or bearish on equities?

Source: J.P. Morgan.

Figure 14: When do you expect the BoJ will meaningfully reduce rinban purchases?

Source: J.P. Morgan.

Megacap rally masks ‘high for long’ worries

After the stock pullback in 1st half of April, efforts to stage a comeback seem to be stalling, with the recent GDP reading sending a message that was not well-received by the markets. If the hot prints YTD on growth and inflation have created worries about ‘high for long’, the hope for the ‘soft landing’ camp was that the disinflation would reassert itself, as the troublesome inflation components would settle down. In particular, rent inflation could head lower based on where the Zillow rent index is, and auto insurance can calm down on the assumption that additional upticks in insurance premiums would moderate, having largely caught up to the increase in claims post-COVID. So while the worry for risk markets is overheating that jeopardizes rate cutting, the recent GDP print, introduces a new worry, as US GDP grew 1.6% q/q saar in the first quarter of this year, significantly disappointing consensus expectations for a 2.5%ar gain and our own tracking of 2.3%ar. Meanwhile, the core PCE price index rose 3.7%ar in 1Q, which was notably firmer than the 2.0%ar pace of the prior two quarters. So, in contrast to the overheating story, this print heads into a stagflationary direction relative to market expectations. Our economists revised their 2Q estimates for US real GDP growth to 2.5% saar, up from 1.5%, so we continue to emphasize the associated ‘high for long’ risks.

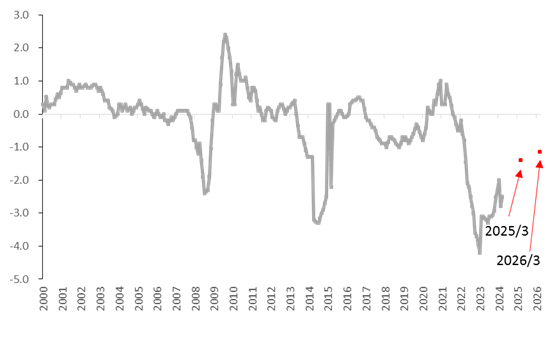
In Japan, the BoJ meeting produced no surprise. The BoJ decided to keep its policy rate unchanged at around 0-0.1%, while continuing asset purchases “in accordance with the decisions made at the March meeting”. At the March meeting, the BoJ stated that the bank would continue its JGB purchases “with broadly the same amount as before” and added in the footnote that “the amount of JGB purchases is currently about 6 trillion yen per month” as reference. Although the BoJ didn’t make a clear decision to reduce its JGB purchases, we believe this introduced some flexibility to the BoJ’s JGB purchases. Friday’s decision was broadly in line with our expectation. Currency markets found the BoJ outcome to be underwhelming, with USD/JPY rallying from ~155 to 157. Assuming the US exceptionalism continues, the direction of US yields should be the dominant force for USD/JPY, despite the looming threat of potential MoF intervention. Upside risks remain for USD/JPY since domestic JPY selling pressure is unlikely to wane so long as BoJ remains behind the curve ( Figure 15).

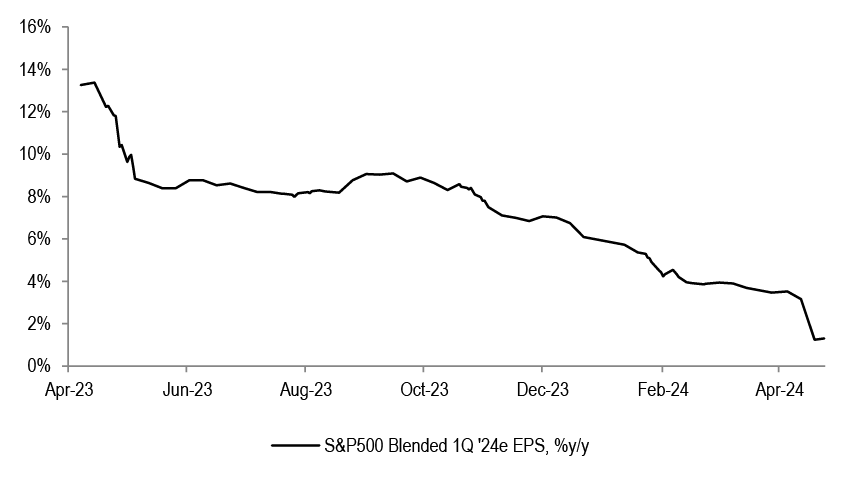
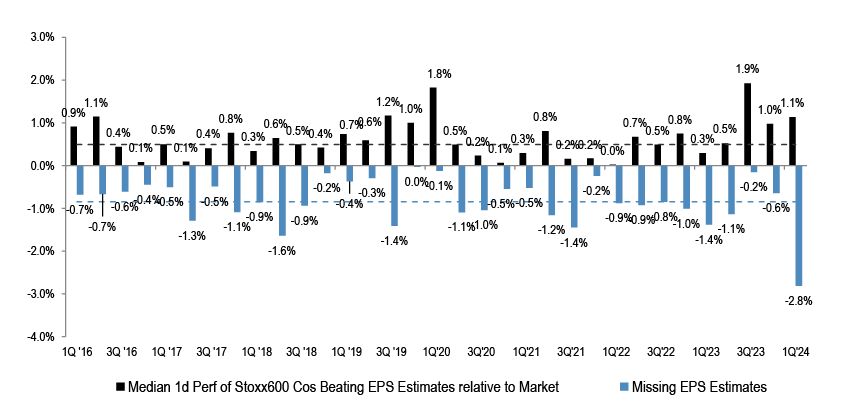
So far, we are not overly impressed with the earnings season. With ~42% of S&P 500 companies having reported, 75% are beating EPS estimates (vs. 73% average over the last 4Qs) by an average of 1.7%, while only 59% are beating revenue estimates (vs. 63% average) by an average of 0.5%. Additionally, the positive EPS surprise needs to be viewed in the context of the substantial downgrades to the S&P 500 blended Q1’24e EPS growth over the last few months ( Figure 16). Of the Stoxx600 companies that have reported so far, 54% beat EPS estimates. Q1 EPS growth is at -8% y/y, surprising positively by 2%. In Japan, 59% of Topix companies beat EPS estimates, with overall EPS growth at +1% y/y. Given the global stock rally leading up to the earnings season and the already stretched positioning, we believe stock reactions to the earnings season will continue to be underwhelming, with beats rewarded less, and misses penalized by more than usual ( Figure 17). In Europe, the sales beats are anemic relative to the history at 43%, and the reaction function for EPS misses is dramatically worse than we’ve seen in years ( Figure 18).

We continue to be UW Equities on the assumption that yields have finally reached a level where they are problematic. Equities looked the other way and produced a great Sharpe ratio from October to March, despite an 80bp uptick in yields. The combination of a hot CPI print and shift in the Fed’s tone upended the ‘bad news is good news’ narrative of 2024, as multiple strong CPI prints are no longer just ‘bumps in the road’. Given the April correction, we understand the temptation to play for a tactical bounce in equities, as technical signals like a high percentage of stocks at new lows suggest capitulation. In this case, the selling pressure could be exhausted and the time to the next print might allow for the soft landing / disinflation narrative to make a comeback, tempting some to ‘buy the dip’. However, allowing for further upside risk in yields, we can see a repeat of the mid-April correction so these tentative bottoming signals likely will not hold.

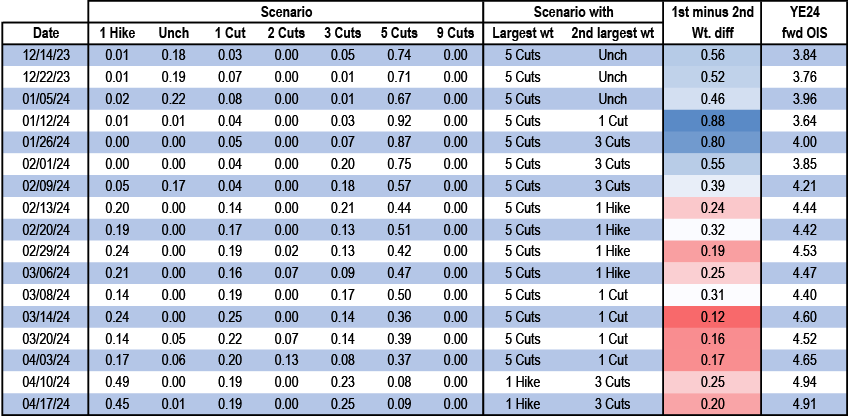
So, we would caution against buying the dip, as we are now facing two-sided risks on the rates path. The earlier conversation on the Fed trajectory during the soft landing narrative was relatively constrained, revolving around cuts coming a few months sooner or later. Despite rate cuts disappearing, we still seemed firmly in a world of more one-sided risk (how much cutting) and yield targets below the elevated levels after the bond correction of 2024. Now with only ~40bps of cuts priced to the end of the year, this modest amount of cutting is reflective not just of one dominant scenario, which had been for a long time 5 cuts, and now 1 hike indicates significant risk ( Figure 19). Our colleagues in Interest Rate Derivatives highlight this dramatic shift in regime as expressed in the options surface of December 2024 SOFR futures. The increase in policy uncertainty argues for a wider term premium. While our year-end target for the 10y is at 4.0%, the direction of travel for our yield targets and forecast revisions for growth and inflation has been positive. Digesting the incremental Treasury supply requires acceptable bond expected returns, and further upside risks to yields can bring us to the point where the price sensitive duration buyers demand more term premium for the new two-sided risks, and the higher yields likely will in turn choke equities.

If we can call the period from Fall ’22 a late-cycle meltup, one result of these periods would be a mediocre stock vs bond yield comparison and complacent risk. The stock vs bond risk premium comparison has tightened up due to the stock rally and ~500bps hiking from DM central backs. And the complacent risk environment was a reflection that growth risk had disappeared and that inflation was on a downward trend. In other words, the meager compensation from a tight risk premium is considered to be good enough in an environment where nothing is breaking. However, this tight risk premium likely is not sufficient when VIX leaves the comfortable channel between 13-15 it’s occupied since Fall 2023, and touches 19 as it did mid-April. We view this as a sign of things to come as complacency on ‘high for long’ goes away.  Given a strong day on Friday and VIX coming down, are we back to complacency? Consider that just four stocks (GOOGL, NVDA, MSFT and AMZN) account for ~80% of this rally, putting the AI / megacap theme ahead of ‘high for long’ worries.

Figure 15: Japan is likely to stay behind the curve for another 2 years without BoJ’s commitment to rate hikes...

Source: J.P. Morgan Currency Research, BoJ, Bloomberg Finance L.P

Figure 16: S&P 500 blended Q1 ’24e EPS, %y/y

Source: J.P. Morgan Equity Research, Thomson Reuters

Figure 17: US stock price reaction* to quarterly EPS beats/misses

Source: J.P. Morgan Equity Research, Bloomberg Finance L.P., *relative 1-day performance

Figure 18: Europe stock price reaction* to quarterly EPS beats/misses

Source: J.P. Morgan Equity Research, Bloomberg Finance L.P., *relative 1-day performance

Figure 19: Policy Uncertainty ticks up as 1 Hike scenario gains prominence

Weights for conditional Normal distributions* that can be combined to create a composite distribution that recovers prices of SFRZ4 calls and puts at various strikes**, scenarios with largest weights, the weight differential between the two scenarios with the largest weights, and 12/31/2024x1M OIS rate (%), as of the dates shown

Source: J.P. Morgan., CME *1 hike scenario corresponds to mean of 5.5%, unchanged corresponds to a mean of 5.25%, 1 cut corresponds to mean of 5%, 2 cuts corresponds to mean of 4.75%, 3 cuts corresponds to mean of 4.5%, 5 cuts corresponds to mean of 4% and 9 cuts corresponds to mean of 3% **Implied distribution is assumed to take the form of a weighted sum of many individual Gaussian density functions with various different means and standard deviations. The weights are solved for by calibrating to the prices of 3M SOFR ATM and OTM calls and puts, while also recovering the SFRZ4 futures price

Global Research Digest

Macro & Cross-Asset Views

Top 10 Macro Takeaways: 2024 IMF/World Bank Spring Meetings: US exceptionalism holds alongside a new fiscal regime, Joyce Chang

Investors have moved to a consensus around a high-for-longer soft landing, with a view that restrictive for longer will not morph into even higher for longer. Macro and geopolitical risks do not appear imminent, and the meetings were noteworthy for the sanguine tone and the greater acknowledgement on the positive role of fiscal policy in the global recovery. Inter-connectedness between the actors in private credit is a key risk to monitor, but demand is unlikely to abate. Top trade ideas include UW equities as there is a risk of a 5-10% pullback that would erase this year’s gains, OW cash with US rates at 5%, OW Commodities (gold and energy equally) and short Yen.

2024 US Election Watch: Biden vs. Trump Redux: Macro and foreign policy implications and key risks to monitor, Joyce Chang and Amy Ho

Investors remain sanguine about the market implications for the US elections, with only 12% of survey respondents at our conferences seeing US elections as the biggest threat to risk markets, far behind concerns on resurgent inflation (30%) and geopolitical turmoil. Survey respondents did not indicate a clear bias on who will assume the US presidency although 70% of investors expect a divided Congress to endure. Irrespective of a Biden or Trump victory, we expect greater use of industrial policy including strong support for the passage of a CHIPS 2.0 Act in 2025.

Equity Strategy: USD, bond yields, oil and concentration all showing elevated risks remains a problematic backdrop, Mislav Matejka, CFA

We do not think that P/Es can drive further equity upside without the support of earnings upgrades. Investors are expecting S&P 500 EPS to accelerate by almost 20% by Q4 compared to the projected Q1 ’24 levels. That hurdle rate is too steep in our opinion. We remain concerned about continued complacency in equity valuations, inflation staying too hot, further Fed repricing, rates moving higher for the “wrong reasons”, about profit outlook where the implied acceleration this year might end up too optimistic, high market concentration, as well as about the potential further escalation in geopolitical uncertainty.

Flows & Liquidity: Renminbi internationalisation gathers pace, Nikolaos Panigirtzoglou

Despite recent portfolio inflows foreign investors have become even more under-owned in Chinese onshore bonds compared to onshore equities. Different to the foreign ownership of Chinese onshore portfolio assets, the internationalisation of the Renminbi has re-accelerated in recent years, in part due to rising trade redenomination. This trade redenomination has been facilitated by the Belt and Road initiative, China’s growing role in energy and commodity trade as well as digital innovations in RMB-denominated trade finance and payments infrastructure.

Global Economics

Riders on the storm: Debt servicing unfazed by high rates, Joseph Lupton

Despite US mortgage rates having soared 295bp since the start of the Fed’s hiking cycle in 1Q22, US household debt servicing ratios have barely budged. As of 4Q23, the DSR remained below its pre-pandemic level. In this note, we show that the sluggish move in DSRs owes to three factors: extended duration and stable labor markets, a decade of leveraging, and nominal income gains ease the burden. The upshot is that even while debt servicing costs have risen, the impact has been more muted given healthy balance sheets and when looked at as a share of income.

US: The newfound business dynamism, Murat Tasci

We find limited evidence that long-run drivers of new business formation, namely population growth and import competition, changed drastically in the post-pandemic recovery. The recent surge in immigration, if it continues, could provide some boost for business formation, but secular forces are strongly in the opposite direction. Instead, we find plenty of evidence that this recent surge is related to a reshuffling of economic activity with a higher share of the workforce working from home. As the labor market finds its new equilibrium with a higher number of workers commuting less, the main impetus behind this newfound business dynamism will likely fade.

Tariffs and friendshoring: US-M-C-A trade flows, Tingting Ge

The risk of a renewed US-China tariff war is at the center of market focus and recent developments likely will accelerate the emergence of new trade corridors amid costly adjustment in global supply chains. US reliance on Chinese imports fell, benefiting ASEAN and Mexico. China lost US market share in ICT, critical minerals and energy products, but is still a key supplier in computer, smartphones, large-capacity batteries, nickel, and hydroxides. China increased ODI to ASEAN and Mexico to bypass tariff hikes and friendshoring constraint. A 60% universal tariff would accelerate supply chain relocation and disrupt trading patterns.

Global Market Implications

Global Commodities: Not a deflationary force any more, Natasha Kaneva

Although we still very much like gold as a structural multi-year bullish story with an updated price forecast of $2,600/oz, after two years at the top of the pecking order, from here, gold is replaced by US HH natural gas as our #1 buy recommendation. We believe no other commodity can match its return potential this year. Copper is our #2 buy recommendation. Gold’s structural bull case remains intact making it our #3 buy recommendation with a peak target of $2,600/oz. In this note, we highlight six powerful structural shifts that are likely behind the unfolding rally, along with an optimistic macro narrative.

Curveball: HG Credit Curve Opportunities: 3s5s curve at its steepest YTD, 5s10s the flattest in almost 3 months, Eric Beinstein

We introduce a new report designed to highlight spread curve opportunities in the HG corporate bond market. The report identifies liquid bond pairs which are trading at the extremes of their usual trading ranges and also which have flattened/steepened the most WoW. It also details each liquid bond pair’s spread difference, where this difference stands in its 6m range and shows how steep/flat the pair is versus the overall curve. Lastly, it shows the relationship between sector curves and their spreads.

Japan Equity Strategy & Cross Sector: J.P. Morgan Japan Core 30 Basket, Rie Nishihara

We have come up with our Japan Core 30 Basket that we expect to outperform the market over the next five to 10 years. Japanese stocks have room to rise thanks to structural changes, but we think the market is in a stock selection phase. Using a bottom-up approach, we selected promising, future-oriented stocks in sectors where Japan has advantages and are plays on such themes as semiconductors and AI, automation and labor saving, digital, and decarbonization, which address such challenges as population decline. Note: J.P. Morgan Research does not provide research coverage of this basket and investors should not expect continuous analysis or additional reports relating to it.

Emerging Market Corporates: What is and isn’t in the $2.5tn EM corporate external bond asset class? Defining the scope and boundaries, Yang-Myung Hong

The EM corporate external bond asset class across corporates and quasi-sovereigns is $2.5tn in size, having exceeded the $1tn milestone reached in 2012 and $2tn in 2017. The current size of EM corporate external bonds is well above US HY ($1.3tn) and EM external sovereign bonds ($1.5tn). A frequently asked question is what we define as the EM external corporate bond asset class and how we apply the criteria in what to include or not. In this note, we go over our thought process behind such classification and explore the evolution.

Sector-Level Views

Vertiv: 1Q Wrap: The Demand Inflection Has Arrived, Significant Opportunity Still Ahead, C. Stephen Tusa, Jr CFA

The VRT print was a strong, upside result, highlighted by 60% orders growth and 62% incremental margins, well above the most bullish outlooks, and we come away raising our above-consensus estimates further, with increased conviction that these remain conservatively based. Management also noted accelerating demand on the back of a strong data center market, in which they remain uniquely well positioned to capitalize.

First Principles – GES / EU Oils: LNG deep dive; The superior gas molecule for optimisation and coal/gas upside; OW Shell stands out, Christyan F Malek

We undertake a First Principles deep dive of the global LNG value chain and assess key EU Majors producers on a five metric JPM LNG Scorecard. We highlight infrastructure limitations and price, LNG’s capacity to optimise margins against price/time spread fluctuations and LNG as a domain of the large-cap Majors.

China Tanker Shipping: A perfect storm brewing with a multi-year upcycle: initiate on CMES (OW), CSET-H (OW), CSET-A (N), Shawn Ng Jun Jie

The tanker shipping sector (both product and crude) looks set for an extended upcycle led by structural ton-mile demand growth and constrained supply growth.

Despite decent price performance YTD, the stocks are still at 0.9-1.7x FY24-25 average P/B (JPMe), which is undemanding and in our view does not fully price-in further tanker freight rate spikes driven by any further escalation of the Red Sea crisis and the Middle East situation.

Strategy & Forecasts

GAA Long-Only Model Portfolio

Equity sector recommendations and YTD returns

Source: J. P. Morgan, Bloomberg Finance L.P.

JPM Forecasts

Source: J.P. Morgan, Bloomberg Finance L.P., Datastream.

  1. 1 Results are based on 34 responses received from clients in our survey conducted Apr 22-29th

Correction: Update: Survey results added on page 5.

Companies Discussed in This Report (all prices in this report as of market close on 30 April 2024, unless otherwise indicated)COSCO Shipping Energy Transport - A(600026.SS/Rmb15.93/N), COSCO Shipping Energy Transport - H(1138.HK/HK$9.21/OW), China Merchants Energy Shipping - A(601872.SS/Rmb8.53/OW), Shell PLC(SHEL.L/2,863p/OW), Vertiv(VRT/$93.00/OW)

Disclosures

Analyst Certification: The Research Analyst(s) denoted by an “AC” on the cover of this report certifies (or, where multiple Research Analysts are primarily responsible for this report, the Research Analyst denoted by an “AC” on the cover or within the document individually certifies, with respect to each security or issuer that the Research Analyst covers in this research) that: (1) all of the views expressed in this report accurately reflect the Research Analyst’s personal views about any and all of the subject securities or issuers; and (2) no part of any of the Research Analyst's compensation was, is, or will be directly or indirectly related to the specific recommendations or views expressed by the Research Analyst(s) in this report. For all Korea-based Research Analysts listed on the front cover, if applicable, they also certify, as per KOFIA requirements, that the Research Analyst’s analysis was made in good faith and that the views reflect the Research Analyst’s own opinion, without undue influence or intervention.

All authors named within this report are Research Analysts who produce independent research unless otherwise specified. In Europe, Sector Specialists (Sales and Trading) may be shown on this report as contacts but are not authors of the report or part of the Research Department.

Research excerpts: This material may include excerpts from previously published reports. For access to the full reports, including analyst certification and important disclosures, please contact your sales representative or the covering analyst’s team, or visit https://www.jpmorganmarkets.com.

Other Disclosure : A contributor to this report has a household member who is a senior portfolio manager of and investor in certain emerging markets mutual funds, which may invest in instruments discussed in this report.

Important Disclosures

  • Market Maker/ Liquidity Provider: J.P. Morgan is a market maker and/or liquidity provider in the financial instruments of/related to China Merchants Energy Shipping - A, COSCO Shipping Energy Transport - A, COSCO Shipping Energy Transport - H, Shell PLC, Vertiv.
  • Market Maker/ Liquidity Provider (Hong Kong): J.P. Morgan Securities (Asia Pacific) Limited and/or J.P. Morgan Broking (Hong Kong) Limited and/or an affiliate is a market maker and/or liquidity provider in the securities of COSCO Shipping Energy Transport - A, COSCO Shipping Energy Transport - H and/or warrants or options thereon, which are listed or traded on The Stock Exchange of Hong Kong Limited.
  • Client: J.P. Morgan currently has, or had within the past 12 months, the following entity(ies) as clients: China Merchants Energy Shipping - A, COSCO Shipping Energy Transport - A, COSCO Shipping Energy Transport - H, Shell PLC, Vertiv.
  • Client/Investment Banking: J.P. Morgan currently has, or had within the past 12 months, the following entity(ies) as investment banking clients: Shell PLC, Vertiv.
  • Client/Non-Investment Banking, Securities-Related: J.P. Morgan currently has, or had within the past 12 months, the following entity(ies) as clients, and the services provided were non-investment-banking, securities-related: COSCO Shipping Energy Transport - A, COSCO Shipping Energy Transport - H, Shell PLC, Vertiv.
  • Client/Non-Securities-Related: J.P. Morgan currently has, or had within the past 12 months, the following entity(ies) as clients, and the services provided were non-securities-related: Shell PLC, Vertiv.
  • Investment Banking Compensation Received: J.P. Morgan has received in the past 12 months compensation for investment banking services from Shell PLC, Vertiv.
  • Potential Investment Banking Compensation: J.P. Morgan expects to receive, or intends to seek, compensation for investment banking services in the next three months from Shell PLC, Vertiv.
  • Non-Investment Banking Compensation Received: J.P. Morgan has received compensation in the past 12 months for products or services other than investment banking from COSCO Shipping Energy Transport - A, COSCO Shipping Energy Transport - H, Shell PLC, Vertiv.
  • Debt Position: J.P. Morgan may hold a position in the debt securities of China Merchants Energy Shipping - A, COSCO Shipping Energy Transport - A, COSCO Shipping Energy Transport - H, Shell PLC, Vertiv, if any.
  • J.P. Morgan is acting as Equity Advisor / Corporate Broker to Shell Plc.

Company-Specific Disclosures: Important disclosures, including price charts and credit opinion history tables, are available for compendium reports and all J.P. Morgan–covered companies, and certain non-covered companies, by visiting https://www.jpmm.com/research/disclosures, calling 1-800-477-0406, or e-mailing research.disclosure.inquiries@jpmorgan.com with your request.

Date Rating Price (Rmb) Price Target (Rmb)
23-Apr-24 OW 8.79 11
Date Rating Price (Rmb) Price Target (Rmb)
23-Apr-24 N 16.51 18
Date Rating Price (HK$) Price Target (HK$)
23-Apr-24 OW 8.70 12
Date Rating Price (p) Price Target (p)
06-Jul-21 OW 1490 2,200
17-Sep-21 OW 1464 2,100
23-Sep-21 OW 1518 2,150
11-Oct-21 OW 1709 2,300
15-Nov-21 NR 1641 --
14-Jan-22 OW 1806 2,500
10-Mar-22 OW 2004 2,600
30-Mar-22 OW 2022 2,700
19-Apr-22 OW 2192 2,850
15-Jul-22 OW 1936 3,000
13-Oct-22 OW 2269 2,900
02-Dec-22 OW 2382 2,950
24-Feb-23 OW 2482 3,000
19-Apr-23 OW 2468 2,950
19-Jul-23 OW 2322 2,750
22-Sep-23 OW 2596 3,200
20-Oct-23 OW 2758 3,250
08-Dec-23 OW 2481 3,350
Date Rating Price ($) Price Target ($)
13-Sep-21 N 24.53 25
04-Oct-21 N 24.54 29
01-Apr-22 OW 14.00 18
07-Jul-22 OW 8.64 14
12-Jan-23 OW 14.64 16
22-Feb-23 OW 15.26 19
02-Aug-23 OW 26.53 35
06-Oct-23 OW 38.18 43
26-Oct-23 OW 37.39 45
30-Nov-23 OW 42.29 48
13-Feb-24 OW 61.32 53
22-Feb-24 OW 58.55 65
11-Apr-24 OW 84.77 95
24-Apr-24 OW 79.17 100

The chart(s) show J.P. Morgan's continuing coverage of the stocks; the current analysts may or may not have covered it over the entire period. J.P. Morgan ratings or designations: OW = Overweight, N= Neutral, UW = Underweight, NR = Not Rated

Explanation of Equity Research Ratings, Designations and Analyst(s) Coverage Universe: J.P. Morgan uses the following rating system: Overweight (over the duration of the price target indicated in this report, we expect this stock will outperform the average total return of the stocks in the Research Analyst’s, or the Research Analyst’s team’s, coverage universe); Neutral (over the duration of the price target indicated in this report, we expect this stock will perform in line with the average total return of the stocks in the Research Analyst’s, or the Research Analyst’s team’s, coverage universe); and Underweight (over the duration of the price target indicated in this report, we expect this stock will underperform the average total return of the stocks in the Research Analyst’s, or the Research Analyst’s team’s, coverage universe. NR is Not Rated. In this case, J.P. Morgan has removed the rating and, if applicable, the price target, for this stock because of either a lack of a sufficient fundamental basis or for legal, regulatory or policy reasons. The previous rating and, if applicable, the price target, no longer should be relied upon. An NR designation is not a recommendation or a rating. In our Asia (ex-Australia and ex-India) and U.K. small- and mid-cap Equity Research, each stock’s expected total return is compared to the expected total return of a benchmark country market index, not to those Research Analysts’ coverage universe. If it does not appear in the Important Disclosures section of this report, the certifying Research Analyst’s coverage universe can be found on J.P. Morgan’s Research website, https://www.jpmorganmarkets.com.

J.P. Morgan Equity Research Ratings Distribution, as of April 06, 2024

Overweight(buy) Neutral(hold) Underweight(sell)
J.P. Morgan Global Equity Research Coverage* 48% 39% 14%
    IB clients** 49% 45% 35%
JPMS Equity Research Coverage* 46% 42% 12%
    IB clients** 70% 66% 52%

*Please note that the percentages may not add to 100% because of rounding.**Percentage of subject companies within each of the "buy," "hold" and "sell" categories for which J.P. Morgan has provided investment banking services within the previous 12 months. For purposes of FINRA ratings distribution rules only, our Overweight rating falls into a buy rating category; our Neutral rating falls into a hold rating category; and our Underweight rating falls into a sell rating category. Please note that stocks with an NR designation are not included in the table above. This information is current as of the end of the most recent calendar quarter.

Equity Valuation and Risks: For valuation methodology and risks associated with covered companies or price targets for covered companies, please see the most recent company-specific research report at http://www.jpmorganmarkets.com, contact the primary analyst or your J.P. Morgan representative, or email research.disclosure.inquiries@jpmorgan.com. For material information about the proprietary models used, please see the Summary of Financials in company-specific research reports and the Company Tearsheets, which are available to download on the company pages of our client website, http://www.jpmorganmarkets.com. This report also sets out within it the material underlying assumptions used.

A history of J.P. Morgan investment recommendations disseminated during the preceding 12 months can be accessed on the Research & Commentary page of http://www.jpmorganmarkets.com where you can also search by analyst name, sector or financial instrument.

Vertiv - J.P. Morgan Credit Opinion History

Date Action Rating/Designation Ticker/ISIN
Issuer 17 Dec 21 Initiate Overweight VRT
4.125% 1L Sr. Notes due 2028 * 17 Dec 21 Initiate Overweight US92535UAB08
L+275 Term Loan B due 2027 17 Dec 21 Initiate Overweight

*Indicates representative/primary bond/instrument.

The table(s) above show the recommendation changes made by J.P. Morgan Credit Research Analysts in the subject company and/or instruments over the past three years (or, if no recommendation changes were made during that period, the most recent change). Notes: Effective April 11, 2016, J.P. Morgan changed its Credit Research Ratings System. Please see the Explanation of Credit Research Ratings below for the new definitions. The previous rating system no longer should be relied upon. For the history prior to April 11, 2016, please call 1-800-447-0406 or e-mail research.disclosure.inquiries@jpmorgan.com.

Explanation of Emerging Markets Sovereign Research Ratings System and Valuation & Methodology: Ratings System : J.P. Morgan uses the following issuer portfolio weightings for Emerging Markets Sovereign Research: Overweight (over the next three months, the recommended risk position is expected to outperform the relevant index, sector, or benchmark credit returns); Marketweight (over the next three months, the recommended risk position is expected to perform in line with the relevant index, sector, or benchmark credit returns); and Underweight (over the next three months, the recommended risk position is expected to underperform the relevant index, sector, or benchmark credit returns). NR is Not Rated. In this case, J.P. Morgan has removed the rating for this security because of either legal, regulatory or policy reasons or because of lack of a sufficient fundamental basis. The previous rating no longer should be relied upon. An NR designation is not a recommendation or a rating. NC is Not Covered. An NC designation is not a rating or a recommendation. Recommendations will be at the issuer level, and an issuer recommendation applies to all of the index-eligible bonds at the same level for the issuer. When we change the issuer-level rating, we are changing the rating for all of the issues covered, unless otherwise specified. Ratings for quasi-sovereign issuers in the EMBIG may differ from the ratings provided in EM corporate coverage. Valuation & Methodology : For J.P. Morgan's Emerging Markets Sovereign Research, we assign a rating to each sovereign issuer (Overweight, Marketweight or Underweight) based on our view of whether the combination of the issuer’s fundamentals, market technicals, and the relative value of its securities will cause it to outperform, perform in line with, or underperform the credit returns of the EMBIGD index over the next three months. Our view of an issuer’s fundamentals includes our opinion of whether the issuer is becoming more or less able to service its debt obligations when they become due and payable, as well as whether its willingness to service debt obligations is increasing or decreasing.

J.P. Morgan Emerging Markets Sovereign Research Ratings Distribution, as of April 6, 2024

Overweight(buy) Marketweight(hold) Underweight(sell)
Global Sovereign Research Universe* 12% 82% 6%
    IB clients** 13% 50% 75%

*Please note that the percentages may not add to 100% because of rounding. **Percentage of subject issuers within each of the "Overweight, "Marketweight" and "Underweight" categories for which J.P. Morgan has provided investment banking services within the previous 12 months. For purposes of FINRA ratings distribution rules only, our Overweight rating falls into a buy rating category; our Marketweight rating falls into a hold rating category; and our Underweight rating falls into a sell rating category. The Emerging Markets Sovereign Research Rating Distribution is at the issuer level. Issuers with an NR or an NC designation are not included in the table above. This information is current as of the end of the most recent calendar quarter.

Explanation of Credit Research Valuation Methodology, Ratings and Risk to Ratings: J.P. Morgan uses a bond-level rating system that incorporates valuations (relative value) and our fundamental view on the security. Our fundamental credit view of an issuer is based on the company's underlying credit trends, overall creditworthiness and our opinion on whether the issuer will be able to service its debt obligations when they become due and payable. We analyze, among other things, the company's cash flow capacity and trends and standard credit ratios, such as gross and net leverage, interest coverage and liquidity ratios. We also analyze profitability, capitalization and asset quality, among other variables, when assessing financials. Analysts also rate the issuer, based on the rating of the benchmark or representative security. Unless we specify a different recommendation for the company’s individual securities, an issuer recommendation applies to all of the bonds at the same level of the issuer’s capital structure. We may also rate certain loans and preferred securities, as applicable. This report also sets out within it the material underlying assumptions used. We use the following ratings for bonds (issues), issuers, loans, and preferred securities: Overweight (over the next three months, the recommended risk position is expected to outperform the relevant index, sector, or benchmark); Neutral (over the next three months, the recommended risk position is expected to perform in line with the relevant index, sector, or benchmark); and Underweight (over the next three months, the recommended risk position is expected to underperform the relevant index, sector, or benchmark). J.P. Morgan Emerging Markets Sovereign Research uses Marketweight, which is equivalent to Neutral. NR is Not Rated. In this case, J.P. Morgan has removed the rating for this particular security or issuer because of either a lack of a sufficient fundamental basis or for legal, regulatory or policy reasons. The previous rating no longer should be relied upon. An NR designation is not a recommendation or a rating. NC is Not Covered. An NC designation is not a rating or a recommendation. For CDS, we use the following rating system: Long Risk (over the next three months, the credit return on the recommended position is expected to exceed the relevant index, sector or benchmark); Neutral (over the next three months, the credit return on the recommended position is expected to match the relevant index, sector or benchmark); and Short Risk (over the next three months, the credit return on the recommended position is expected to underperform the relevant index, sector or benchmark).

J.P. Morgan Credit Research Ratings Distribution, as of April 06, 2024

Overweight(buy) Neutral(hold) Underweight(sell)
Global Credit Research Universe* 27% 56% 17%
    IB clients** 65% 59% 63%

*Please note that the percentages may not add to 100% because of rounding.**Percentage of subject companies within each of the "Overweight," "Neutral" and "Underweight" categories for which J.P. Morgan has provided investment banking services within the previous 12 months.For purposes of FINRA ratings distribution rules only, our Overweight rating falls into a buy rating category; our Neutral rating falls into a hold rating category; and our Underweight rating falls into a sell rating category. The Credit Research Rating Distribution is at the issuer level. Issuers with an NR or an NC designation are not included in the table above. This information is current as of the end of the most recent calendar quarter.

Analysts' Compensation: The research analysts responsible for the preparation of this report receive compensation based upon various factors, including the quality and accuracy of research, client feedback, competitive factors, and overall firm revenues.

Registration of non-US Analysts: Unless otherwise noted, the non-US analysts listed on the front of this report are employees of non-US affiliates of J.P. Morgan Securities LLC, may not be registered as research analysts under FINRA rules, may not be associated persons of J.P. Morgan Securities LLC, and may not be subject to FINRA Rule 2241 or 2242 restrictions on communications with covered companies, public appearances, and trading securities held by a research analyst account.

Company-Specific Disclosures: Important disclosures, including price charts and credit opinion history tables, are available for compendium reports and all J.P. Morgan–covered companies, and certain non-covered companies, by visiting https://www.jpmm.com/research/disclosures, calling 1-800-477-0406, or e-mailing research.disclosure.inquiries@jpmorgan.com with your request.

Other Disclosures

J.P. Morgan is a marketing name for investment banking businesses of JPMorgan Chase & Co. and its subsidiaries and affiliates worldwide.

UK MIFID FICC research unbundling exemption: UK clients should refer to UK MIFID Research Unbundling exemption for details of J.P. Morgan’s implementation of the FICC research exemption and guidance on relevant FICC research categorisation.

QIB Only

All research material made available to clients are simultaneously available on our client website, J.P. Morgan Markets, unless specifically permitted by relevant laws. Not all research content is redistributed, e-mailed or made available to third-party aggregators. For all research material available on a particular stock, please contact your sales representative.

Any long form nomenclature for references to China; Hong Kong; Taiwan; and Macau within this research material are Mainland China; Hong Kong SAR (China); Taiwan (China); and Macau SAR (China).

J.P. Morgan Research may, from time to time, write on issuers or securities targeted by economic or financial sanctions imposed or administered by the governmental authorities of the U.S., EU, UK or other relevant jurisdictions (Sanctioned Securities). Nothing in this report is intended to be read or construed as encouraging, facilitating, promoting or otherwise approving investment or dealing in such Sanctioned Securities. Clients should be aware of their own legal and compliance obligations when making investment decisions.

Any digital or crypto assets discussed in this research report are subject to a rapidly changing regulatory landscape. For relevant regulatory advisories on crypto assets, including bitcoin and ether, please see https://www.jpmorgan.com/disclosures/cryptoasset-disclosure.

An analyst listed on the front cover has personal holdings in digital or crypto assets.

The author(s) of this research report may not be licensed to carry on regulated activities in your jurisdiction and, if not licensed, do not hold themselves out as being able to do so.

Exchange-Traded Funds (ETFs): J.P. Morgan Securities LLC (“JPMS”) acts as authorized participant for substantially all U.S.-listed ETFs. To the extent that any ETFs are mentioned in this report, JPMS may earn commissions and transaction-based compensation in connection with the distribution of those ETF shares and may earn fees for performing other trade-related services, such as securities lending to short sellers of the ETF shares. JPMS may also perform services for the ETFs themselves, including acting as a broker or dealer to the ETFs. In addition, affiliates of JPMS may perform services for the ETFs, including trust, custodial, administration, lending, index calculation and/or maintenance and other services.

Options and Futures related research: If the information contained herein regards options- or futures-related research, such information is available only to persons who have received the proper options or futures risk disclosure documents. Please contact your J.P. Morgan Representative or visit https://www.theocc.com/components/docs/riskstoc.pdf for a copy of the Option Clearing Corporation's Characteristics and Risks of Standardized Options or http://www.finra.org/sites/default/files/Security_Futures_Risk_Disclosure_Statement_2018.pdf for a copy of the Security Futures Risk Disclosure Statement.

Changes to Interbank Offered Rates (IBORs) and other benchmark rates: Certain interest rate benchmarks are, or may in the future become, subject to ongoing international, national and other regulatory guidance, reform and proposals for reform. For more information, please consult: https://www.jpmorgan.com/global/disclosures/interbank_offered_rates

Notification for Credit Ratings: If this material includes credit ratings, such credit ratings provided by Japan Credit Rating Agency, Ltd. (JCR) and Rating and Investment Information, Inc. (R&I), are credit ratings provided by Registered Credit Rating Agencies (credit rating agencies registered under the Financial Instruments and Exchange Law of Japan (FIEL)). With respect to credit ratings that are provided by credit rating agencies other than JCR and R&I and have no stipulation that such credit ratings are provided by Registered Credit Rating Agencies, this means that such credit ratings are Non Registered Ratings (credit ratings provided by credit rating agencies not registered under the FIEL). Among the Non Registered Ratings, with respect to those credit ratings provided by S&P Global Ratings (S&P), Moody’s Investors Service (Moody’s), or Fitch Ratings (Fitch), prior to making investment decision based on such Non Registered Ratings, please carefully read the “Explanation Letter regarding Non Registered Ratings” for the corresponding credit rating agency, which we separately have sent or will send.

Private Bank Clients: Where you are receiving research as a client of the private banking businesses offered by JPMorgan Chase & Co. and its subsidiaries (“J.P. Morgan Private Bank”), research is provided to you by J.P. Morgan Private Bank and not by any other division of J.P. Morgan, including, but not limited to, the J.P. Morgan Corporate and Investment Bank and its Global Research division.

Legal entity responsible for the production and distribution of research: The legal entity identified below the name of the Reg AC Research Analyst who authored this material is the legal entity responsible for the production of this research. Where multiple Reg AC Research Analysts authored this material with different legal entities identified below their names, these legal entities are jointly responsible for the production of this research. Research Analysts from various J.P. Morgan affiliates may have contributed to the production of this material but may not be licensed to carry out regulated activities in your jurisdiction (and do not hold themselves out as being able to do so). Unless otherwise stated below, this material has been distributed by the legal entity responsible for production. If you have any queries, please contact the relevant Research Analyst in your jurisdiction or the entity in your jurisdiction that has distributed this research material.

Legal Entities Disclosures and Country-/Region-Specific Disclosures: Argentina: JPMorgan Chase Bank N.A Sucursal Buenos Aires is regulated by Banco Central de la República Argentina (“BCRA”- Central Bank of Argentina) and Comisión Nacional de Valores (“CNV”- Argentinian Securities Commission - ALYC y AN Integral N°51). Australia: J.P. Morgan Securities Australia Limited (“JPMSAL”) (ABN 61 003 245 234/AFS Licence No: 238066) is regulated by the Australian Securities and Investments Commission and is a Market Participant of ASX Limited, a Clearing and Settlement Participant of ASX Clear Pty Limited and a Clearing Participant of ASX Clear (Futures) Pty Limited. This material is issued and distributed in Australia by or on behalf of JPMSAL only to "wholesale clients" (as defined in section 761G of the Corporations Act 2001). A list of all financial products covered can be found by visiting https://www.jpmm.com/research/disclosures. J.P. Morgan seeks to cover companies of relevance to the domestic and international investor base across all Global Industry Classification Standard (GICS) sectors, as well as across a range of market capitalisation sizes. If applicable, in the course of conducting public side due diligence on the subject company(ies), the Research Analyst team may at times perform such diligence through corporate engagements such as site visits, discussions with company representatives, management presentations, etc. Research issued by JPMSAL has been prepared in accordance with J.P. Morgan Australia’s Research Independence Policy which can be found at the following link: J.P. Morgan Australia - Research Independence Policy. Brazil : Banco J.P. Morgan S.A. is regulated by the Comissao de Valores Mobiliarios (CVM) and by the Central Bank of Brazil. Ombudsman J.P. Morgan: 0800-7700847 / 0800-7700810 (For Hearing Impaired) / ouvidoria.jp.morgan@jpmorgan.com. Canada : J.P. Morgan Securities Canada Inc. is a registered investment dealer, regulated by the Canadian Investment Regulatory Organization and the Ontario Securities Commission and is the participating member on Canadian exchanges. This material is distributed in Canada by or on behalf of J.P.Morgan Securities Canada Inc. Chile: Inversiones J.P. Morgan Limitada is an unregulated entity incorporated in Chile. China: J.P. Morgan Securities (China) Company Limited has been approved by CSRC to conduct the securities investment consultancy business. Dubai International Financial Centre (DIFC) : JPMorgan Chase Bank, N.A., Dubai Branch is regulated by the Dubai Financial Services Authority (DFSA) and its registered address is Dubai International Financial Centre - The Gate, West Wing, Level 3 and 9 PO Box 506551, Dubai, UAE. This material has been distributed by JP Morgan Chase Bank, N.A., Dubai Branch to persons regarded as professional clients or market counterparties as defined under the DFSA rules. European Economic Area (EEA): Unless specified to the contrary, research is distributed in the EEA by J.P. Morgan SE (“JPM SE”), which is authorised as a credit institution by the Federal Financial Supervisory Authority (Bundesanstalt für Finanzdienstleistungsaufsicht, BaFin) and jointly supervised by the BaFin, the German Central Bank (Deutsche Bundesbank) and the European Central Bank (ECB). JPM SE is a company headquartered in Frankfurt with registered address at TaunusTurm, Taunustor 1, Frankfurt am Main, 60310, Germany. The material has been distributed in the EEA to persons regarded as professional investors (or equivalent) pursuant to Art. 4 para. 1 no. 10 and Annex II of MiFID II and its respective implementation in their home jurisdictions (“EEA professional investors”). This material must not be acted on or relied on by persons who are not EEA professional investors. Any investment or investment activity to which this material relates is only available to EEA relevant persons and will be engaged in only with EEA relevant persons. Hong Kong : J.P. Morgan Securities (Asia Pacific) Limited (CE number AAJ321) is regulated by the Hong Kong Monetary Authority and the Securities and Futures Commission in Hong Kong, and J.P. Morgan Broking (Hong Kong) Limited (CE number AAB027) is regulated by the Securities and Futures Commission in Hong Kong. JP Morgan Chase Bank, N.A., Hong Kong Branch (CE Number AAL996) is regulated by the Hong Kong Monetary Authority and the Securities and Futures Commission, is organized under the laws of the United States with limited liability. Where the distribution of this material is a regulated activity in Hong Kong, the material is distributed in Hong Kong by or through J.P. Morgan Securities (Asia Pacific) Limited and/or J.P. Morgan Broking (Hong Kong) Limited. India : J.P. Morgan India Private Limited (Corporate Identity Number - U67120MH1992FTC068724), having its registered office at J.P. Morgan Tower, Off. C.S.T. Road, Kalina, Santacruz - East, Mumbai – 400098, is registered with the Securities and Exchange Board of India (SEBI) as a ‘Research Analyst’ having registration number INH000001873. J.P. Morgan India Private Limited is also registered with SEBI as a member of the National Stock Exchange of India Limited and the Bombay Stock Exchange Limited (SEBI Registration Number – INZ000239730) and as a Merchant Banker (SEBI Registration Number - MB/INM000002970). Telephone: 91-22-6157 3000, Facsimile: 91-22-6157 3990 and Website: http://www.jpmipl.com. JPMorgan Chase Bank, N.A. - Mumbai Branch is licensed by the Reserve Bank of India (RBI) (Licence No. 53/ Licence No. BY.4/94; SEBI - IN/CUS/014/ CDSL : IN-DP-CDSL-444-2008/ IN-DP-NSDL-285-2008/ INBI00000984/ INE231311239) as a Scheduled Commercial Bank in India, which is its primary license allowing it to carry on Banking business in India and other activities, which a Bank branch in India are permitted to undertake. For non-local research material, this material is not distributed in India by J.P. Morgan India Private Limited. Compliance Officer: Spurthi Gadamsetty; spurthi.gadamsetty@jpmchase.com; +912261573225. Grievance Officer: Ramprasadh K, jpmipl.research.feedback@jpmorgan.com; +912261573000.

Investment in securities market are subject to market risks. Read all the related documents carefully before investing. Registration granted by SEBI and certification from NISM in no way guarantee performance of the intermediary or provide any assurance of returns to investors.

Indonesia : PT J.P. Morgan Sekuritas Indonesia is a member of the Indonesia Stock Exchange and is registered and supervised by the Otoritas Jasa Keuangan (OJK). Korea : J.P. Morgan Securities (Far East) Limited, Seoul Branch, is a member of the Korea Exchange (KRX). JPMorgan Chase Bank, N.A., Seoul Branch, is licensed as a branch office of foreign bank (JPMorgan Chase Bank, N.A.) in Korea. Both entities are regulated by the Financial Services Commission (FSC) and the Financial Supervisory Service (FSS). For non-macro research material, the material is distributed in Korea by or through J.P. Morgan Securities (Far East) Limited, Seoul Branch. Japan : JPMorgan Securities Japan Co., Ltd. and JPMorgan Chase Bank, N.A., Tokyo Branch are regulated by the Financial Services Agency in Japan. Malaysia : This material is issued and distributed in Malaysia by JPMorgan Securities (Malaysia) Sdn Bhd (18146-X), which is a Participating Organization of Bursa Malaysia Berhad and holds a Capital Markets Services License issued by the Securities Commission in Malaysia. Mexico : J.P. Morgan Casa de Bolsa, S.A. de C.V. and J.P. Morgan Grupo Financiero are members of the Mexican Stock Exchange and are authorized to act as a broker dealer by the National Banking and Securities Exchange Commission. New Zealand : This material is issued and distributed by JPMSAL in New Zealand only to "wholesale clients" (as defined in the Financial Markets Conduct Act 2013). JPMSAL is registered as a Financial Service Provider under the Financial Service providers (Registration and Dispute Resolution) Act of 2008. Philippines : J.P. Morgan Securities Philippines Inc. is a Trading Participant of the Philippine Stock Exchange and a member of the Securities Clearing Corporation of the Philippines and the Securities Investor Protection Fund. It is regulated by the Securities and Exchange Commission. Singapore : This material is issued and distributed in Singapore by or through J.P. Morgan Securities Singapore Private Limited (JPMSS) [MCI (P) 030/08/2023 and Co. Reg. No.: 199405335R], which is a member of the Singapore Exchange Securities Trading Limited, and/or JPMorgan Chase Bank, N.A., Singapore branch (JPMCB Singapore), both of which are regulated by the Monetary Authority of Singapore. This material is issued and distributed in Singapore only to accredited investors, expert investors and institutional investors, as defined in Section 4A of the Securities and Futures Act, Cap. 289 (SFA). This material is not intended to be issued or distributed to any retail investors or any other investors that do not fall into the classes of “accredited investors,” “expert investors” or “institutional investors,” as defined under Section 4A of the SFA. Recipients of this material in Singapore are to contact JPMSS or JPMCB Singapore in respect of any matters arising from, or in connection with, the material. South Africa : J.P. Morgan Equities South Africa Proprietary Limited and JPMorgan Chase Bank, N.A., Johannesburg Branch are members of the Johannesburg Securities Exchange and are regulated by the Financial Services Conduct Authority (FSCA). Taiwan : J.P. Morgan Securities (Taiwan) Limited is a participant of the Taiwan Stock Exchange (company-type) and regulated by the Taiwan Securities and Futures Bureau. Material relating to equity securities is issued and distributed in Taiwan by J.P. Morgan Securities (Taiwan) Limited, subject to the license scope and the applicable laws and the regulations in Taiwan. According to Paragraph 2, Article 7-1 of Operational Regulations Governing Securities Firms Recommending Trades in Securities to Customers (as amended or supplemented) and/or other applicable laws or regulations, please note that the recipient of this material is not permitted to engage in any activities in connection with the material that may give rise to conflicts of interests, unless otherwise disclosed in the “Important Disclosures” in this material. Thailand : This material is issued and distributed in Thailand by JPMorgan Securities (Thailand) Ltd., which is a member of the Stock Exchange of Thailand and is regulated by the Ministry of Finance and the Securities and Exchange Commission, and its registered address is 3rd Floor, 20 North Sathorn Road, Silom, Bangrak, Bangkok 10500. UK: Unless specified to the contrary, research is distributed in the UK by J.P. Morgan Securities plc (“JPMS plc”) which is a member of the London Stock Exchange and is authorised by the Prudential Regulation Authority and regulated by the Financial Conduct Authority and the Prudential Regulation Authority. JPMS plc is registered in England & Wales No. 2711006, Registered Office 25 Bank Street, London, E14 5JP. This material is directed in the UK only to: (a) persons having professional experience in matters relating to investments falling within article 19(5) of the Financial Services and Markets Act 2000 (Financial Promotion) (Order) 2005 (“the FPO”); (b) persons outlined in article 49 of the FPO (high net worth companies, unincorporated associations or partnerships, the trustees of high value trusts, etc.); or (c) any persons to whom this communication may otherwise lawfully be made; all such persons being referred to as "UK relevant persons". This material must not be acted on or relied on by persons who are not UK relevant persons. Any investment or investment activity to which this material relates is only available to UK relevant persons and will be engaged in only with UK relevant persons. Research issued by JPMS plc has been prepared in accordance with JPMS plc's policy for prevention and avoidance of conflicts of interest related to the production of Research which can be found at the following link: J.P. Morgan EMEA - Research Independence Policy. U.S .: J.P. Morgan Securities LLC (“JPMS”) is a member of the NYSE, FINRA, SIPC, and the NFA. JPMorgan Chase Bank, N.A. is a member of the FDIC. Material published by non-U.S. affiliates is distributed in the U.S. by JPMS who accepts responsibility for its content.

General: Additional information is available upon request. The information in this material has been obtained from sources believed to be reliable. While all reasonable care has been taken to ensure that the facts stated in this material are accurate and that the forecasts, opinions and expectations contained herein are fair and reasonable, JPMorgan Chase & Co. or its affiliates and/or subsidiaries (collectively J.P. Morgan) make no representations or warranties whatsoever to the completeness or accuracy of the material provided, except with respect to any disclosures relative to J.P. Morgan and the Research Analyst's involvement with the issuer that is the subject of the material. Accordingly, no reliance should be placed on the accuracy, fairness or completeness of the information contained in this material. There may be certain discrepancies with data and/or limited content in this material as a result of calculations, adjustments, translations to different languages, and/or local regulatory restrictions, as applicable. These discrepancies should not impact the overall investment analysis, views and/or recommendations of the subject company(ies) that may be discussed in the material. J.P. Morgan accepts no liability whatsoever for any loss arising from any use of this material or its contents, and neither J.P. Morgan nor any of its respective directors, officers or employees, shall be in any way responsible for the contents hereof, apart from the liabilities and responsibilities that may be imposed on them by the relevant regulatory authority in the jurisdiction in question, or the regulatory regime thereunder. Opinions, forecasts or projections contained in this material represent J.P. Morgan's current opinions or judgment as of the date of the material only and are therefore subject to change without notice. Periodic updates may be provided on companies/industries based on company-specific developments or announcements, market conditions or any other publicly available information. There can be no assurance that future results or events will be consistent with any such opinions, forecasts or projections, which represent only one possible outcome. Furthermore, such opinions, forecasts or projections are subject to certain risks, uncertainties and assumptions that have not been verified, and future actual results or events could differ materially. The value of, or income from, any investments referred to in this material may fluctuate and/or be affected by changes in exchange rates. All pricing is indicative as of the close of market for the securities discussed, unless otherwise stated. Past performance is not indicative of future results. Accordingly, investors may receive back less than originally invested. This material is not intended as an offer or solicitation for the purchase or sale of any financial instrument. The opinions and recommendations herein do not take into account individual client circumstances, objectives, or needs and are not intended as recommendations of particular securities, financial instruments or strategies to particular clients. This material may include views on structured securities, options, futures and other derivatives. These are complex instruments, may involve a high degree of risk and may be appropriate investments only for sophisticated investors who are capable of understanding and assuming the risks involved. The recipients of this material must make their own independent decisions regarding any securities or financial instruments mentioned herein and should seek advice from such independent financial, legal, tax or other adviser as they deem necessary. J.P. Morgan may trade as a principal on the basis of the Research Analysts’ views and research, and it may also engage in transactions for its own account or for its clients’ accounts in a manner inconsistent with the views taken in this material, and J.P. Morgan is under no obligation to ensure that such other communication is brought to the attention of any recipient of this material. Others within J.P. Morgan, including Strategists, Sales staff and other Research Analysts, may take views that are inconsistent with those taken in this material. Employees of J.P. Morgan not involved in the preparation of this material may have investments in the securities (or derivatives of such securities) mentioned in this material and may trade them in ways different from those discussed in this material. This material is not an advertisement for or marketing of any issuer, its products or services, or its securities in any jurisdiction.

Confidentiality and Security Notice : This transmission may contain information that is privileged, confidential, legally privileged, and/or exempt from disclosure under applicable law. If you are not the intended recipient, you are hereby notified that any disclosure, copying, distribution, or use of the information contained herein (including any reliance thereon) is STRICTLY PROHIBITED. Although this transmission and any attachments are believed to be free of any virus or other defect that might affect any computer system into which it is received and opened, it is the responsibility of the recipient to ensure that it is virus free and no responsibility is accepted by JPMorgan Chase & Co., its subsidiaries and affiliates, as applicable, for any loss or damage arising in any way from its use. If you received this transmission in error, please immediately contact the sender and destroy the material in its entirety, whether in electronic or hard copy format. This message is subject to electronic monitoring: https://www.jpmorgan.com/disclosures/email

MSCI: Certain information herein (“Information”) is reproduced by permission of MSCI Inc., its affiliates and information providers (“MSCI”) ©2024. No reproduction or dissemination of the Information is permitted without an appropriate license. MSCI MAKES NO EXPRESS OR IMPLIED WARRANTIES (INCLUDING MERCHANTABILITY OR FITNESS) AS TO THE INFORMATION AND DISCLAIMS ALL LIABILITY TO THE EXTENT PERMITTED BY LAW. No Information constitutes investment advice, except for any applicable Information from MSCI ESG Research. Subject also to msci.com/disclaimer

Sustainalytics: Certain information, data, analyses and opinions contained herein are reproduced by permission of Sustainalytics and: (1) includes the proprietary information of Sustainalytics; (2) may not be copied or redistributed except as specifically authorized; (3) do not constitute investment advice nor an endorsement of any product or project; (4) are provided solely for informational purposes; and (5) are not warranted to be complete, accurate or timely. Sustainalytics is not responsible for any trading decisions, damages or other losses related to it or its use. The use of the data is subject to conditions available at https://www.sustainalytics.com/legal-disclaimers. ©2024 Sustainalytics. All Rights Reserved.

"Other Disclosures" last revised April 06, 2024.

Copyright 2024 JPMorgan Chase & Co. All rights reserved. This material or any portion hereof may not be reprinted, sold or redistributed without the written consent of J.P. Morgan. It is strictly prohibited to use or share without prior written consent from J.P. Morgan any research material received from J.P. Morgan or an authorized third-party (“J.P. Morgan Data”) in any third-party artificial intelligence (“AI”) systems or models when such J.P. Morgan Data is accessible by a third-party. It is permissible to use J.P. Morgan Data for internal business purposes only in an AI system or model that protects the confidentiality of J.P. Morgan Data so as to prevent any and all access to or use of such J.P. Morgan Data by any third-party. #$J&098$#*P

Completed 29 Apr 2024 01:01 PM EDTDisseminated 29 Apr 2024 01:03 PM EDT