The J.P. Morgan View : Week of central bank decisions
This document is being provided for the exclusive use of blake@sandboxfp.com.
20 March 2024
The J.P. Morgan View
Week of central bank decisions
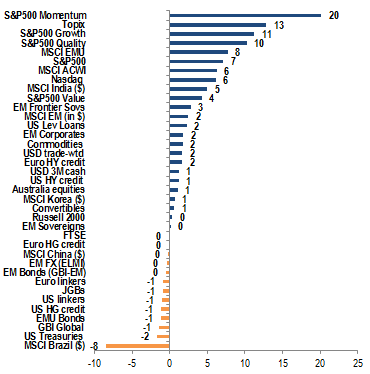
YTD returns by asset
Source: J.P. Morgan.
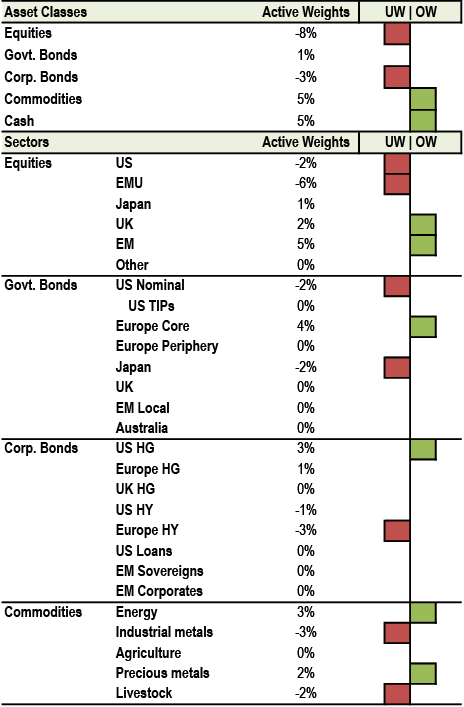
Cross-Asset Strategy: While we expect little change in this week’s FOMC meeting statement, risks are skewed to a hawkish delivery on its projections that raises the risk of 2024 and long-run median dots moving higher. We thus stay neutral on US duration outright and long 5s/30s steepeners, and see risks for the USD skewing moderately higher. Euro area bonds sold off mainly from US data given softer domestic activity data and ECB commentary that suggested convergence toward a June start to an easing cycle. We tactically stop out of longs in 5Y Germany and long 1Yx1Y €STR, but keep steepeners. In equities, we believe market volatility is being suppressed by large option supply from call overwriting ETFs, and we see alpha opportunities to be OW SMid vs. Large and OW India within EM. The path of least resistance for US HG spreads appears to be tighter, as near-term the market is driven by technicals and there appears to be a shortage of bonds to meet the demand. In Euro Credit, we are not convinced that ‘this time is different’ given heavier than anticipated supply, and the economic consensus potentially stale after a string of hot inflation prints. We expect a contentious June OPEC+ meeting, as after June Russia would likely have to cut exports to accommodate lower crude production. Copper prices jumped higher on a surge of financial inflows following a meeting of Chinese smelters to discuss the current tightness in concentrate markets.
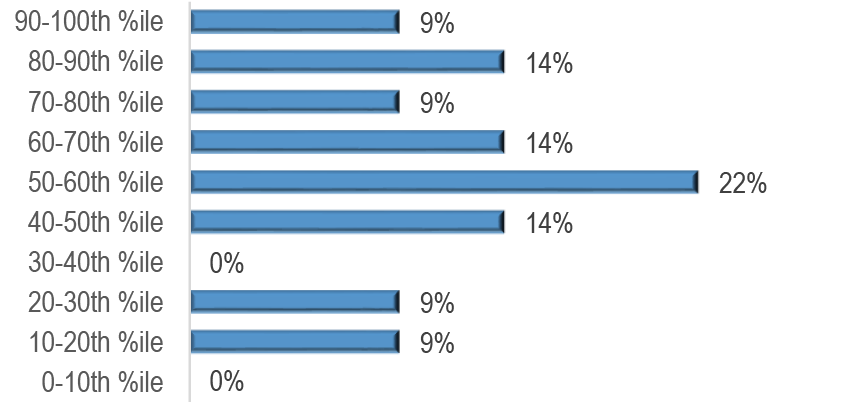
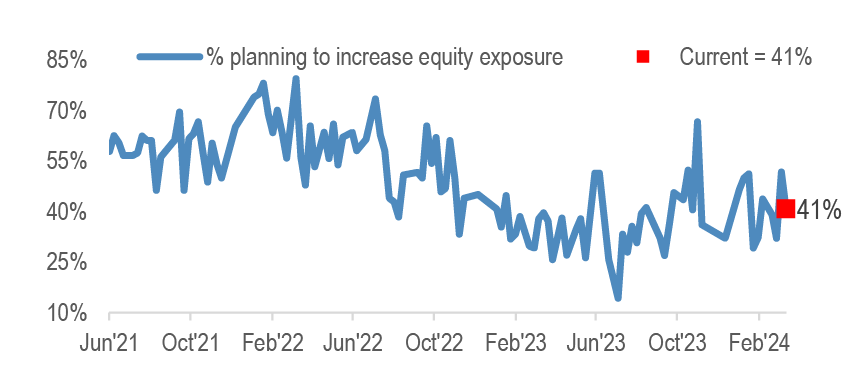
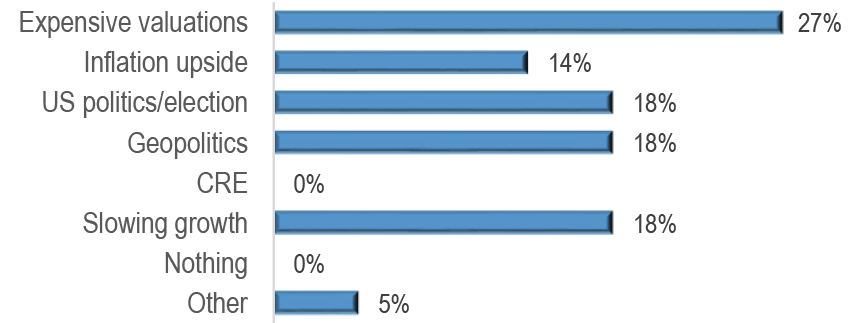
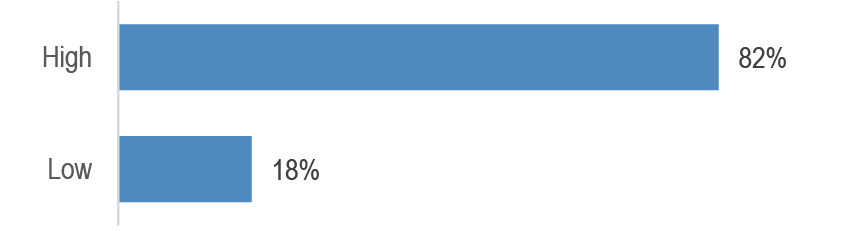
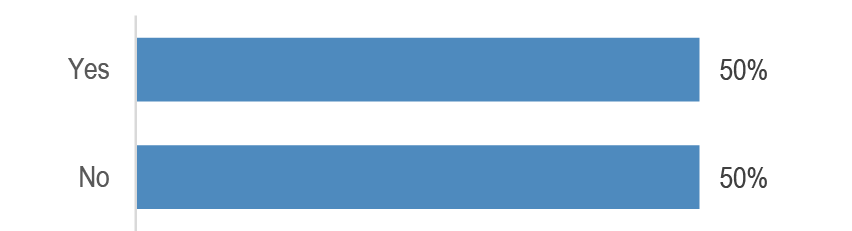
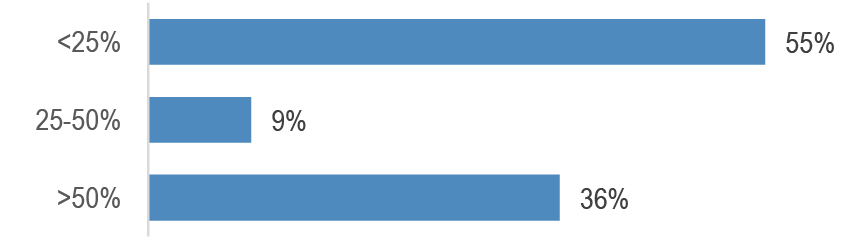
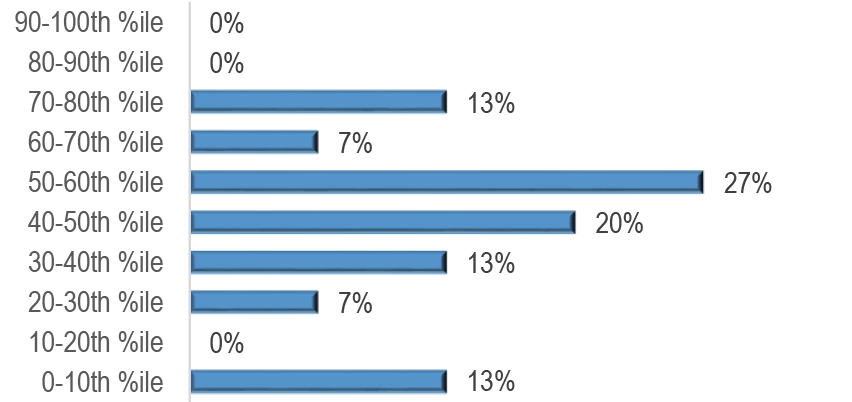
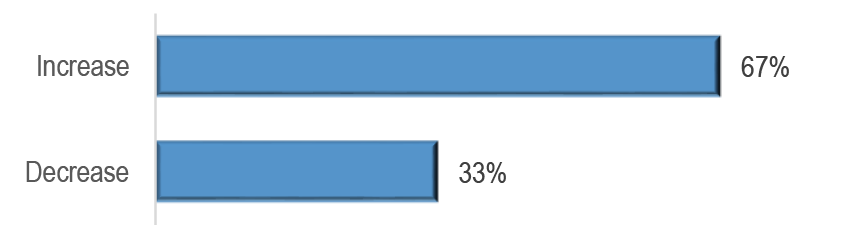
JPM Clients’ View: Click here to take this week’s survey. This week we poll investors on US rates, equity crowding, ECB policy and gold, in addition to our running sentiment questions. Our last survey results indicated: (1) equity exposure/sentiment among respondents is ~58th percentile on average; (2) 41% planned to increase equity exposure, and 82% to increase bond duration near-term; (3) the largest number (27%) saw expensive valuations as the biggest market risk, and 82% believe the risk of a correct is high over the next 6M; (4) respondents were evenly split on whether the ECB’s inflation forecast is too benign; (5) the median respondent believes there is a low chance the Fed will not cut at all this year.
Risk premium compression:The Equity Risk Premium and slope of the risk-return trade off line are both near the lows seen at previous market peaks, and well below their long-term averages. Risk premia have compressed by so much over the past few months that both equity and credit investors look vulnerable to a potential normalization.
New Trades: SX5E dividend option trades (Silvestrini); Japan consumption plays (Lee).
Upcoming Catalysts: BoJ meeting, US housing starts (3/19); FOMC rates decision, UK CPI/PPI (3/20); BoE meeting, US, Euro, India & Japan PMI, US leading index, Japan CPI (3/21).
Cross-Asset Strategy
Economics
Data support forecasts for broader growth, sticky inflation, and shallow easing. The evidence for broadening global growth remains limited. Activity readings have yet to show a convincing revival in European or Japanese consumption or a pickup in global factory output. However, ongoing upside US growth surprises and constructive signals elsewhere point in the right direction. More clear-cut evidence supports our view that disinflation will stall at a still-elevated 3%ar during 1H24. Building confidence in our 1H24 views contrasts with a lack of conviction in what lies beyond. Prospects for sustained high-for-long policy stances should weigh on growth by promoting tighter financial conditions and increasing debt service costs. With tight labor markets sustaining elevated wage gains, diminished corporate pricing power and modest productivity gains should also compress profit margins. This erosion of private sector health underscores our “boil the frog” narrative of a gradual path to an expansion end, though some recent developments bolster the case for an alternative soft-landing scenario.
FOMC expected to guide to June while raising median policy rate dot. Since the start of this year, expectations about 2024 central bank easing have been pared back materially, but that has not disrupted the general trend toward an easing in global financial conditions. Meanwhile, corporate profits are displaying surprising resilience, and the past year has seen the US deliver strong labor force and productivity gains that take pressure off tight labor markets. These developments are connected, raising the prospect that the DM expansion may be able to survive higher policy rates than is commonly perceived. The US FOMC is likely to lean in this direction at next meeting. While continuing to guide toward a June start to easing, we expect the SEP to pare rate cuts by 25bp across the 2024-26 median profile, along with a similar-sized step up in the Committee’s long-run rate.
BoJ expected to pivot on balance sheet while holding off on NIRP end. We see the BoJ likely abandoning its QQE with YCC framework and ending ETF purchases, while maintaining a flexible JGB purchase program to manage long yields. Rate hikes should follow soon after, probably by midyear. Outside of wages, economic indicators since the January meeting have fallen short of the BoJ’s expectations and are consistent with this pivot preceding rate hikes (Global Data Watch, Mar 15th).
Equities
Option-based ETFs are suppressing market volatility. AUM in US-listed option-based ETFs has surged to ~$100Bn (growing ~700% over the past 3Y). Call overwriting ETFs have become a large source of volatility supply that has been increasingly weighing on market volatility levels, in our view. We don’t see crash risks from overwriting ETFs, despite their large volatility supply; however, in case of a large market sell-off, the volatility suppressing force from these strategies is likely to quickly disappear, leaving markets more vulnerable to other selling flows. Capital is likely to be relatively sticky (and any outflows fairly gradual) from these strategies, suggesting their market impacts are likely to persist for some time (Option-Based ETFs, Mar 14th).
OW India within EM. India’s share has grown steadily to all-time highs of 18% in the MSCI EM Index. We estimate that India will continue to increase its weight within EM to 23% by 2033E. Strong GDP growth, favorable demographic dividend, consumption tailwinds, EPS compounding, widening bond market and a government looking to unlock this potential set the stage for a potential multi-year bull run for India (EM Lighthouse, Mar 13th).
Time to Revise Brazil’s Elevator Pitch? 1) Incoming data skew toward later starts for DM easing; a data-dependent Fed combined with USD strength could reduce the scope for EM easing in 2H24. 2) The decline in popularity of Brazil’s president could foster internal government discussion to adjust the level of macro and micro regulatory policy activism. From a macro perspective things have been unfolding well and our view on fiscal policy has also improved, but politics could be moving to a new phase: we are no longer in the phase of political de-leveraging, perhaps moving to a neutral scenario. Foreigners continue to pull money away from Brazil, with total YTD outflows equivalent to 40% of the inflow from last year, and local equity funds continue to see equity outflows (Brazil Equity Strategy, Mar 14th).
In SMids, we see negative forward returns but big alpha opportunity vs. Large. There is no shortage of credit risk yet HY spreads are near record lows. Equities are facing meaningful headwinds in a tense geopolitical environment and yet equity valuations imply below historical avg risk premia. Macro indicators signal deceleration/recession while analysts/corporates expect earnings growth to accelerate to record levels. And all with SMid-Caps selling off while Large-Caps (not immune to all the above) are reaching new highs in a bifurcation of performance never seen before (The SMid View, Mar 12th).
Bonds
Bonds sold off on the back of stronger US CPI/PPI data and lower-than-expected initial claims. The strength in activity, labor market and inflation data thus far in 2024 means we now expect the Fed to cut rates by 75bp this year vs. 125bp previously. While our economists expect little change in the FOMC statement, risks are skewed to a hawkish delivery on its projections that raises the risk of 2024 and long-run median dots moving higher. While valuations look cheap, the risk of hawkish Fed delivery keeps us neutral on duration outright. We retain 5s/30s steepeners to position for an approaching easing cycle and repricing of term premia at the long end.
In the Euro area, the sell-off was driven more by US data given softer domestic activity data and ECB commentary that suggested convergence toward a June start to an easing cycle. We tactically stop out of longs in 5Y Germany and long 1Yx1Y €STR, but keep steepeners in 10Yx15Y Germany and 2Yx2Y/10Yx10Y on the EUR swap curve. In the UK, we stay cautious on duration given risks of hawkish Fed delivery. We keep Aug24/Nov24 MPC OIS curve flatteners.
In EM, global growth indicators have been supportive and less US-centric, keeping the backdrop supportive for EM. While recent US inflation prints may imply less easing, this points to a shallower cutting cycle rather than ‘higher for longer’. We stay OW EM local duration, with an OW in Brazil, Colombia, Uruguay, Czechia, Poland and Indonesia, partially offset by a short duration overlay and UW in Romania (EM Fixed Income Focus, Mar 14th).
Credit
The path of least resistance for US HG spreads is tighter. We recognize that at such tight spreads historically one should be selling bonds rather than adding to positions. But near term the market is driven by technicals and the supply/demand balance seems to suggest that there is a shortage of bonds to meet the demand. We raised our full year supply forecast by nearly $100bn to $1.3tr. But even with this increase, we expect the monthly pace of supply to halve going forward, from $198bn/month YTD to $97bn/month. Fund flows have been strong all year, and dealers have net sold $8bn of bonds since the last Fed reported data and we estimate that positions are net negative now (Credit Market Outlook & Strategy, Mar 15th).
In Euro Credit, we are not convinced that ‘this time is different’. We are starting to get uncomfortable, with spreads breaking what we thought was the floor, heavier than anticipated supply, and the economic consensus potentially stale after a string of hot inflation prints. We take a look at five arguments for why “this time might be different”: i) yields are all that matter; ii) AI will change the world; iii) dealer liquidity has improved; iv) sovereign bonds are risky; and v) private credit means peak capital markets. Altogether, we do not find these views convincing (European Credit Weekly, Mar 15th).
Currencies
A plethora of central bank meetings await FX markets this week. Risks to the USD around the March FOMC skew moderately higher given sticky inflation data in the run-up and odds of a dot plot shift towards fewer cuts. Market expectations for a BOJ NIRP exit this week have increased sharply of late, but out-delivering such hawkish expectations is a high bar; hence, the Yen is more likely to weaken after the event. European ‘Super Thursday’ central bank meetings likely provide more tradeable opportunities for NOK and CHF.
Macro trade recommendations: Enter NOK short vs CAD, SEK basket in cash. Add SEK long vs CHF in cash to existing EUR/SEK digi put. Keep modest USD longs (vs EUR, CAD) on US exceptionalism. Hold yield convergence trades (long SEK/CZK, long JPY vs CHF, EUR, USD). Stay OW EM FX (FXMW, Mar 15th).
Commodities
Russia can maintain current oil exports until June. Expect contentious June OPEC+ meeting. We believe Russia can maintain oil exports at current levels through June even as it cuts 0.5 mbd crude production. Russia can achieve this by offsetting 200 kbd reduction in banned gasoline exports with higher crude oil shipments, as constrained refinery runs due to drone attacks and maintenance that runs from April through June lower processing rates. After June, Russia would likely have to cut exports to accommodate lower crude production, setting the stage for a contentious June OPEC+ meeting (Oil Markets Weekly, Mar 15th).
The lack of March and April weather pushed our end-October storage trajectory toward 4.4 Tcf, forcing producers to respond to very weak near-term prices. Lower-for-longer price can structurally change the profile of production for summer 2024 and cal year 2025, causing us to lower our production and storage trajectory estimates. We remain bullish 2025 Henry Hub price based on midstream issues (US Natural Gas, Mar 15th).
Copper prices jumped higher on a surge of financial inflows following a meeting of Chinese smelters to discuss the current tightness in concentrate markets. No formal coordinated production cut was agreed to but smelter maintenance has grouped heavily in 2Q24. Copper prices are finally responding to the intensifying supply tightness. With refined supply looking most at risk in the coming quarter and Chinese demand entering its seasonal peak period as well, we still think a broader move higher towards our bullish targets is in the offing, even if the road there is bumpy (Metals Weekly, Mar 15th).
This week, we poll investors on US rates, equity crowding, ECB policy and gold, in addition to our running survey questions on equity positioning/sentiment, and intentions for near-term changes to equity allocation and bond duration. The results from the last survey are shown below.1
Figure 1: What is your current equity positioning or sentiment in historical terms, expressed from most bearish (0th percentile) to most bullish (100th percentile)?
Source: J.P. Morgan.
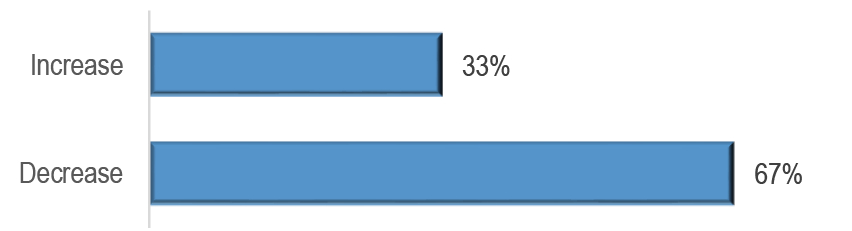
Figure 2: Are you more likely to increase or decrease equity exposure over the coming days/weeks?
Source: J.P. Morgan.
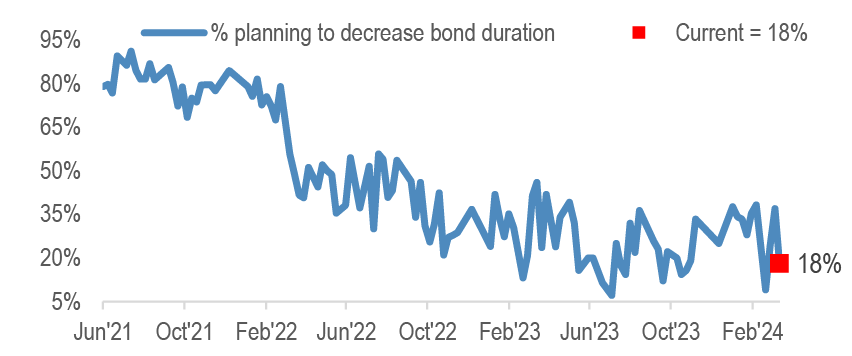
Figure 3: Are you more likely to increase or decrease bond portfolio duration over the coming days/weeks?
Source: J.P. Morgan.
Figure 4: What presents the biggest risk to markets over the next 6 months in your view?
Source: J.P. Morgan.
Figure 5: Do you believe the risk of an equity market correction at some point over the next 3-6 months is high or low?
Source: J.P. Morgan.
Figure 6: Was the ECB’s inflation forecast in the March meeting too benign in your view?
Source: J.P. Morgan.
Figure 7: What do you believe is the probability the Fed won’t cut at all this year?
Source: J.P. Morgan.
JPM Clients’ View – This Week’s Interim Survey Results
The charts below show interim results from this week’s survey, collected over the first ~24 hours it was live. The survey remains open here, and we will show updated results in the next J.P. Morgan View publication
Figure 8: What is your current equity positioning or sentiment in historical terms, expressed from most bearish (0th percentile) to most bullish (100th percentile)?
Source: J.P.Morgan
Figure 9: Are you more likely to increase or decrease equity exposure over the coming days/weeks?
Source: J.P. Morgan.
Figure 10: Are you more likely to increase or decrease bond portfolio duration over the coming days/weeks?
Source: J.P. Morgan.
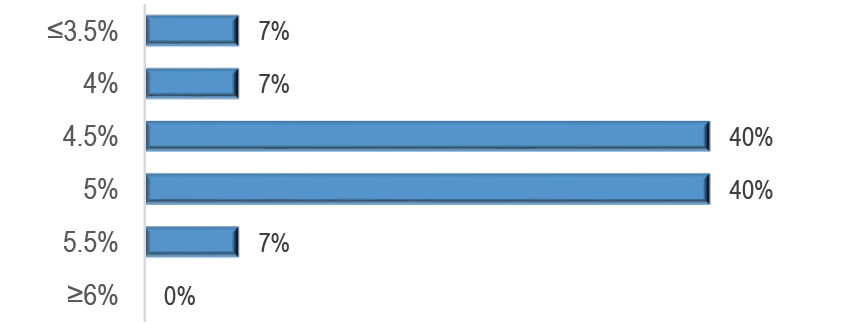
Figure 11: Where do you see Fed policy rates at year-end? (current = 5.5%)
Source: J.P. Morgan.
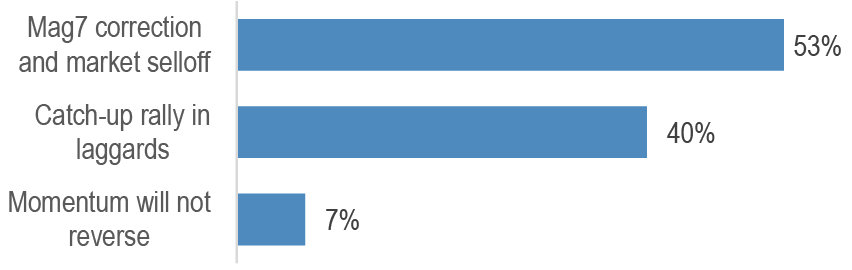
Figure 12: Given the extreme crowding in equity momentum, how do you expect a reversal to materialize?
Source: J.P. Morgan.
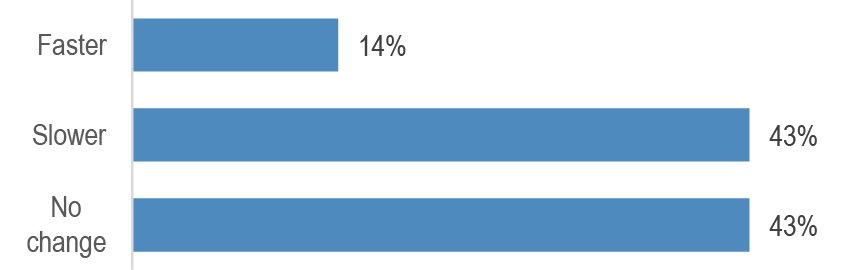
Figure 13: What do you believe are the implications of the ECB’s policy review on the pace of balance sheet normalization? The pace of normalization will be:
Source: J.P. Morgan.
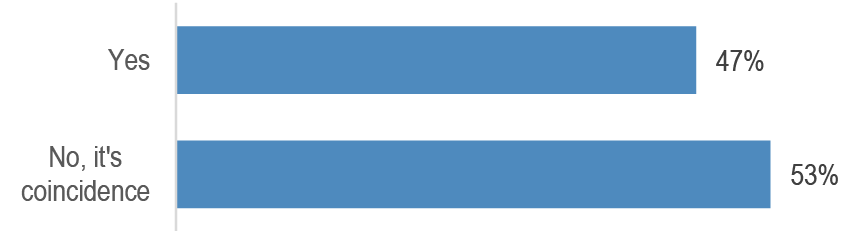
Figure 14: Is there a link between gold’s recent rally and the rally in Bitcoin?
Source: J.P. Morgan.
Risk premium compression
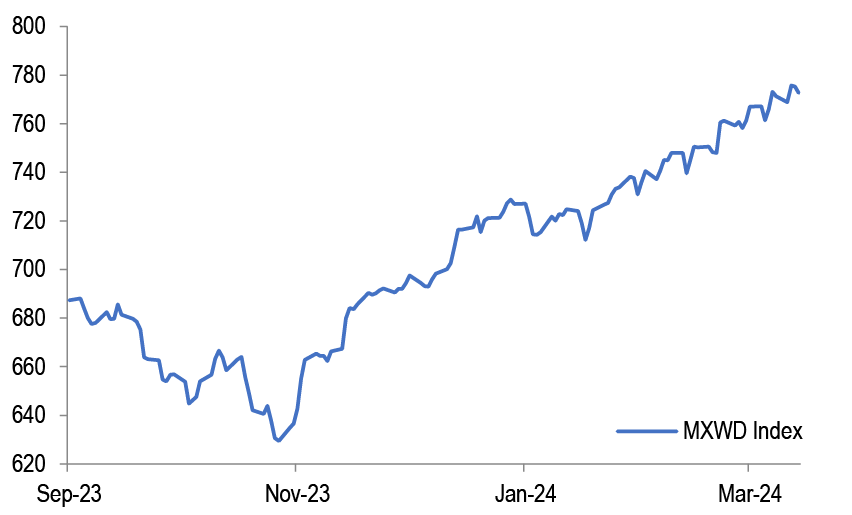
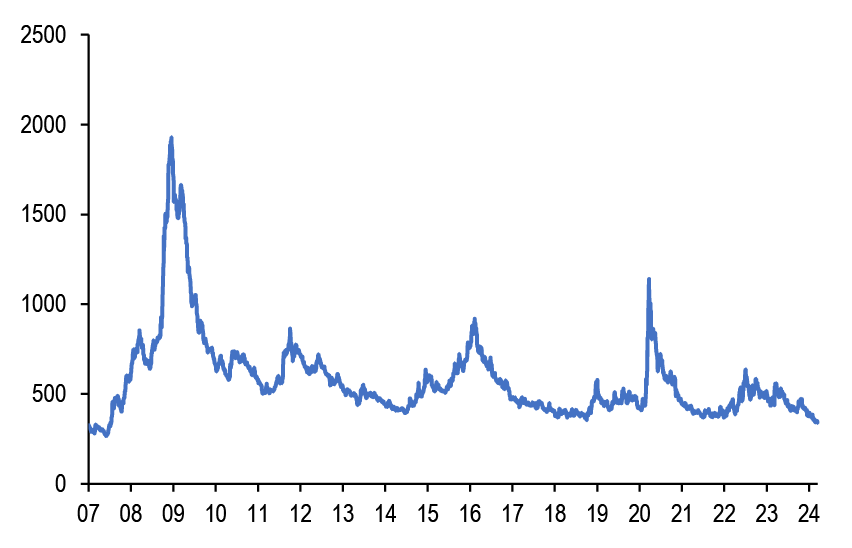
Despite higher than expected core inflation prints over the past week’s US CPI and PPI releases, risk markets continue to defy our expectation of a correction. Global equities continue to drift higher in an almost straight line since the end of last October ( Figure 15). At the same time credit spreads are making new lows with US HY corporate bond credit spreads over USTs reaching their lowest level since the summer of 2007 ( Figure 16). Ultra-low credit spreads add to market frothiness and in our opinion offer little compensation in a backdrop of 3% default rates. In fact, as highlighted by our colleagues in HY research, February registered a post-pandemic high in actual defaults and a 10-month high in volume affected by defaults/distressed transactions. The $12.9bn of defaults/distressed exchanges in 2024 is tracking only slightly below last year’s pace, pointing to default rate stickiness. Our credit strategists look for around 3% par-weighted default rates in US HY bonds and loans for 2024, which assuming average recovery rates of around 40%, would imply a loss due to default of 3% x (1-40%)=180bp. With the US HY corporate bond spread over USTs at 340bp at the moment, this leaves only 160bp as remaining compensation for credit risk, showing how vulnerable credit investors are at the moment to potential normalization in credit risk premia.
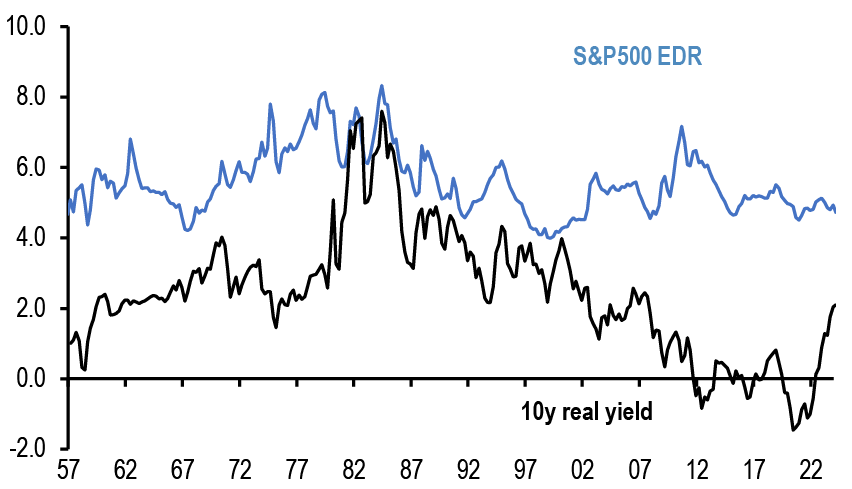
The picture on equity risk premia is not different. The Equity Risk Premium is proxied in Figure 17 by the difference between the Equity Discount Rate (EDR), or real equity yield for the S&P 500 index minus the 10y real UST yield. On our estimates, the current real yield of the S&P 500 index stands at 4.7% compared to 2.1% for the real 10y UST (proxied by the difference between the nominal 10y UST yield of 4.3% minus the most recent Philly Fed survey of professional forecasters’ 10y inflation expectation of 2.2%). In other words, there is an Equity Risk Premium (i.e. the difference between the EDR and the 10y real yield) of around 2.6% at the moment, which is some way below its long-term historical average of 3.2%. This compares to an Equity Risk Premium of around 2.4% in 2007 before the Lehman crisis, when the EDR was similarly at 4.7%.
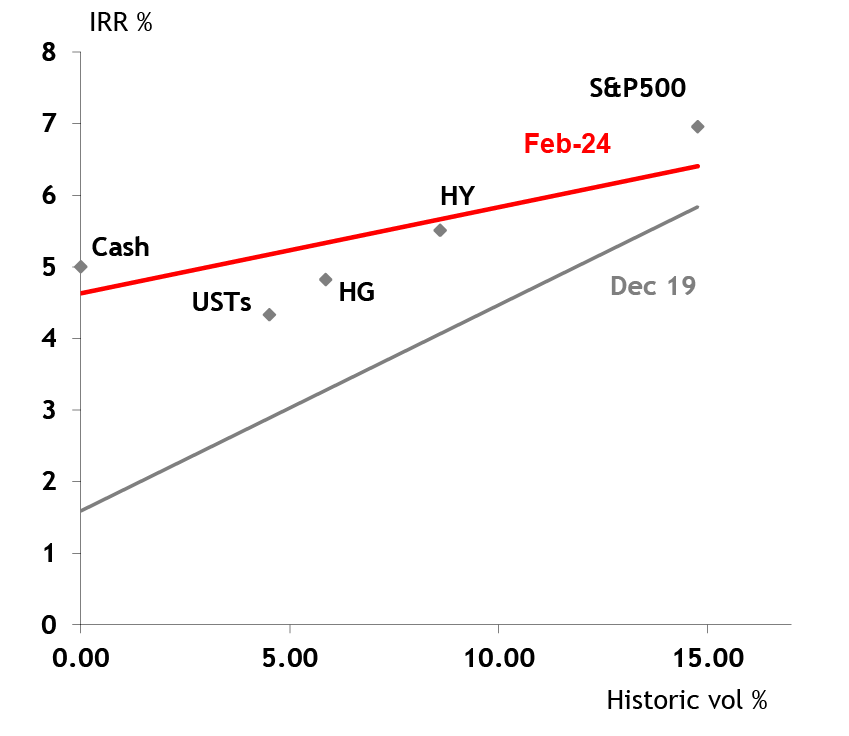
As explained in our sister publication Flows & Liquidity, Feb 28th, an alternative way to look at risk premia is to compare them across asset classes via the so-called “risk-return trade-off line”, i.e. the regression line of the Internal Rate of Return (IRR) of various asset classes, including equities, high yield corporate bonds, high grade corporate bonds and government bonds, with the intercept of the regression line fixed at the cash rate (which we proxy with the 9-12 month Bloomberg T-bill index yield). This regression line is shown in Figure 18 for US assets. In Figure 18 the S&P 500 IRR is proxied by the Equity Discount Rate from our dividend discount model described above plus expected long-term inflation (proxied by Philly Fed survey of professional forecasters’ 10yr US CPI inflation forecast) to convert it to nominal. For US government bonds, the IRR is simply the yield of the Bloomberg UST bond index. For high grade corporate bonds, the IRR is the yield of the Bloomberg US HG corporate bond index less 50bp to take into account the average historical loss due to downgrades. For high yield corporate bonds, the IRR is the yield of the Bloomberg US HY corporate bond index less 250bp to take into account the average historical loss due to defaults.
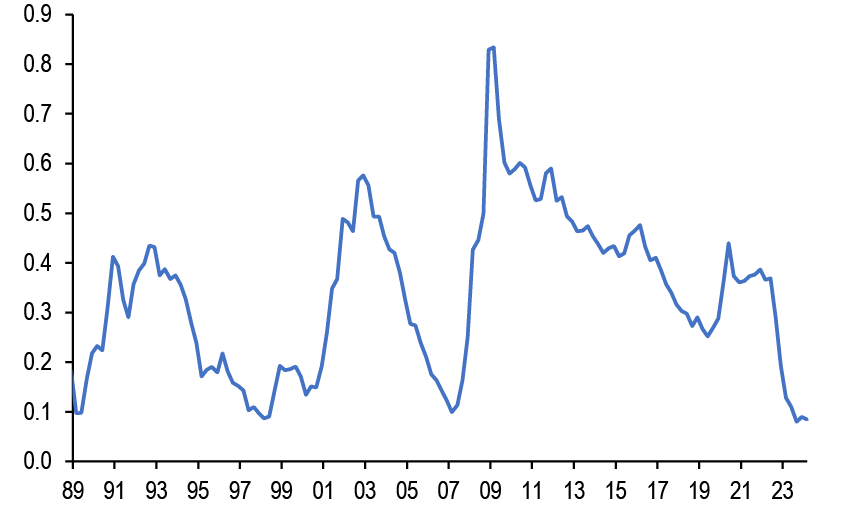
How low is the current slope of the “risk-return trade-off line” relative to its longer history? Figure 19 depicts this slope over time. The slope appears to have been on a declining trend since the Lehman crisis. It currently stands at 0.09, i.e. the “expected Sharpe Ratio” embedded across asset classes is 0.09 at the moment, which is well below its historical average since 1989. The “expected Sharpe Ratio” had declined to as low as 0.10 in 2007 or 1989 and 0.09 in 1999. In other words, markets appear to be at the frothier risk premia backdrop of previous cycle peaks.
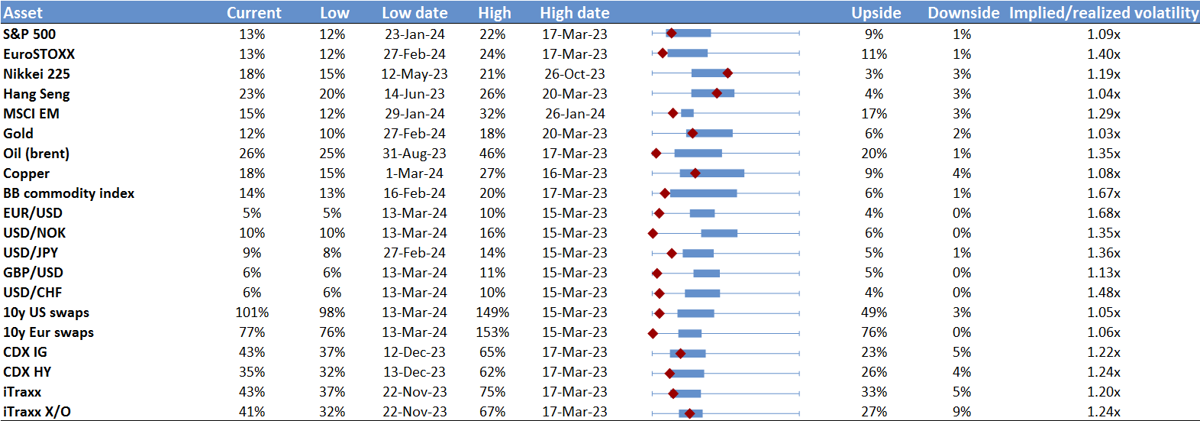
All the above suggest that risk premia have compressed by so much over the past few months that both equity and credit investors look vulnerable to potential normalization in risk premia. This is one reason we maintain a defensive stance in our model portfolio and recommend investors to hedge their risk assets via long vol exposures. As shown in Figure 20, implied vols stand at the low end of the past year’s range across asset classes at the moment. Implied vol risk premia, proxied by the ratio between implied and realised vols in the last column of Figure 20, look also low by historical standards. In credit we recommend LQD puts to take advantage of negative implied spread/rates correlation. In fact, the negative spread-rate correlation implied by LQD options is at multi-year extremes (see CD Player). In equities we recommend resettable put spreads on the S&P 500 (see Volatility Review).
While in principle gold should serve as a hedge, we see some headwinds in the near term as gold appears to have been propagated along with bitcoin by both retail investors and speculative institutional investors. In particular, speculative institutional investors including momentum traders such as CTAs appear to have been heavily buying both gold and bitcoin futures since February. To the extent momentum traders such as CTAs have been behind this futures impulse, the risk of mean reversion looks high at the moment for both gold and bitcoin given the extremity of the momentum signals at around 1.5 standard deviations (see Flows & Liquidity, Mar 14th).
Moreover, MicroStrategy’s recent announcement that it acquired more than $800m of bitcoin between Feb 26th and March 10th alone funded via the sale of convertible notes, shows that the company, by appearing to transform itself to a leveraged play on bitcoin, has also played a part in amplifying the rally. MicroStrategy has bought more than $1bn of bitcoin YTD after more than $1bn of purchases in Q4 2023. And it is planning another $500m of convertible-debt offering that would enable it to purchase even more bitcoin. In our mind, these debt-funded bitcoin purchases add froth to the current crypto rally by raising the risk of severe deleveraging in a potential downturn in the future. If a crypto market downturn materializes over the coming months, gold would likely be negatively affected.
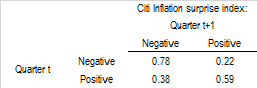
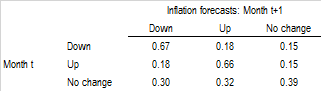
A second reason we maintain a defensive stance in our model portfolio is inflation. The latest US CPI print for February marked a third consecutive upside surprise in both core and headline CPI. Moreover, there is a tendency for serial correlation in inflation surprises. For example, using a transition matrix approach on the Citi inflation surprise index ( Figure 21) for the US using quarterly observations (to avoid introducing artificial serial correlation given it looks at surprises over a 3-month rolling window), there a strong tendency of positive readings in the surprise index in one quarter to be followed by positive readings in the following quarter. These upside surprises in US inflation readings have also started to see upward revisions in inflation forecasts by economists, with the BlueChip survey showing US CPI forecasts for both 2024 and 2025 were revised upwards. Again, these forecast revisions tend to exhibit strong serial correlation. Figure 22 shows the transition matrix for US CPI inflation in the BlueChip survey, using a 1-year ahead constant horizon, and shows how often upward and downward revisions or no changes in the current month (t) are followed by upward and downward moves or no changes in the following month (t+1). It suggests that both upward and downward revisions to inflation forecasts tend to be followed by a revision in the same direction around two-thirds of the time.
Clearly, these inflation surprises have also seen a repricing of Fed expectations, with Fed funds futures markets now pricing in just under 75bp of Fed cuts by end-2024 currently, compared to nearly 170bp at the peak in mid-January ( Figure 23), which was well beyond the 125bp of cuts our economists had forecast for the year. However, given the strength in activity and labor market data as well as the inflation data in recent months, while they still expect the Fed to begin easing in June, our economists now see cuts at every other meeting, with 75bp of cumulative cuts by year-end. Mindful of this strong serial correlation and risk of further revisions to the inflation outlook, there is if anything some risk of further pricing out by markets of Fed cuts in the near term.
Figure 15: MSCI AC World Index
Source: Bloomberg Finance L.P., J.P. Morgan.
Figure 16: US HY corporate bond spread vs USTs
bps
Source: Bloomberg Finance L.P., J.P. Morgan.
Figure 17: Our model-driven estimate of the Equity Discount Rate or real yield of the S&P500 vs. the 10y real UST yield
In %
Source: J.P. Morgan.
Figure 18: Risk-return trade-off line
Nominal Internal Rate of Return (IRR) across assets classes as a function of historical return volatility. For a detailed explanation, please see main text. Quarterly data since 1989. Last observation is for Feb’24.
Source: J.P. Morgan.
Figure 19: Slope of the risk-return trade-off line
Slope of risk-return trade-off line since 1989. For a detailed explanation, please see main text. Quarterly data since 1989. Last observation is for Feb’24
Source: J.P. Morgan.
Figure 20: Cross Asset Volatility Monitor – 3m ATM Implied Volatility (1y history) as of 14-Mar-24
This table shows the richness/cheapness of current 3m implied volatility levels (red dot) against their 1 year historical range (thin blue bar) and the ratio to current realized volatility. Assets with implied volatility outside their 25th/75th percentile range (thick blue bar) are highlighted. The implied-to-realized volatility ratio uses 3-month implied volatilities and 1-month (around 21 trading days) realized volatilities for each asset.
Source: Bloomberg Finance L.P., J.P. Morgan.
Figure 21: US Inflation surprise transition matrix
Transition matrix for quarterly data on the Citi US inflation surprise index, 1997-2024
Source: Bloomberg Finance L.P., J.P. Morgan.
Figure 22: Forecast transition matrix
Transition matrix for monthly US inflation forecast changes, 1987-2024.
Source: Blue Chip Economic Indicators, J.P. Morgan
Figure 23: Cumulative Fed policy rate cuts by end-2024
A combination of High for Longer and the Halo Effect of LLM stocks has created market dislocations across global equities over the past year. These have been key catalysts for investor crowding into quality mega-cap companies. The unique feature of the current extreme crowding into Momentum (99.8%ile) is the non-linearity in Momentum with extreme tail crowding into the Size and Growth factors (i.e. Mag7 effect). Our analysis suggests the broad market is more vulnerable to negative shocks from AI theme as the market exhibits higher bear beta than bull beta relative to NVDA and Mag7 returns.
Even with modest improvement compared to last year on US federal debt and deficit assumptions due to higher growth, the question is not whether the US will face a moment of reckoning on government debt but rather when it will happen and how painful the necessary adjustment will be. Based on economic fundamentals alone, we are inclined to the view that the trajectory of debt as a share of GDP is likely to be somewhat worse than projected by the CBO. Investors should position for a steeper yield curve as near-term considerations should bring lower rates at the short end of the curve, while higher volatility, increased issuance, and weakening demand of price-insensitive buyers should bring a higher term premium.
We believe that private investors and individuals have propagated both gold and bitcoin YTD rather than shifting from the former to the latter. However, simply looking at ETF flows portrays a rather misleading picture under-estimating the buying of gold by individuals and private investors in the form of bars and coins and over-estimating their purchases of bitcoin as retail investors rotate from bitcoins previously held via digital wallets to the convenience and regulatory protection of the new spot bitcoin ETFs.
Although the profit resilience has bolstered market sentiment for a soft-landing, the risk is that pressures on profits build through margins. Profit margins are elevated but are leveling out. Higher policy rates, elevated wage inflation, and a large downshift in the pace of revenue expansion were stiff headwinds to earnings. However, both inflation and real activity surprised to the upside, resulting in a robust 6.2%oya gain in nominal global GDP last year. The resulting resilience in business revenues helped to sustain a modest 2.6%oya gain in corporate profits. While profits are still growing, the pace is slowing from the boom after the pandemic across most sectors including consumers, health care, financials, and IT.
Housing construction and construction employment have held up much better than expected despite 525bp in Fed rate hikes. Home sales have behaved normally but other housing indicators have been acting strange. A secular housing shortage is the likely explanation for the unusual behavior of the sector in this cycle. Relative to the high level of housing completions, the surprisingly modest increase in vacancies is partly due to the surprisingly high level of immigration. However, even with a potential change in immigration policies we think homebuilding should be well-supported for several quarters.
We believe the expected strong wage increases will support further progress in the BoJ’s strategic “gradual policy normalization.” We think upcoming meetings will continue to be live meetings, but the key issue is the order and pace in normalizing various easing measures. Although we can’t rule out the possibility that the NIRP will be lifted early as a political decision, there is still a distance between the easing bias in the statement and NIRP removal as a start of hiking cycle.
Rising retail allocations to overseas assets, if they persist, may mark an important inflection point for Japanese household flows. First, while institutional investors’ search for yield in foreign debt markets had characterized Japan’s capital account over the past decade, retail flows into equity markets may emerge as a more material future flow. Second, rising retail capital outflows can serve to accelerate yen depreciation, and there is already evidence that USD/JPY’s resilience this year has been supported by these flows. Third, a longer-term rise in foreign assets risks increasing household exposure to currency swings; this dynamic may have some influence on FX policy and the design of future investment schemes.
In this new version of our SMid View report, we provide a brief summary of our world view, and any new trends or noteworthy developments. We include a summary of the SMid themes that we find most appealing and help narrow the thousands of SMid stocks that trade in each region down to a few hundred that are facing fundamental tailwinds. We also include a more in-depth explanation of our allocation recommendations including regional views from our local teams.
We raise our full year supply forecast by $86bn to $1.31tr, up 8.6% YoY (net issuance of $490bn). Simply put, with spreads near post GFC tights and UST curves still deeply inverted, issuers have found themselves in an opportune position to raise capital at relatively attractive coupons and are taking advantage of this backdrop to a greater degree than we expected late last year. Sector wise, the largest changes to our prior forecast have come in Healthcare/Pharma (+$25bn) and Tech (+$16bn) while we have not changed our full year forecast in Financials, Energy or Utilities.
There exists a wide debate on whether EM corporates trading through their own sovereigns is justified and we believe selectively so. Such observations have been common in countries including Ukraine, Turkey and Argentina, in cases when corporate standalone fundamentals were solid but the respective sovereign was under stress. Other situations which may warrant corporates to trade through sovereigns relate to rating differential, business dynamics, as well as technical. We take a look at some dislocations in Asia, LatAm and Middle East where we think the CEMBI spread to sovereign compression may have gone too far.
We introduce the J.P. Morgan ESG Asia Pacific Credit Index (JESG JACI APAC), an integrated ESG benchmark covering IG and HY debt markets across the Asia Pacific region. Issuers with better ESG scores will have higher weights compared with the baseline index. JESG JACI APAC delivers similar risk-adjusted returns as the flagship, with a 22% better JESG score than the baseline index and excluding ~19.75% of instruments by market value relative to the flagship due to issuer involvement in controversial sectors, low JESG scores or the minimum notional criteria.
We come away from the J.P. Morgan Industrials Conference with little change to our view with a bit more confidence in short cycle recovery trend, but mostly because it’s not getting worse, and a lot more confidence in the strength and sustainability in data center demand. We remain OW Electricals>HVAC broadly and prefer value names where earnings revisions cycles are turning with short cycle trends. We remain UW ROK and LII, both of which did not attend the conference.
UBS in our view has a better business mix than MS, with both generating c60% of earnings from Asset gathering businesses in 2027E; UBS IB only contributing 15% to Group earnings consuming <25% of RWAs vs. 40% of earnings and 50% of Equity at MS and UBS having the stability of the combined Swiss Bank generating almost 1/3rd of earnings and c20% market share. We forecast an acceleration in capital returns from UBS in 2026 and expect TBV/Sh growth of 5% p.a. for UBS vs. 4% at MS over 2023-27.
JPM’s China Growth Reading (CGR) entered Expansion in Jan 2024. The question is whether it will stay there in the coming months. MXCN’s monthly returns have tracked CGR readings; peak gap seen in Jan 24 may narrow further. A stay in Expansion will help end three years of EPS declines by MXCN, the worst among APAC markets.