
Equity Strategy
Q2 Preview: Consensus call for the EPS narrowing between the Mag-7 and rest might still be lacking
Activity momentum points to a pickup in earnings, suggesting some beats are likely...
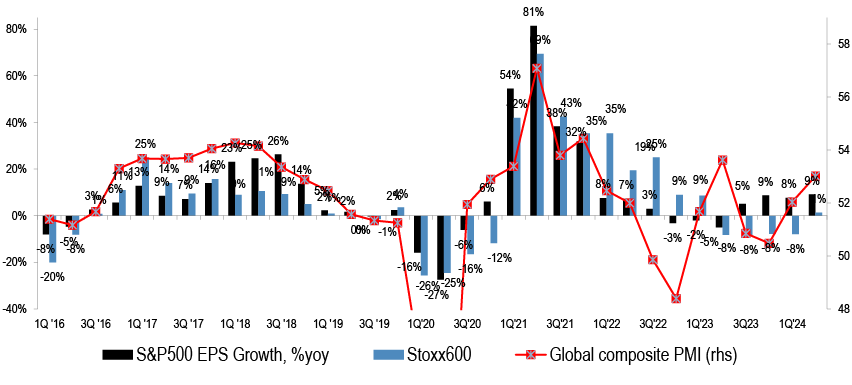
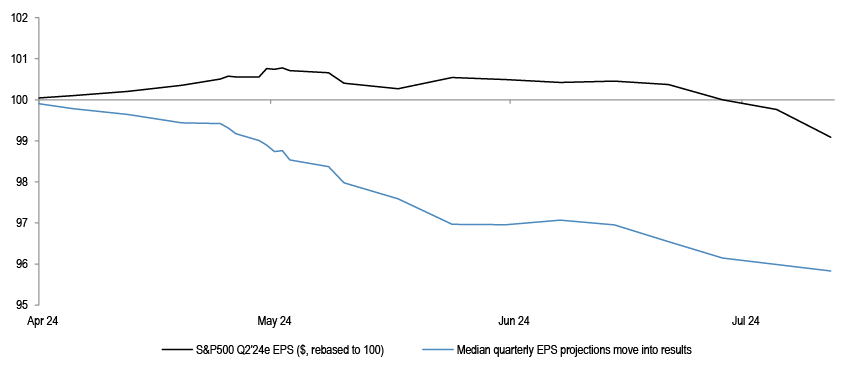
...having said that, the tolerance for dissapointments is small, as downgrades into the results were lower than normal
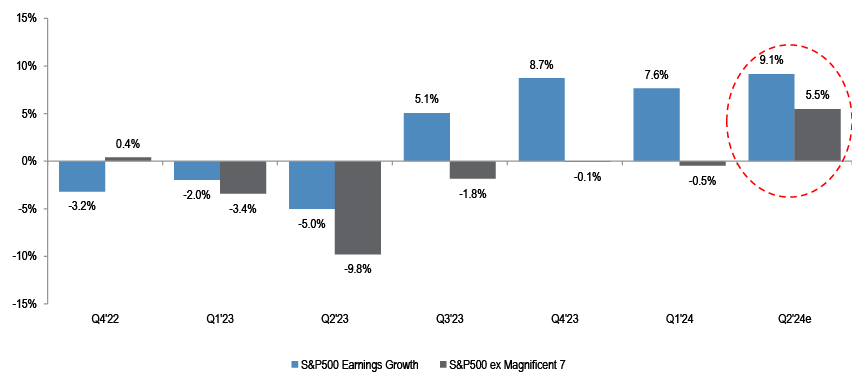
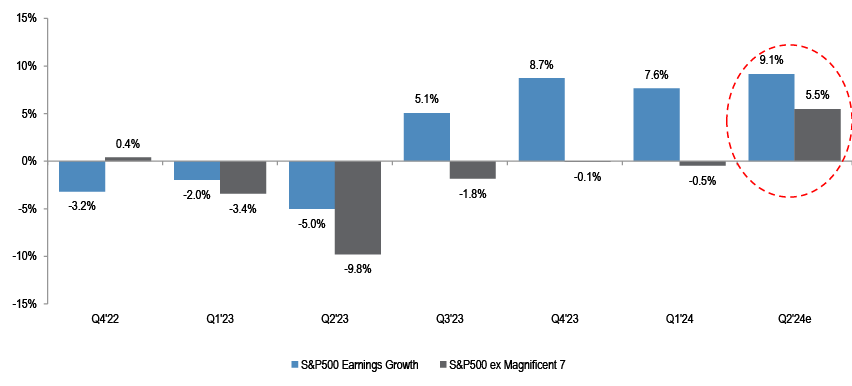
The consensus is yet again betting on the convergence in earnings between Mag-7 and the rest, but that was disappointed on each of the past 5 occasions
Source: Bloomberg Finance L.P. S&P Global
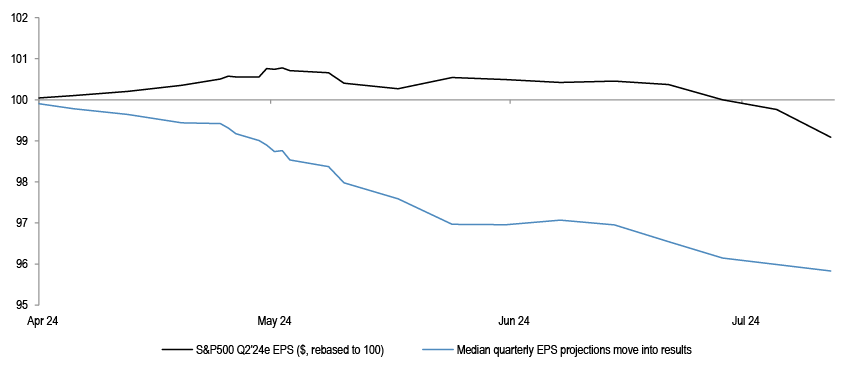
- Q2 reporting season is heating up. Activity was broadly better for the quarter, sequentially, pointing to an improvement in earnings delivery - top chart. This, though, is to a good extent reflected in consensus estimates, where Q2 EPS projections have not been cut as much entering this earnings season, as is usually the case - middle chart. Typical cuts to projections in the 3 months ahead of the results are 5%, vs current 1%.
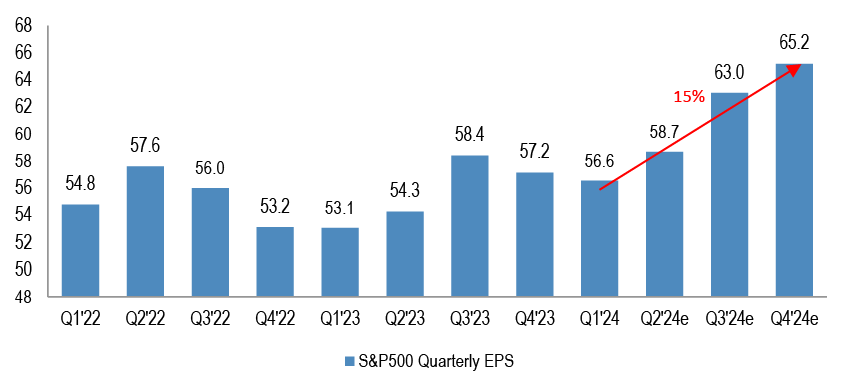
- Broadly, the analysts’ implied Q1 to Q4 EPS acceleration of 15% for S&P500 is much higher than what is seen historically. For Q2 specifically, S&P500 is expected by consensus to deliver 9% EPS yoy growth. At the same time, market is trading near highs, with full positioning and extreme concentration, suggesting that there is not much scope to absorb any disappointments.
- The recent weaker consumer dataflow, including a renewed rollover in consumer confidence, as well as continued weakness in China activity, are likely to result in companies having mixed guidance. There has been a raft of profit warnings in consumer space in the past weeks, with poor stock reaction, but also in other areas.
- At a regional level, while hurdle rate at face value appears much less challenging in Europe, with SXXP Q2 EPS growth projected at 0% yoy, the median expectations are in fact higher than for the US. We remain unexcited about Eurozone equities, in contrast to consensus, but on the positive side we note that they are not stretched, as SX5E has been consolidating already since March, and US PMI trends appear to be softening vs Europe.
- At a sector level, Mag-7 EPS growth projections remain punchy, but are set to decelerate somewhat. SPX ex Mag-7 earnings are projected to be positive at +5% y/y, for the first time in 5 quarters. However, we note that the convergence in the earnings delivery was the expectation in each of the last 5 reporting seasons, but the end result was always a bigger positive surprise for Mag-7 than for the rest of the market - bottom chart. This could be the case in the current reporting season, yet again. Within Tech, we reiterate the call from last month to move away from hardware/semis, and into software, on lower yields, on geopolitical uncertainty and given strong past outperformance of Semis.
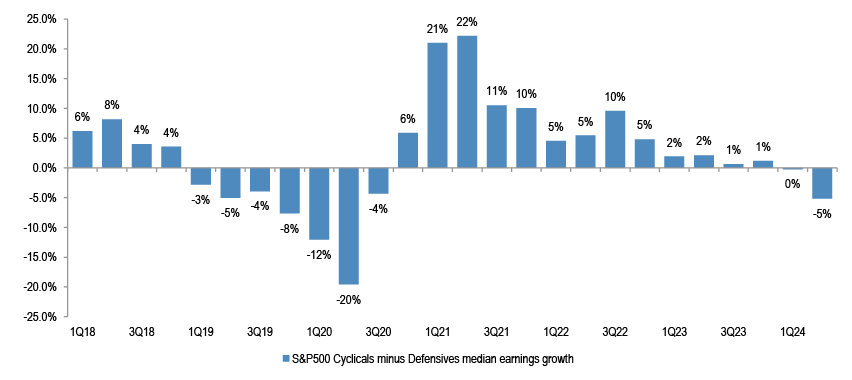
- Defensives are projected to come in stronger than Cyclicals in both the US and in Europe. In the US, Q1 ‘24 was the first quarter since Q4 ‘20 that Cyclicals EPS growth was weaker vs Defensives. Added to our call for falling bond yields, the improving relative EPS trends for Defensives are helping the lower beta leadership, seen in the market in the past months.
- With respect to the small vs large caps angle, even though we think that broadening in earnings beyond Mag-7 could still underwhelm, there could be a change in the small vs large caps earnings trends. The potential earnings inflection should be an additional support to our upgrade of UK and Eurozone small caps that we did last month – see June Chartbook, after having a 2.5 year long preference for large vs small caps.
Q2 Preview: Consensus call for the EPS narrowing between the Mag-7 and rest might still be lacking
Q2 earnings season has started
Figure 1: Q2’ 24 Earnings calendar

Source: Bloomberg Finance L.P.
We are entering the busiest weeks of the Q2 reporting season. Over 60% of S&P500 and Stoxx600 market cap is scheduled to report in the coming two weeks.
Improving activity momentum in Q2 points to a sequential pickup in earnings growth...
Table 1: The progression of key regional activity indicators
| 1Q '23 | 2Q '23 | 3Q '23 | 4Q '23 | 1Q'24 | 2Q'24 | |
| Real GDP, % oya | ||||||
| US | 1.7% | 2.4% | 2.9% | 3.1% | 2.9% | 2.9% |
| Euro Area | 1.3% | 0.6% | 0.2% | 0.2% | 0.4% | 0.6% |
| Japan | 2.4% | 2.2% | 1.5% | 1.2% | -0.3% | -0.9% |
| EM | 3.5% | 4.5% | 4.3% | 4.6% | 4.4% | 4.7% |
| IP, %oya | ||||||
| US | -0.1% | -0.7% | -0.8% | -0.4% | -0.7% | -0.7% |
| Euro Area | 0.8% | -1.2% | -4.6% | -3.5% | -4.7% | -2.8% |
| Japan | -1.8% | 0.8% | -3.6% | -0.9% | -4.3% | -1.7% |
| PMI Composite | ||||||
| US | 49.7 | 53.6 | 50.8 | 50.8 | 52.2 | 53.5 |
| Euro Area | 52.0 | 52.3 | 47.5 | 47.2 | 49.1 | 51.6 |
| Japan | 51.6 | 53.1 | 52.3 | 50.0 | 51.3 | 51.5 |
| EM | 53.5 | 54.6 | 52.5 | 52.1 | 53.5 | 53.8 |
| German IFO | 92.8 | 91.5 | 86.1 | 85.6 | 85.3 | 88.8 |
| CPI, %oya | ||||||
| US | 5.7% | 4.0% | 3.6% | 3.2% | 3.2% | 3.2% |
| Euro Area | 8.0% | 6.2% | 4.8% | 2.7% | 2.6% | 2.5% |
| Japan | 3.6% | 3.3% | 3.2% | 2.9% | 2.6% | 2.7% |
| EM | 5.4% | 3.5% | 3.8% | 3.7% | 3.7% | 4.0% |
| Consumer Sentiment | ||||||
| US | 64.6 | 62.3 | 69.6 | 64.9 | 78.4 | 71.5 |
| Euro Area | -19.6 | -17.0 | -16.3 | -16.6 | -15.5 | -14.3 |
| Japan | 31.7 | 35.6 | 35.7 | 35.9 | 38.1 | 36.9 |
| Unemployment rate, % | ||||||
| US | 3.5 | 3.6 | 3.7 | 3.8 | 3.8 | 4.0 |
| Euro Area | 6.6 | 6.5 | 6.6 | 6.5 | 6.5 | 6.4 |
| Japan | 2.6 | 2.6 | 2.6 | 2.5 | 2.5 | 2.6 |
Source: Bloomberg Finance L.P., S&PGlobal, J.P.Morgan
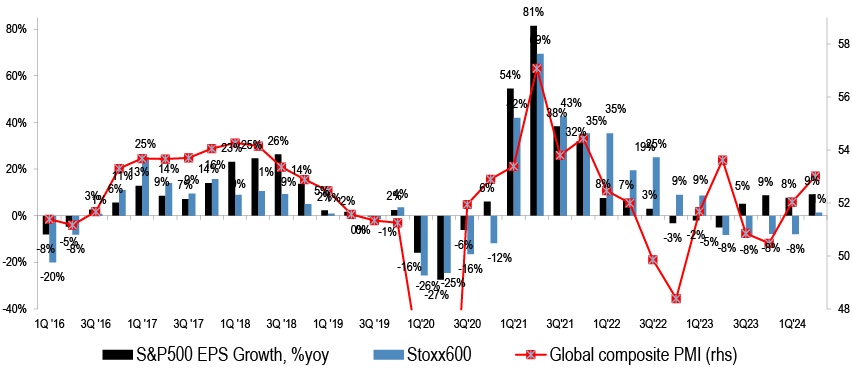
Activity momentum broadly firmed up during the quarter, with PMIs in all regions seeing better prints vs Q1.
Figure 2: US and European quarterly EPS growth and PMI
Source: Bloomberg Finance L.P., J.P.Morgan, S&PGlobal
This points to a sequential improvement in earnings growth. While consensus estimates for the US are in line with the uptick in activity momentum, projections for Q2 EPS growth in Europe are still lagging.
The hurdle rate appears to have been downgraded by less this time around, though...
Figure 3: The move in S&P500 Blended Q2’24 EPS projections over the last 3 months, and typical
Source: Thomson Reuters
S&P500 Q2 ‘24 blended EPS has fallen by only 1% since April. This is fairly unusual, given that the average downgrades entering the past earnings seasons were 4.5%.
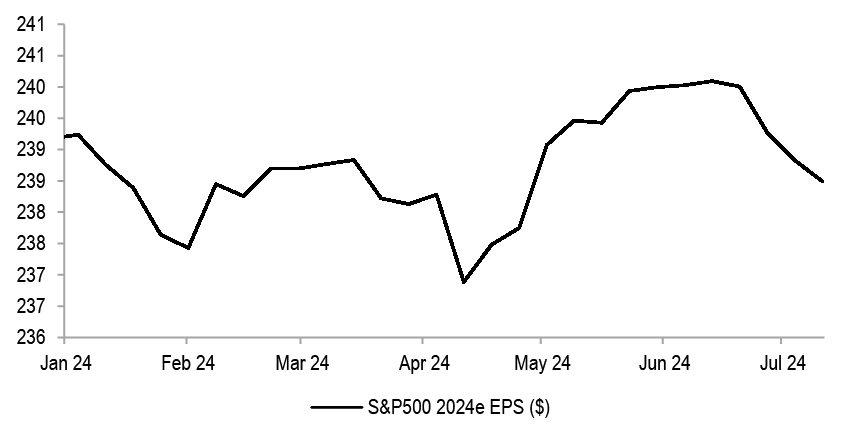
Figure 4: S&P500 2024e EPS change ytd
Source: IBES
Earnings projections for 2024 are also flat on the year.
...the consensus expects earnings to accelerate this year, by much more than what is typically seen
Figure 5: S&P500 quarterly EPS levels for different quarters
Source: Thomson Reuters
For the rest of this year, earnings are projected to increase by 15% between Q1 to Q4. This is too aggressive in our view, particularly if growth indicators continue to falter.
Table 2: The change in S&P500 EPS between Q1 and Q4 in a year
| 1Q | 2Q | 3Q | 4Q | 4Q vs 1Q | |
| 2010 | 19.7 | 21.5 | 21.8 | 22.6 | 14% |
| 2011 | 23.5 | 24.1 | 25.7 | 24.6 | 4% |
| 2012 | 25.6 | 25.8 | 26.0 | 26.3 | 3% |
| 2013 | 26.7 | 27.4 | 27.6 | 28.6 | 7% |
| 2014 | 28.2 | 30.1 | 30.0 | 30.5 | 8% |
| 2015 | 28.6 | 30.1 | 30.0 | 29.5 | 3% |
| 2016 | 27.0 | 29.6 | 31.2 | 31.3 | 16% |
| 2017 | 30.9 | 32.6 | 33.5 | 36.0 | 17% |
| 2018 | 38.1 | 41.0 | 42.7 | 41.2 | 8% |
| 2019 | 39.2 | 41.3 | 42.1 | 42.0 | 7% |
| 2020 | 33.1 | 28.0 | 38.7 | 42.6 | 29% |
| 2021 | 49.1 | 52.6 | 53.7 | 54.0 | 10% |
| 2022 | 54.8 | 57.6 | 56.0 | 53.2 | -3% |
| 2023 | 53.1 | 54.3 | 58.4 | 57.2 | 8% |
| 2024e | 56.6 | 58.7 | 63.0 | 65.2 | 15% |
| Average | 10% | ||||
| Median | 8% |
Source: Thomson Reuters
Indeed, the current 15% projection is well above the 8% median growth seen historically for Q4 EPS compared to Q1.
Table 3: Q2 ‘24e EPS Growth for key regions
| Q2 '24e EPS growth, %y/y | ||||
| US | Europe | Eurozone | Japan | |
| Energy | 0% | -10% | -6% | 15% |
| Materials | -11% | 12% | 17% | -16% |
| Industrials | -5% | -2% | 1% | 8% |
| Discretionary | 7% | 10% | 12% | 4% |
| Staples | 0% | -1% | -4% | -6% |
| Financials | 12% | 2% | 11% | 5% |
| Health Care | 15% | 1% | -8% | -7% |
| IT | 17% | -1% | -7% | 11% |
| Com. Services | 20% | 28% | 31% | 2% |
| Utilities | 5% | 9% | 10% | -55% |
| Real Estate | -9% | 5% | -4% | -4% |
| Market | 9% | 1% | 6% | -3% |
| Market Ex-Financials | 9% | 1% | 2% | -4% |
| Market Ex-Energy | 10% | 3% | 8% | -3% |
| Cyclicals | 7% | 2% | 6% | 4% |
| Defensives | 12% | 5% | 5% | -19% |
| Value | 9% | -1% | 7% | 7% |
| Growth | 13% | 1% | -8% | 0% |
Source: : J.P.Morgan, Datastream
The Q2 ’24 hurdle rate appears fairly high for the US, at +9% y/y, though it looks more manageable in Europe, at +1%y/y.
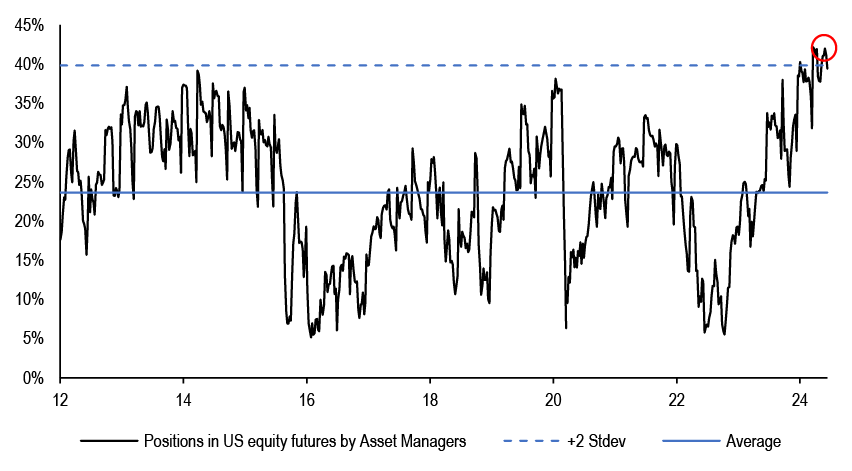
Figure 6: Positions in US Equity futures by Asset Managers
Source: J.P. Morgan Flows & Liquidity Team
At the same time, market is trading near highs, and positioning is stretched, leaving little room to absorb any disappointments.
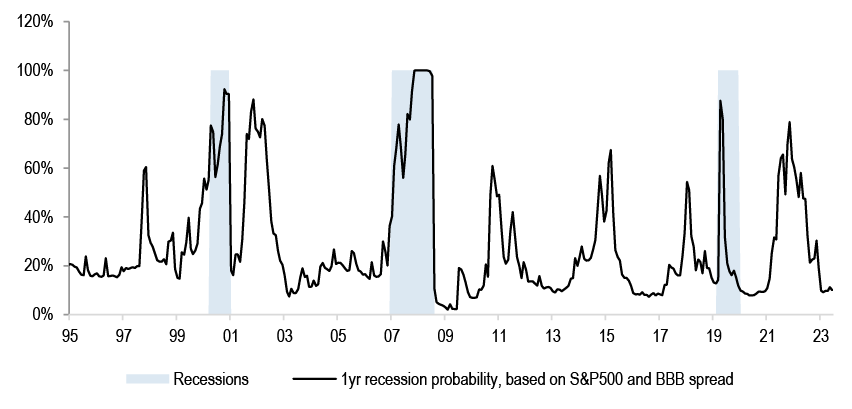
Figure 7: Recession probability indicator
Source: J.P. Morgan
There are clear signs of complacency with respect to the economic and market outlook, evident among forecasters and investors, where implied recession odds are at record lows.
Figure 8: Median 1 day performance of S&P500 companies beating and missing EPS estimates

Source: Bloomberg Finance L.P.
Notably, taking into consideration the 10% of S&P500 companies that have reported so far, stocks that are missing EPS estimates are being penalized more than usual.
Table 4: US 2Q ‘24 earnings so far
| SPX | |
| % cos reported | 10% |
| % cos beating EPS | 82% |
| EPS %y/y | 8% |
| % cos beating Sales | 45% |
| Sales %y/y | 9% |
Source: Bloomberg Finance L.P., J.P.Morgan
For the 10% of S&P500 companies that have reported, Q2 EPS growth is coming out at +8% y/y.
Table 5: Q2 ‘24e Sales Growth for key regions
| Q2 '24e Sales growth, %y/y | ||||
| US | Europe | Eurozone | Japan | |
| Energy | 6% | 4% | 5% | 3% |
| Materials | -2% | -2% | -3% | 5% |
| Industrials | -1% | 3% | 2% | 5% |
| Discretionary | 4% | 0% | -1% | 7% |
| Staples | 1% | 2% | 3% | 6% |
| Financials | 2% | 5% | 5% | -9% |
| Health Care | 6% | 0% | 3% | 5% |
| IT | 10% | -2% | -2% | 4% |
| Com. Services | 7% | 1% | 0% | 2% |
| Utilities | 5% | 6% | 6% | -7% |
| Real Estate | 7% | 10% | 9% | 8% |
| Market | 4% | 2% | 2% | 4% |
| Market Ex-Financials | 5% | 1% | 1% | 5% |
| Market Ex-Energy | 4% | 2% | 1% | 4% |
| Cyclicals | 4% | 0% | 0% | 6% |
| Defensives | 5% | 2% | 3% | 2% |
| Value | 4% | 5% | 5% | -4% |
| Growth | 6% | 0% | 2% | 5% |
Source: J.P.Morgan , Datastream
Consensus sales expectations for the quarter stand at +4% y/y in the US, and +2% y/y in Europe.
Recent consumer weakness could weigh on guidance… there have been a number of profit warnings already
Figure 9: Eurozone retail sales and consumer confidence

Source: Bloomberg Finance L.P.
While we have some sympathy with the view that European consumer could do better this year, given the softness last year and given the improvement in real disposable incomes, our concern is that this should not be generalized.
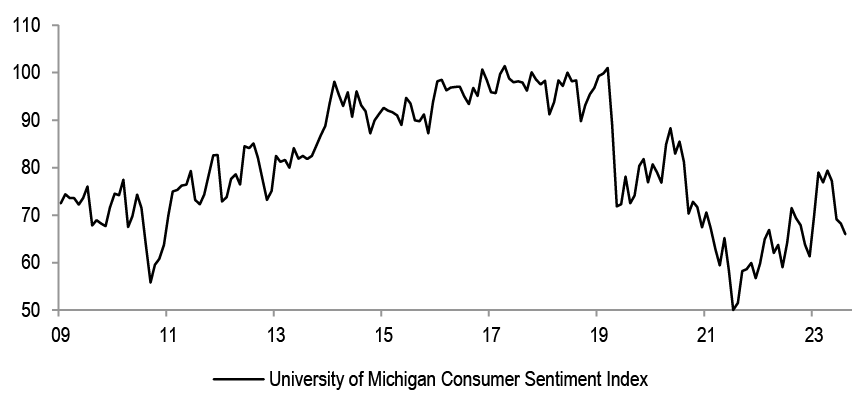
Figure 10: University of Michigan Consumer Sentiment Index
Source: Bloomberg Finance L.P.
For the US consumer, a number of indicators are starting to soften.
Figure 11: US Retail sales control group

Source: Bloomberg Finance L.P.
While the latest US retail sales print was better, consumer activity is still on a downtrend, post the strong reopening drive.
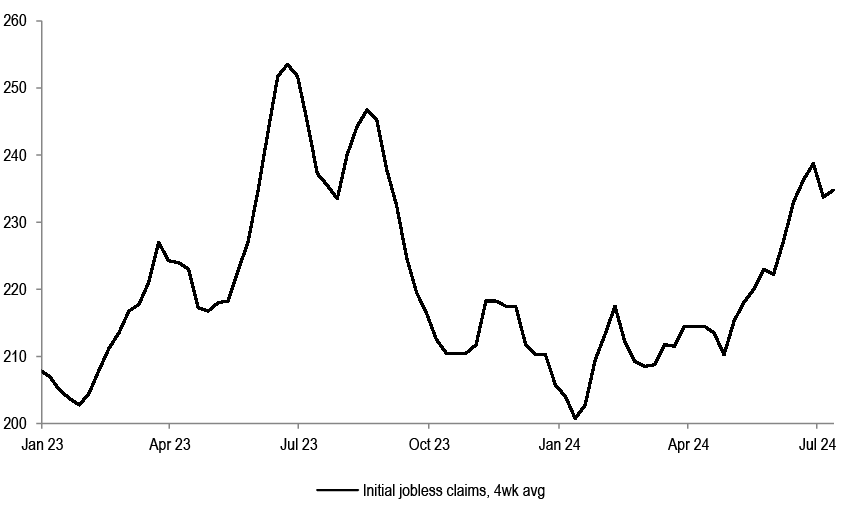
Figure 12: Initial jobless claims
Source: Bloomberg Finance L.P.
Initial jobless claims have been trending higher in the US.
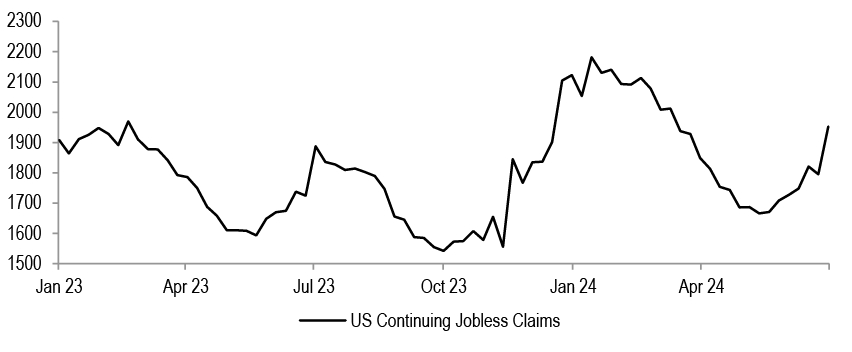
Figure 13: US Continuing Jobless claims
Source: Bloomberg Finance L.P.
Continuing claims have been moving up, too.
Figure 14: US jobless claims and S&P500 operating EPS
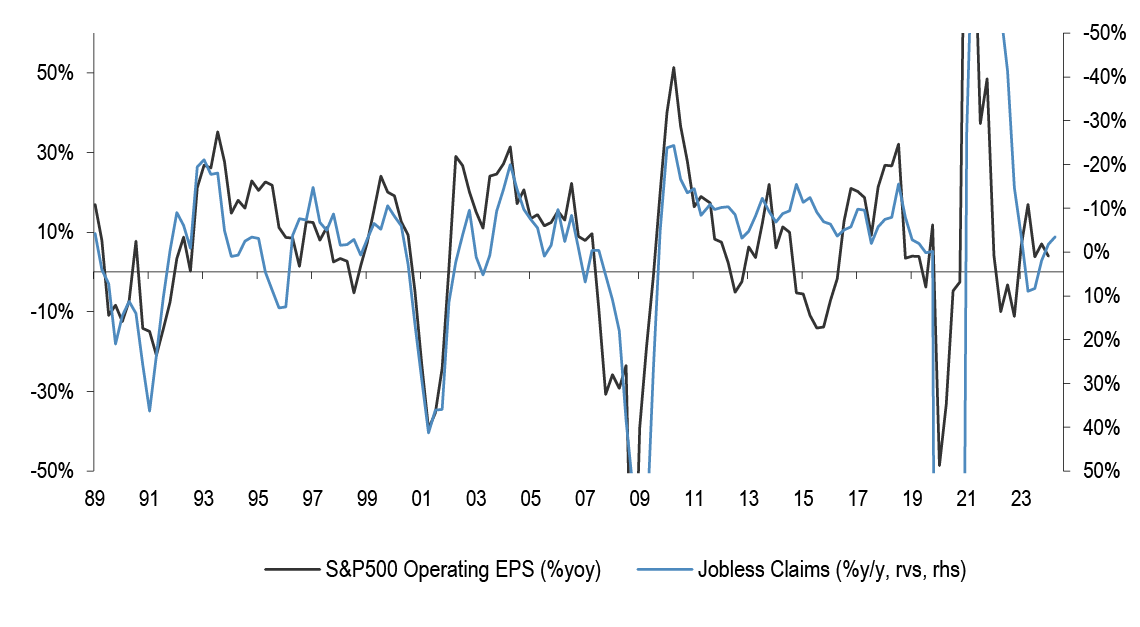
Source: Bloomberg Finance L.P., S&P500
Historically, rising jobless claims are associated with weakening earnings growth.
Figure 15: US unemployment rate
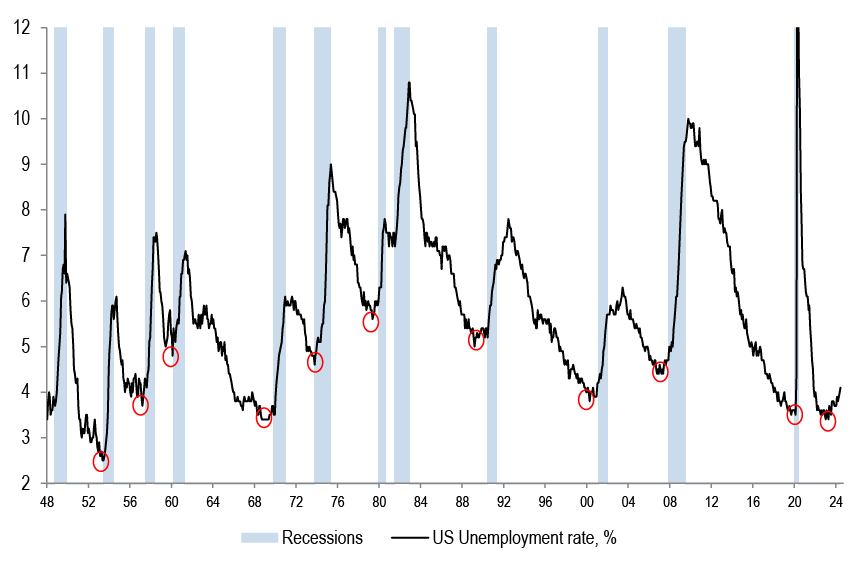
Source: Bloomberg Finance L.P.
Unemployment rate has been moving higher of late, which was typically a sign of a downturn.
Figure 16: US Quits rate and Atlanta Fed wage tracker

Source: Bloomberg Finance L.P.
The downshift in number of employees quitting in the US is consistent with slower pace of wage growth going forward, and thereby slowing in consumer spend.
Figure 17: Smartbuzz Group Consumer Sentiment - US and US Consumer Confidence
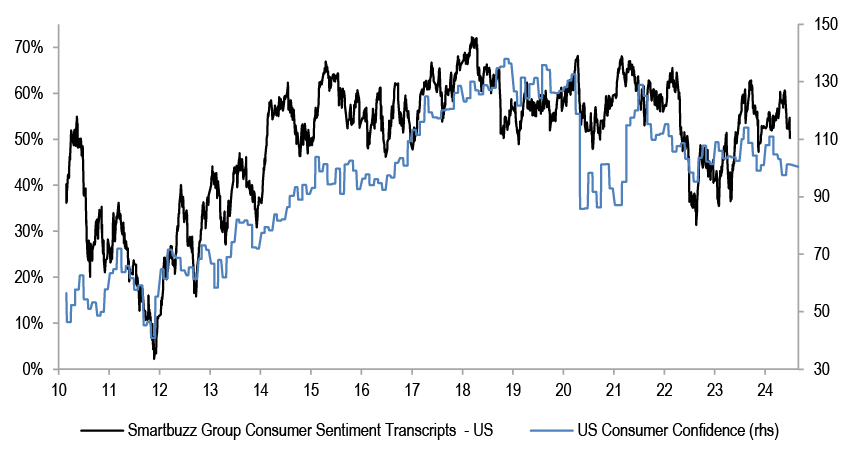
Source: Bloomberg Finance L.P., Smartbuzz
The JPM Smartbuzz tool that uses an NLP framework to track market themes from earnings call transcripts shows US corporate sentiment on the consumer strength is starting to roll over, and is consistent with the weakening consumer confidence survey.
Figure 18: Smartbuzz Group Margin - US and NFIB - Plans to raise prices in next 3 months
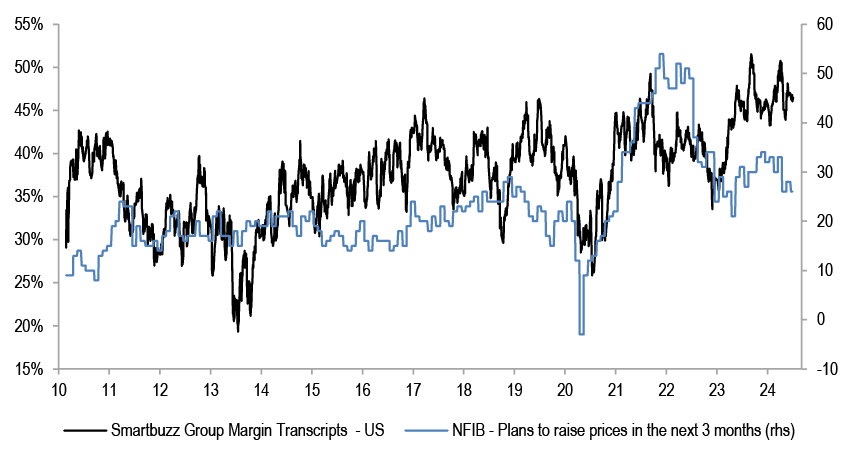
Source: Bloomberg Finance L.P., Smartbuzz
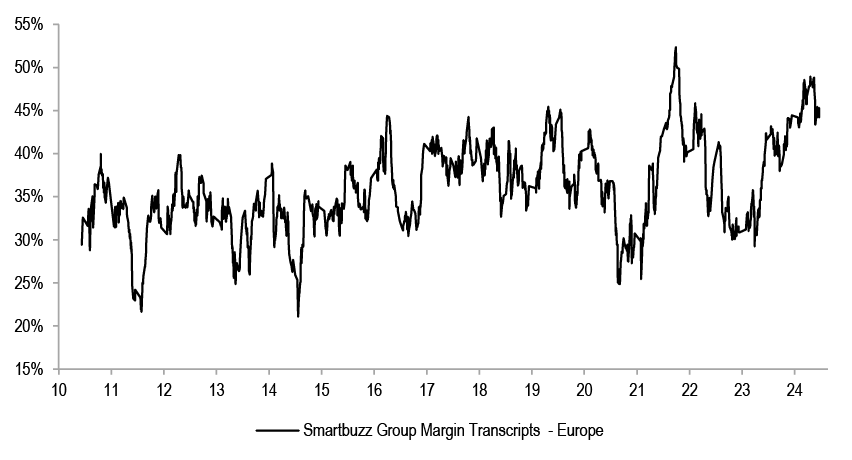
US corporate sentiment on margins is also likely to move lower through the upcoming earnings season, in our view, driven by the combination of weaker consumer and the rollover in pricing power.
Figure 19: Smartbuzz Group Margin - Europe
Source: J.P. Morgan, Smartbuzz
This is true for Europe, as well.
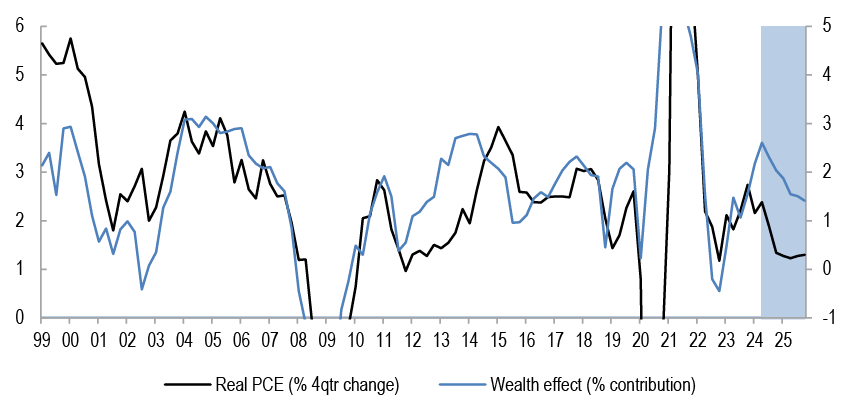
Figure 20: US real spending and wealth effects
Source: J.P. Morgan.
Notably, while our economists remain more positive on the consumer, they project support to spending from the improving ‘wealth effect’, which has been a major driver of consumer strength post-pandemic, to fade.
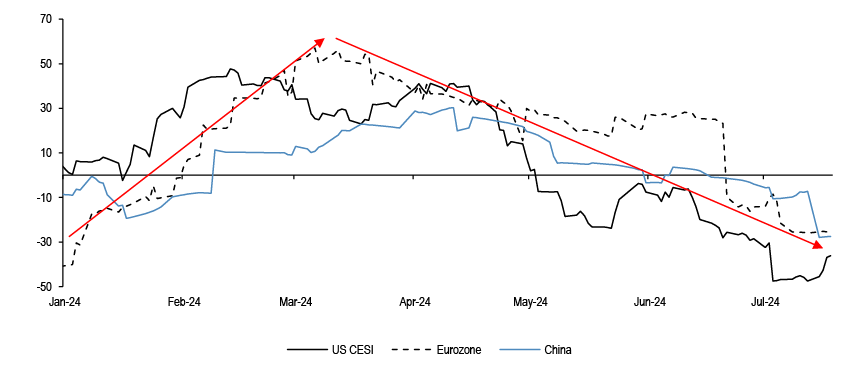
Figure 21: Key regions CESI
Source: Bloomberg Finance L.P.
In addition to the softening in labour market indicators, activity momentum is showing signs of cracking, too. Economic surprise indices have moved into negative territory across key regions in the past months.
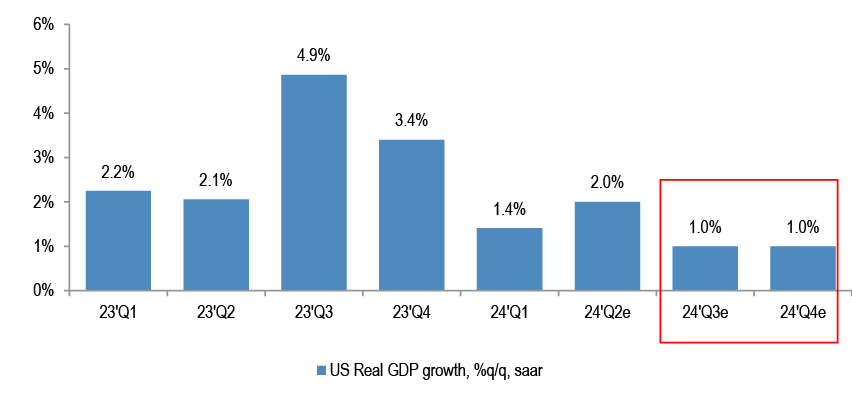
Figure 22: JPM US Real GDP growth projections
Source: J.P. Morgan.
Our economists project a slowdown in growth momentum in the US in 2H of this year, which is also likely to put pressure on corporate profitability.
Table 6: Chinese data watch
| Jun-23 | Jul-23 | Aug-23 | Sep-23 | Oct-23 | Nov-23 | Dec-23 | Jan-24 | Feb-24 | Mar-24 | Apr-24 | May-24 | Jun-24 | |
| Manufacturing PMI | |||||||||||||
| Caixan | 50.5 | 49.2 | 51.0 | 50.6 | 49.5 | 50.7 | 50.8 | 50.8 | 50.9 | 51.1 | 51.4 | 51.7 | 51.8 |
| NBS | 49.0 | 49.3 | 49.7 | 50.2 | 49.5 | 49.4 | 49.0 | 49.2 | 49.1 | 50.8 | 50.4 | 49.5 | 49.5 |
| Services PMI | |||||||||||||
| Caixan | 53.9 | 54.1 | 51.8 | 50.2 | 50.4 | 51.5 | 52.9 | 52.7 | 52.5 | 52.7 | 52.5 | 54.0 | 51.2 |
| NBS | 53.2 | 51.5 | 51.0 | 51.7 | 50.6 | 50.2 | 50.4 | 50.7 | 51.4 | 53.0 | 51.2 | 51.1 | 50.5 |
| Composite PMI - Caixan | 52.5 | 51.9 | 51.7 | 50.9 | 50.0 | 51.6 | 52.6 | 52.5 | 52.5 | 52.7 | 52.8 | 54.1 | 52.8 |
| Industry | |||||||||||||
| Electricity Production, %oya | 2.8% | 3.6% | 1.1% | 7.7% | 5.2% | 8.4% | 8.0% | - | - | 2.8% | 3.1% | 2.3% | 2.3% |
| IP, %oya | 4.4% | 3.7% | 4.5% | 4.5% | 4.6% | 6.6% | 6.8% | - | - | 4.5% | 6.7% | 5.6% | 5.3% |
| FAI, %oya | 3.8% | 3.4% | 3.2% | 3.1% | 2.9% | 2.9% | 3.0% | - | 4.2% | 4.5% | 4.2% | 4.0% | 3.9% |
| Consumer Activity | |||||||||||||
| Retail Sales, %oya | 3.1% | 2.5% | 4.6% | 5.5% | 7.6% | 10.1% | 7.4% | - | - | 3.1% | 2.3% | 3.7% | 2.0% |
| Passenger Car Sales, %yoy | 2.1% | -3.4% | 6.9% | 6.7% | 11.5% | 25.5% | 23.3% | 44.0% | -19.4% | 10.9% | 10.5% | 1.2% | -2.3% |
| 70-city house price index, %oya | -0.4% | -0.6% | -0.6% | -0.6% | -0.6% | -0.7% | -0.9% | -1.2% | -1.9% | -2.7% | -3.5% | -4.3% | |
| Liquidity & Monetary Conditions | |||||||||||||
| M2, %oya | 11.3% | 10.7% | 10.6% | 10.3% | 10.3% | 10.0% | 9.7% | 8.7% | 8.7% | 8.3% | 7.2% | 7.0% | 6.2% |
| FX Reserves (bln yuan) | 3193 | 3204 | 3160 | 3115 | 3101 | 3172 | 3238 | 3219 | 3226 | 3246 | 3201 | 3232 | 3222 |
| New Loan Creation (bln yuan) | 3050 | 346 | 1358 | 2312 | 738 | 1089 | 1171 | 4914 | 1456 | 3089 | 731 | 945 | 2126 |
Source: Bloomberg Finance L.P., J.P. Morgan.
Recent weakness in China activity is likely to impact European earnings, given their sizeable revenue exposure to the region.
Table 7: Profit warnings this quarter
| Company Name | Company Ticker | Commentary | Date | 1Day Perf relative to market, % | Sector |
| YOUGOV PLC | YOU LN | YouGov shares plunge after polling and data analytics group warned that annual profits would fall short of forecasts | 20 Jun | -47.2% | Communication Services |
| SIG PLC | SHI LN | SIG profit warns due to challenging market conditions | 24 Jun | -5.8% | Industrials |
| AIRBUS SE | AIR FP | Airbus shares fall as plane maker cuts profit forecast as its supply chain disruptions worsened | 25 Jun | -9.2% | Industrials |
| POOL CORP | POOL US | Pool shares slump after swimming pool supplies distributor slashes earnings forecast citing challenges in discretionary parts of its business amid cautious consumer spending | 25 Jun | -8.4% | Discretionary |
| SOUTHWEST AIRLINES CO | LUV US | Southwest Air cuts revenue outlook as CEO fends off activist | 26 Jun | -0.4% | Industrials |
| WALGREENS BOOTS ALLIANCE INC | WBA US | Walgreens shares plunge on outlook cut and more stores closings in continued challenging environment | 27 Jun | -22.2% | Staples |
| HENNES & MAURITZ AB-B SHS | HMB SS | H&M profit warns due to a challenging macro environment that will influence purchasing costs and sales revenues | 27 Jun | -12.5% | Discretionary |
| NIKE INC -CL B | NKE US | Nike tumbles after warning that it expects sales to drop 10% during its current quarter | 28 Jun | -19.6% | Discretionary |
| AIR FRANCE-KLM | AF FP | Air France expects revenue and profit hit as fliers avoid Paris Olympics | 01 Jul | -1.9% | Industrials |
| NANOCO GROUP PLC | NANO LN | Nanoco Group profit warns because of order delay | 02 Jul | -24.3% | IT |
| NORWEGIAN AIR SHUTTLE AS | NAS NO | Norwegian Air shares slide after the carrier cut its EBIT outlook, citing highter costs, softer traffic demand and aircraft delivery delays from Boeing. | 04 Jul | -17.0% | Industrials |
| DASSAULT SYSTEMES SE | DSY FP | Dassault profit warns as transaction delays hit second quarter | 09 Jul | -4.2% | IT |
| INDIVIOR PLC | INDV LN | Indivor shares slump as the company cut its full year guidance blaming adverse market dynamics | 09 Jul | -35.3% | Health Care |
| PAGEGROUP PLC | PAGE LN | Pagegroup profit warns due to tougher hiring market | 09 Jul | -3.3% | Industrials |
| VOLKSWAGEN AG-PREF | VOW3 GY | Volkswagen shares slipped after an overnight profit warning triggered in part by the possible closure of an Audi plant and 3.8% drop in second quarter sales dented by China | 10 Jul | -1.2% | Discretionary |
| DEUTSCHE LUFTHANSA-REG | LHA GY | Deutsche Lufthansa profit warns as it is becoming increasingly challenging for the airline as it contends with negative market trends and aircraft delivery delays | 12 Jul | -0.1% | Discretionary |
| TOPDANMARK A/S | TOP DC | Topdanmark profit warns as its profit forecast for the year after booking one time costs related to IT seperation segment with Nordea | 12 Jul | -0.6% | Consumer Discretionary |
| HUGO BOSS AG -ORD | BOSS GY | Hugo boss profit warns due to ongoing implications on global consumer sentiment, which are likely to weigh on industry growth | 15 Jul | -1.9% | Discretionary |
| AUTONATION INC | AN US | AutoNation issues profit warning after disruptions from CDK cyberattack | 15 Jul | 1.7% | Discretionary |
| BURBERRY GROUP PLC | BRBY LN | Burberry profit warns due to luxury market proving to be more challenging led by weak demand from Chinese consumers | 15 Jul | -15.2% | Discretionary |
| LINDEX GROUP OYJ | LINDEX FH | Lindex profit warns on fashion market volatility | 15 Jul | -6.3% | Discretionary |
| SWATCH GROUP AG/THE-BR | UHR SW | Swatch profit warns due to decline in sales triggered by sharp drop in demand for luxury goods in China | 15 Jul | -8.8% | Discretionary |
| SPIRIT AIRLINES INC | SAVE US | Spirit airlines drops after discount airline warning that its quarterly loss will be bigger than expected on weaker fee revenue | 16 Jul | 2.3% | Discretionary |
| SCOR SE | SCR FP | Scor shares tumble after the French reinsurer issued a profit warning for it life and health business | 16 Jul | -24.3% | Discretionary |
| LESLIE'S INC | LESL US | Leslie outlook cut citing weak product market | 17 Jul | 1.1% | Discretionary |
| UNITED AIRLINES HOLDINGS INC | UAL US | United airlines forecast a lower than expected profit in current quarter and announced plans to cut capacity | 18 Jul | 0.0% | Industrials |
Source: Bloomberg Finance L.P.
The warnings are not limited to consumer, but other sectors have been warning too.
At a regional level, at face value hurdle rate appears less challenging in Europe
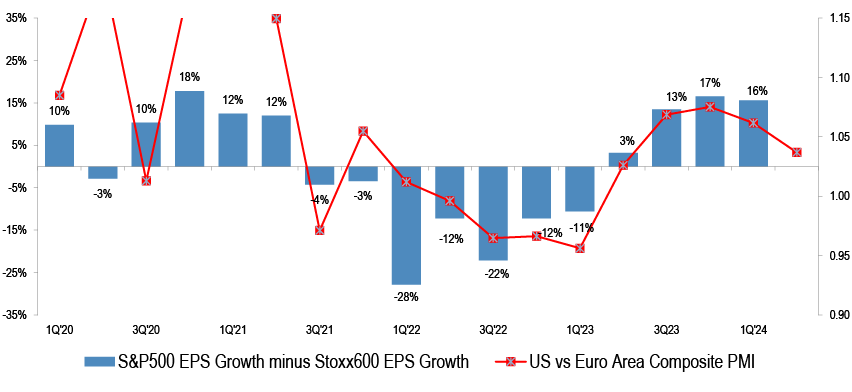
Figure 23: US vs Europe EPS Growth vs PMI
Source: S&PGlobal, Datastream, Bloomberg Finance L.P., J.P.Morgan
At a regional level, the rollover in relative activity momentum, combined with the easier hurdle rate for Europe, points to improving earnings delivery in Europe relative to the US.
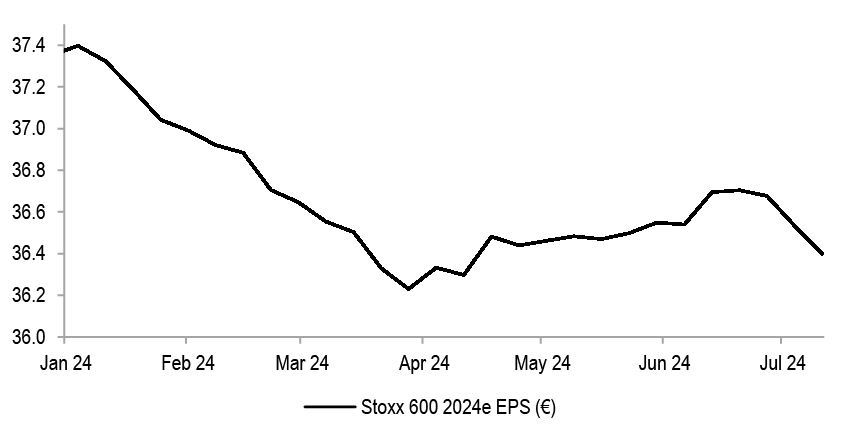
Figure 24: Stoxx 600 2024e EPS change ytd
Source: IBES
European 2024 EPS projections have been downgraded by 3% so far this year.
Table 8: Q2 ‘24e Median EPS growth for US and Europe, %y/y
| Q2 '24e Median EPS growth, %y/y | ||
| US | Europe | |
| Energy | 7% | -6% |
| Materials | 4% | 0% |
| Industrials | 6% | 1% |
| Discretionary | 0% | 9% |
| Staples | -1% | 1% |
| Financials | 9% | 5% |
| Health Care | 1% | 0% |
| IT | 4% | 1% |
| Com. Services | 2% | 15% |
| Utilities | 12% | 8% |
| Real Estate | -2% | 5% |
| Market | 4% | 5% |
| Cyclicals | 4% | 3% |
| Defensives | 3% | 7% |
Source: Datastream, J.P.Morgan
While at face value, European EPS is below the US, the median expectations for Q2 EPS growth is a little lower for Europe than for the US.
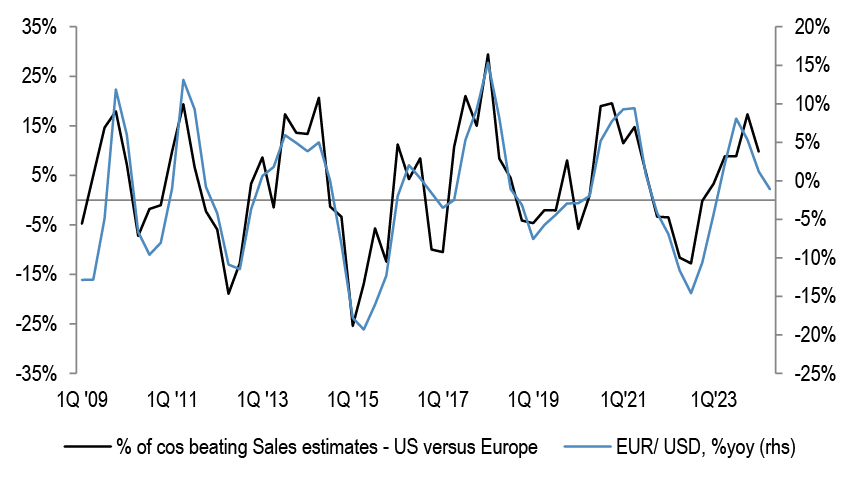
Figure 25: % of cos beating Sales estimates in US vs Europe and EUR/USD
Source: Bloomberg Finance L.P.
FX trends also point to favourable sales beats in Europe vs US.
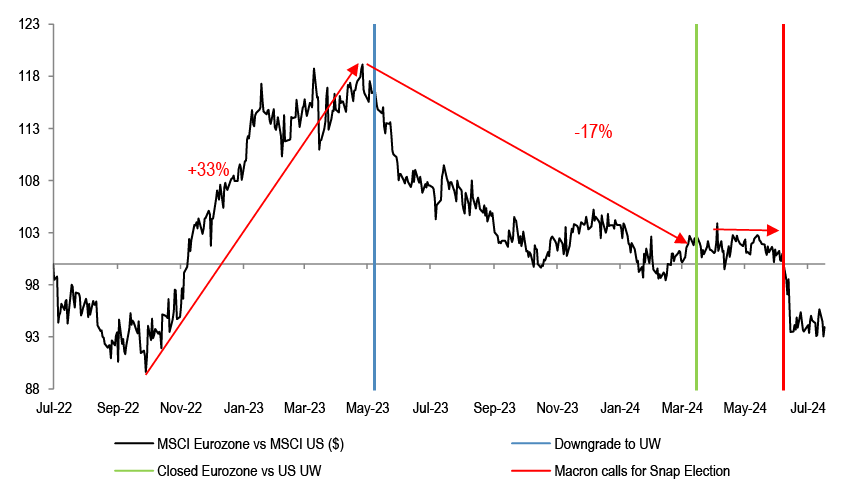
Figure 26: MSCI Eurozone vs US relative performance
Source: Datastream
In contrast to consensus, which turned bullish on Eurozone earlier in the year, and for now continue with this stance, we believe that Eurozone is unlikely to outperform the US. On a positive note, the region is much less stretched than the US entering the Q2 reporting season.
At a sector level, consensus expectations are for a convergence in earnings delivery between Mag-7 and rest of the market...
Table 9: Earnings growth for Magnificent 7 companies and S&P500 ex Magnificent 7
| Earnings Growth | Q1' 24 | Q2 '24e |
| Alphabet | 57% | 26% |
| Amazon | 231% | 59% |
| Apple | -2% | 3% |
| Meta Platforms | 111% | 56% |
| Microsoft | 20% | 9% |
| Nvidia | 468% | 134% |
| Tesla | -47% | -31% |
| Magnificent 7 | 53% | 29% |
| SPX | 8% | 9% |
| SPX ex Magnificent 7 | 0% | 5% |
Source: Bloomberg Finance L.P., Datastream, J.P.Morgan
Mag-7 stocks have been the main contributor to S&P500 earnings growth for a while, and are yet again expected to deliver elevated earnings growth for Q2 at +29% y/y. This is down from +53% y/y since last quarter.
Figure 27: S&P500 and S&P500 ex Magnificent 7 earnings growth, %y/y
Source: J.P.Morgan, Datastream, Bloomberg Finance L.P.
Excluding this group, S&P500 EPS growth was negative in each of the last 5 quarters. Consensus projections are for a broadening in earnings delivery this quarter, expecting S&P500 ex Mag-7 to come in positive for the first time since 2022.
Figure 28: Mag-7 and S&P500 ex Mag 7 Earnings surprise

Source: Bloomberg Finance L.P., J.P. Morgan
In each of the past 5 quarters, Mag-7 stocks delivered bigger earnings surprises than the rest of the market.
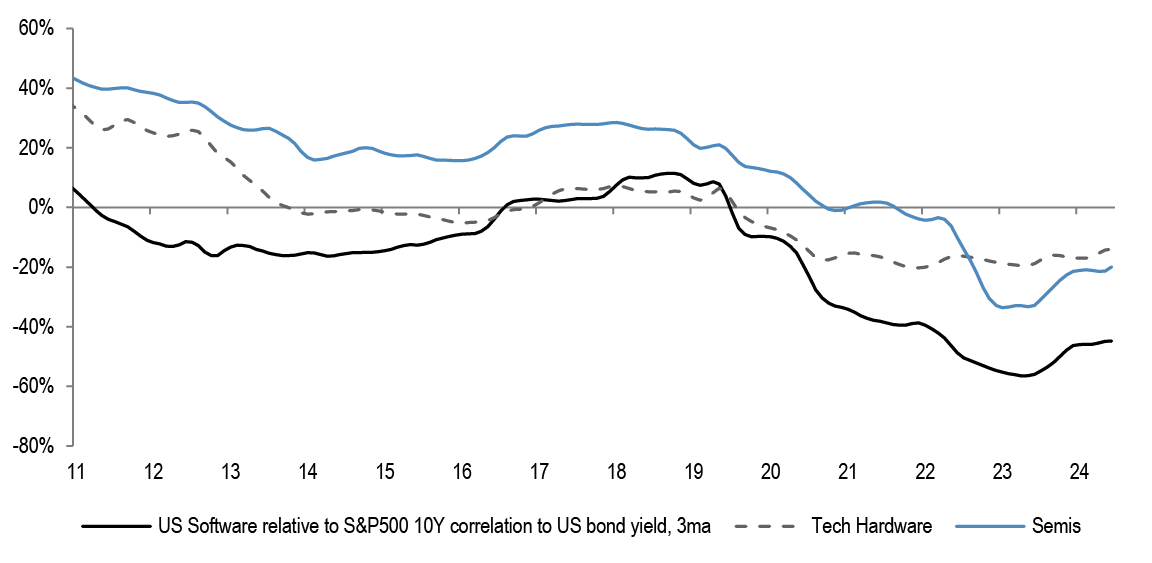
...within Tech, we recommended last month to rotate from Hardware/Semis into Software
Figure 29: Tech subsectors correlation to US 10Y bond yield
Source: Bloomberg Finance L.P., Datastream
Within Tech, we recommended to move away from Hardware/Semis and into Software. Software sector is best placed to benefit from lower bond yields, in our view.
Figure 30: SOX relative and ISM
Source: Bloomberg Finance L.P., J.P. Morgan
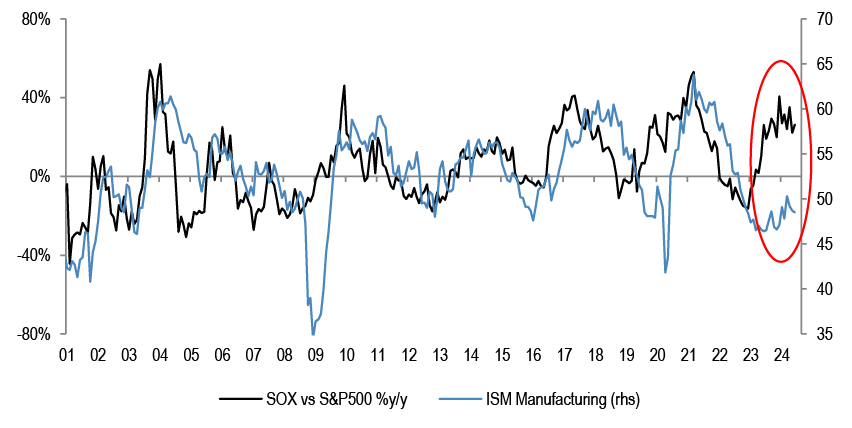
SOX index is geared to activity momentum, but a substantial gap has opened up in the last quarters. On top of this, the latest ISM manufacturing print moved lower again pointing to downside risk for semis.
Defensives are projected to come in stronger than Cyclicals
Figure 31: S&P500 Cyclicals vs Defensives median earnings growth
Source: J.P. Morgan, Bloomberg Finance L.P. *Includes Q2 projections
Q1 ‘24 marked the first quarter since 2020 that S&P500 median earnings growth for Cyclicals underwhelmed vs Defensives. This trend is likely to continue for Q2, in our view.
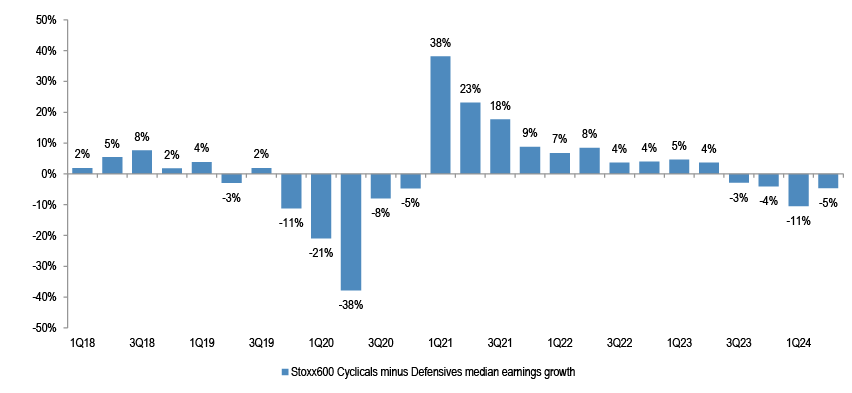
Figure 32: Stoxx600 Cyclicals vs Defensives median earnings growth
Source: J.P. Morgan, Bloomberg Finance L.P. * Includes Q2 projections
In Europe, Cyclicals have been weaker for some time now; Cyclicals vs Defensives median EPS growth projected to stay negative in Q2.
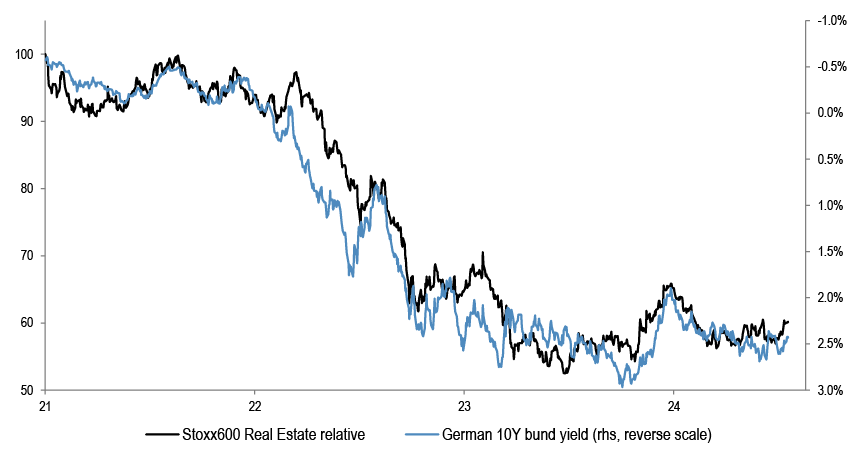
Figure 33: Stoxx 600 Real Estate relative and German 10Y bond yield
Source: Bloomberg Finance L.P.
In April, we argued to add to bond-proxy Defensive sectors like Utilities and Real Estate, on a likely move lower in bond yields.
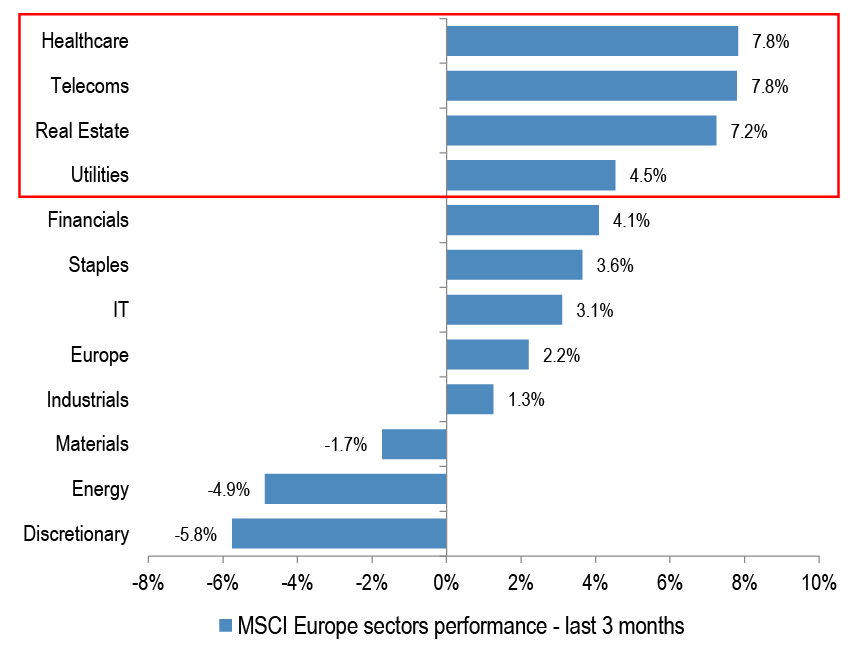
Figure 34: MSCI Europe sectors performance - last 3 months
Source: Datastream
Encouragingly, there has been a turn in performance in the last months, with Defensive sectors catching a bid.
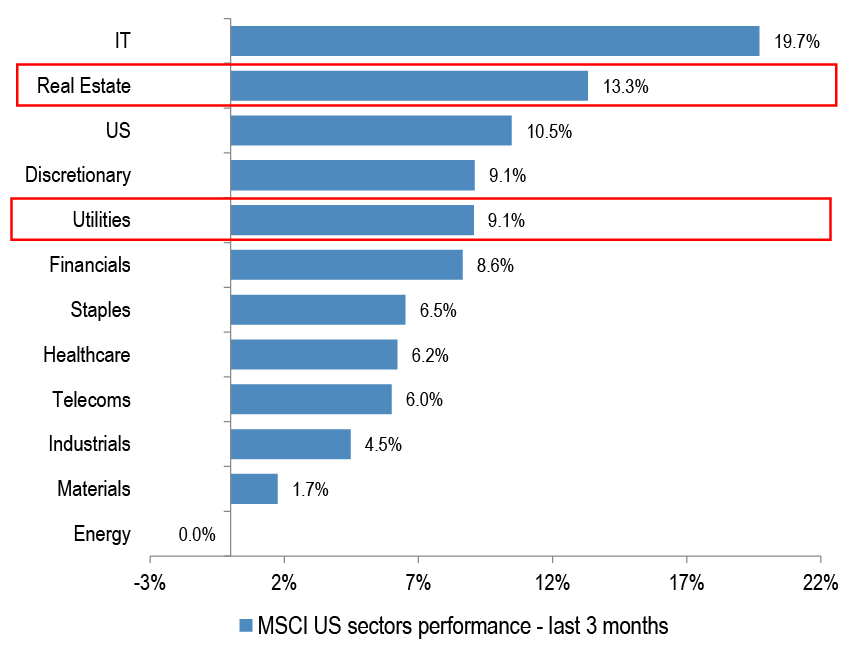
Figure 35: MSCI US sectors performance - last 3 months
Source: Datastream
In the US too, Real Estate and Utilities are up meaningfully in the last 3 months, seeing a big swing post being the worst performing sectors in Q1.
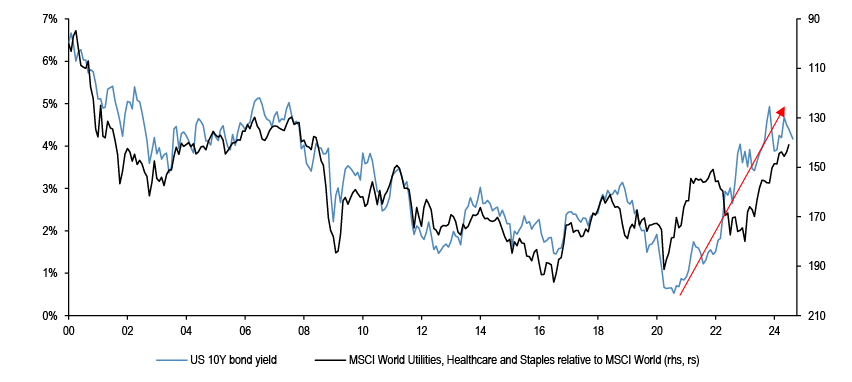
Figure 36: MSCI World Defensives relative and US10Y bond yields
Source: Datastream
If bond yields give back some of their strong up move over the last few years, Defensive sectors are likely to fare better.
We called last month for Small caps to start trading better than Large caps in UK and Eurozone
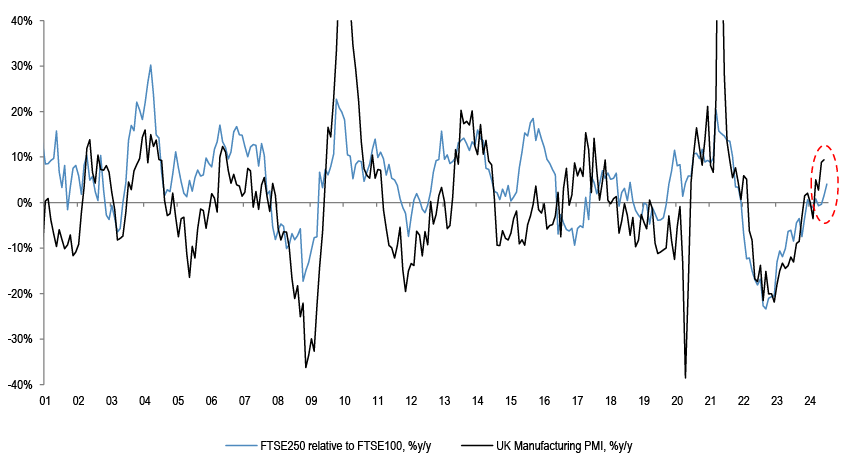
Figure 37: FTSE250 relative to FTSE100 and UK Manufacturing PMI
Source: Datastream, J.P. Morgan
We have been UW UK small caps for the last 2.5 years, and have recently reversed the trade. Domestic activity momentum is a key driver of small vs large cap performance. The recent improvement in UK manufacturing PMI should translate into better earnings and performance for FTSE250 relative to FTSE100.
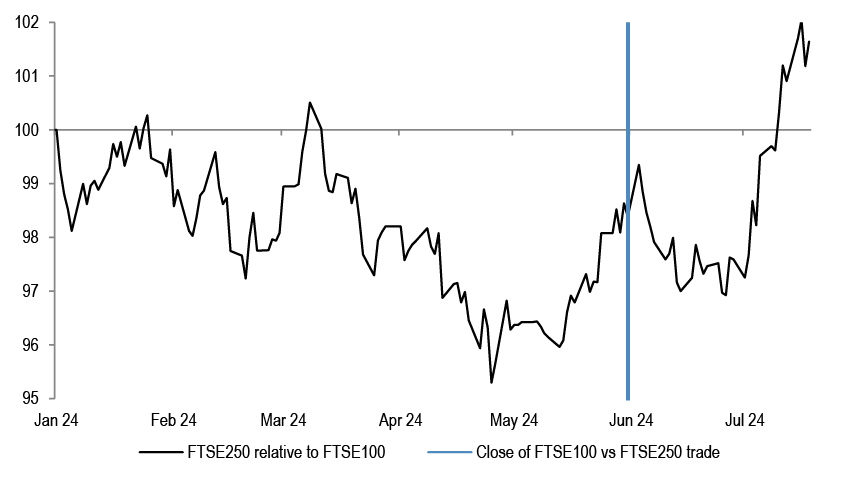
Figure 38: FTSE250 relative to FTSE100 ytd
Source: Datastream
Encouragingly, FTSE250 has started to move above FTSE100 in the last few weeks.
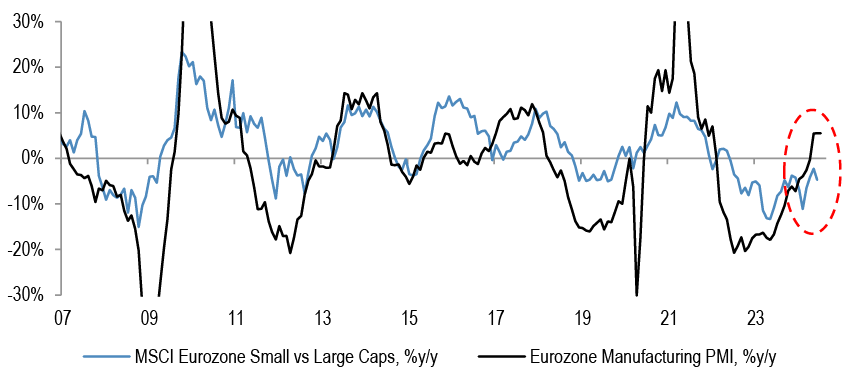
Figure 39: Eurozone small vs large caps and Eurozone manufacturing PMI
Source: Datastream, J.P. Morgan
Eurozone small vs large caps are also likely to fare better on the back of the improvement in PMIs.
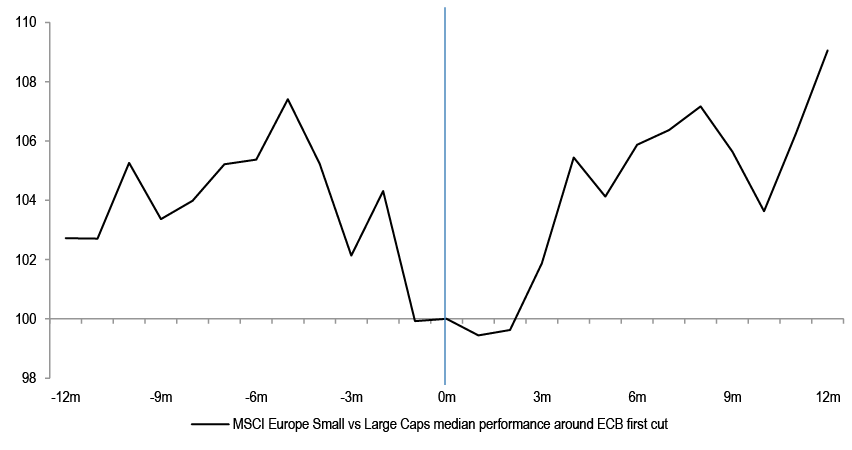
Figure 40: MSCI Europe Small vs large cap performance around ECB first cut
Source: Datastream
European small caps tend to outperform large caps post the start of rate cut cycle.
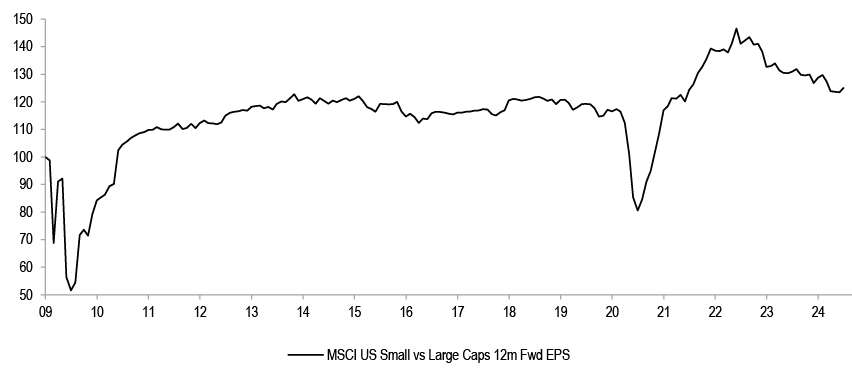
Figure 41: MSCI US Small vs Large Caps 12m Fwd EPS
Source: Datastream
Small vs large caps earnings in the US have been trending lower for the last 3 years.
Table 10: Q2 earnings preview commentary by sector analysts
| Sector | (+) / (-) | Comments |
| Energy | (+) | Sector analysts maintain a constructive buy the dips EU Oils thesis with near term oil price upside toward $90/bbl Brent (JPM Commodities 3Q inventory draw >1mb/d, rising risk premium) and ‘committed’ cash breakevens firmly ‘in-the-money’ at $50-55/boe post capex/divs. This underpins attractive valuations; EPS expectations are well underpinned and a 11.1% 2024/25e base case FCF yield at $80/bbl rises >12% at $90. The re- emergence of MTM yields more firmly in double-digit % territory could prove a positive trigger by providing the additional ‘cushion’ against demand/macro risks. Q screens as solid but unspectacular. Lower refining and seasonal gas trading moderation are main deviations in sequential O&G conditions and 12M rolling EU Oils CFFO $165bn is >30% below 2022 peak but still top quartile vs. broader history. Their 2Q ideas preference gearing to (upstream) oil and bifurcation in messaging on 2H strategic execution. They suggest staying OW Shell for LNG upside, self-help momentum and are sellers of any notable strength in UW BP as underperformance leaves a balanced 2Q risk/reward. They recommend long Eni (JPM Positive Catalyst Watch) for oil gearing and emergent 2H+ degearing and short a step change in Equinor’s re-gearing/falling TSR profile (Negative Catalyst Watch). In the midcaps, they would buy potential weakness in OW Repsol’s upcoming trading statement (yield/restructuring) and stay away from UW Neste. |
| Chemicals | (+)/(-) | Most European chemical companies saw a good demand recovery, also above-seasonal in some cases, in 1Q24 from the very depressed 2H23 levels. This was driven by easing customer destocking (which had been a significant drag from 2H22 onwards) and possibly also modest restocking in select cases reflecting a slight improvement vs. 2H23 in macro indicators (manufacturing PMIs and the associated new orders to finished good ratio). The macro improvement since 2Q24 has slowed, if not stalled. This has meant that some modest improvement in the consensus earnings momentum which was seen post 1Q prints, hasn’t yet translated into a broad-based upgrade cycle. If anything, sector analysts have seen further small downgrades to FY24 consensus for multiple companies reflecting a still slower and patchy demand environment from one month to the next. Given the current industry oversupply, especially in China, they note a stronger macro impulse will also be needed for pricing power to improve from the current trough levels across most commodity chemical segments. Overall, while they acknowledge that the broad-based earnings rebound in the sector is still taking longer than our expectations, they retain a positive bias on the sector given that valuations for most stocks remain below long-term levels even on a relatively depressed earnings base. Looking into 2Q, they tactically prefer exposure to stocks with more supportive near-term consensus earnings outlook - Solvay (OW, placed on Positive Catalyst Watch), Evonik (OW) and Novonesis (OW) - vs. the ones where they see a higher risk of material earnings downside risk - Wacker (N, recently placed on Negative Catalyst Watch) and DSM-Firmenich (UW). |
| Metals & Mining | (+)/(-) | European Metals & Mining has underperformed (SXXP) by 7% YTD and typical macro-economic drivers are muted for H2’24; JPM Economists predict ~4.5% China GDP growth and no significant stimulus, plus the US election in Q4 is likely to amplify macro uncertainty. Our sector analysts retain their OW on Anglo American but they now see significant risk to management’s restructuring strategy due to a major fire at coal mine Grosvenor, which is likely to delay Anglo’s imminent divestment of its Coal division. Rio Tinto’s (OW) shares are vulnerable to seasonal downside risks for iron ore in Q3 but they believe its ~4.5x 2024/25E and 8% FCF yield already discounts ~$80/t iron ore ($110/t currently). They previously placed Norsk Hydro (OW) on Positive Catalyst Watch for Q2 results (23rd July) and our NOK 88 Dec’25 PT carries ~30% upside. They expect Boliden (Neutral) will miss Q2 net debt and FCF and expect Q2 EBITDA will be boosted by a SEK 2.4bn one-off insurance receipt. |
| Capital Goods | (+)/(-) | Sector analysts expect a Q2 trading backdrop largely unchanged from that of the Q1, see few surprises on the numbers, and forecast an average 2% miss on earnings. However, it is the outlook where they see a change, with a shift to a ‘two-speed’ demand backdrop; electrification and everything else. For the electricity value chain, including datacenters, they expect another strong quarter and any guidance upgrades will most likely come from the stocks with exposure here. Outside of electrification and specific outliers, chiefly Aerospace & Defence, the backdrop looks more mixed, consistent with manufacturing PMI momentum having clearly stalled and they see risk to the H2 numbers in our short-cycle coverage at least. Against this backdrop, and with the sector multiple rich versus history, they look to be selective both near and longer term. At this stage, subject to updated consensus numbers, heading into the Q2 reporting season, they tactically prefer ABB, Knorr-Bremse, Prysmian and Rotork, and are more cautious on Assa Abloy, Epiroc, Metso, Sandvik, Spectris and Wärtsilä. Rotork is on Positive Catalyst Watch; Metso and Wärtsilä are on Negative Catalyst Watch. |
| Aerospace & Defense | (+) | Civil Aero: Sector analysts expect a mixed quarter. Airbus new aircraft deliveries were weaker than expected in Q2; at the end of June the company lowered its delivery guidance for FY24-27. They expect a better Q2 from the aero engine companies. The engine companies lose money on new engine sales and so lower than expected new engine sales (due to lower aircraft deliveries by Airbus and Boeing) boosts their EBITA. They also expect solid growth in spare part sales. Defence: They expect good organic growth from European defence companies in Q2. The standout performer should be Rheinmetall where they expects Q2 sales will be up c40% yoy, with rising EBITA margins and improved FCF. |
| Luxury | (-) | Sector analysts expect Q2/H1 24 reporting to confirm relatively soft trends for the luxury sector, broadly in line with Q1. They think the comments on exit rates will likely be a very important focus given the easing comp base from June and the need for signals of re-acceleration to underpin the current H2 expectations. In this context, comments from companies reported so far have not indicated any material improvement and would be a key focus for upcoming conference calls. Looking into H2, based on current newsflow and latest sector trends, they think the re-acceleration might happen at a slower pace than what is currently factored into consensus and hence that earnings revision for the sector might still be skewed to the downside, which indeed has been confirmed so far by Burberry, Swatch and Hugo Boss (leading to DD% cuts in estimates) and to a lesser extent they expect it at LVMH and Kering (the latter though already embedding some positive brand inflection which currently is not apparent in our Brand Heatmap). The only name where they continue to see material upside to consensus going into H2 is Prada, which they have on Positive Catalyst Watch into H1 results. The sector has been de-rating in the last couple of months and is now trading at more compelling levels; however, with an uninspiring H1 reporting so far and ahead and still earnings cuts to come they do not see a catalyst short term to turn more constructive for now. |
| Media | (+)/(-) | Sector analysts expect broadly a continuation of Q1 trends for most companies in the Media space. Exceptions are ITV, RTL, Ubisoft and Embracer. ITV should see Q1 ad growth of 3% accelerate to 20% in Q2 partly due to strong demand during the Euros offsetting delayed advertising during the election. RTL is expected to see a slowdown in ad growth from 10% in Q1 to flat in Q2 due to the timings of easter and the euros impacting German advertising. Ubisoft and Embracer will see quiet quarters with no major releases, with several major AAA titles expected for each later in the year. |
| Retailing | (-) | For calendar Q2, the clothing segment is expected to be weighed by unfavourable weather across regions which has impacted footfall and spend (with the former likely also impacted by sporting events). Tough comps are also unhelpful early in the quarter. Sector analysts expect some pure online players such as Zalando to have proven more resilient, and indeed online traffic trends point to this, given a lesser impact from softer high street footfall, and also facing weaker comps. Such players should also benefit from some gross margin recovery given tighter buying and a more normalised inventory environment across the industry. Sales in the homewares segment are also expected to have remained weak, although particularly in DIY, gardening and big ticket. Data suggests that small-ticket items have fared better. They also note that consumer sentiment remains crucial, with mixed signals across different regions: we have seen sequential improvement in consumer confidence in regions such as Germany, UK and Spain in Q2 vs Q1, while sequentially weaker in regions such as France and Italy. On margins, they see potential headwinds from freight into next year which retailers could take the opportunity to call out (ongoing wage inflation could also be a factor). Overall, they are somewhat cautious on the outlook for Q2 (with the notable exception being Zalando, Positive CW) as the sector faced challenges from weather impacts. |
| Food&Tob | (+) | For Food/HPC sector analysts expect organic sales growth to see limited change versus the prior quarter, with Q2 JPMe +3.5%, but similarly weighted volume (+1.6%) vs pricing (+1.9%) for the first time in 3 years. Whilst volumes are on a gradually improving path, as marketing activities step up and comparatives ease, they see risks also - notably US pressures (mass beauty slowdown, and still soft food volumes) and China weakness. On margins meanwhile, they expect H124 is also set to be the most benign COGS inflation set-up which should support Gross Margin rebound +165bps, but tempered on EBIT to +55bps as A&P is further ramped up. Into Q2/H1 reporting they placed Unilever (OW) and Symrise (OW) on Positive Catalyst Watch. |
| Beverages | (+)/(-) | Sector analysts expect Q2 organic sales growth of +4.5% with volumes slightly sequentially deteriorating on shipment phasing while pricing should remain resilient. H124 should also see solid EBIT margin progression given further pricing amid fading input cost inflation. They remain positive on the Beer sub-sector which offers the best combination of EPS growth at reasonable valuation and has already seen a solid start to 2024, and prefer ABI (OW) and Heineken (OW, +ve CW) while also seeing a solid 2024 outlook for Soft Drinks (prefer CCEP). They remain most cautious on Spirits given risks of further EPS downgrades and disappointing guidance from Diageo and Pernod Ricard. The focus remains on the weakness in demand in several key markets (USA, China), though they expect that increasing pressures from volumes de-leverage and weakening mix/pricing with elevated promotions will lead to further correction on consensus margins. |
| Medtech | (-) | Sector analysts believe trends from Q1 should largely continue in Q2 with normalisation of top-line growth and improving inflation for most companies. Overall, they expect a mixed bag of results with some share price volatility to continue in Q2 on the back of positioning. They have seen early indications on this from the Carl Zeiss and Demant profit warnings, where shares were down c20% and c15% respectively on the day of the announcement. On the other hand, Ambu issued a positive pre-announcement with FY guidance raise, the shares closed up c5%. Overall, they remain cautious as they continue to see some risks from: • Ongoing headwinds in China (anti-corruption and slower consumer) • Weak development in the US dental market • Trading days benefit from Easter timing partially offset by poor weather and elections in some European countries. |
| Banks | (+)/(-) | The Banks sector has outperformed the Market by c14% YTD, now trading on 7.4x PE, 0.9x PTNAV for a RoTE of 13.3% 2026E. Our sector analysts have taken a bottom up approach to stock selection where they see a) less risk on earnings cuts (e.g. rates driven) with more market/AM exposure than NII (UBS, DBK, Intesa) and b) less Euro NII exposure considering low relative betas which are at risk of rising (NWG). Key topical areas include 2Q results as well as forward looking commentary across 2024 and the medium term: 1) The NII outlook/sensitivities considering Euro rate cuts, with a) volatile rate curves with the forward curve higher compared to 1Q but still indicating ECB rate cuts towards 2.5% in the medium term, b) rising deposit betas and the deposit pricing actions following rate cuts, c) ongoing risks of deposit migration and deposit outflows particularly with rates declining, d) higher wholesale funding costs with refinancing needs (e.g. TLTRO, TFSME). Commentary around the outlook for loan growth and potential impact of lower rates on loan demand, asset pricing and margins will also be in focus. 2) The outlook for Fees given a continued economic recovery with rising equity markets in 2Q which could impact flows and AUM. 3) Inflationary impacts on the cost base which are lagging the decline in headline inflation including stickier wage inflation, as well as the outlook for investment/regulatory spend. 4) IFRS9 provisioning given risks of elevated rates across a longer period of time, alongside inflationary and funding cost pressures risking a deterioration in Credit in some segments (e.g. CRE). 5) Capital return for some banks in 2Q and capital build progression across the sector, with Basel 4 implementation expected in the coming quarters. 6) IB performance with Global IBs 2Q forecasted at FICC Revenues +8% YoY, Equities Revenues +4% YoY and IBD +29% YoY led by DCM. |
| Diversified Financials | (+)/(-) | • Private markets asset managers: Partners Group was the first to report, with a solid print across fundraising, deployment, and realisations, broadly in line with the optimism, sector analysts had flagged in their preview. They believe this should read positively for EQT’s upcoming results. Industry wide data from PitchBook point to global private markets fundraising tracking broadly in line with the 2023 pace. The fundraising/deployment cycle has now reverted back to the long-term average of three years between closings of the funds in the same fund family. PitchBook data also point to still subdued Private Equity volumes as of the end of June 2024, both for exits as well as deployment in Europe. Having said that, Q2 exits and investments were higher than Q1 24, which is encouraging. • Traditional asset managers: For DWS, they expect the Q2 24E underlying net flow picture to be decent, with net inflows in active fixed income, passive and money market and outflows in active equities and alternatives, broadly similar to the trends seen in Q1. However, DWS’s CEO guided for “low double-digit billion” outflows as a whole, due to low-margin outflows which they presume are in the fixed income asset class (potentially insurance mandate redemptions, in our view, which wouldn’t be captured by Morningstar). For Amundi, preliminary data from Morningstar for Q2 24 point to €6.5bn long term net flows for Amundi, showing promising momentum particularly around fixed income – however, they do acknowledge that near-term volatility following the French elections may delay the shift of net flows towards higher risk/higher margin asset classes. For Schroders, they actually expect outflows in H1 24E driven by Solutions, Mutual Funds, and Institutionals. • Exchanges: As they wrote in their preview, they expect no major surprises from 1H24 results, but they believe that investors’ expectations and scrutiny will gradually increase in 2H, given the planned Capital Market Day of Euronext on the 8th November, and LSEG’s partnership with Microsoft, which is expected to generate revenues from late 2024/early 2025. For Deutsche Börse, they expect the focus will be mainly on the progresses made with Investment Management Solutions, as well as with Eurex Fixed Income offering. • Platforms: Avanza has already reported, with a miss on both revenues/costs driven by idiosyncratic issues relating to a customer reimbursement/fine from IMY, while delivering beats on all other key revenue lines. During the analyst call, the lack of a clear guidance on the pace and costs associated with the planned transition to the cloud, and the possible pricing pressure arising from the offering of multi-currency trading accounts, might have generated some uncertainty among investors. The absence of similar one-offs at Nordnet, as confirmed by management, and the already implemented transition to the Cloud, as discussed at the Technology day, might result in positive read-across for Nordnet at the upcoming results. For Hargreaves Lansdown, the focus will be on any updates around the non-binding proposal received from a Consortium of private equity investors, which the board said that it was willing to unanimously recommend to HL shareholders. In accordance with regulation, the Consortium will have to communicate by no later than the 19th of July 2024 whether it intends to make an offer, or otherwise to withdraw. Given their concerns for Hargreaves’ fundamentals remain, they continue to see risk skewed to the downside. |
| Insurance | (+) | Sector analysts stay positive on the European insurance sector heading into the Q2 earnings season. They would expect to see generally supportive conditions for the non life insurers with pricing conditions remaining firm offering the potential for strong top line growth. The second quarter saw a more active period for catastrophe losses versus historical averages but they would expect that most companies remain within their catastrophe budgets and this follows on from a relatively benign Q1. In retail non life, they expect that results are unlikely to return back to historical levels in 1H24 with this now expected to be in 2H24. They are expecting generally stable to higher earnings for the life insurers given relatively high negative experience variances in 1H23, and a higher yield environment supporting investment margins and CSM growth. Their forecasts so far suggest ~3%-5% life earnings growth on average at 1H24E vs. 1H23. Given the recent profit warning at SCOR, the market will be looking out for any signs of negative assumption charges or experience impacting life CSM growth. They do not expect this and believe that other insurers have not been impacted by the issues that have affected SCOR. Solvency positions should remain strong overall with market movements generally favourable for the sector. |
| General Healthcare | (+) | Sector analysts anticipate a relatively solid 2Q’24 earnings season across Large Cap Pharma, with the majority raising FY’24 guidance (though this is largely anticipated by Consensus) and the remainder leaving guidance unchanged. For the 2Q’24 numbers they are broadly in-line to slightly ahead of Consensus suggesting a solid reporting season from EU Pharma. |
| Software | (-) | With Dassault Systèmes and IONOS already two companies in sector analysts European Software coverage that pre-announced lower-than-expected Q2 revenues and have both trimmed their FY24 revenue growth guides by ~2pt, as well as softer datapoints coming from US peer reporting (Oracle, Workday and Salesforce have all seen demand pressures in their April/-May-end quarters), they see the sector as under continued pressure from increased deal scrutiny, elongated sales cycles and deal compression, with geopolitical uncertainty adding to these dynamics. In this environment, they see SAP as a safe haven thanks to its migration cycle driven growth and into Q2 they expect continued robust current cloud backlog (leading indicator) growth at ~28% cc and see the potential for LSD% Non-IFRS EBIT outperformance relative to company consensus (they have placed SAP on +ve CW into Q2 results on 22nd July). On the IT Services side, they expect no material change in customer spending patterns vs. the prior quarter and expect discretionary spend to remain subdued. For Capgemini, they expect Q2 results to be in line with expectations on growth/margins, forecasting -0.9% Q2 organic growth (vs. -3.6% Q1) and ~0.9% organic growth for FY24 (though note lower for longer discretionary could be a source of downside). |
| Telecoms | (+)/(-) | Rising promotional activity and tougher comps suggest service revenue growth will slow in Q2 (Q2 +1.2% vs Q1 +1.9%). Top picks into Q2 include DT (anticipation around October CMD), CLNX (Q2 results and Austrian sale) and PROX (scope for guidance upgrade and fibre deal). Stocks to avoid are ORA (French competition), VOD (growth to slow in Q1), TEF (Spanish and UK competitive pressures), and BT (tough Q1 comp). |
| Utilities | (+) | Sector analyst expect European Utilities to continue to report solid numbers in Q2, continuing the robust trends evidenced in Q1. Generators should continue to benefit from high hydro availability, price volatility and arbitration opportunities. The retail businesses should continue to operate with strong underlying margins while benefiting from ad hoc opportunities to maximise margins due to the spread between wholesale and retail prices. |
Source: J.P. Morgan.
Equity Strategy Key Calls and Drivers
SPW, an equal-weighted S&P500 index, has stalled since March, and is behind SPX so far this year by more than 10%. We think this is reflecting a changing Growth-Policy narrative vs early 2024. Entering this year, investor expectations were for a Goldilocks outcome – growth acceleration and at the same time quick Fed easing, starting already in March. The early Fed cuts and the consequent improving credit impulse didn’t materialize, which should weigh on growth in 2H. US activity momentum is slowing, with CESI outright negative at present, putting EPS growth projections of as much as 15% acceleration between Q1 and Q4 of this year at risk. Instead of easing preemptively for market-friendly reasons, such as falling inflation, as was the view at the start of the year, the Fed could end up easing, but reactively, in a response to weakening growth. At the same time, there is no safety net any more, the market is positioned long, Vix is at lows, potentially underpricing risks and credit spreads are extremely tight – this is as good as it gets. Adding to the picture strengthening USD and elevated political uncertainty currently, we arrive at a problematic setup for the equity market during summer. In terms of positioning, we have entered this year again OW Growth vs Value style and Large vs Small caps, and we are keeping these for 2H in the US, not expecting much broadening. The recent relative dip due to French political uncertainty is likely to become a buying opportunity as we move through 2H, but we think the risk of further drawdowns is not finished, as the potential new French government will likely try to test the limits of what they can do. Cyclicals were the best performing sectors in Q1, but struggled to outperform in Q2 . We reiterate our barbell of OW Defensives and Commodities.
Table 11: J.P. Morgan Equity Strategy — Factors driving our medium-term views
| Driver | Impact | Our Core Working Assumptions | Recent Developments |
| Global Growth | Neutral | At risk of weakening as consumer strength wanes | Global composite PMI is at 52.9 |
| European Growth | Positive | reset last year, manufacturing improving, consumer can pick up | |
| Monetary Policy | Neutral | Fed pivot could be accompanied by activity weakness | |
| Currency | Neutral | USD could strengthen again | |
| Earnings | Negative | Corporate pricing power is likely to weaken from here | 2024 EPS projections are continuing their downtrend |
| Valuations | Negative | At 21x, US forward P/E is still stretched, especially vs real yield | MSCI Europe on 13.6x Fwd P/E |
| Technicals | Negative | Sentiment and positioning are stretched post the rally since November | RSIs are in overbought territory |
Source: J.P. Morgan estimates
Table 12: : Base Case and Risk
| Scenario | Assumption |
| Upside scenario | No further hawkish tilt by the Fed. No landing |
| Base-case scenario | Inflation to fall further, risk of downturn still elevated. Earnings downside from here |
| Downside scenario | Further Fed tightening and global recession to become a base case again |
Source: J.P. Morgan estimates.
Table 13: Index targets
| Dec '24 Target |
18-Jul-24 | % upside | |
| MSCI Eurozone | 256 | 290 | -12% |
| FTSE 100 | 7,700 | 8,205 | -6% |
| MSCI EUROPE | 1,850 | 2,057 | -10% |
| DJ EURO STOXX 50 | 4,250 | 4,870 | -13% |
| DJ STOXX 600 E | 460 | 514 | -11% |
Source: J.P. Morgan.
Table 14: Key Global sector calls
| Overweight | Neutral | Underweight |
| Healthcare | Technology | Capital Goods ex A&D |
| Telecoms | Mining | Food& Drug Retail |
| Food, Beverage & Tobacco | Transportation | Autos |
| Real Estate | Banks | |
| Utilities | Discretionary | |
| Energy | ||
| Aerospace & Defence |
Source: J.P. Morgan
Table 15: J.P. Morgan Equity Strategy — Key sector calls*
| Sector | Recommendations | Key Drivers |
| Utilities | Overweight | Sector is low beta, has strong cash flow generation, resilient earnings, and power prices are higher than pre-Ukraine but P/E relative is near record cheap |
| Healthcare | Overweight | Potential for lower yields and stronger dollar are supports, better earnings |
| Staples | Overweight | Sector is one of the best performers around the last Fed hike in the cycle, lower bond yields and better relative EPS momentum should help |
| Banks | Underweight | 3 years of strong performance, NII likely peaking, central banks moving to cuts, underprovisioning |
| Autos | Underweight | Pricing and volume could come under pressure with rising inventories, increasing China competition and weaker demand |
| Chemicals | Underweight | The sector trades at 70% premium to the market, well above historical norm. pricing continues to deteriorate, downside risks to current earnings and margin projections |
Source: J.P. Morgan estimates. * Please see the last page for the full list of our calls and sector allocation.
Table 16: J.P. Morgan Equity Strategy — Key regional calls
| Region | Recommendations | J.P. Morgan Views |
| EM | Neutral | China tactical positive call since Q1, but structural concerns remain |
| DM | Neutral | |
| US | Neutral | Expensive with earnings risk. but our ytd Growth style OW helps |
| Japan | Overweight | Large rate differential, TSE reforms, consumer reflation, but JPY needs to show stability |
| Eurozone | Neutral | Eurozone growth differential bottoming, cheap |
| UK | Overweight | Valuations still look very attractive, low beta with the highest regional dividend yield |
Source: J.P. Morgan estimates.
Top Picks
Table 17: J.P. Morgan European Strategy: Top European picks
| Market Cap | EPS Growth | Dividend Yield | 12m Fwd P/E | Performance | |||||||||||
| Name | Ticker | Sector | Rating | Price | Currency | (€ Bn) | 23e | 24e | 25e | 24e | Current | 10Y Median | % Premium | -3m | -12m |
| ENI | ENI IM | Energy | OW | 14 | E | 46.9 | -35% | -13% | 0% | 6.4% | 6.7 | 12.5 | -46% | -6% | 6% |
| TOTALENERGIES | TTE FP | Energy | OW | 64 | E | 153.0 | -33% | -2% | 3% | 4.8% | 7.4 | 10.6 | -30% | -5% | 24% |
| SHELL | SHEL LN | Energy | OW | 34 | E | 212.2 | -23% | 0% | 2% | 3.5% | 8.8 | 11.1 | -21% | 1% | 24% |
| CRH PUBLIC LIMITED | CRH LN | Materials | OW | 80 | U$ | 49.9 | -14% | 25% | 9% | 1.7% | 14.1 | 14.9 | -5% | 3% | 38% |
| RIO TINTO | RIO LN | Materials | OW | 5004 | £ | 100.6 | -11% | 2% | -1% | 6.7% | 8.8 | 10.2 | -14% | -7% | -2% |
| NORSK HYDRO | NHY NO | Materials | OW | 66 | NK | 11.2 | -60% | 29% | 38% | 3.8% | 10.0 | 12.3 | -19% | -8% | 2% |
| ANGLO AMERICAN | AAL LN | Materials | OW | 2286 | £ | 33.3 | -51% | -14% | 18% | 3.2% | 12.9 | 9.5 | 36% | 5% | -1% |
| SCHNEIDER ELECTRIC | SU FP | Industrials | OW | 221 | E | 127.1 | 2% | 15% | 13% | 1.6% | 24.9 | 16.5 | 51% | 3% | 37% |
| ASHTEAD GROUP | AHT LN | Industrials | OW | 5426 | £ | 28.2 | 26% | - | - | 1.4% | 17.2 | 14.1 | 22% | -3% | -1% |
| RYANAIR HOLDINGS | RYA ID | Industrials | OW | 17 | E | 18.8 | - | - | - | 0.0% | 8.4 | 12.7 | -34% | -19% | 1% |
| AIRBUS | AIR FP | Industrials | OW | 131 | E | 103.7 | 10% | -14% | 35% | 1.4% | 20.3 | 18.5 | 10% | -19% | -2% |
| MTU AERO ENGINES HLDG. | MTX GR | Industrials | OW | 246 | E | 13.2 | 24% | 12% | 14% | 0.8% | 18.7 | 18.1 | 3% | 15% | 10% |
| STELLANTIS | STLAM IM | Discretionary | OW | 19 | E | 57.5 | 12% | -17% | 5% | 8.2% | 3.8 | 4.7 | -19% | -22% | 14% |
| BMW | BMW GR | Discretionary | OW | 92 | E | 57.8 | -35% | -7% | -1% | 6.6% | 5.6 | 7.6 | -26% | -14% | - |
| INDITEX | ITX SM | Discretionary | OW | 45 | E | 141.0 | 27% | - | - | 2.7% | 22.6 | 24.0 | -6% | 3% | 30% |
| ADIDAS | ADS GR | Discretionary | OW | 232 | E | 41.7 | -154% | - | 117% | 0.3% | 42.0 | 24.8 | 69% | 3% | 34% |
| RICHEMONT N | CFR SW | Discretionary | OW | 135 | SF | 82.4 | 78% | - | - | 1.8% | 19.5 | 20.8 | -6% | 5% | -5% |
| COMPASS GROUP | CPG LN | Discretionary | OW | 2195 | £ | 44.4 | 50% | 14% | 10% | 1.9% | 22.0 | 20.9 | 5% | 1% | 5% |
| COLRUYT GROUP | COLR BB | Staples | OW | 46 | E | 5.8 | -27% | - | - | 1.7% | 15.2 | 17.6 | -13% | 12% | 29% |
| ANHEUSER-BUSCH INBEV | ABI BB | Staples | OW | 56 | E | 113.7 | -5% | 9% | 13% | 1.3% | 17.3 | 19.4 | -11% | 4% | 9% |
| NOVO NORDISK 'B' | NOVOB DC | Health Care | OW | 887 | DK | 530.8 | 52% | 25% | 26% | 1.1% | 33.8 | 22.8 | 48% | 3% | 67% |
| ASTRAZENECA | AZN LN | Health Care | OW | 12126 | £ | 223.4 | 9% | 13% | 14% | 1.8% | 17.7 | 17.7 | 0% | 11% | 18% |
| SMITH & NEPHEW | SN/ LN | Health Care | OW | 1102 | £ | 11.4 | 1% | 12% | 19% | 2.6% | 14.0 | 18.4 | -24% | 14% | -6% |
| UBS GROUP | UBSG SW | Financials | OW | 27 | SF | 97.8 | -99% | 4320% | 59% | 2.3% | 17.8 | 10.4 | 72% | 6% | 49% |
| NATWEST GROUP | NWG LN | Financials | OW | 336 | £ | 33.2 | 38% | -20% | 9% | 5.1% | 7.8 | 10.0 | -23% | 22% | 34% |
| ING GROEP | INGA NA | Financials | OW | 17 | E | 56.1 | 106% | -9% | 8% | 6.5% | 8.6 | 9.0 | -5% | 12% | 30% |
| INTESA SANPAOLO | ISP IM | Financials | OW | 4 | E | 67.1 | 79% | 20% | 4% | 8.1% | 7.6 | 10.0 | -24% | 9% | 49% |
| LONDON STOCK EXCHANGE GROUP | LSEG LN | Financials | OW | 9470 | £ | 59.8 | 2% | 10% | 13% | 1.2% | 24.9 | 23.0 | 8% | 5% | 14% |
| AMUNDI (WI) | AMUN FP | Financials | OW | 67 | E | 13.7 | 4% | 8% | 7% | 6.1% | 9.9 | 12.6 | -21% | 5% | 19% |
| DASSAULT SYSTEMES | DSY FP | IT | N | 34 | E | 45.5 | 6% | 7% | 9% | 0.8% | 25.3 | 31.7 | -20% | -12% | -16% |
| ASML HOLDING | ASML NA | IT | OW | 839 | E | 335.1 | 41% | -5% | 60% | 0.7% | 32.9 | 27.3 | 21% | 0% | 26% |
| ASM INTERNATIONAL | ASM NA | IT | OW | 659 | E | 32.6 | -8% | 19% | 35% | 0.4% | 40.2 | 16.7 | 141% | 21% | 61% |
| DEUTSCHE TELEKOM | DTE GR | Telecoms | OW | 24 | E | 120.3 | -13% | 14% | 12% | 3.2% | 12.6 | 13.9 | -10% | 16% | 25% |
| BT GROUP | BT/A LN | Telecoms | OW | 141 | £ | 16.7 | 9% | - | - | 5.5% | 7.8 | 8.6 | -9% | 35% | 16% |
| RELX | REL LN | Industrials | OW | 3473 | £ | 77.1 | 12% | 7% | 9% | 1.7% | 27.0 | 19.5 | 38% | 4% | 36% |
| HELLOFRESH | HFG GR | Staples | N | 6 | E | 1.1 | -49% | -69% | 166% | 0.0% | 15.8 | 18.4 | -14% | -7% | -73% |
| RWE | RWE GR | Utilities | OW | 33 | E | 24.3 | 30% | -55% | -26% | 3.0% | 13.7 | 13.0 | 5% | 2% | -16% |
| ENEL | ENEL IM | Utilities | OW | 7 | E | 69.1 | 15% | 10% | 0% | 6.3% | 10.1 | 11.9 | -15% | 16% | 8% |
| SEGRO | SGRO LN | Real Estate | OW | 925 | £ | 14.9 | 6% | 6% | 8% | 3.0% | 25.8 | 25.4 | 2% | 10% | 24% |
Source: Datastream, MSCI, IBES, J.P. Morgan, Prices and Valuations as of COB 18th Jul, 2024. Past performance is not indicative of future returns.
Please see the most recent company-specific research published by J.P. Morgan for an analysis of valuation methodology and risks on companies recommended in this report. Research is available at http://www.jpmorganmarkets.com
Equity Flows Snapshot
Table 18: DM Equity Fund Flows Summary
| Regional equity fund flows | ||||||||||
| $mn | % AUM | |||||||||
| 1w | 1m | 3m | ytd | 12m | 1w | 1m | 3m | ytd | 12m | |
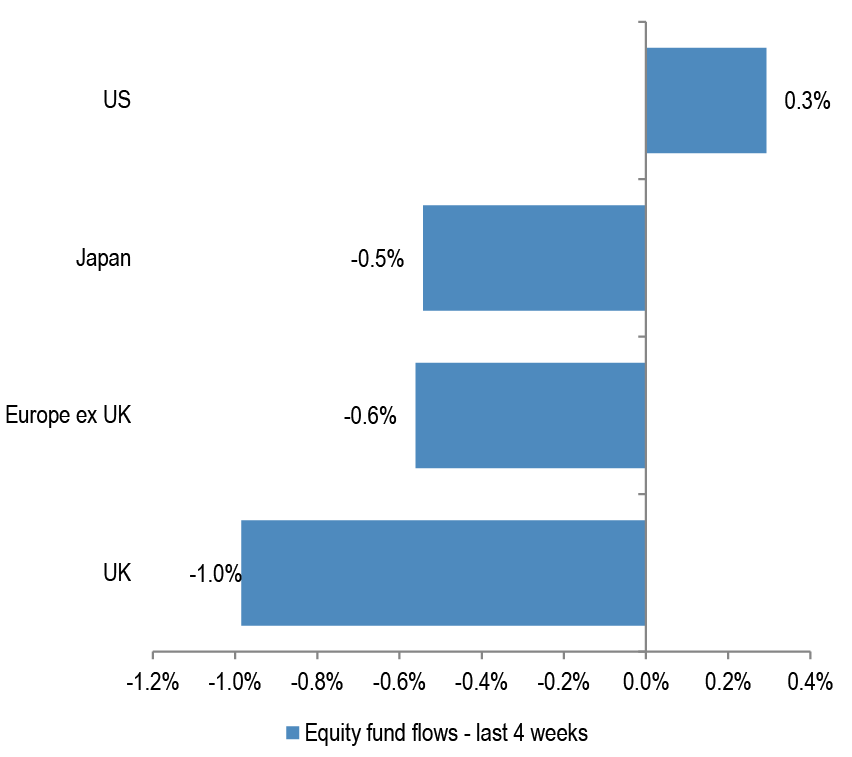
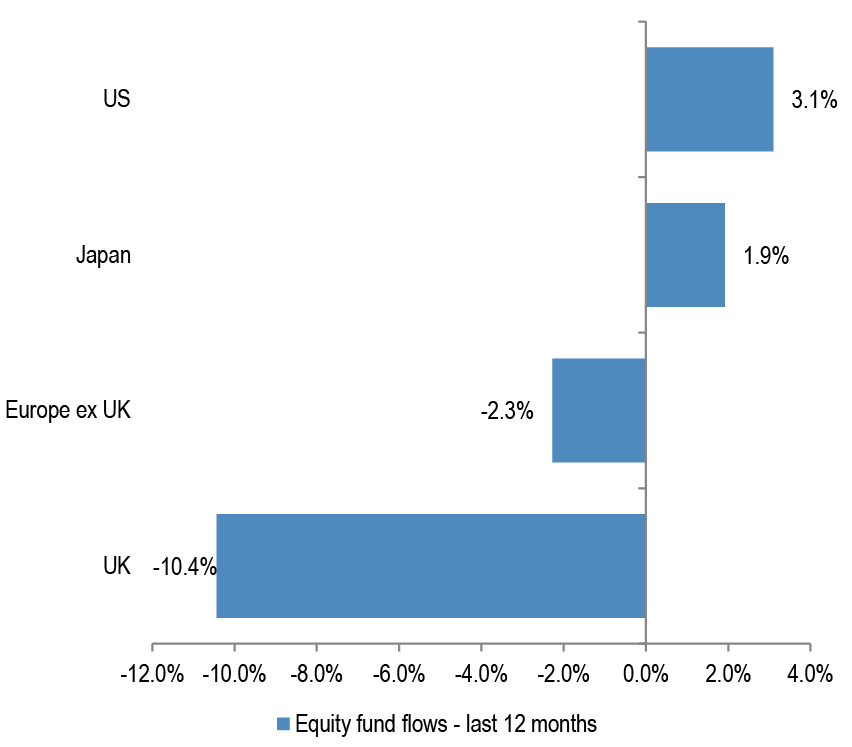
| Europe ex UK | -531 | -1,998 | 347 | -818 | -7,172 | -0.2% | -0.6% | 0.1% | -0.2% | -2.3% |
| UK | -834 | -2,771 | -8,727 | -15,499 | -28,451 | -0.3% | -1.0% | -3.2% | -5.6% | -10.4% |
| US | 5,078 | 32,112 | 81,090 | 146,369 | 272,523 | 0.0% | 0.3% | 0.8% | 1.5% | 3.1% |
| Japan | -2,105 | -4,384 | -4,342 | 7,864 | 13,959 | -0.3% | -0.5% | -0.5% | 1.0% | 1.9% |
Source: EPFR, as of 10th Jul, 2024
Figure 42: DM Equity Fund flows – last month
Source: EPFR, Japan includes BoJ purchases.
Figure 43: DM Equity Fund flows – last 12 months
Source: EPFR, Japan includes BoJ purchases.
Figure 44: Cumulative fund flows into regional funds as a percentage of AUM
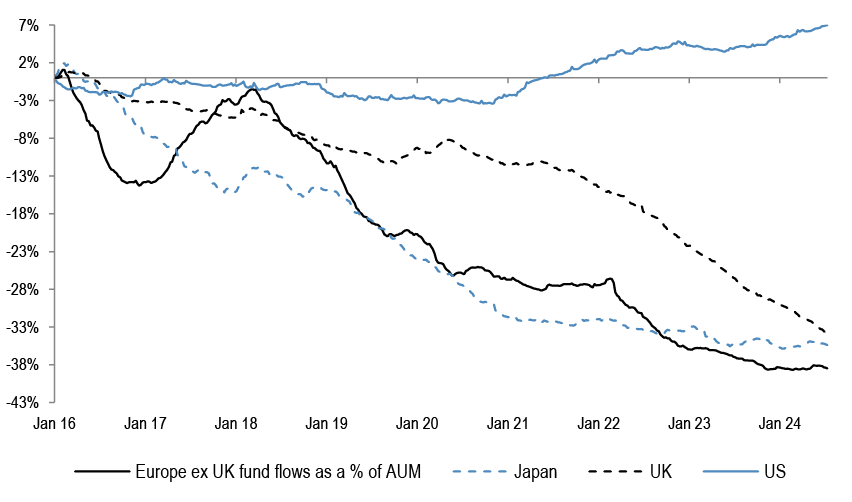
Source: EPFR, as of 10th Jul, 2024. Japan includes Non-ETF purchases only.
Figure 45: Cumulative fund flows into regional equity ETFs as a percentage of AUM

Source: Bloomberg Finance L.P. *Based on the 25 biggest ETF's with a mandate to invest in that particular region. Japan includes BoJ purchases.
Technical Indicators
Figure 46: S&P500 RSI
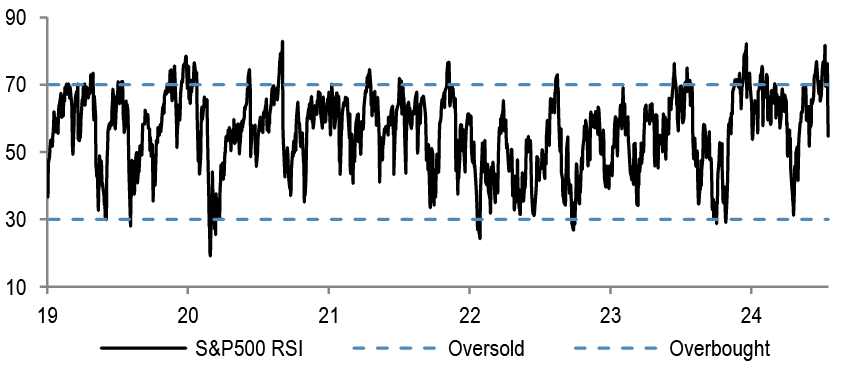
Source: Bloomberg Finance L.P.
Figure 47: EuroStoxx50 RSI
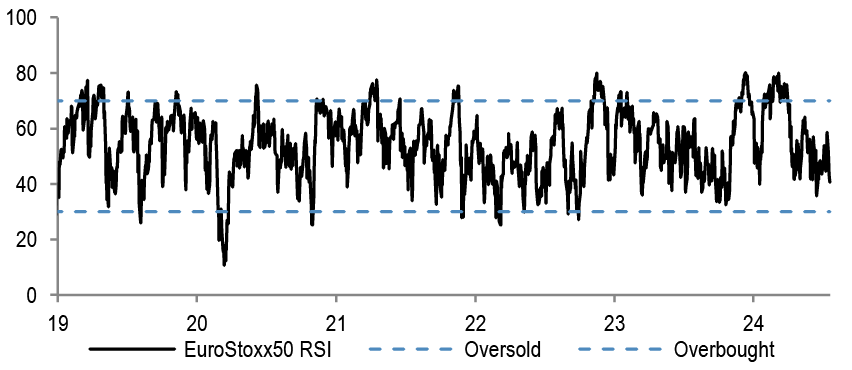
Source: Bloomberg Finance L.P.
Figure 48: AAII Bull-Bear

Source: Bloomberg Finance L.P
Figure 49: Put-call ratio
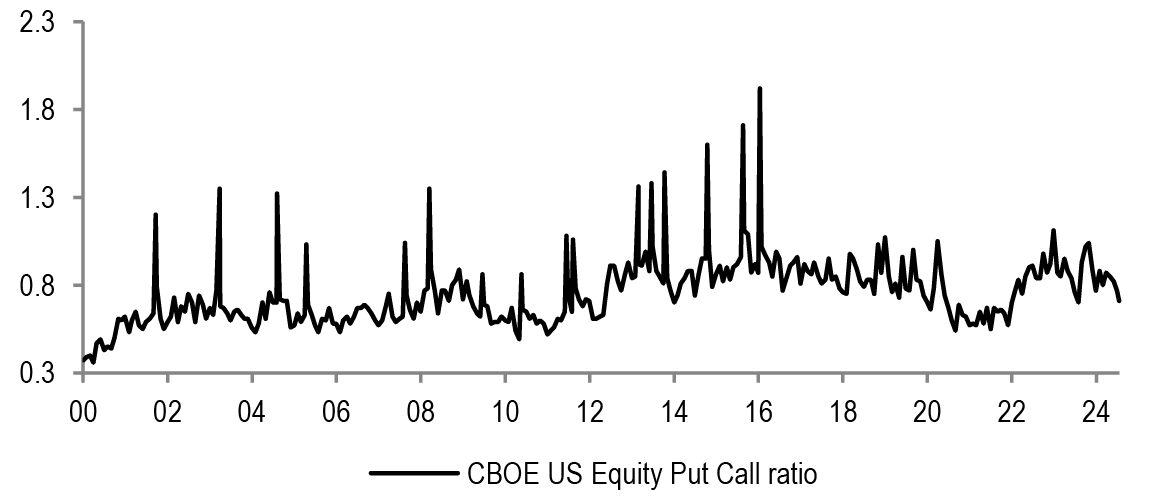
Source: Bloomberg Finance L.P.
Figure 50: Sentix Sentiment Index vs SX5E
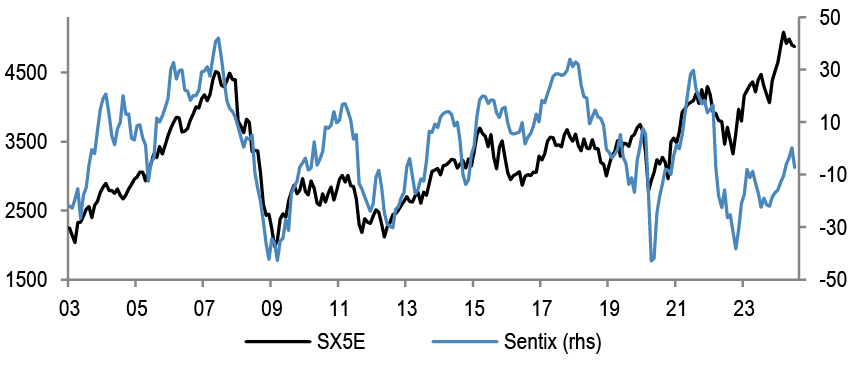
Source: Bloomberg Finance L.P.
Figure 51: Equity Skew
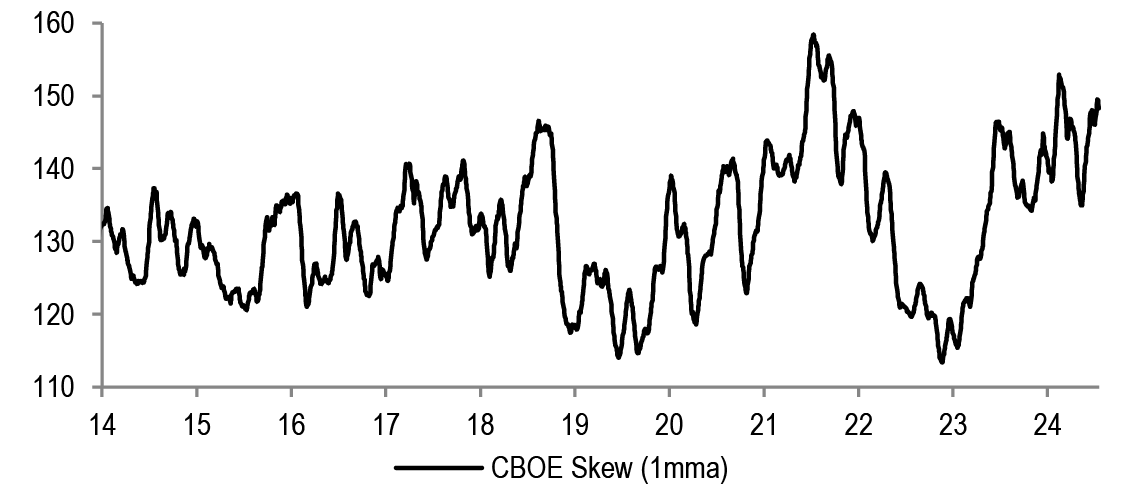
Source: Bloomberg Finance L.P.
Figure 52: Speculative positions in S&P500 futures contracts
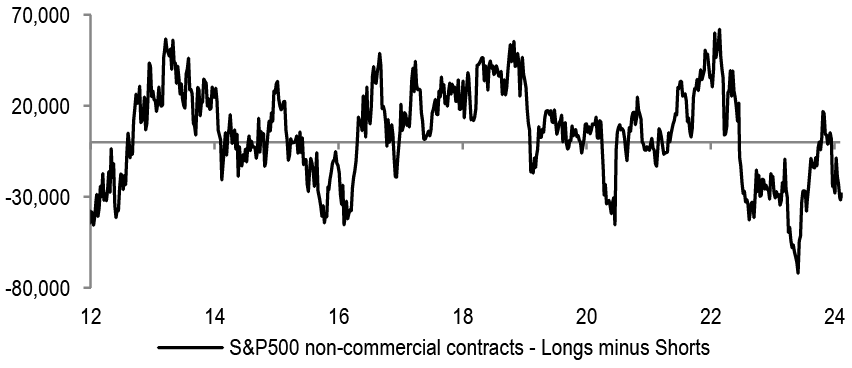
Source: Bloomberg Finance L.P.
Figure 53: VIX

Source: Bloomberg Finance L.P.
Performance
Table 19: Sector Index Performances — MSCI Europe
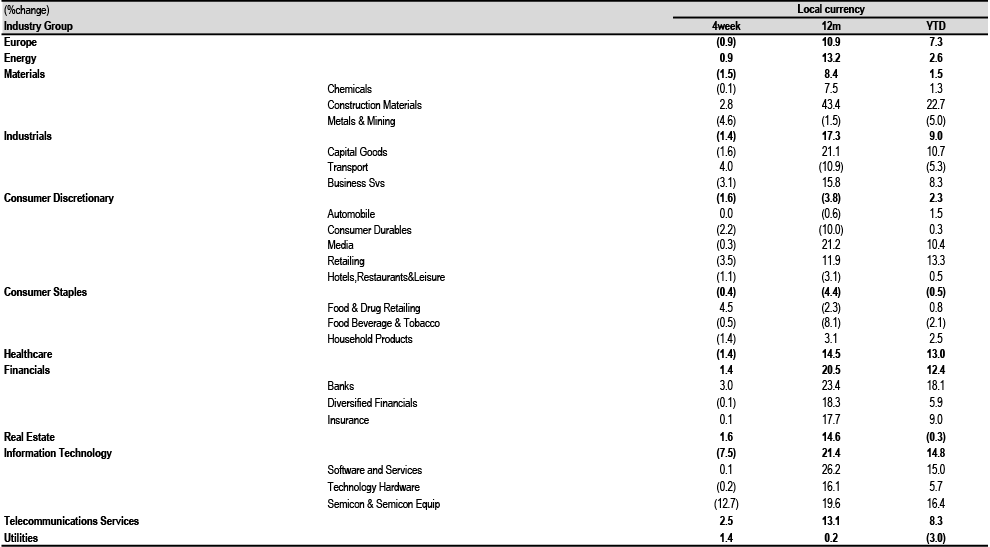
Source: MSCI, Datastream, as at COB 18th Jul, 2024.
Table 20: Country and Region Index Performances
| (%change) | Local Currency | US$ | |||||
| Country | Index | 4week | 12m | YTD | 4week | 12m | YTD |
| Austria | ATX | 1.3 | 16.1 | 7.1 | 3.1 | 12.8 | 5.8 |
| Belgium | BEL 20 | 2.9 | 8.4 | 8.0 | 4.8 | 5.3 | 6.7 |
| Denmark | KFX | (8.1) | 31.7 | 16.3 | (6.4) | 27.7 | 14.8 |
| Finland | HEX 20 | (2.4) | (0.8) | (2.4) | (0.6) | (3.6) | (3.6) |
| France | CAC 40 | (1.1) | 3.7 | 0.6 | 0.7 | 0.7 | (0.6) |
| Germany | DAX | 0.6 | 13.8 | 9.6 | 2.4 | 10.6 | 8.3 |
| Greece | ASE General | 2.5 | 10.8 | 12.7 | 4.4 | 7.6 | 11.4 |
| Ireland | ISEQ | 2.4 | 10.2 | 11.5 | 4.2 | 7.0 | 10.2 |
| Italy | FTSE MIB | 2.5 | 20.3 | 13.8 | 4.4 | 16.8 | 12.4 |
| Japan | Topix | 5.2 | 27.4 | 21.2 | 6.6 | 12.6 | 9.0 |
| Netherlands | AEX | (1.9) | 18.3 | 16.4 | (0.1) | 14.9 | 15.0 |
| Norway | OBX | 2.3 | 15.5 | 8.4 | (0.0) | 7.7 | 2.2 |
| Portugal | BVL GEN | 1.2 | (1.0) | (5.1) | 3.0 | (3.8) | (6.2) |
| Spain | IBEX 35 | (0.1) | 17.9 | 10.3 | 1.7 | 14.5 | 9.0 |
| Sweden | OMX | 0.9 | 15.0 | 8.4 | (0.1) | 11.2 | 3.5 |
| Switzerland | SMI | 1.0 | 10.3 | 10.0 | 1.7 | 7.0 | 4.7 |
| United States | S&P 500 | 1.3 | 21.7 | 16.2 | 1.3 | 21.7 | 16.2 |
| United States | NASDAQ | 0.8 | 24.5 | 19.1 | 0.8 | 24.5 | 19.1 |
| United Kingdom | FTSE 100 | (0.8) | 10.1 | 6.1 | 1.5 | 9.2 | 8.0 |
| EMU | MSCI EMU | (1.0) | 9.5 | 6.6 | 0.8 | 6.4 | 5.3 |
| Europe | MSCI Europe | (0.9) | 10.9 | 7.3 | 0.6 | 8.1 | 5.9 |
| Global | MSCI AC World | 1.3 | 19.3 | 14.1 | 1.7 | 17.7 | 13.0 |
Source: MSCI, Datastream, as at COB 18th Jul, 2024.
Earnings
Table 21: IBES Consensus EPS Sector Forecasts — MSCI Europe
| EPS Growth (%yoy) | |||||
| 2023 | 2024E | 2025E | 2026E | ||
| Europe | (3.8) | 4.0 | 10.3 | 9.2 | |
| Energy | (31.6) | (4.9) | 3.0 | 2.7 | |
| Materials | (39.3) | 7.7 | 15.1 | 8.1 | |
| Chemicals | (38.9) | 22.2 | 19.3 | 13.0 | |
| Construction Materials | 12.2 | 14.3 | 9.4 | 8.3 | |
| Metals & Mining | (46.8) | (4.1) | 12.1 | 3.3 | |
| Industrials | (0.5) | 9.1 | 13.0 | 12.2 | |
| Capital Goods | 20.4 | 12.1 | 14.7 | 12.3 | |
| Transport | (55.7) | (10.9) | (0.3) | 13.7 | |
| Business Svs | 3.2 | 7.6 | 11.5 | 10.4 | |
| Discretionary | 4.9 | 0.7 | 11.5 | 10.5 | |
| Automobile | 1.9 | (7.5) | 7.1 | 7.4 | |
| Consumer Durables | (6.1) | 1.2 | 15.2 | 12.9 | |
| Media | 1.8 | 6.3 | 9.4 | 8.7 | |
| Retailing | 40.0 | 24.1 | 14.8 | 12.4 | |
| Hotels,Restaurants&Leisure | 62.3 | 39.3 | 23.2 | 18.3 | |
| Staples | 2.3 | 2.0 | 8.7 | 7.6 | |
| Food & Drug Retailing | 3.7 | 2.3 | 10.0 | 9.4 | |
| Food Beverage & Tobacco | 1.9 | 0.4 | 8.7 | 7.6 | |
| Household Products | 2.9 | 6.5 | 7.9 | 6.9 | |
| Healthcare | 1.1 | 6.3 | 14.5 | 11.1 | |
| Financials | 15.8 | 8.0 | 7.7 | 8.8 | |
| Banks | 28.7 | 3.7 | 4.3 | 6.5 | |
| Diversified Financials | (19.9) | 18.0 | 22.2 | 20.0 | |
| Insurance | 11.4 | 14.2 | 8.2 | 7.5 | |
| Real Estate | 5.6 | 2.7 | 4.2 | 4.2 | |
| IT | 14.4 | (10.1) | 33.4 | 16.4 | |
| Software and Services | 18.5 | (5.9) | 23.8 | 17.0 | |
| Technology Hardware | (19.1) | 8.2 | 7.1 | 12.0 | |
| Semicon & Semicon Equip | 28.0 | (18.2) | 50.6 | 17.4 | |
| Telecoms | (8.5) | 9.1 | 11.4 | 10.9 | |
| Utilities | 1.9 | 0.1 | 0.2 | 4.3 | |
Source: IBES, MSCI, Datastream. As at COB 18th Jul, 2024.
Table 22: IBES Consensus EPS Country Forecasts
| EPS growth (%change) | |||||
| Country | Index | 2023 | 2024E | 2025E | 2026E |
| Austria | ATX | (23.6) | 6.3 | 4.2 | 5.6 |
| Belgium | BEL 20 | 16.4 | (6.5) | 15.1 | 11.9 |
| Denmark | Denmark KFX | (14.6) | 31.7 | 18.3 | 16.9 |
| Finland | MSCI Finland | (25.2) | 0.8 | 12.6 | 10.0 |
| France | CAC 40 | (2.3) | 0.2 | 9.6 | 8.2 |
| Germany | DAX | 0.2 | 0.5 | 12.8 | 11.0 |
| Greece | MSCI Greece | 15.1 | (9.0) | 5.3 | 10.1 |
| Ireland | MSCI Ireland | 58.2 | 1.2 | 0.6 | 6.1 |
| Italy | MSCI Italy | 8.9 | (0.8) | 3.8 | 5.6 |
| Netherlands | AEX | (1.8) | 1.9 | 12.7 | 9.0 |
| Norway | MSCI Norway | (41.3) | 5.3 | 5.5 | 1.5 |
| Portugal | MSCI Portugal | 16.9 | 16.5 | 0.4 | 8.2 |
| Spain | IBEX 35 | 8.3 | 4.8 | 4.4 | 6.0 |
| Sweden | OMX | 31.8 | 1.6 | 8.3 | 7.3 |
| Switzerland | SMI | (4.5) | 11.6 | 12.7 | 10.5 |
| United Kingdom | FTSE 100 | (10.6) | 0.6 | 9.0 | 7.6 |
| EMU | MSCI EMU | 3.1 | 3.3 | 10.6 | 9.3 |
| Europe ex UK | MSCI Europe ex UK | 0.0 | 5.1 | 10.9 | 9.7 |
| Europe | MSCI Europe | (3.8) | 4.0 | 10.3 | 9.2 |
| United States | S&P 500 | 2.5 | 10.3 | 14.9 | 12.4 |
| Japan | Topix | 18.0 | 8.4 | 10.3 | 8.4 |
| Emerging Market | MSCI EM | (6.6) | 22.0 | 16.1 | 10.8 |
| Global | MSCI AC World | 0.1 | 9.8 | 13.6 | 11.1 |
Source: IBES, MSCI, Datastream. As at COB 18th Jul, 2024** Japan refers to the period from March in the year stated to March in the following year – EPS post-goodwill
Valuations
Table 23: IBES Consensus European Sector Valuations
| P/E | Dividend Yield | EV/EBITDA | Price to Book | |||||||||
| 2024e | 2025e | 2026e | 2024e | 2025e | 2026e | 2024e | 2025e | 2026e | 2024e | 2025e | 2026e | |
| Europe | 14.4 | 13.0 | 12.0 | 3.4% | 3.5% | 3.8% | 9.0 | 8.5 | 7.8 | 1.9 | 1.8 | 1.7 |
| Energy | 7.9 | 7.7 | 7.5 | 5.4% | 5.3% | 5.6% | 3.5 | 3.4 | 3.3 | 1.2 | 1.1 | 1.0 |
| Materials | 16.0 | 13.9 | 12.9 | 3.2% | 3.5% | 3.7% | 7.7 | 6.8 | 6.5 | 1.7 | 1.6 | 1.5 |
| Chemicals | 24.2 | 20.3 | 18.0 | 2.7% | 2.9% | 3.0% | 11.7 | 10.6 | 9.7 | 2.3 | 2.2 | 2.1 |
| Construction Materials | 13.5 | 12.3 | 11.4 | 3.4% | 3.7% | 4.0% | 7.0 | 6.4 | 5.8 | 1.4 | 1.3 | 1.3 |
| Metals & Mining | 10.7 | 9.5 | 9.2 | 3.9% | 4.4% | 4.7% | 5.2 | 4.3 | 4.4 | 1.2 | 1.2 | 1.1 |
| Industrials | 19.8 | 17.6 | 15.7 | 2.4% | 2.6% | 2.8% | 15.6 | 14.9 | 12.8 | 3.3 | 3.1 | 2.8 |
| Capital Goods | 19.9 | 17.3 | 15.4 | 2.3% | 2.5% | 2.8% | 11.1 | 9.7 | 8.8 | 3.4 | 3.2 | 2.9 |
| Transport | 15.9 | 15.9 | 14.0 | 3.2% | 3.2% | 3.4% | 6.6 | 6.8 | 6.3 | 1.8 | 1.7 | 1.7 |
| Business Svs | 23.0 | 20.6 | 18.7 | 2.3% | 2.5% | 2.7% | 73.7 | 75.8 | 60.4 | 6.4 | 5.9 | 5.4 |
| Discretionary | 13.2 | 11.8 | 10.7 | 2.9% | 3.1% | 3.4% | 5.2 | 5.0 | 4.7 | 1.8 | 1.7 | 1.5 |
| Automobile | 6.0 | 5.6 | 5.2 | 5.5% | 5.8% | 6.2% | 1.8 | 1.6 | 1.7 | 0.7 | 0.6 | 0.6 |
| Consumer Durables | 23.3 | 20.2 | 17.9 | 1.9% | 2.2% | 2.4% | 13.9 | 12.6 | 11.3 | 3.9 | 3.5 | 3.2 |
| Media & Entertainment | 17.4 | 15.9 | 14.6 | 2.4% | 2.5% | 2.7% | 12.3 | 9.7 | 9.2 | 2.1 | 2.1 | 2.0 |
| Retailing | 16.3 | 14.2 | 12.6 | 2.4% | 2.5% | 2.8% | 7.1 | 10.1 | 7.6 | 3.6 | 3.1 | 2.7 |
| Hotels,Restaurants&Leisure | 23.6 | 19.1 | 16.2 | 2.0% | 2.5% | 2.9% | 12.3 | 10.4 | 9.5 | 4.5 | 4.1 | 3.7 |
| Staples | 17.4 | 16.0 | 14.9 | 3.1% | 3.3% | 3.5% | 10.7 | 10.0 | 9.3 | 2.9 | 2.7 | 2.5 |
| Food & Drug Retailing | 11.9 | 10.9 | 9.9 | 4.2% | 4.4% | 4.8% | 5.8 | 5.7 | 5.4 | 1.6 | 1.5 | 1.5 |
| Food Beverage & Tobacco | 16.9 | 15.5 | 14.5 | 3.4% | 3.7% | 3.9% | 10.6 | 9.8 | 9.0 | 2.6 | 2.4 | 2.3 |
| Household Products | 20.7 | 19.2 | 17.9 | 2.4% | 2.5% | 2.7% | 13.9 | 12.9 | 12.0 | 4.3 | 3.9 | 3.6 |
| Healthcare | 19.0 | 16.6 | 14.9 | 2.3% | 2.5% | 2.8% | 13.0 | 11.7 | 10.2 | 3.7 | 3.4 | 3.0 |
| Financials | 9.3 | 8.7 | 8.0 | 5.4% | 5.6% | 5.9% | - | - | - | 1.1 | 1.1 | 1.0 |
| Banks | 7.4 | 7.1 | 6.7 | 6.9% | 6.8% | 7.3% | - | - | - | 0.8 | 0.8 | 0.7 |
| Diversified Financials | 15.2 | 12.4 | 10.3 | 2.3% | 2.6% | 2.9% | - | - | - | 1.4 | 1.6 | 1.5 |
| Insurance | 10.8 | 10.0 | 9.3 | 5.6% | 6.0% | 6.3% | - | - | - | 1.7 | 1.6 | 1.5 |
| Real Estate | 14.9 | 14.3 | 13.7 | 4.1% | 4.3% | 4.5% | - | - | - | 0.9 | 0.9 | 0.8 |
| IT | 31.6 | 23.7 | 20.3 | 1.2% | 1.3% | 1.5% | 19.2 | 15.2 | 13.2 | 5.1 | 4.6 | 4.1 |
| Software and Services | 32.5 | 26.2 | 22.4 | 1.3% | 1.4% | 1.5% | 18.8 | 16.2 | 13.9 | 4.5 | 4.1 | 3.7 |
| Technology Hardware | 16.6 | 15.5 | 13.8 | 2.4% | 2.6% | 2.8% | 9.1 | 9.0 | 7.7 | 2.0 | 1.9 | 1.8 |
| Semicon & Semicon Equip | 37.0 | 24.6 | 21.0 | 0.8% | 1.0% | 1.1% | 24.7 | 16.8 | 14.5 | 8.4 | 7.2 | 6.0 |
| Communication Services | 15.3 | 13.7 | 12.4 | 4.1% | 4.2% | 4.5% | 6.6 | 6.2 | 5.8 | 1.5 | 1.5 | 1.4 |
| Utilities | 12.5 | 12.4 | 11.9 | 5.0% | 5.0% | 5.3% | 8.0 | 8.1 | 8.0 | 1.6 | 1.5 | 1.4 |
Source: IBES, MSCI, Datastream. As at COB 18th Jul, 2024.
Table 24: IBES Consensus P/E and 12-Month Forward Dividend Yields — Country Forecasts
| P/E | Dividend Yield | |||||
| Country | Index | 12mth Fwd | 2024E | 2025E | 2026E | 12mth Fwd |
| Austria | ATX | 8.0 | 8.2 | 7.9 | 7.5 | 5.8% |
| Denmark | Denmark KFX | 25.2 | 28.0 | 23.6 | 20.2 | 1.5% |
| Finland | MSCI Finland | 14.5 | 15.5 | 13.8 | 12.6 | 4.4% |
| France | CAC 40 | 12.4 | 13.1 | 12.0 | 11.1 | 3.5% |
| Germany | DAX | 11.7 | 12.6 | 11.2 | 10.1 | 3.4% |
| Greece | MSCI Greece | 29.4 | 30.3 | 28.8 | 26.2 | 1.9% |
| Ireland | MSCI Ireland | 11.0 | 11.0 | 10.9 | 10.3 | 3.7% |
| Italy | MSCI Italy | 9.2 | 9.4 | 9.1 | 8.6 | 5.6% |
| Netherlands | AEX | 15.6 | 16.7 | 14.8 | 13.6 | 2.4% |
| Norway | MSCI Norway | 10.4 | 10.7 | 10.2 | 10.0 | 6.4% |
| Portugal | MSCI Portugal | 14.8 | 14.8 | 14.8 | 13.7 | 3.9% |
| Spain | IBEX 35 | 10.8 | 11.1 | 10.6 | 10.0 | 4.8% |
| Sweden | OMX | 14.7 | 15.5 | 14.3 | 13.4 | 3.8% |
| Switzerland | SMI | 17.1 | 18.3 | 16.2 | 14.7 | 3.2% |
| United Kingdom | FTSE 100 | 11.3 | 11.9 | 10.9 | 10.1 | 4.0% |
| EMU | MSCI EMU | 12.7 | 13.6 | 12.2 | 11.2 | 3.5% |
| Europe ex UK | MSCI Europe ex UK | 14.3 | 15.2 | 13.7 | 12.5 | 3.3% |
| Europe | MSCI Europe | 13.6 | 14.4 | 13.0 | 12.0 | 3.5% |
| United States | S&P 500 | 21.2 | 23.2 | 20.2 | 18.0 | 1.4% |
| Japan | Topix | 15.1 | 15.6 | 14.2 | 13.1 | 2.3% |
| Emerging Market | MSCI EM | 12.4 | 13.5 | 11.6 | 10.5 | 2.9% |
| Global | MSCI AC World | 18.0 | 19.5 | 17.1 | 15.4 | 2.0% |
Source: IBES, MSCI, Datastream. As at COB 18th Jul, 2024; ** Japan refers to the period from March in the year stated to March in the following year – P/E post goodwill.
Economic, Interest Rate and Exchange Rate Outlook
Table 25: Economic Outlook in Summary
| Real GDP | Real GDP | Consumer prices | |||||||||||
| % oya | % over previous period, saar | % oya | |||||||||||
| 2023E | 2024E | 2025E | 4Q23 | 1Q24 | 2Q24E | 3Q24E | 4Q24E | 1Q25E | 1Q24 | 3Q24E | 1Q25E | 3Q25E | |
| United States | 2.5 | 2.3 | 1.7 | 3.4 | 1.4 | 2.0 | 1.0 | 1.0 | 2.0 | 3.2 | 2.9 | 2.5 | 2.4 |
| Eurozone | 0.6 | 0.8 | 1.1 | -0.2 | 1.3 | 1.5 | 1.5 | 1.0 | 1.0 | 2.6 | 2.3 | 2.2 | 1.8 |
| United Kingdom | 0.1 | 1.0 | 0.8 | -1.2 | 2.9 | 2.0 | 1.0 | 1.0 | 0.8 | 3.5 | 2.1 | 2.8 | 3.1 |
| Japan | 1.8 | -0.1 | 0.7 | 0.4 | -1.8 | 1.5 | 1.0 | 0.8 | 0.6 | 2.5 | 2.8 | 3.5 | 2.5 |
| Emerging markets | 4.2 | 4.0 | 3.6 | 4.1 | 6.1 | 1.8 | 3.3 | 3.8 | 3.4 | 3.7 | 3.4 | 3.2 | 3.0 |
| Global | 2.8 | 2.5 | 2.3 | 2.7 | 3.2 | 1.8 | 2.1 | 2.2 | 2.3 | 3.3 | 2.9 | 2.8 | 2.6 |
Source: J.P. Morgan economic research J.P. Morgan estimates, as of COB 12th Jul, 2024
Table 26: Official Rates Outlook
| Forecast for | ||||||||
| Official interest rate | Current | Last change (bp) | Forecast next change (bp) | Sep 24 | Dec 24 | Mar 25 | Jun 25 | |
| United States | Federal funds rate | 5.50 | 26 Jul 23 (+25bp) | Sep 24 (-25bp) | 5.25 | 5.00 | 4.75 | 4.50 |
| Eurozone | Depo rate | 3.75 | 6 Jun 24 (-25bp) | Sep 24 (-25bp) | 3.50 | 3.25 | 3.00 | 2.50 |
| United Kingdom | Bank Rate | 5.25 | 03 Aug 23 (+25bp) | Aug 24 (-25bp) | 5.00 | 4.75 | 4.50 | 4.25 |
| Japan | Pol rate IOER | 0.10 | 19 Mar 24 (+20bp) | 3Q24 (+15bp) | 0.25 | 0.50 | 0.50 | 0.75 |
Source: J.P. Morgan estimates, Datastream, as of COB 12th Jul, 2024
Table 27: 10-Year Government Bond Yield Forecasts
| 10 Yr Govt BY | Forecast for end of | ||||
| 19-Jul-24 | Sep 24 | Dec 24 | Mar 25 | Jun 25 | |
| US | 4.21 | 4.20 | 4.15 | 4.05 | 3.90 |
| Euro Area | 2.45 | 2.40 | 2.20 | 2.10 | 2.00 |
| United Kingdom | 4.10 | 4.10 | 3.95 | 3.85 | 3.75 |
| Japan | 1.04 | 1.20 | 1.45 | 1.45 | 1.60 |
Source: J.P. Morgan estimates, Datastream, forecasts as of COB 12th Jul, 2024
Table 28: Exchange Rate Forecasts vs. US Dollar
| Exchange rates vs US$ | Forecast for end of | ||||
| 18-Jul-24 | Oct 24 | Jan 25 | Apr 25 | Jul 25 | |
| EUR | 1.09 | 1.05 | 1.09 | 1.12 | 1.12 |
| GBP | 1.30 | 1.25 | 1.31 | 1.35 | 1.35 |
| CHF | 0.89 | 0.94 | 0.92 | 0.89 | 0.89 |
| JPY | 157 | 157 | 156 | 155 | 154 |
| DXY | 104.2 | 107.1 | 103.7 | 101.3 | 101.1 |
Source: J.P. Morgan estimates, Datastream, forecasts as of COB 28th Jun, 2024
Sector, Regional and Asset Class Allocations
Table 29: J.P. Morgan Equity Strategy — European Sector Allocation
| MSCI Europe Weights | Allocation | Deviation | Recommendation | ||
| Energy | 5.6% | 8.0% | 2.4% | OW | |
| Materials | 7.0% | 6.0% | -1.0% | N | |
| Chemicals | UW | ||||
| Construction Materials | N | ||||
| Metals & Mining | N | ||||
| Industrials | 15.8% | 14.0% | -1.8% | N | |
| Capital Goods ex Aerospace & Defence | UW | ||||
| Aerospace & Defence | OW | ||||
| Transport | N | ||||
| Business Services | N | ||||
| Consumer Discretionary | 9.1% | 7.0% | -2.1% | UW | |
| Automobile | UW | ||||
| Consumer Durables | N | ||||
| Consumer Srvcs | UW | ||||
| Speciality Retail | UW | ||||
| Internet Retail | UW | ||||
| Consumer Staples | 11.7% | 13.0% | 1.3% | OW | |
| Food & Drug Retailing | UW | ||||
| Beverages | OW | ||||
| Food & Tobacco | OW | ||||
| Household Products | OW | ||||
| Healthcare | 16.0% | 18.0% | 2.0% | OW | |
| Financials | 18.1% | 14.0% | -4.1% | UW | |
| Banks | UW | ||||
| Insurance | N | ||||
| Real Estate | 0.9% | 2.0% | 1.1% | OW | |
| Information Technology | 7.1% | 7.0% | -0.1% | N | |
| Software and Services | N | ||||
| Technology Hardware | N | ||||
| Semicon & Semicon Equip | UW | ||||
| Communication Services | 4.5% | 5.0% | 0.5% | OW | |
| Telecommunication Services | OW | ||||
| Media | N | ||||
| Utilities | 4.4% | 6.0% | 1.6% | OW | |
| 100.0% | 100.0% | 0.0% | Balanced |
Source: MSCI, Datastream, J.P. Morgan.
Table 30: J.P. Morgan Equity Strategy — Global Regional Allocation
| MSCI Weight | Allocation | Deviation | Recommendation | |
| EM | 10.0% | 10.0% | 0.0% | Neutral |
| DM | 90.0% | 90.0% | 0.0% | Neutral |
| US | 70.9% | 68.0% | -2.9% | Neutral |
| Japan | 6.2% | 8.0% | 1.8% | Overweight |
| Eurozone | 8.6% | 8.0% | -0.6% | Neutral |
| UK | 3.8% | 6.0% | 2.2% | Overweight |
| Others* | 10.5% | 10.0% | -0.5% | Neutral |
| 100.0% | 100.0% | 0.0% | Balanced |
Source: MSCI, J.P. Morgan *Other includes Denmark, Switzerland, Australia, Canada, Hong Kong SAR, Sweden, Singapore, New Zealand, Israel and Norway
Table 31: J.P. Morgan Equity Strategy — European Regional Allocation
| MSCI Weight | Allocation | Deviation | Recommendation | |
| Eurozone | 51.0% | 48.0% | -3.0% | Neutral |
| United Kingdom | 22.6% | 25.0% | 2.4% | Overweight |
| Others** | 26.5% | 27.0% | 0.5% | Overweight |
| 100.0% | 100.0% | Balanced |
Source: MSCI, J.P. Morgan **Other includes Denmark, Switzerland, Sweden and Norway
Table 32: J.P. Morgan Equity Strategy — Asset Class Allocation
| Benchmark weighting | Allocation | Deviation | Recommendation | |
| Equities | 60% | 55% | -5% | Underweight |
| Bonds | 30% | 35% | 5% | Overweight |
| Cash | 10% | 10% | 0% | Neutral |
| 100% | 100% | 0% | Balanced |
Source: MSCI, J.P. Morgan
Anamil Kochar (anamil.kochar@jpmchase.com) of J.P. Morgan India Private Limited is a co-author of this report.