
JPM Energy
2024 U.S. Election Watch: Energy Sector Implications
The 2024 US election is 6 months away, with neither the Democratic nor Republican party appearing to have a durable advantage over the other given unfavorable sentiment on both parties and several unknowns, including ongoing litigation against former President Trump, the evolution of the Israel-Hamas war, the inflation outlook as well as the timing of fed cuts, and border control issues. Another wildcard is an unforeseen health event by either candidate in what promises to be a grueling fall calendar. According to JPM’s Strategic Research team (see link), most election observers expect a split Congress, with Republicans flipping the Senate, but Democrats retaking control of the House, with razor thin margins likely in both chambers of Congress. Over the past month, market expectations around the Presidential election outcome appear to have shifted back towards Trump, with the RCP betting odds at 51.7 for Trump vs. 35.7 for Biden (the race was a dead heat on May 1, according to the RCP betting odds).
We think the looming election will have the most impact on the broader Clean Energy and Utility sub-sectors given the potential impact on federal clean energy incentives. In the aftermath of Trump’s 2016 election win, the S&P Global Clean Energy Index fell by 10% in the week following the election. While the knee-jerk reaction could be similar under a hypothetical Red wave, there are aspects of the IRA (energy independence/security and job creation) that are aligned with the Republican agenda, and much of the expansion in US manufacturing on the heels of IRA tax credits are in states with Republican strongholds. In traditional energy, one of the most important topics in the 2020 election cycle was the regulation of leases and drilling activity on federal lands, but the industry successfully adapted to these tighter regulations, helping to drive record oil and gas output in the US. We think the most important hot button issues in the upstream and midstream segments include the LNG export permit pause, EPA standards, and federal pipeline permits, although the pace of pipeline development will continue to be shaped by the courts.
- Clean Energy stocks broadly have been under pressure, largely on fundamental factors vs. political risk, with limited IRA benefits baked into valuations: Within our Clean Energy coverage, we include direct IRA benefits in our price target methodology for five product companies (FSLR, ENPH, SEDG, ARRY, and NXT). Three of the five stocks currently trade below the portion of our YE24 valuation based solely on organic operations, excluding value given to direct tax credit benefits. Sentiment around stocks in sub-sectors such as EV charging and green hydrogen has already been challenged due to weak fundamentals, with the stocks lagging the broader market by 17% YTD and 42% YoY, and, as such, we see risk for further downside on negative headline risk associated with the election outcome.
- We outlined the prospects for Clean Energy performance under 3 potential election scenarios: We looked at the key implications for the Clean Energy sector under the three most plausible scenarios today: (1) Biden Presidency, Split Congress; (2) Trump Presidency, Split Congress; and (3) Trump Presidency, Republican Congress. We see a Biden re-election and split Congress as the lowest risk outcome for Clean Energy, as a divided House and Senate would be unlikely to influence any rollback or repeal of IRA incentives. Similar to the first scenario, a Trump Presidency and a split Congress would be unlikely to influence any rollback or repeal of IRA incentives but could raise the risk profile, as Trump would likely slow IRA implementation by reducing funding to departments like the DOE, DOT, EPA, IRS, and Treasury to reduce capacity and the scope of grant and loan spending. We view a Trump Presidency and Republican Congress as the highest risk scenario for Clean Energy, as the Republican majority could partially repeal the IRA through a reconciliation bill, impacting unspent funds given the focus on curtailing federal spending. That said, we do not expect a full repeal of the IRA given the magnitude of spending earmarked in Republican-leaning jurisdictions, as we discuss further in the note.
- Curtailment of the DOE Loan Programs Office’s loan authority could occur under a Republican sweep: We see likely curtailments to the DOE Loan Program Office’s authority in a Republican-controlled scenario, which would have negative impacts for Clean Energy names seeking non-dilutive funding for capex-intensive projects. The IRA provided the DOE Loan Programs Office with $100B of incremental loan authority, with several companies already receiving loans and over 200 active applications seeking more than $260B of funding. There could be risk of loan downsizing or cancellation for applicants who have received conditional commitments without term sheet finalization, or disbanding of applications for applicants who are in earlier stages of the process.
- Subsidies for EVs could be downsized or repealed under a Republican sweep, but domestic protectionism would likely be a focus in either election scenario: The 30D clean vehicle tax credit, which provides up to $7,500 for the purchase of a qualifying EV that undergoes final assembly in North America and meets certain local battery component requirements, could be at risk of downsizing or repeal, coupled with potential relaxing of federal emission standards to further disincentivize EV adoption in a Republican sweep. We also envision tightening of EV charging incentives, including the 30C tax credit that covers up to 30% of the total cost of each charger (up to $1,000 for consumers and $100,000 for commercial projects) and has even been criticized by Senator Joe Manchin as being too generous in its eligibility criteria. However, with Biden’s recent tariff hike on Chinese EVs to 100% and EV batteries to 25% this year, we think both parties would remain focused on protectionism and US competitiveness.
- Clean hydrogen tax credits would likely be unchanged in either election scenario: The 45V tax credit provides clean hydrogen producers with up to $3/kg of clean hydrogen produced, subject to certain emission thresholds. With final guidance expected by 2H24, we think the 45V tax credit remains fairly safe irrespective of the election outcome. The 45V credit enjoys strong backing from the traditional energy sector as well as in Republican-leaning areas where several hydrogen production projects have been proposed and clean hydrogen hubs have already been selected, such as Appalachia and the Gulf Coast.
- Anti-dumping/countervailing (AD/CVD) tariffs on solar imports could rise in either election scenario: We believe there is potential for US tariff hikes on Chinese imports in a second term under President Biden. Former President Trump has been more adamant on increasing duties on Chinese imports, citing potential for tariffs upwards of 60% should he win in November. Furthermore, we believe President Trump would potentially remove the existing bifacial module exemption, which grants tariff immunity for modules capable of capturing light on both sides of the panel, which are used in the majority of utility-scale solar installations today. Given the wide range of potential outcomes, we ran a scenario analysis evaluating US utility-scale solar project capex under various tariff assumptions and module costs. Tariffs ranging from 20-60% on a module increase total project costs between 4-12%, by our estimates.
- Full repeal of IRA unlikely under a Republican sweep as planned investment skews toward Red states: A Republican controlled Congress and Presidency would pose the greatest threat to the IRA as it currently stands, in our view. However, much of the US manufacturing expansion announced on the heels of IRA tax credits is planned for operations in states with Republican strongholds. With an estimated $460bn and counting of clean energy investment announced since the IRA’s August 2022 passage, attempts to repeal the law would likely face stiff opposition from a myriad of public and private actors. Specifically, an estimated two-thirds of the IRA-driven investments have flowed to Republican states and districts, particularly small towns in the rural south (due to tax, regulation, land, and labor tailwinds). Due to these potential bottlenecks, Republicans may instead pursue a partial or symbolic repeal of more controversial parts of the law instead of more popular tax credits for domestic manufacturing, nuclear power, and grid investments. As a result, we view the core utility and renewable energy provisions of the IRA as largely resilient, regardless of the 2024 Election outcome, though a Trump victory likely presents an overhang until definitive policy clarity emerges.
- Unregulated renewables levered to election outcome; regulated assets largely unaffected. Renewables heavy utilities screen as most levered to IRA resilience. While concerns on an IRA repeal present an overhang over renewables developers (AES, AGR, NEE, NJR), we also view a potential Biden re-election as a potential catalyst for renewables to regain lost ground after significant underperformance in 2023. A full IRA repeal would remove the efficiency of tax credit transferability, which could weigh on regulated utilities’ competitiveness to wholly own renewables, possibly representing a headwind for EPS growth rates. Still, we would expect steady renewables growth given C&I decarbonization goals as well as state laws and mandates.
- Biden EPA rules first face Trump, then the Federal Courts. We expect more aggressive EPA rules to continue to meet substantial legal and political resistance, especially in the context of growing power demand forecasts and concerns over grid resiliency. While the Trump Administration would likely undo President Biden EPA’s power plant emission and proposed EV and good neighbor rules, a second Biden term would seek to continue the status quo. President Trump appointed 28% of all judges currently on the federal bench, including 33% of the SCOTUS, giving the Courts a conservative tilt overall. However, President Biden has appointed 22% of all judges currently on the Federal Bench. Additionally, if President Biden wins a second term and Democrats hold the Senate, we could see a continued leftward shift of the federal bench, presenting a more favorable backdrop for environmental rule making.
- Republican administration would likely end LNG export pause; Cheniere fine in any scenario. Following the White House decision in early 2024 to enact a temporary pause on pending decisions for LNG export projects, we expect the election outcome to dictate the pace of future infrastructure build-out. Currently, we see the DOE permitting pause as largely transitory in nature. Regardless of the outcome, top pick Cheniere remains confident in commercializing and ultimately securing permits for future expansions despite the current pause, pointing to success in developing the existing platform after previous permitting pauses.
- Election will likely have limited near-term impact on E&Ps, but Trump 2.0 could support more access to resources and reduce the regulatory burden: Domestic oil and gas production is largely influenced by global supply-demand conditions and prices vs. government policy. While we would expect Trump to provide more access to resources on federal lands and to reduce the red tape associated with permit activity and EPA regulations, we would expect no significant impacts to drilling activity under the intermediate term. On the other hand, we believe a Trump administration could support policies to encourage more energy exports such as LNG, which could have positive implications to the long end of the gas curve.
- Middle East tensions could be mostly negative for refiners, should the US provoke or fail to contain escalation... With tensions still seemingly unresolved between Israel and Iran following the missile attacks on April 13th, we think continued escalation that could ultimately lead to lower Iranian crude production or the closure of the Straight of Hormuz could impair availability of sour crudes to Gulf Coast refiners and result in narrower sweet-sour differentials. In her Election Watch note on March 21(see link), J.P. Morgan Chair of Global Research Joyce Chang noted that “Trump 2.0 would likely take a harder line on Iran, and there is a risk that Iran reacts differently and proves more disruptive…”, suggesting that the risk of the above scenario is perhaps greater under a Trump presidency.
- …while election results could also have important implications for Russia/Ukraine. The Russia/Ukraine war has had several implications for US refiners, including a loss of natural gas supply from Russia into the EU, which led to a spike in European gas prices in 2022, raising break-evens for European refineries and having an impact on diesel production given a greater use of natural gas in diesel production. More recently, Ukraine has launched a campaign of drone attacks on Russia refineries, which has left refinery capacity offline as a result. While we think supply chains have generally adjusted for both crude and products to Russia sanctions, and offline refinery capacity should be mostly back prior to the election, any resolution to the war in Ukraine could ultimately take out some upside risk for refiners. On this front, Joyce believes that under a second Trump presidency, the probability is increased of Ukraine signing a settlement unfavorable to its own interests in order to end the war.
- Refiners a beneficiary of Trump tax cuts. As full tax payers (with some offsets around MLP and renewable fuels earnings, where applicable), refiners have been beneficiaries of the Trump corporate tax cuts in 2017, which Joyce expects to be extended under Trump 2.0, while she does not expect Trump to pursue incrementally lower rates. With the corporate rate cut from 35% to 21%, VLO, as an example, saw its effective tax rate cut from an average of ~33.5% in the 2011-2015 to ~24% from 2017-2019. We think the tax savings have largely been returned back to shareholders for refiners in the form of share buybacks.
- Key RFS issue likely around SREs. While the total % obligation in the RFS was raised over time in both the Trump and Biden administrations, the administrations differed in their treatment of small refinery exemptions (SREs). We believe the RFS % obligation is unlikely to be adjusted downward under either administration, but his actions during his first presidency would suggest Trump would be far more likely to issue SREs with less scrutiny, which could ultimately put further downward pressure on RIN prices. One difference between the next presidential term and the prior two is that many refiners have started up incremental renewable diesel capacity, which serves as a partial offset to their short RIN positions from their conventional refining operations.
Clean Energy
Baseline expectations into the 2024 elections. We expect campaign rhetoric and fluctuating polling data to accentuate share price moves for stocks under coverage that supersede the IRA’s premium, or lack thereof, currently baked into trading valuation levels across the renewable space. We think a Red wave, where Republicans sweep all three legislative branches, carries the greatest risk to the IRA, though political experts and odds makers continue to view the clean sweep as unlikely, thus far. Furthermore, while many Republican officials have been publicly critical of the IRA, there are essential aspects of the IRA that fall in alignment with the Republican agenda – for example, energy independence/security and job creation – which, when combined with much of the announced capital investment to be deployed in Red states and the challenges of repealing a law of this magnitude (e.g. Affordable Care Act), makes a full IRA repeal unlikely in our baseline view. That said, we believe Republican lawmakers would likely target “non-core” portions of the IRA, such as ITC adders and incentives for longer-dated technologies that are not currently being deployed in mass capacity. In particular, we believe offshore wind would be a target for incentive repeal, as former President Trump recently noted on the campaign trail that he would end planned offshore wind projects on his first day in office should he win in November.
Little baked into valuations. We include direct IRA benefits in our price target methodology for five product companies under our coverage. Three of the five stocks currently trade below the portion of our YE24 valuation based solely on organic operations, excluding value given to direct tax credit benefits, and all five trade below our full YE24 price target.
Figure 1: JPM Price Targets for Select Companies
| FSLR | ENPH | SEDG | ARRY | NXT | |
| JPM YE24 Price Target ("PT") | $262 | $128 | $73 | $29 | $63 |
| PT from organic earnings | $176 | $114 | $62 | $24 | $61 |
| PT from IRA incentives | $86 | $14 | $12 | $4 | $7 |
| Percentage of PT from IRA incentive | 33% | 11% | 16% | 14% | 11% |
| IRA incentive utilized | 45x | 45x | 45x | 45x | 45x |
Source: J.P. Morgan estimates.
Figure 2: Current Trading Multiples Compared to Multiples the Day Prior to the IRA Announcement
| Stock | Metric | FY24E Multiple | FY22E Multiple (7/27/2022) | Premium/(Discount) |
| AMPS | EV/EBITDA | 14x | 14x | -5% |
| ARRY (JPMe: inc-45x) | EV/EBITDA | 9x | 25x | -63% |
| ARRY (JPMe: ex-45x) | EV/EBITDA | 14x | 25x | -44% |
| AY | DPS Yield | 9.9% | 5.3% | -89% |
| BE | EV/EBITDA | 15x | 56x | -73% |
| BEP | DPS Yield | 6.8% | 3.5% | -92% |
| BEPC | DPS Yield | 6.3% | 3.4% | -85% |
| CSIQ | P/E | 3x | 8x | -65% |
| ENPH (JPMe: inc-45x) | P/E | 33x | 62x | -48% |
| ENPH (JPMe: ex-45x) | P/E | 50x | 62x | -20% |
| FCEL | EV/Sales | 2x | 6x | -65% |
| FLNC | EV/Sales | 1x | 2x | -48% |
| FSLR (JPMe: inc-45x) | EV/EBITDA | 9x | nm | nm |
| FSLR (JPMe: ex-45x) | EV/EBITDA | 19x | nm | nm |
| GNRC | EV/EBITDA | 13x | 15x | -13% |
| HASI | P/E | 10x | 17x | -40% |
| ITRI | EV/EBITDA | 15x | 15x | 1% |
| NEP | DPS Yield | 13.2% | 3.8% | 249% |
| NOVA | EV/EBITDA | 21x | 46x | -56% |
| ORA | EV/EBITDA | 10x | 14x | -26% |
| RUN | Mkt Cap/Current NAV | 0.5x | 1.1x | -56% |
| SEDG (JPMe: inc-45x) | P/E | nm | 45x | nm |
| SEDG (JPMe: ex-45x) | P/E | nm | 45x | nm |
| SHLS | EV/EBITDA | 11x | 43x | -76% |
| SPWR | EV/EBITDA | nm | 32x | nm |
| TPIC | EV/EBITDA | 18x | 14x | 22% |
| Average Premium/(Discount) - inc-45x | -33% | |||
| Average Premium/(Discount) - ex-45x | -31% | |||
| SP500 | P/E | 21x | 18x | 19% |
Source: J.P. Morgan estimates, Bloomberg Finance L.P. **Multiples use JPMe earnings excluding FY22 multiples for NEP and FLNC which use Street consensus.Pricing as of 5/17/24
Planned renewable investment skews toward Red states. While our baseline view does not assume a full IRA repeal under a Republican sweep, a Republican controlled Congress and Presidency would pose the greatest threat to the IRA as it currently stands, in our view. However, much of the US manufacturing expansion announced on the heels of IRA tax credits is planned for operations in states with Republican strongholds (see investment figures below). As such, we believe Senators/Representatives from these states may be inclined to support IRA provisions that support local job growth, making a large-scale repeal of the IRA difficult.
Figure 3: Investments Announced Under the IRA
$ in billions, bubble color = party of Governor (Red = Republican, Blue = Democrat)
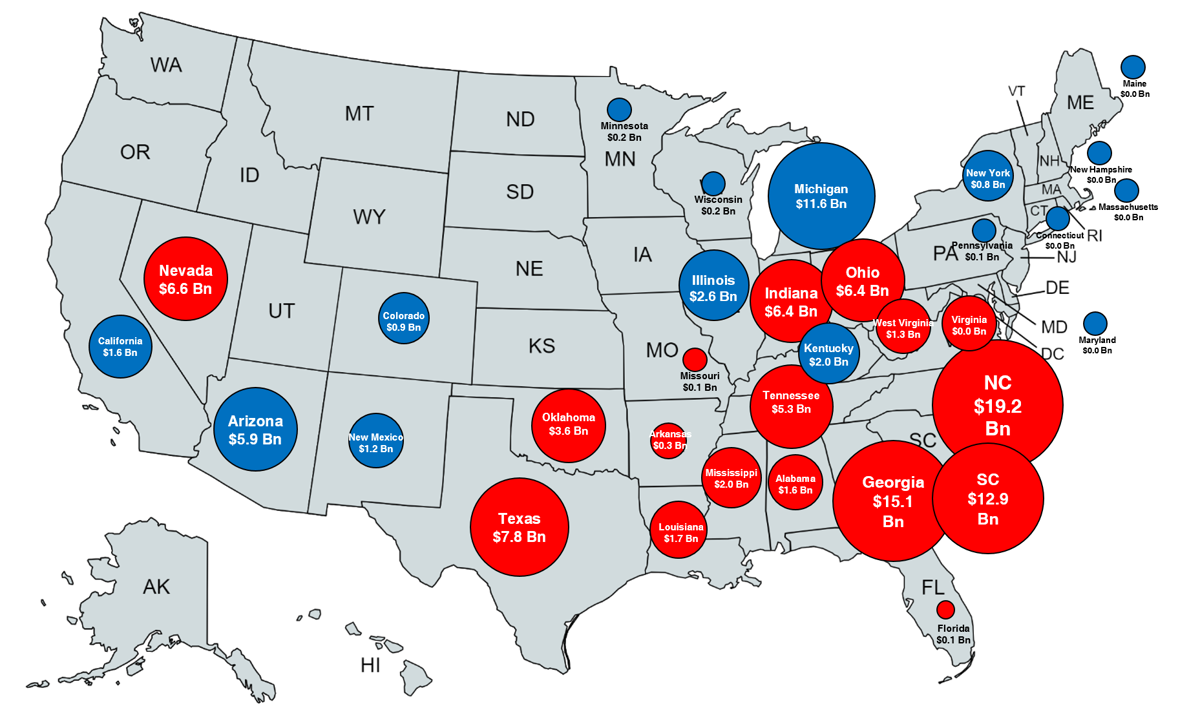
Source: Clean Economy Works.
Figure 4: Post-IRA US Module Manufacturing Announcements by State
| State | MWs | % of Total |
| TX | 25,200 | 28% |
| UT | 20,000 | 22% |
| OH | 8,600 | 10% |
| GA | 5,800 | 6% |
| AZ | 5,500 | 6% |
| AL | 3,500 | 4% |
| LA | 3,500 | 4% |
| NM | 3,500 | 4% |
| NY | 3,400 | 4% |
| OK | 3,000 | 3% |
| CO | 2,000 | 2% |
| CA | 1,700 | 2% |
| NC | 1,200 | 1% |
| MN | 1,150 | 1% |
| IN | 1,038 | 1% |
| SC | 1,000 | 1% |
Source: J.P. Morgan, Company reports, Solar Power World, PV Magazine, Bloomberg Finance L.P.
What happens with greater US/China scrutiny? As background, the US has imposed anti-dumping/countervailing (AD/CVD) tariffs on solar module imports from China since 2012. In response to the tariff imposition, Chinese module manufacturers expanded into southeast Asia, where the US historically has not imposed AD/CVD solar import tariffs. In early-2022, Auxin Solar, a US-based solar panel manufacturer, petitioned the US government to review imports coming from SE Asia (Thailand, Cambodia, Vietnam, and Malaysia) to determine whether Chinese manufacturers were circumventing tariffs by continuing to mostly manufacture in China and conduct simple, final assembly processes in SE Asia. In August 2023, the US Department of Commerce issued a final determination in the investigation, ruling that five companies will be subject to new tariffs on imports to the US from SE Asia. That said, there are potential workarounds to the new tariffs owing to exceptions granted by Commerce: tariffs will not be imposed if 1) non-Chinese wafers are used or 2) China wafers are used but at least four of six other materials are sourced outside of China (silver paste, aluminum frames, glass, backsheets, EVA sheets, junction boxes). Additionally, President Biden issued an executive order in June 2022 that no new tariffs would be enacted for two years, meaning that the new AD/CVD tariffs will not go into effect until June 2024. As such, we do not expect a material impact on US solar fundamentals when the moratorium expires from this iteration of AD/CVD tariffs .
AD/CVD – a further look at the background. AD/CVD tariffs have survived three separate presidential administrations, both political parties in the White House, and the two main 2024 presidential candidates each respectively supported the tariffs. Furthermore, US/China trade tensions have yet to show signs of easing, and the enactment of the IRA has underscored the focus on domestic solar manufacturing, in our view. As such, while we believe there is potential for US tariff hikes on Chinese imports in a second term under President Biden, former President Trump has been more adamant on increasing duties on Chinese imports while on the campaign trail, citing potential for tariffs upwards of 60% should he win in November. Furthermore, we believe President Trump would potentially remove the existing bifacial module exemption, which grants tariff immunity for modules capable of capturing light on both sides of the panel, which are used in the majority of utility-scale solar installations today. Given the wide range of potential outcomes, we ran a scenario analysis evaluating US utility-scale solar project capex under various tariff assumptions and module costs. Tariffs ranging from 20-60% on a module increase total project costs between 4-12%, by our estimates (see figure below).
AD/CVD – the next iteration. On May 15, the US Commerce Department and International Trade Commission (ITC) announced the initiation of antidumping and countervailing duty investigations of solar cells from Cambodia, Malaysia, Thailand, and Vietnam. The announcement came after leading US solar manufacturers, including First Solar and Hanwha Q CELLS, filed the initial petition on April 24, alleging unfair trade practices from SE Asian countries, unfairly weighing on domestic solar manufacturers. The ITC will make a preliminary determination 45 days after the petition was filed (June 10), while the DoC will make a preliminary determination 65 days after the petition for CVD (July 18) and 140 days for AD (October 1). Note that these deadlines could be extended further – the DoC’s initial determination in the 2022 AD/CVD case was approximately 8 months after the petition was filed. We note that “critical circumstances,” which would make tariffs retroactive for 90 days prior to the preliminary determination, will be deemed necessary or not necessary, based on the preliminary findings. We believe the investigation is an incremental positive for US-based panel manufacturer First Solar (FSLR/OW), though a negative for the remainder of our solar coverage. Based on industry sources, we believe the US is currently oversupplied with solar modules, with 12-18 months of deployments in inventory. Therefore, we would not expect an impact to 2024 project deployments; however, if an investigation is conducted, we believe utility-scale solar providers under coverage (ARRY, NXT, SHLS) could see bookings activity for 2025 deliveries begin to slow. Residential solar was relatively less impacted by the 2022 AD/CVD investigation; however, homeowner demand was then strong enough that installers were generally willing to pay a premium to cover the AD/CVD risk, which we believe would be less likely in 2024 given relatively reduced homeowner demand.
Figure 5: Import Tariff Impact on US Utility-Scale Solar Development Cost – $0.20/w Module Cost Scenario
| US Import Tariff Assumption | |||||
| US Capex Assumption | 20% | 30% | 40% | 50% | 60% |
| US Utility-Scale Solar Total Cost/w | $1.00 | $1.00 | $1.00 | $1.00 | $1.00 |
| Module Cost/w | $0.20 | $0.20 | $0.20 | $0.20 | $0.20 |
| Tariff Cost/w | $0.04 | $0.06 | $0.08 | $0.10 | $0.12 |
| Tariff Adjusted Module Cost/w | $0.24 | $0.26 | $0.28 | $0.30 | $0.32 |
| Tariff Adjusted Total Project Cost/w | $1.04 | $1.06 | $1.08 | $1.10 | $1.12 |
| Cost/w change, % | 4.0% | 6.0% | 8.0% | 10.0% | 12.0% |
Source: J.P. Morgan estimates.
Red or Blue, historical deployments grew. We remind investors that, despite differences in policy, there were more renewables deployed during the four years of the Trump administration than in the last four years of the Obama administration, owing to continued cost declines. Therefore, although the election news cycle could accentuate aforementioned volatility levels, we would expect growth trends in relatively more mature technologies such as solar, wind and storage to continue regardless of policy.
Figure 6: Wind and Solar Installations Under the Last 3 US Presidential Four-Year Cycles
GW
| Obama: 2013-2016 | Trump: 2017-2020 | Biden: 2021-2024E | |
| Solar | 33,944 | 51,863 | 123,938 |
| Wind | 22,579 | 41,411 | 38,295 |
| Total | 56,523 | 93,274 | 162,233 |
Source: Bloomberg Finance L.P. and J.P. Morgan.
Follow the money. Under various energy transition scenarios, BNEF forecasted in its 2022 New Energy Outlook that there will be between $100-200 trillion dollars invested in a global energy transition through 2050. Global renewable energy investment reached $673bn in 2023, marking another annual record and up 10% over 2022. While we acknowledge that subsidies can drive investment, it is our opinion that no single president can effectively inhibit or materially derail a global transformation of the forecasted magnitude.
Figure 7: BNEF Investment Forecast Through 2050 – Economic Transition Scenario
$ in USD
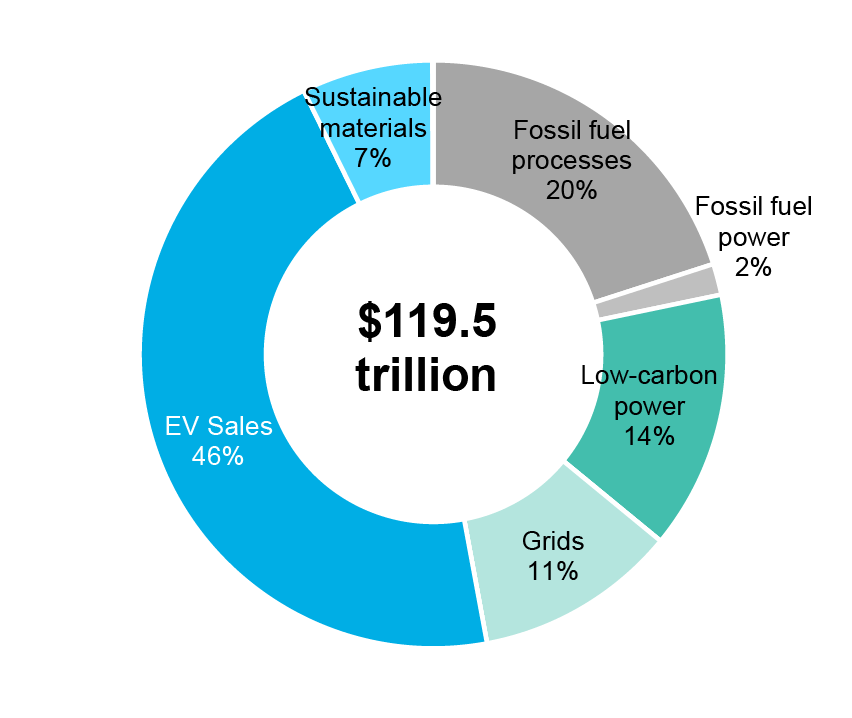
Source: Bloomberg Finance L.P.
Figure 8: BNEF Investment Forecast Through 2050 – Net Zero Scenario
$ in USD
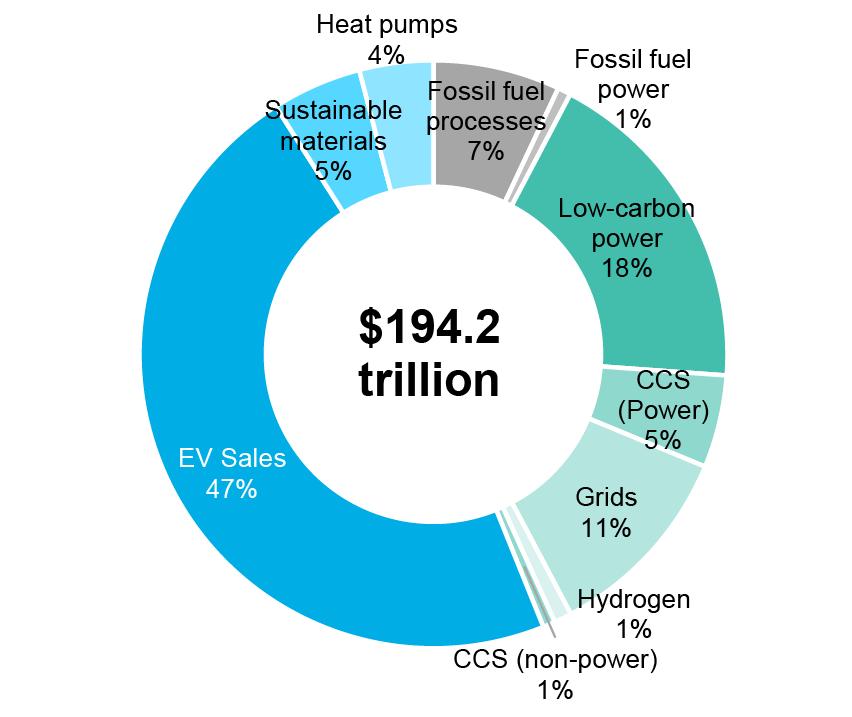
Source: Bloomberg Finance L.P.
Clean Tech
Rhetoric around Clean Tech remains polarized in the US, with a presidential election on the horizon likely to dictate where near-term sentiment trends. A common view among investors is that a Republican majority would result in a rollback of federal clean energy incentives. We think weak sentiment around Clean Tech stocks (-26% YTD vs. S&P +12% YTD) has been more symptomatic of challenged market fundamentals rather than political risk, with most investors waiting on the sidelines until an election outcome becomes clearer. In any case, we see further room for Clean Tech stocks to fall on negative headline risk given elevated short interest (20-30%) for several of our names; in the week following Trump’s 2016 election win, the S&P Global Clean Energy Index fell 10%. In the following sections, we detail 1) potential election outcomes, 2) potential implications for clean energy incentives, and 3) exposure for our coverage universe. We see the most risk for the hydrogen and charging sectors given reliance on the DOE Loan Program Office to supply low-cost non-dilutive financing and/or exposure to potential curtailments of the IRA 30D, emission standards, and other tax credits that directly impact supply and demand dynamics, likely slowing the pace of clean technology adoption in these markets which have already been slow to start. To be fair, we think any benefit from federal incentives is currently considered upside from investors and not a base case scenario, but we think these sectors in particular could underperform on near-term headline risk within Clean Tech despite maintaining a positive long-term outlook tied to decarbonization, even without incentives. The remainder of our coverage focused on advanced air mobility and advanced batteries should remain more insulated on a relative basis, with little reliance on domestic subsidies to date.
J.P. Morgan’s Strategic Research Team noted that neither the Democratic nor Republican Party is seen as having a durable advantage over the other given unfavorable views on both parties, but a split Congress with the Democrats taking the House and the Republicans taking the Senate with narrow margins is seen as the most likely outcome. The factors outlined as key in determining the presidential outcome include 1) whether Trump is convicted of a crime amid ongoing litigations against him and the implications for maintaining public and fund-raising support; 2) evolution of the Israel-Hamas war and prospects for resolution; 3) whether Fed cuts and the inflation outlook will alleviate cost of living pressures; and 4) management of border control issues.
We outline 3 potential election scenarios below, ranking them from lowest to highest risk to Clean Tech performance, in our view:
Figure 9: US Clean Tech Planned Factory Investments Post-IRA by Political Leaning
$ billions
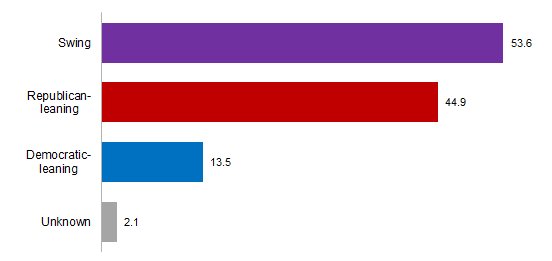
Source: Bloomberg New Energy Finance.
Potential Risks for Clean Tech
In the event that the election outcome favors the Republican party and IRA implementation is targeted, we think the DOE Loan Program Office’s authority, 30D consumer EV tax credit, and EPA emission standards would be at highest risk of curtailment. If a change in administration becomes clearer over the next few months, we will most likely see a significant acceleration in clean energy policymaking, including the finalization of key IRA tax credit guidance, dispersal of allocated funds, and/or issue of additional loans or grants. In the meantime, we think some large-scale projects could remain paused ahead of FID until there is sufficient clarity to proceed.
Table 1: Sector Exposure
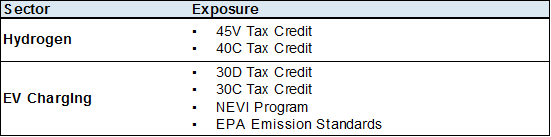
Source: J.P. Morgan.
Table 2: Risk of Curtailment of Clean Energy Incentives
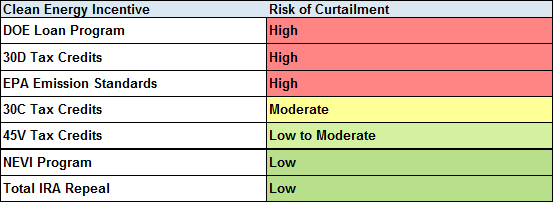
Source: J.P. Morgan.
DOE Loan Program
Loan Authority: We could see a pause in new loan or loan guarantees, measures to make the due diligence process more onerous, or even the shutdown of the LPO altogether. The IRA provided the DOE Loan Programs Office with ~$100B of incremental loan authority, expanding its Title 17, ATVM, and Tribal Energy funding programs with the intention to help clean tech companies scale to bankability. Since the IRA’s passage, LPO has provided conditional loan commitments and/or loans to Plug Power (PLUG, N), Lithium Americas (LAC, N), BlueOvalSK, KORE, CelLink, Li-Cycle, Redwood Materials, and Ioneer Rhyolite Ridge.
- Potential Action: We could see no new loans or loan guarantees backed during the transition period, a rollback in the amount of loan authority, or even potential elimination of the LPO altogether. The Heritage Foundation’s policy proposal to shape a potential Republican presidential transition (“Project 2025”) includes several mentions of limiting the DOE LPO’s loan granting capabilities, citing the risk passed on to taxpayers, the disproportionate amount of private investment directed towards publicly backed projects with political support, and barriers for other companies outside of the process. Alternatively, we could see the due diligence process become longer and more challenging, with a preference for projects that improve national security and grid reliability, which could disadvantage companies in the charging sector within our coverage. We will likely see companies in the advanced stages of a DOE loan application focus on closing a deal before the election.
- As of February 2024, LPO had 203 active applications in its pipeline for a total of $261.8B requested, featuring a notable presence from renewables deployment, hydrogen, and likely charging in the “advanced vehicles and components” or “clean fuels and products” categories.
Implications:
- Plug Power (PLUG): Earlier in May, Plug Power announced that it has received an up to $1.66B conditional loan commitment from the US Department of Energy’s Loan Programs Office to finance up to 6 green hydrogen plants (link). Plug must still receive final loan approval, subject to various conditions and final financial negotiations with the DOE, which could include raising additional capital in the interim, with risk of delay if any challenges arise during the federal permitting process. Based on precedent from Lithium Americas (LAC), which received a conditional loan commitment in March, it can take 6-9 months to move from a loan commitment to a finalized loan for a single project. We think Plug’s loan platform and project-level application approval could bleed in to 2025 and could therefore face some risk in being finalized and funded.
- Charging Owner-Operators: Several pure-play charging owner-operators have a large pipeline of potential sites to expand to, but many companies remain fairly capital-limited and impacted by inflationary pressures, despite already receiving capex offsets on the local level and federal level through grants and subsidies. We have heard some publicly comment that they are engaged in Part 2 of the DOE loan application process. While the current loan-granting authorities at the DOE appear to be supportive of a multitude of projects, we note that the sheer volume of applications (200+) undergoing some level of due diligence could impact the pace at which loans move and push timing back to a time post- a potential presidential transition and risk losing access to the capital. In a recent call, LPO Director Jigar Shah commented that the LPO had already run through most of its authorized administrative budget completing due diligence on a large pipeline, which points to slowdowns even with a supportive administration.
Electric Vehicles
30D Tax Credits: We could see an increase in local content thresholds and/or removal credits altogether. The IRA extended the 30D clean vehicle tax credit, which provides up to $7,500 for the purchase of a qualifying EV that undergoes final assembly in North America and meets battery component and critical mineral requirements, subject to limitations around sourcing from a foreign entity of concern (FEOC).
- Potential Action: We could see several means of curtailing the 30D tax credits, either by re-instating the pre-IRA credit cap of 200,000 vehicles per manufacturer, increasing local content requirements to shrink the number of tax credit-qualifying EVs, or even by removing the tax credit altogether.
- EVs have become largely politicized, with only ~30% of Republicans supporting financial incentives for EV purchases vs. ~70% of Democrats (link). Trump has publicly promised to slash EV incentives, claiming that a proliferation of EVs would eliminate auto industry jobs and benefit China, and impose a 100% tariff on EVs imported to the US from Mexico (link).
- We note that Republicans planned to repeal the pre-IRA version of the 30D tax credit in 2017 and 2019 in proposed tax and budget plans, respectively, prior to its extension through the IRA but never managed to fully cut; given that geopolitical tensions with China have worsened even further since this time, we remain cautious on the tax credits staying in their current forms.
- EV demand has remained downtrodden, even with the tax credits being available to consumers over the last several months (albeit with fewer qualifying models now vs. in 2023), but we think a removal of the credits could have ripple effects on public perception around EV affordability and further dampen demand.
Table 3: Current 30D Tax Credit Requirements
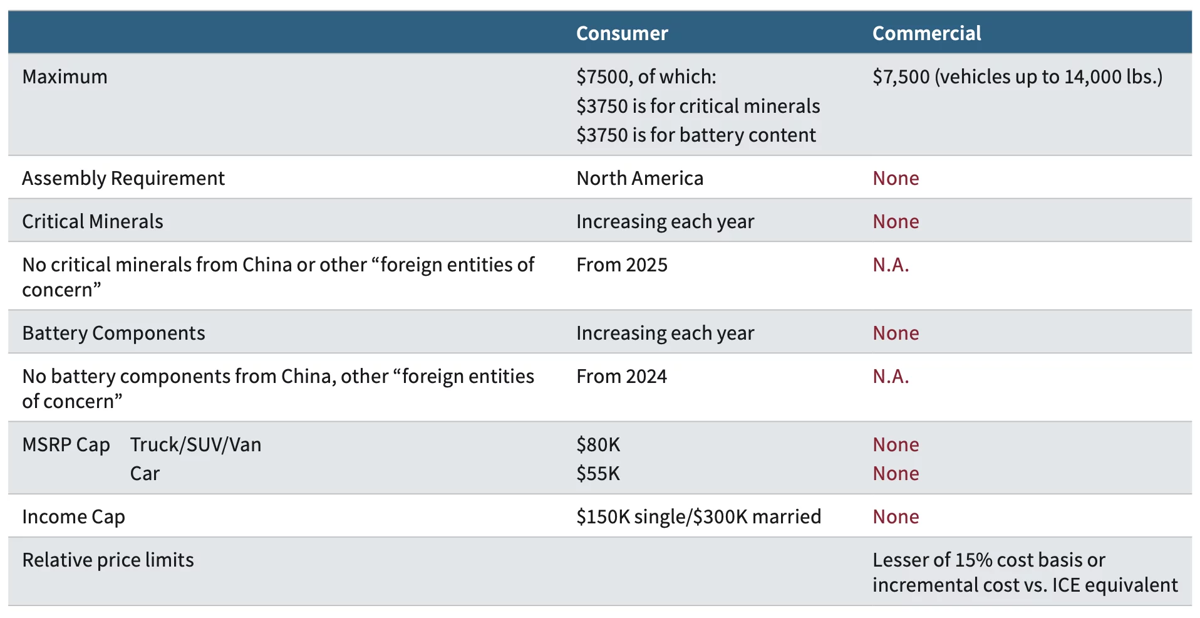
Source: Stanford University.
Table 4: Current Critical Mineral & Battery Component Content Requirement Ramp
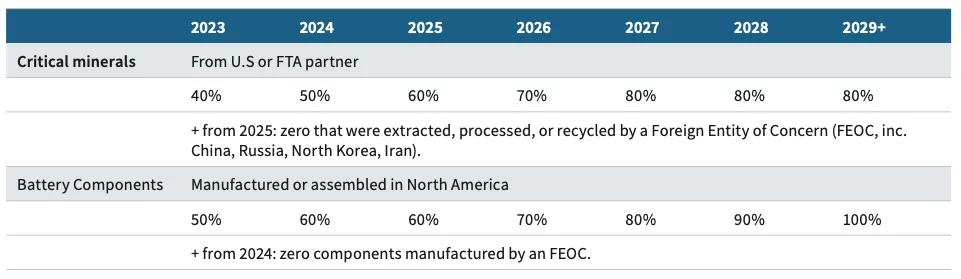
Source: Stanford University.
EPA Emission Standards: We could see a significant loosening of federal emission standards to disincentivize EV adoption. The EPA recently announced stricter vehicle emission standards which require light- ,medium-, and heavy-duty vehicles manufactured from model years 2027-2032 to eliminate carbon emission at an accelerated pace (link).
- Potential Action: We could see significant lowering of the emission standards and/or delay to timing of the mandate taking effect, as well as attempts to challenge state-level emission standards that are stricter.
- In March 2020, the Trump Administration took measures to roll back the former Obama Administration’s 2012 fuel efficiency standards requiring automakers’ fleets to average ~54mpg by 2025 to ~40mpg instead, implying fuel economy efficiencies even below the auto industry’s annual average gain (link).
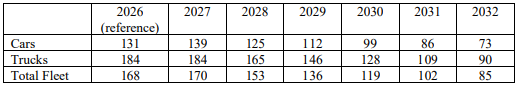
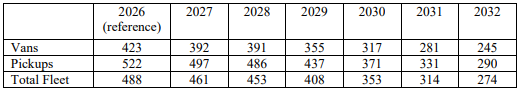
- The recently issued stricter standards have been met with Republican criticism, who characterize the move as a “misguided electric vehicle mandate” that will inevitably increase US reliance on Chinese critical minerals (link). Moreover, several states have moved to sue the EPA, citing overreach. The EPA has said its rules are “technology-neutral” with pathways for decarbonization with hybrid, electric, and fuel cell vehicles or “advanced” ICE vehicles. In the technology scenarios provided in the final ruling report, the EPA forecasts ICE vehicles becoming 17-29% of the overall vehicle mix by model year 2032 vs. BEVs between 35-56%, which is likely to be an area of focus considering Trump’s anti-EV stance.
Table 5: Current EPA Light-Duty Emission Standards
Source: EPA.
Table 6: Current EPA Medium-Duty Emission Standards
Source: EPA.
Table 7: Projected New Vehicle Penetrations by Technology to Meet EPA Standards
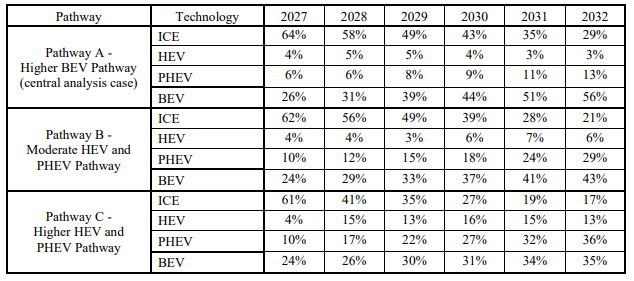
Source: EPA.
Section 301 EV Tariffs: We think recently enacted tariffs on Chinese EV imports would likely remain in place in either election scenario.
- Biden recently enacted strict tariffs on Chinese exports to the US, citing artificially low prices and unfair trade practices, amid broader government discussions of clean tech overcapacity overseas. The tariff rate on EVs under Section 301 will now increase from 25% to 100% in 2024. Meanwhile, tariffs on lithium-ion EV batteries will increase from 7.5% to 25% in 2024.
- The US imports very few Chinese EVs today (12,362 in 2023) but imports significant amounts of EV batteries and critical minerals (link). Given that China has been at the forefront of clean energy cost-reductions over the last several years, we think the tariffs will likely create inflationary pressures for US EVs with pass-throughs to end-consumers. Prior research from the Center for Strategic and International Studies showed that more restrictive trade policies could delay how competitive clean tech is relative to a higher-carbon counterpart, modeling 1 year for solar vs. natural gas, 2 years for EVs vs. ICE, and 3 years for onshore wind vs. gas (link). While the report was written prior to the IRA being passed, we still think the tariffs in either election scenario could worsen consumer affordability (or sentiment around it) in the US in favor of hybrids.
EV Charging Incentives (30C Tax Credit & NEVI): With an anti-EV stance and cautious outlook on federal spending, we could see curtailments of 30C and NEVI funding. The 30C tax credit is available to consumers as well as commercial and fleet operators installing charging infrastructure. The tax credit covers up to 30% of the cost of each charger up to $1,000 for consumers and $100,000 for commercial projects. The NEVI program provides grant funding to states to deploy chargers along highway corridors and in low-income communities.
- Potential Action: We could see significant tightening around who is eligible for the 30C tax credit as well as attempts to slash funding for the NEVI program for future fiscal years (though to a lesser extent).
- The White House suggests that ⅔ of consumers are eligible for the 30C tax credit based on the draft guidance. However, even Democratic Senator Joe Manchin said the proposed guidance "spits in the face of rural America" and accused the administration of "ignoring the law in pursuit of its radical climate agenda" by making the credit too widely accessible, rather than evening the playing field for rural consumers who may not otherwise be incentivized to install the infrastructure (link).
- The Reverse the Curse resolution from the US House Budget Committee proposed cutting BIL funding by $25B, while the 2025 Project proposes cutting even more – $102B – on “wasteful” clean energy measures, and specifically pointing to EV charging and transportation decarbonization. We think NEVI funding faces less risk than its IRA tax credit counterparts since most funding will have already been outlaid by the time a presidential transition were to take place, unlike the IRA, which includes funding for several years following this. In addition, NEVI funding for the near term has been appropriated to states, creating more separation between federal and state actions.
Figure 10: 30C Tax Credit Eligible Locations

Source: Argonne National Laboratory. Turquoise = 30C-eligible locations through 2030.
Implications:
- ChargePoint (CHPT): With a change in administration likely to further weaken already muted sentiment around the EV value chain, we could see downside risk to commercial and fleet EV demand, and especially so if looser EPA emission standards fail to support the “stick” part of carrot and stick incentives to electrify medium- and heavy-duty vehicles. We could not only see slower EV adoption but also slower learnings on the cost curve, making it take longer for EVs to become affordable and widely accessible. ChargePoint has publicly stated that NEVI and 30C are not expected to be extremely meaningful parts of the story, but could prevent host customers from expanding sites and therefore purchasing hardware and software from ChargePoint. In any case, we think ChargePoint could still insulate itself by demonstrating it can reach profitability in a challenged EV market as soon as this year, and benefit from its sticky software side of the business, which has recently de-coupled from the hardware part of the business (link).
- Charging Owner-Operators: Charging owner-operators who control the charging infrastructure benefit more directly from federal, state and local grants and credits (including the likes of 30C and NEVI) to offset capex per stall, which can be up to hundreds of $1000s. Installing more chargers is the core growth driver of the business, but it is also reliant on an operator’s ability to fund the expansion. We think in the meantime that growing utilization from existing drivers, new drivers, and rideshare customers should help owner-operators grow in the near term, even if EV demand does slow as a result of pushback to EV incentives, but we see this likely reversing over time if driver friction grows or if competitors are able to add chargers at a faster rate.
Hydrogen
45V Tax Credits: We think there is a low probability of any significant tightening around 45V tax credit eligibility. The 45V tax credit provides clean hydrogen producers with up to $3/kg of clean hydrogen produced, subject to certain emission thresholds and additional guidance around additionality, time matching, and deliverability to reduce lifecycle emissions.
- Potential Action: With final guidance around the corner (expected in 2H24, as early as June but more likely in November), we think the 45V tax credit remains fairly safe from significant curtailment. If anything were to occur, we think there could be loosening of emissions requirements to qualify for clean hydrogen credits, with limited risk around repealing this tax credit entirely, in our view.
- The oil and gas sector, which has been favored by the Republican party, has become fairly involved in pursuing hydrogen production projects, many of which are focused on blue hydrogen (natural gas-based hydrogen + CCS) over renewables-based green hydrogen. The draft guidance proposed by the Treasury around 45V largely excludes blue hydrogen given strict requirements around clean power feedstocks, and the 45Q CCS tax credit is less lucrative. During CERAWeek in March 2024, Exxon commented that the current restrictions around the tax credits would prevent Exxon from moving forward with blue hydrogen projects.
- The American Petroleum Institute (API), the largest oil and gas trade association in the US and a large Republican donor, commented that the 45V tax credit is too popular in Republican states to repeal. Moreover, Dan Brouillette, who was Trump’s last Energy Secretary and now is CEO of Edison Electric Institute, commented that tax credits were largely favored broadly by Republican lawmakers.
Implications:
- Plug Power (PLUG): In our view, it is seeming more likely that final 45V guidance will end up being more lenient than the draft given the extent of pushback from project developers and industry players. While tax credit guidance had been a large anticipated catalyst in prior quarters, we think investors are more focused on the company’s ability to roll through price increases to salvage its hydrogen fuel margins against the backdrop of a challenged balance sheet; therefore, outside of headline risk, we think investors are not penciling in any kind of significant tax credit benefit that would be eliminated as a result of changes in administration. Sentiment around the name remains muted, in our view, with investors more likely to warm up based on successful execution over a multi-quarter period rather than from a subsidy decision alone, which in any case would be minimal for several years as Plug ramps up its hydrogen network.
Advanced Batteries & Advanced Air Mobility
- Advanced Batteries (ENVX): While any rollback of the 45X IRA tax credit could be detrimental to the broader advanced battery industry, we think this should have limited impact on silicon-anode player Enovix, whose manufacturing footprint is almost entirely in Asia, supported by local government incentives. The company has never publicly claimed benefits from US tax credits.
- Advanced Air Mobility (ACHR, BLDE, JOBY & LILM): We sense that the advancement of eVTOLs are not particularly partisan, with support from local and state governments that span different political leanings. We actually see eVTOL as being potentially insulated from either presidential outcome considering Archer and Joby’s demo trials with the US Air Force for various kinds of missions with initial contracts in the $100M range. Moreover, with China largely dominating the competitive landscape for drones, we think there will be bipartisan support to prevent this from happening in the eVTOL market given potential national security significance.
Utilities and Energy Infrastructure
Inflation Reduction Act (IRA)
Debate over IRA resilience looms large; hurdles to material rework loom larger. IRA resilience remains at the forefront of investor and policy maker conversations over the potential implications of the 2024 elections. While material benefits to Red states lead us to view a full repeal as highly unlikely in a Trump victory (tweaking certain parts likely), we expect the potential overhang to continue until November and potentially beyond in the event of a Trump Presidency. To repeal all or parts of the law, the GOP would likely have to win a trifecta in Washington, requiring President Trump to re-take the White House and Republicans to take the US Senate, while holding the US House. With the majority party often holding only a slim majority in both Chambers, an IRA repeal would likely rely on the use of parliamentary maneuvers such as the budget reconciliation process (bypassing the 60-vote threshold for a filibuster in the Senate) and would require a near lockstep, party line Republican vote. The likely narrow margin would put potential GOP defectors in a position to make demands, mirroring the multiple attempts and months of internal negotiations leading up to the failed ACA repeal. As an IRA repeal likely does not represent the top priority in a Trump presidency, we would expect certain DOE loan programs, initiatives such as offshore wind, and other measures to immediately slow down. While a Republican sweep would likely adversely impact the space, we see notable political hurdles to a full repeal. A Biden presidency would likely result in status quo.
IRA incentives still favor Red states, supporting resilience. Under a Republican sweep scenario, we may witness an internal debate between ideology and economics, with some Republicans pushing to repeal the IRA on principle and others quietly expressing reluctance due to IRA funding disproportionately benefiting Red states and districts. With an estimated $460bn and counting of clean energy investment announced since the IRA’s August 2022 passage, attempts to repeal the law would likely face stiff opposition from a myriad of public and private actors. Specifically, an estimated two-thirds of the IRA-driven investments have flowed to Republican states and districts, particularly small towns in the rural south (due to tax, regulation, land, and labor tailwinds). Accordingly, the swing Congressional Republican votes would likely have strong economic incentives at home to break with their party on an IRA repeal vote. Due to these potential bottlenecks, Republicans may instead pursue a partial or symbolic repeal of more controversial parts of the law, instead of more popular tax credits for domestic manufacturing, nuclear power and grid investments. As a result, we view the core utility and renewable energy provisions of the IRA as largely resilient, regardless of the 2024 election outcome, though a Trump victory would likely present an overhang until definitive policy clarity emerges.
Commercial renewables levered to election outcome; regulated assets largely unaffected. Renewables-heavy utilities screen as most levered to IRA resilience, but potential changes would likely have implications for the sector at large. While concerns on an IRA repeal present an overhang over renewables developers (AES, AGR, NEE, NJR), we also view a potential Biden re-election as a potential catalyst for renewables to regain ground after significant underperformance in 2023. A full IRA repeal would remove the efficiency of tax credit transferability, which could weigh on regulated utilities’ competitiveness to wholly own renewables, possibly representing a headwind for EPS growth rates. Still, we would expect steady renewables growth given C&I decarbonization goals as well as state laws and mandates.
Figure 11: JPM Green Capex Estimates and Future Opportunities
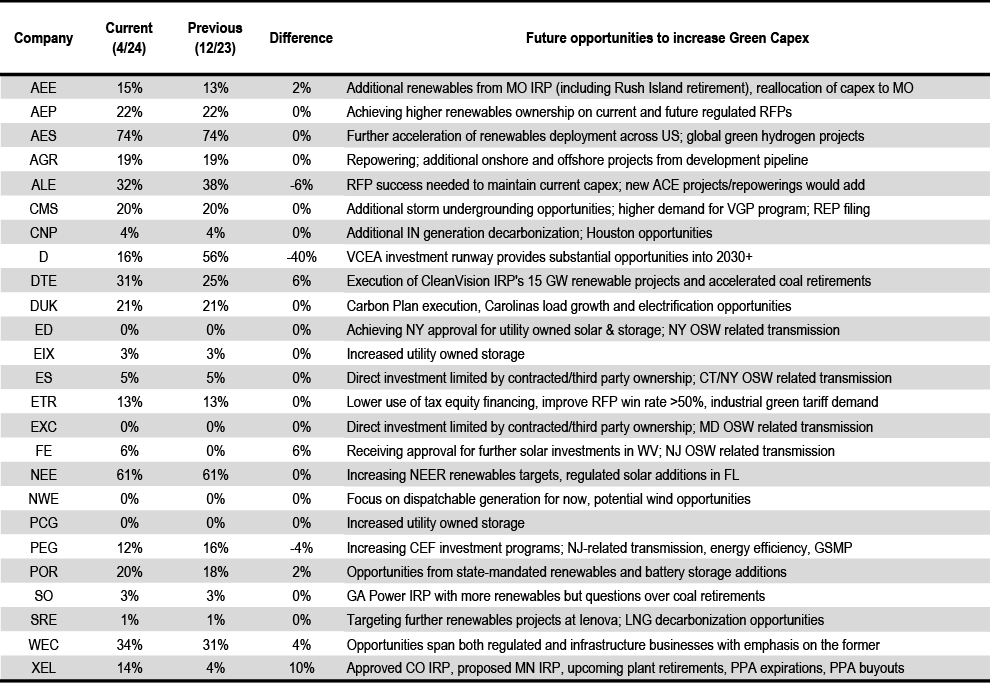
Source: North American Utilities; Electric Green Ranker 8. JPMe, company reports.
EPA Rules and Regulations
Biden EPA rules first face Trump, then the Federal Courts. We expect more aggressive EPA rules to continue to meet substantial legal and political resistance, especially in the context of growing power demand forecasts and concerns over grid resiliency. While the Trump Administration would likely undo President Biden EPA’s power plant emission and proposed EV and good neighbor rules, a second Biden term would seek to continue the status quo. President Trump appointed 28% of all judges currently on the federal bench, including 33% of the SCOTUS, giving the courts a conservative tilt overall. However, President Biden has appointed 22% of all judges currently on the federal bench. Additionally, if President Biden wins a second term and Democrats hold the Senate, we could see a continued leftward shift of the federal bench, presenting a more favorable backdrop for environmental rule making. In the interim, we also highlight the Biden Administration’s decision to delay proposing new rules on the 2,000 existing gas plants until after the 2024 election, potentially due to grid capacity concerns, opting to instead focus on drafting new rules for existing coal and new gas plants. While we do not expect regulations on new natural gas fired power plant additions (D, DUK, SO) to present a material headwind due to legal challenges and growing concerns over power needs, a second Biden term could prompt questions on the pace of further gas additions. Larger picture, given the longer term horizon of the proposed EPA rules and likely drawn-out process of their implementation, some have emphasized the makeup of the Administration and federal bench, not just over the next four but next eight and twelve years, will likely determine the ultimate outcome on emissions rules.
Figure 12: Current Percentage of Federal Judges by President
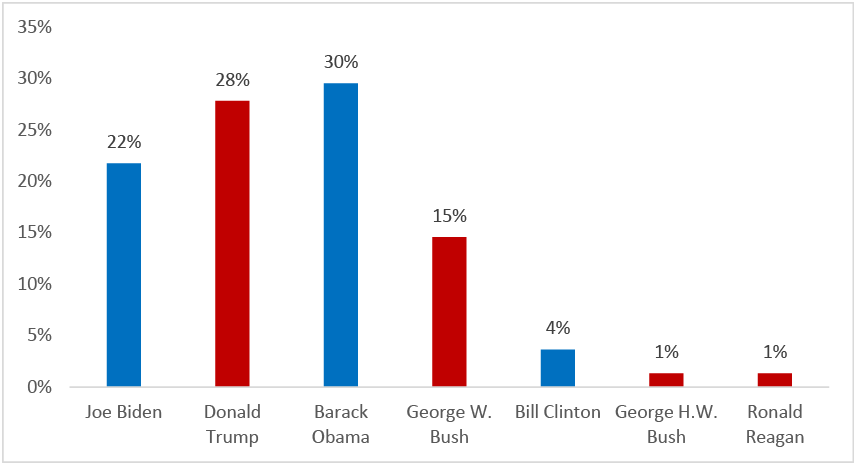
Source: Ballotpedia.
Race to exit coal will continue, regardless of EPA rules or the next President. While the federal court’s composition could possibly somewhat shield utilities with high coal exposure from the Biden Administration’s proposed EPA regulations, we still see significant C&I decarbonization pledges, ESG considerations regarding coal, and advantaged renewable economics motivating utilities to create credible generation transition plans that exit coal. As discussed in our eighth Green Ranker, coal retirements typically translate into higher renewable generation capex, and we find coal exits as a compelling mechanism for IOUs to garner favorable market attention and lower customer bills. Despite many utilities’ plans to exit coal by 2030, we note that higher-than-expected power demand growth, including from data centers, could push back some coal plant retirement timelines. We highlight utilities with high coal exposure beyond 2030 (AEP, D, DUK, and SO) as carrying the highest exposure to current and future EPA regulations. Larger picture, given continued pressure from investors, local and state governments, and market forces, we expect coal retirements to present opportunities, even during a second Trump Presidency.
Below, we break down coal ownership across our coverage, including percent of generation expected to be retired in the next five years, underutilized assets (>40% 2020 capacity factor), those expected to have zero coal generation in 2030, and those that have built new plants since 2005, using SNL power plant data.
Figure 13: JPM Coal Plant Estimates
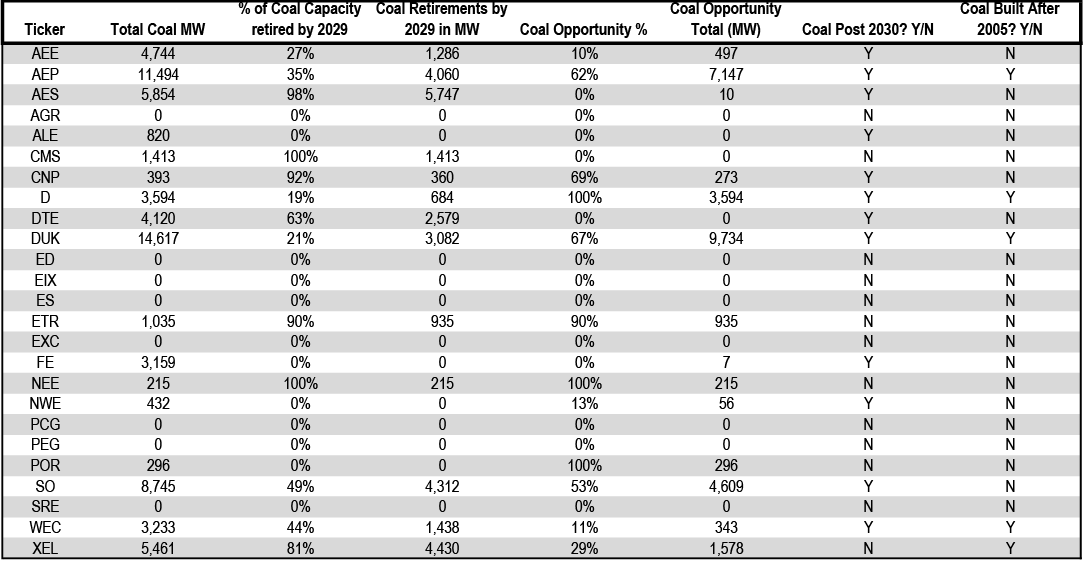
Source: J.P. Morgan estimates, S&P Global Market Intelligence.
Separately, recent/upcoming EPA rulemaking on the water side remains a capital tailwind for water IOUs (AWK, SJW) across PFAS investments and prospective lead/copper pipe rule changes.
LNG Exports & FERC Permitting
A Republican administration would likely end LNG export pause; Cheniere likely fine in any scenario. Following the White House decision in early 2024 to enact a temporary pause on pending decisions for LNG export projects, we expect the election outcome to dictate the pace of future infrastructure build-out. Currently, we see the DOE permitting pause as largely transitory in nature. We generally agree with our Commodities team’s view that a Biden re-election would likely lead to LNG export project approval resuming, though the test for LNG exporters to prove LNG benefits globally could become increasingly difficult. Our conversations with Cheniere indicate potentially increased life cycle emissions reporting requirements post review. On the flip side, our Commodities team sees a potential Trump victory not only lifting the pause, but likely even shifting to a more rapid approval speed. Regardless of the outcome, top pick Cheniere remains confident in commercializing and ultimately securing permits for future expansions despite the current pause, pointing to success in developing the existing platform after previous permitting pauses.
Continuity at FERC likely; courts ultimately dictate pipeline permitting process absent federal legislation. Our recent FERC Commissioner fireside chat covered interstate natgas pipeline permitting, highlighting a broad divergence in ideological views across commissioners. In either a Biden or Trump regime, we foresee continuity at FERC supporting the view that natural gas will remain for a long time, as well as the need for some new thermal resources. We await to see if new Commissioners would continue the view of some Commissioners that the hurdles for natgas pipelines to ascertain an EA or EIS are low, arguing the permitting process fails to fully contemplate whether a pipeline project actually improves federal infrastructure reliability. In the absence of a meaningful update to the existing permitting framework, potential exists for additional litigation targeting pipeline delays, with the courts ultimately dictating the pace of pipeline development. For the gas LDCs (ATO, NJR, NI, SR, and SWX), we instead continue to monitor state-level policy actions and sentiment, viewing the Northeast as a challenging backdrop on energy transition goals versus customer bill outlook stresses.
Tax and fiscal policy focus items across utilities and midstream; SEC ESG reporting also in focus. The TCJA individual tax cuts are currently slated to sunset in December 2025, which would leave utility customers having less cash at the end of the day, playing into the customer affordability equation. The extension of the debt ceiling could also drive a myriad of domino effects. For midstream, tax policy and the corporate tax rate impact the timing of ultimate tax payment timing, which influences appetite for M&A. Finally, SEC control will impact ESG reporting standards, with more stringent considerations under a second Biden term likely favoring greener, renewable heavier names, while a Trump Presidency would likely attempt to roll back formalizing ESG standards, favoring more traditionally carbon intensive names.
E&P
The 2020 presidential campaign had two distinct narratives for the E&P industry, with the Trump campaign being quite vocal towards US energy dominance, and the Biden campaign focusing more on green energy and energy transition. While the initial days of President Biden’s four-year term started with a bit of turbulence for the E&P companies (permitting on federal lands was a key topic in early 2021; see our published research here), Lower 48 oil production in the US has grown at a reasonable pace to 12.52 MMBo/d in 2023 (record high annual production) from 10.85 MMBo/d in 2020 (see Figure 14; though we note that 2020 oil production was impacted by the Covid-19 pandemic). We believe the growth in US oil production over the past few years has been driven by supportive commodity prices, as oil prices have averaged ~$80 per WTI bbl since early 2021 (WTI prices even reached >$120 per bbl in 1H22 after the start of the Russia-Ukraine war). Commodity prices have been well above the full-cycle breakevens for the industry. Another factor that contributed to the production growth was the increase in technological innovation by the industry, which has resulted in faster cycle times and longer laterals.
While oil production has grown significantly, we believe the policies undertaken by the federal government usually have an impact on the E&P industry over the longer term and could even have a 5-plus-year lag between the time of the enactment of the policy and the impact on production levels. Additionally, a second Trump administration could have more impact on demand, as former President Trump has expressed his vocal opposition to EVs and climate change incentives during his campaign. If a second Trump administration suppresses regulations and tax credits that support EV sales, it could ultimately result in higher fossil fuel demand/consumption. We think a second Trump presidency could resurrect the energy dominance rhetoric, while the continuance of President Biden in the Oval office would be more of a status-quo event for the industry.
- Leasing of federal lands. One of the key policies that could influence oil and gas production over the longer term would be the leasing of federal lands and waters for oil and gas development. While oil production growth in the short term is usually influenced by supply/demand dynamics, an active lease sales program could boost production over the long term.
- Offshore leases. In 2023, the Interior Department released its five-year plan for offshore oil and gas leasing and set three lease sales between 2024 and 2029. The department set a lease sale in the Outer Continental Shelf for 2025 and has scheduled the other two lease sales in 2027 and 2029. According to the American Petroleum Institute (see here), 2024 would represent the first year in ~50 years without an offshore lease sale. We think the Biden administration could continue with limited offshore lease sales going forward and possibly only lease the minimum amount required for oil and gas development (60 million acres) so that the administration can issue offshore wind power leases under the provisions of the Inflation Reduction Act. The E&P industry has generally opposed this five-year plan and has filed a legal challenge against it in the US Court of Appeals for the District of Columbia.
- Oil and gas leasing regulations. In mid-April 2024, the Interior Department announced its final rule to revise the Bureau of Land Management’s (BLM) oil and gas leasing regulations, which essentially would raise the cost for E&Ps to drill on federal lands. While E&Ps have been able to reduce their cost structure over the past few years through technological innovation and efficiency improvements on the field, the new regulations could ultimately require higher commodity prices to generate the same level of return. The department has increased the minimum lease bond amount to $150k (and statewide bond to $500k) from $10k earlier, which could discourage drilling activity from smaller oil and gas producers. Per the Interior Department, the increase in the lease bond would provide adequate incentive to companies to meet their reclamation obligations or cover the potential costs to reclaim a well if the E&P fails to meet their obligation. In addition to higher bond requirements, the department has increased the royalty rates to 16.67% until August 2032 (from 12.5% earlier). While we don’t anticipate any near-term impact to oil and gas production from this regulation, the higher cost structure could soften oil and natural gas production over the longer term. Under a potential Trump administration, we think these regulations could be revisited.
- Possible impact on capex spending due to EPA guidelines. The Inflation Reduction Act (signed into law in 2022) included provisions to reduce methane and GHG emissions from the oil and natural gas sector, particularly through the creation of the Methane Emissions Reduction Program. This program established a Waste Emissions Charge (WEC) for methane, which allows the EPA to impose and collect an annual charge on methane emissions that exceed specified waste emissions thresholds from applicable oil and gas facilities. In January 2024, the EPA proposed a WEC of ~$900 per metric ton for reported methane emissions in 2024, which would further increase to $1,200 per metric ton for 2025 emissions and $1,500 per metric ton for 2026 emissions. Additionally, the EPA announced final standards to cut emissions from oil and gas operations in December 2023 that included various requirements such as elimination of routine flaring of natural gas at new oil wells, comprehensive monitoring for methane leaks, and new standards for equipment, such as controllers, pumps, and storage tanks. Over the past few years, E&P budgets have started to include dedicated spending for various environmental/ESG-related projects. We believe these expenditures could continue to increase (or at least remain roughly flat) over the near term under the continuance of a second Biden presidency. On the other hand, we think a second Trump administration could lean more towards the oil and gas industry and could even attempt to scrap or reduce the impact of these regulations. Under such a scenario, E&P spending on ESG-related projects could decline, although we still expect E&Ps to maintain their focus on ESG irrespective of the outcome of the election.
- SEC rules on climate-related disclosures. The SEC recently adopted a mandatory requirement for corporations to disclose various climate-related risks in their periodic filings. Based on the SEC’s final rules, corporations have to provide disclosures about climate-related risks that are reasonably likely to have a material impact on the company’s business strategy, results of operations, or financial condition. In addition, larger companies would also be required to disclose information about GHG emissions (subject to a phased-in assurance requirement). Due to pending legal challenges, we note that the SEC has stayed these rules at the current time. While many companies already provide these disclosures in their annual filings, we believe a mandatory requirement could substantially increase compliance costs for smaller companies (which would potentially outweigh the financial benefits from the mandatory disclosures). The SEC had first proposed these rules in 2022 and received ~24k comments on the rule (maximum comments ever received for an SEC rule). While the SEC is an independent agency, we note that many appointments of the agency are influenced by the President.
- Stance on ‘Energy Week’ bills could be a small preview. In March 2024, the House of Representatives authored two pieces of legislation (led by Republicans) to support oil and gas development in the US. The first bill would prevent any administration from unilaterally banning hydraulic fracturing without Congressional authorization, while the second bill intends to nullify Bureau of Land Management (BLM) rules that would restrict oil and gas production on federal lands. While we assign a low probability for these bills to become law under the current administration (due to a Democratic led Senate and approval required by the White House), we believe these bills could be a priority under a Republican sweep.
- Corporate taxes. Former President Trump introduced the TCJA tax cuts in 2017, which reduced the corporate tax rate. This resulted in a significant +10% S&P earnings revision in the space of two months in late 2017. Since these tax cuts are set to expire at the end of 2025 (and their extension could require a GOP sweep), we think there could be potential earnings headwind from 2026, as corporate taxes revert to 35% (from 21%), unless the cuts are extended.
- Impact on Tax Credits from the IRA. The Inflation Reduction Act featured a comprehensive package of clean energy and industrial tax credits, with an aim to incentivize the use of technologies to manage carbon emissions. The IRA included several improvements /enhancements to the federal 45Q tax credits and increased credit incentives to capture and store carbon emissions. The US government now provides up to $85 per ton of carbon dioxide permanently stored, $60 per ton of carbon dioxide used for enhanced oil recovery (EOR) or other industrial uses, and $180 per ton of carbon dioxide that is permanently stored through direct air capture (DAC) projects. Many energy companies have undertaken long-term projects based on these tax incentives, as it helps companies to pursue nascent technologies like carbon capture and clean hydrogen. We note that it would be difficult to repeal many IRA subsidies, as it would require legislative changes.
Figure 14: L48 Crude Oil Production

Source: Wood Mackenzie.
Integrated Oils & Refining
Middle East tensions could be mostly negative for refiners should the US provoke or fail to contain escalation... With tensions still seemingly unresolved between Israel and Iran following the missile attacks on April 13th, we think continued escalation that ultimately led to lower Iranian crude supply or the closure of the Straight of Hormuz could impair availability of sour crudes to Gulf Coast refiners and result in narrower sweet-sour differentials. Further, given the consumer has shown increasing sensitivity to high price environments throughout the economy, we think higher retail gasoline prices driven by higher crude prices, in a scenario where overall supply is impacted by the conflict in Israel, could be impactful to gasoline demand and therefore to crack spreads. In her Election Watch note on March 21(see link), J.P. Morgan Chair of Global Research Joyce Chang noted that “Trump 2.0 would likely take a harder line on Iran, and there is a risk that Iran reacts differently and proves more disruptive…”, suggesting that the risk of the above scenario is perhaps greater under a Trump presidency.
…while election could also have important implications for Russia/Ukraine. The Russia/Ukraine war has had several implications for US refiners, including 1) a loss of natural gas supply from Russia into the EU, which led to a spike in European gas prices in 2022, raising break-evens for European refineries and having an impact on diesel production given a greater use of natural gas in diesel production. Additionally, EU sanctions have led to shifting supply chains around refined products, particularly diesel, with Russia becoming a larger supplier to Latin America and the US backfilling exports to Europe. The impact of the longer travel distances resulting from crude and product sanctions on Russia has put upward pressure on shipping costs. Finally, more recently, Ukraine has launched a campaign of drone attacks on Russia refineries, which has left refinery capacity offline as a result. While we think supply chains have generally adjusted for both crude and products to Russia sanctions, and offline refinery capacity should be mostly back prior to the election, any resolution to the war in Ukraine could ultimately take out some upside risk for refiners. On this front, Joyce believes that under a second Trump presidency, the probability is increased of Ukraine signing a settlement unfavorable to its own interests in order to end the war.
2022 showed Biden’s willingness to take measures to lower gasoline prices in an election year. While 2024 appears to thus far be somewhat calmer in the energy markets relative to the highly disruptive year of 2022, President Biden showed a willingness to act on behalf of influencing the commodity markets in an attempt to lower gasoline prices into an election, particularly as the market hit ~$5/gal retail gasoline. Measures taken included a release of crude barrels out of the SPR and political pressure put on refiners to add capacity. We think a revisit of the SPR release is a likely scenario into the 2024 election, particularly as gasoline prices rise seasonally in the coming months. The US drew the SPR down by ~221mm bbls over the course of 2022, or ~600kbpd on average, with an additional ~25mm bbls in the first half of 2023. A rebuild began toward the end of 2023, which has proven modest in pace compared to the release in 2022-23, with ~17.5mm bbls having been replaced to date (~95kbpd pace). With SPR levels currently at ~370mm bbls, the US could draw ~50mm bbls at a 600kbpd pace over the 12 weeks of summer, for example. This could generally help US refiners both from a perspective of sour crude availability, which was evident during the 2022-2023 SPR release, as well as reducing the risk of negative demand elasticity on higher prices in the summer. Given no inclination from refining management teams to add capacity in 2022, despite public suggestions from government officials to do so, we would be surprised to see this route taken again into the 2024 election.
Refiners a beneficiary of Trump tax cuts. As full tax payers (with some offsets around MLP and renewable fuels earnings, where applicable), refiners have been beneficiaries of the Trump corporate tax cuts in 2017, which Joyce expects to be extended under Trump 2.0, while she does not expect Trump to pursue incrementally lower rates. With the corporate rate cut from 35% to 21%, VLO, as an example, saw its effective tax rate cut from an average of ~33.5% in the 2011-2015 to ~24% from 2017-2019. We think the tax savings have largely been returned back to shareholders for refiners in the form of share buybacks.
Key RFS issue likely around SREs. While the total % obligation in the RFS was raised over time in both the Trump and Biden administrations, the administrations differed in their treatment of small refinery exemptions (SREs). We believe the RFS % obligation is unlikely to be adjusted downward under either administration, but his actions during his first presidency would suggest Trump would be far more likely to issue SREs with less scrutiny, which could ultimately put further downward pressure on RIN prices. One difference between the next presidential term and the prior two is that many refiners have started up incremental renewable diesel capacity, which serves as a partial offset to their short RIN positions from their conventional refining operations.