
Equity Strategy
The underperformance of Consumer Cyclical stocks can have legs; Implications of CESI moving negative
Autos, Luxury, Airlines and Hotels & Leisure sectors have all been softening of late. We think this continues

CESIs in all key regions have moved negative most recently… this is typically a problem for Cyclicals and Banks

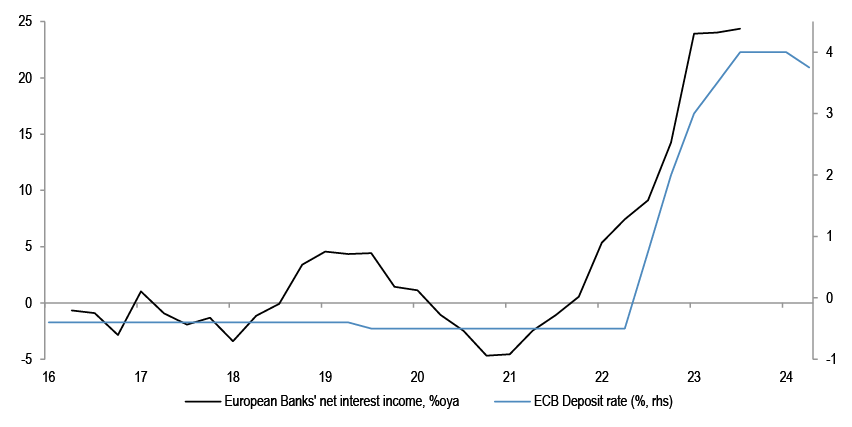
Banks profits increased on rising rates in the last 4 years, this is turning now
Source: Datastream, Bloomberg Finance L.P.
- The consensus view in the first half of the year has been to buy Cyclical sectors on PMI rebound, and also to favour consumer exposure on an improvement in real disposable incomes. While we have some sympathy with the view that European consumers could fare better this year than last, on falling inflation and on rate cuts, and clearly the Eurozone consumer wasn’t maxed out, with still elevated net wealth position, we have argued through Q2 to play a barbell of Defensives together with Mining - see report. Stylewise, we entered the year again OW Growth vs Value, same as last year, and keep that view, for now. Also, one should note the terrible performance of small caps everywhere again this year - behind by 15% in the US, 3% in Europe and 11% in Japan so far in 2024. Within this, we have very recently advised to finally turn more bullish on some selected small caps, such as FTSE250 in the UK - see report, to take advantage of the heavy prior underperformance and political changes.
- On the short side, we have specifically focused on Consumer Cyclical plays - such as Autos and Luxury, and now the question is whether one should use the recent weakness in the space to add - top chart. We think that there is likely further underperformance ahead, and stay cautious on Consumer space more broadly, on likely unwind of prior strong pricing power, building margin squeeze, likely softening final demand and potential labour market weakening:
- Autos (UW): Autos have significantly underperformed in the past few months, on weak commentary from the OEMs. Key issues being flagged are: inventories have normalised, demand is softer, prices in ICE are still holding up, but mix is weaker, and China keeps getting tougher. We stay UW Autos, expecting continued pricing weakness and rising China competition.
- Luxury (N): Luxury has also underperformed, and we think the sector will continue to struggle on softer pricing. Luxury stocks are still expensive relative to the market and our analysts see few positive catalysts for 2H.
- Discretionary Retail (UW): Retailers have seen a series a profit warnings recently, including H&M and Nike. While higher freight costs and cotton prices have been key headwinds so far, potential consumer weakness going forward is likely to lead to further disappointments.
- Hotels, Restaurants & Leisure (UW): the high-end segment is holding up, but the low-end segment is showing signs of weakness. RevPar is still robust, but could come under pressure if pricing and occupancy rates roll over.
- Airlines (UW): A combination of higher oil prices, extra capacity and more downbeat demand expectations have weighed on Airlines stocks, down 20% relative in last 3-4 months. We believe these will continue to disappoint.
- Bigger picture, CESIs have moved negative recently in a number of key regions, in US, Eurozone, China and Japan. Typically, when CESIs deteriorate, sector leadership is lower beta. Apart from Cyclicals, Financials in particular tended to consistently underperform when CESIs move lower. Banks could also be seeing peaking profits on ECB cuts - bottom chart.
The underperformance of Consumer Cyclical stocks can have legs; Implications of CESI moving negative
Figure 1: Global Composite PMI
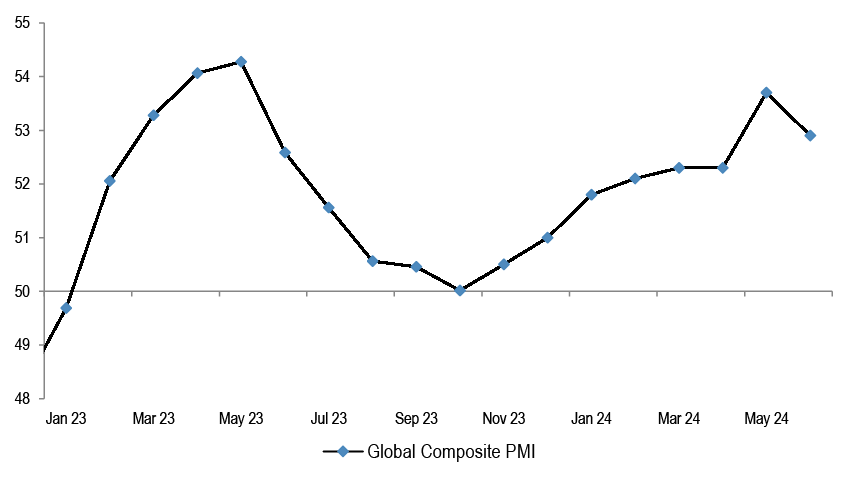
Source: S&P Global
Global growth backdrop had been improving since Q4 of last year, with Global PMIs moving up. The fall in the June reading comes after 7 months of sequential advance in the PMI data. The upmove earlier in the year has prompted many to look for a Cyclical rally and the broadening in leadership, regionally and stylewise.
Figure 2: Eurozone retail sales and consumer confidence
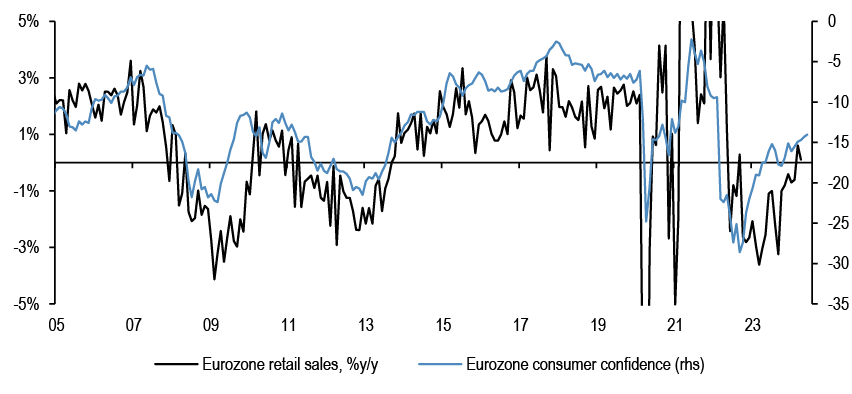
Source: Bloomberg Finance L.P.
The consensus view was also to be bullish on consumer on the likely improvement in real disposable incomes.
Figure 3: UK, Germany and France household savings rate
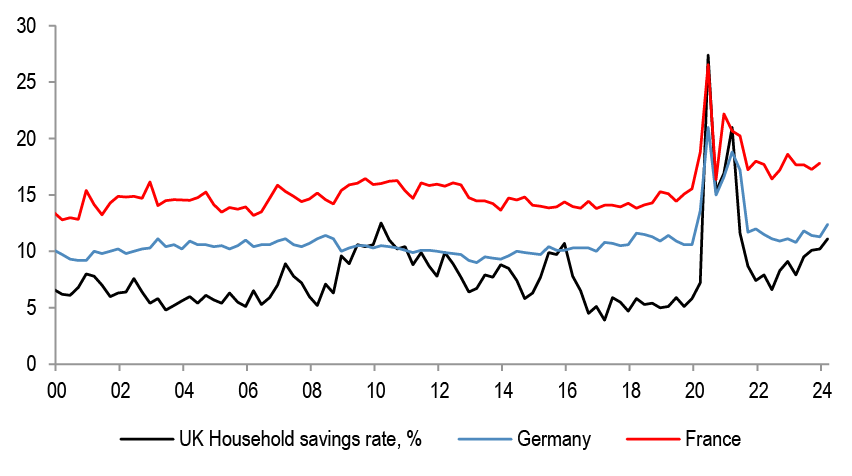
Source: Bloomberg Finance L.P.
We do have sympathy with some better European consumer performance, as that cohort has not spent much of the accumulated savings yet.
The market leadership stayed quite narrow in 1H, though...
Figure 4: S&P500 and S&P500 equal weighted ytd performance
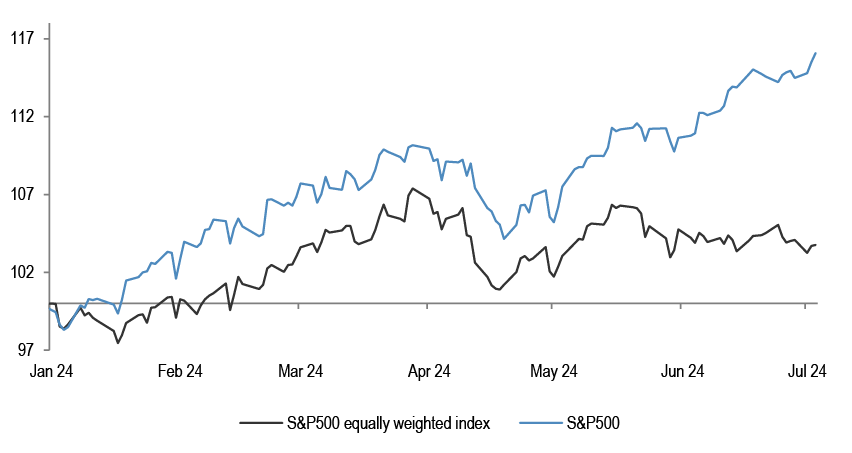
Source: Bloomberg Finance L.P.
Despite the optimism at the start of the year, equal weighted SPX has peaked already in March, with all the gains in the past few months driven by just a few stocks.
Figure 5: MSCI US and European Growth vs Value performance
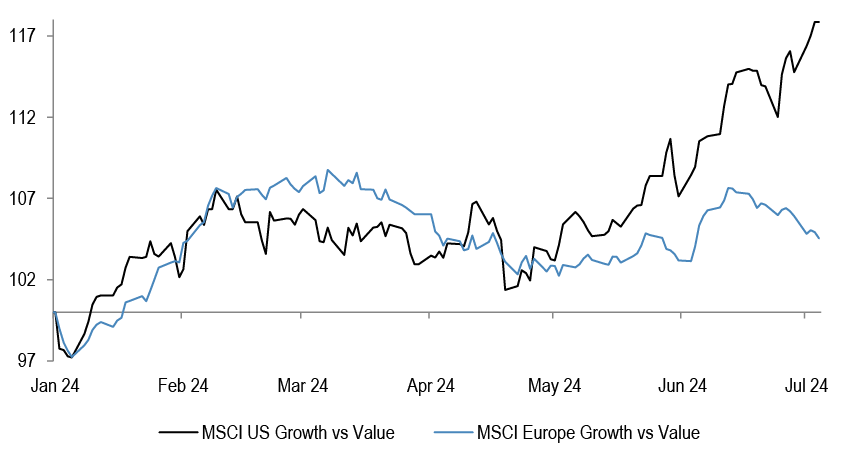
Source: Datastream
We entered this year again OW Growth vs Value style, same as in 2023, and note that Growth strongly outperformed in the US, and also in Europe.
Table 1: Key regions small vs large cap ytd performance
| YTD performance | ||
| MSCI US | Small Caps | 0.8% |
| Large Caps | 15.7% | |
| MSCI Eurozone | Small Caps | 1.9% |
| Large Caps | 8.3% | |
| MSCI UK | Small Caps | 4.0% |
| Large Caps | 6.4% | |
| MSCI Japan | Small Caps | 13.0% |
| Large Caps | 24.4% |
Source: Datastream
We have also kept UW on small caps in 1H again, after 2 years of UW of small caps. The weakness in small caps has been clear everywhere again this year, heavily behind large caps.
Figure 6: MSCI Europe sectors Q1 ‘24 and Q2 ‘24 relative performance
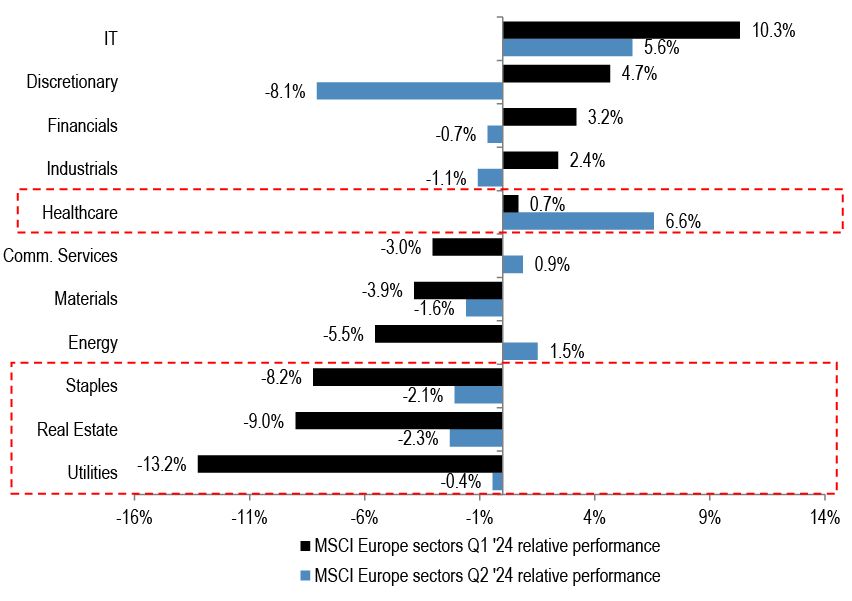
Source: Datastream
Cyclical sectors did perform better in 1Q this year, but have since struggled to lead.
...within this, we have last month advised to add to selective small caps, in particular to UK small caps - FTSE250...
Figure 7: FTSE250 relative to FTSE100
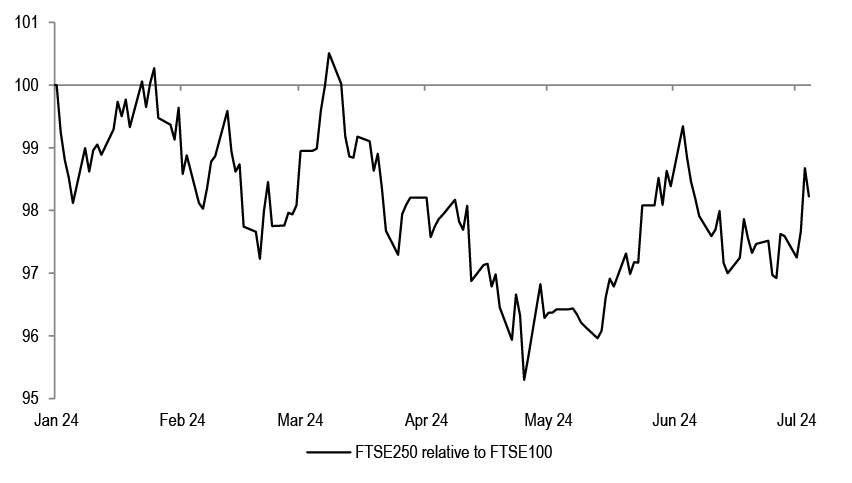
Source: Datastream
While we remain bearish on US small caps, and keep OW on Nasdaq vs Russell2000, we do think in some international markets small caps could do better in 2H.
Figure 8: FTSE100 vs FTSE250 since Jan’21
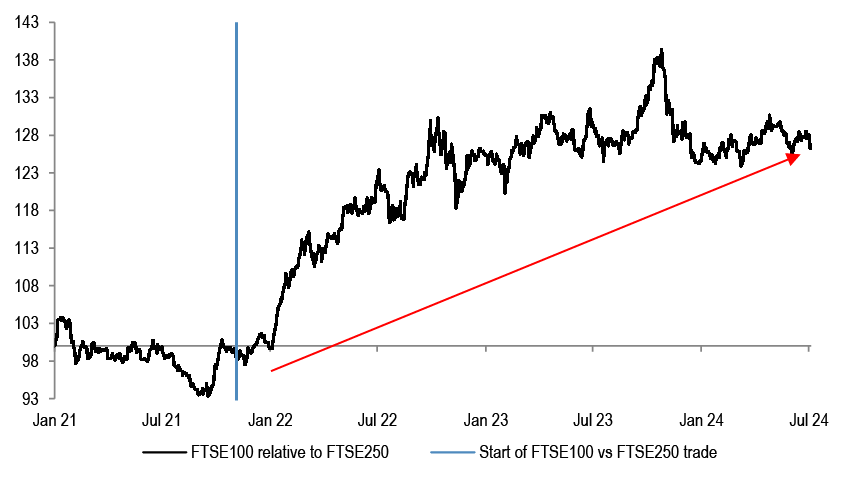
Source: Datastream
For UK in particular, we reversed our long-lasting large cap preference last month, expecting UK election outcome to help small caps from here.
Figure 9: MSCI UK Small vs large cap performance around BoE first cut
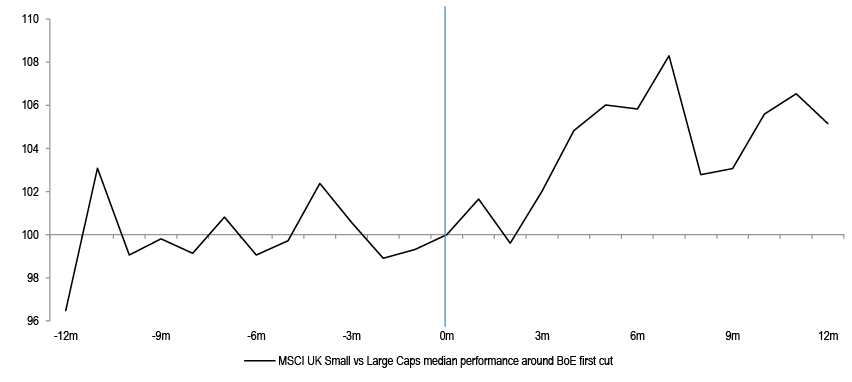
Source: Datastream
BoE is set to start easing from August, which typically helped turn the fortunes of the group.
...Consumer Cyclicals in particular struggled this year… should one use this as an opportunity to add?
Figure 10: MSCI Europe cyclical sectors ytd relative performance
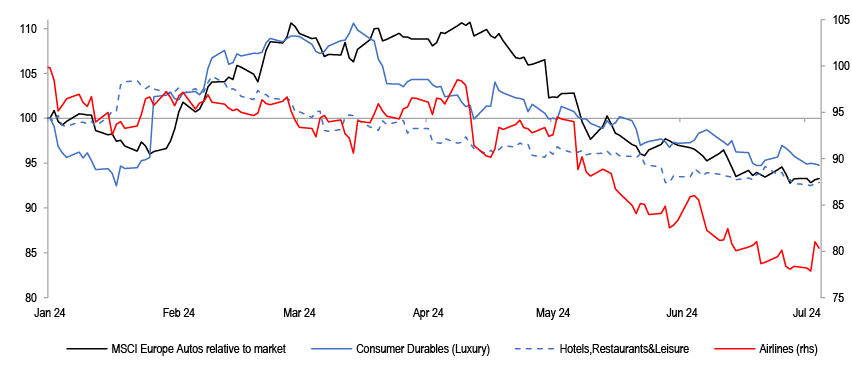
Source: Datastream
Ytd, European Autos, Airlines, Luxury, Hotels have all performed poorly. The question is whether the weakness in some of these consumer cyclical sectors presents an opportunity for investors? While we have some sympathy in the idea that the European consumer could fare better this year than last, as inflationary pressures ease and policy rates are cut, we believe that the recent underperformance of these stocks could continue, as tailwinds in the form of strong pricing power and elevated margins fade.
We do not think so, and stay UW most consumer groups - Labour market could weaken in the US...
Figure 11: US Initial Jobless Claims
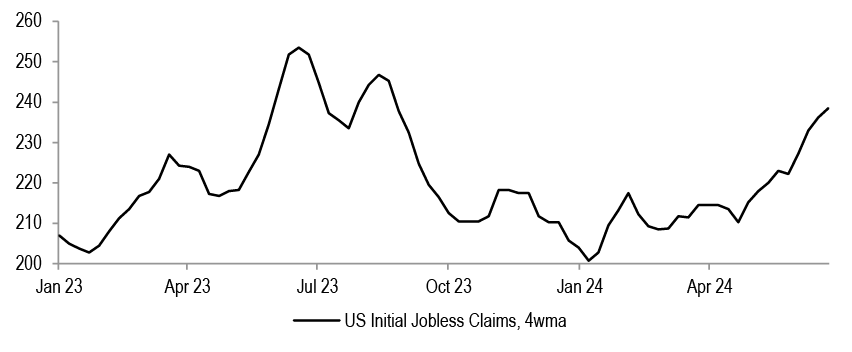
Source: Bloomberg Finance L.P.
In the US, initial jobless claims have been trending higher over the last couple of months.
Figure 12: US Continuing Jobless Claims
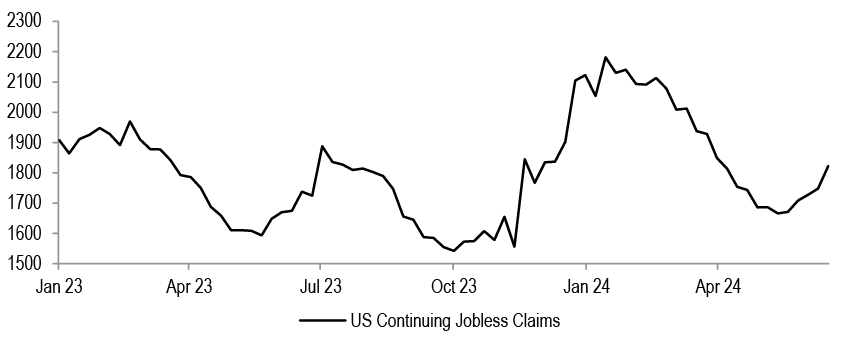
Source: Bloomberg Finance L.P.
Continuing claims have been up in each of the last 9 weeks.
Figure 13: US Quits rate vs Atlanta Fed wage tracker
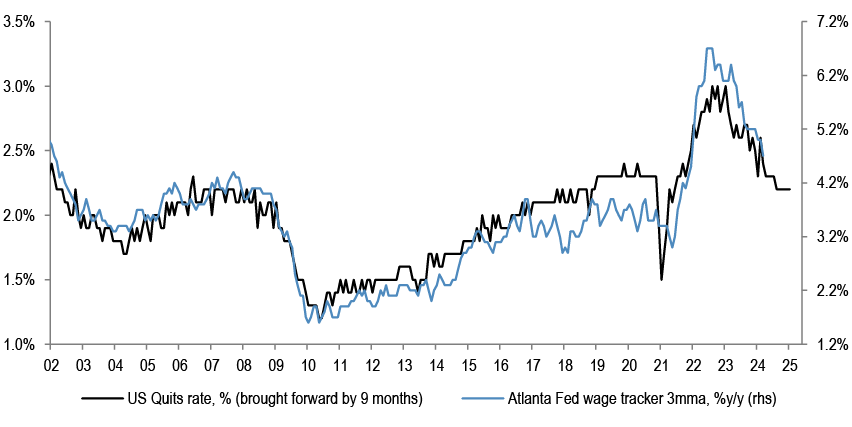
Source: Bloomberg Finance L.P.
The downshift in number of employees quitting in the US is consistent with slower pace of wage growth going forward.
Figure 14: US Manufacturing and Services ISM - Employment
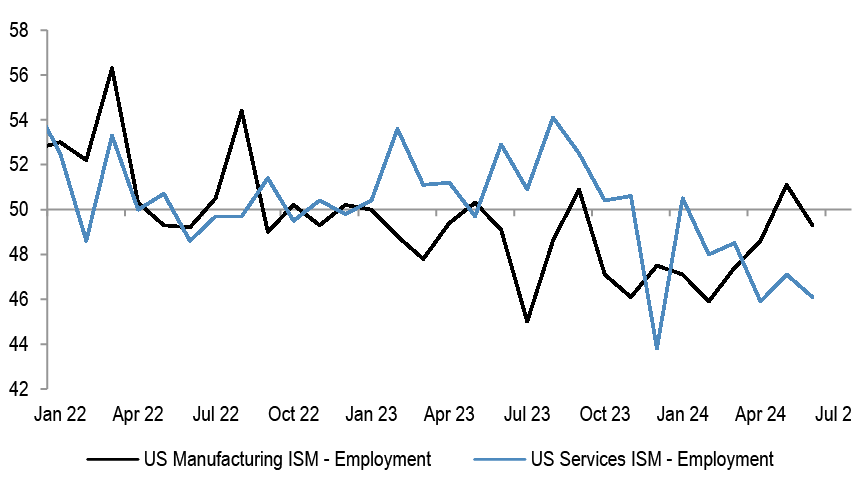
Source: Bloomberg Finance L.P.
Business surveys have also been pointing to a softening labour market. The employment component of ISM Manufacturing was holding up so far but weakened in the the month of June, and Services employment is downshifting.
Figure 15: Eurozone Manufacturing and Services PMI - employment
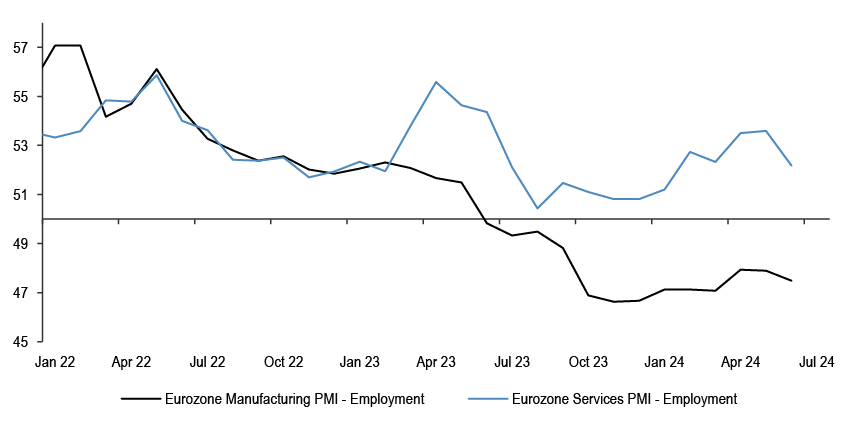
Source: S&P Global
Similar weakness is evident in the Eurozone business surveys, as well.
Weaker end demand could also hurt margins and pricing power
Figure 16: MSCI Europe Consumer Discretionary 12m trailing EBIT margin
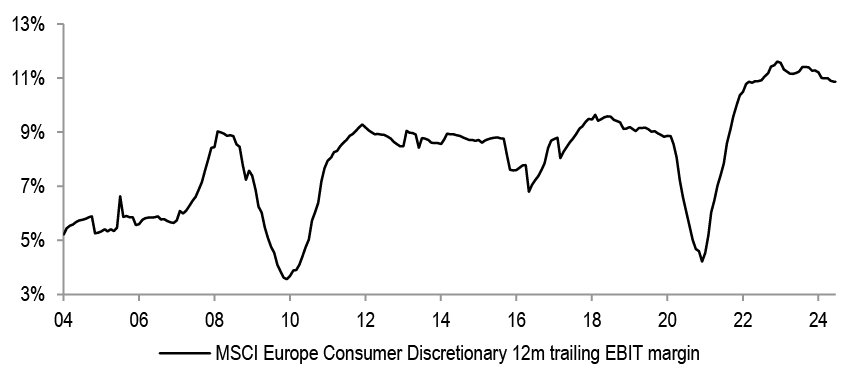
Source: Datastream
The supply-demand distortions driven by the COVID-era shutdowns drove margins for consumer sectors to record highs. These are starting to normalize.
Table 2: JPM Real GDP projections
| Real GDP | ||||||
| % over previous period, saar | ||||||
| 4Q23 | 1Q24 | 2Q24E | 3Q24E | 4Q24E | 1Q25E | |
| United States | 3.4 | 1.4 | 2.0 | 1.0 | 1.0 | 2.0 |
| Eurozone | -0.2 | 1.3 | 1.5 | 1.5 | 1.0 | 1.0 |
| United Kingdom | -1.2 | 2.9 | 2.0 | 1.0 | 1.0 | 0.8 |
| Japan | 0.4 | -1.8 | 1.5 | 1.0 | 0.8 | 0.6 |
| Emerging markets | 4.1 | 6.1 | 3.0 | 3.5 | 3.5 | 3.4 |
| Global | 2.7 | 3.2 | 2.2 | 2.2 | 2.1 | 2.3 |
Source: J.P. Morgan
Activity is expected to moderate in the coming quarters. All of these point to a more modest pricing environment for the consumer sectors.
...reiterate our cautious view on Autos...
Figure 17: MSCI Europe Autos relative
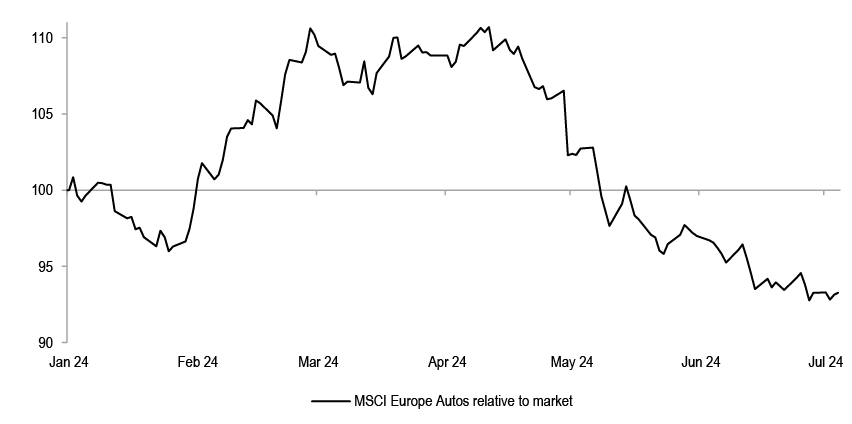
Source: Bloomberg Finance
Auto stocks have significantly underperformed over the past few months.
Figure 18: European Autos EPS/Sales
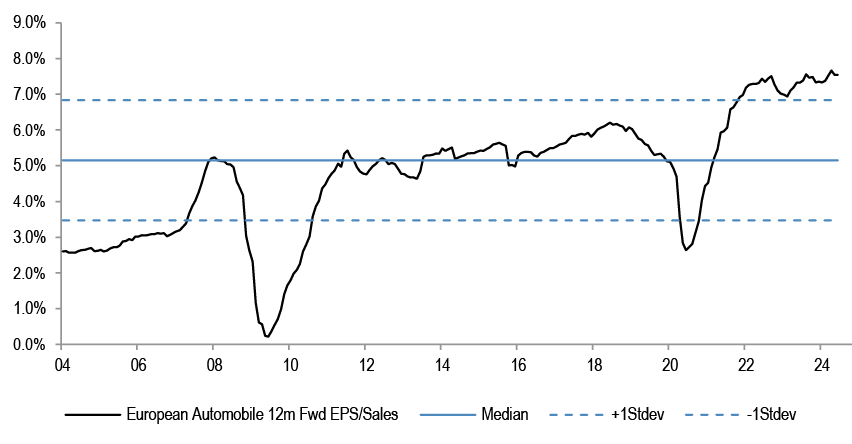
Source: Datastream
EBIT margins for the sector are still elevated in a historical context, and will be under pressure from a rollover in pricing and more Chinese competition. Inventory levels have normalized.
Figure 19: Car buying Incentives in China (%)
Source: JPM European Autos Research team
Incentives are going up.
Figure 20: Weighted average discounts across Europe
Source: JPM European Autos Research team
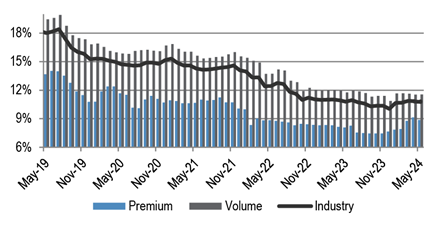
Pricing power is also coming under pressure.
...Luxury...
Figure 21: MSCI Europe Luxury price relative
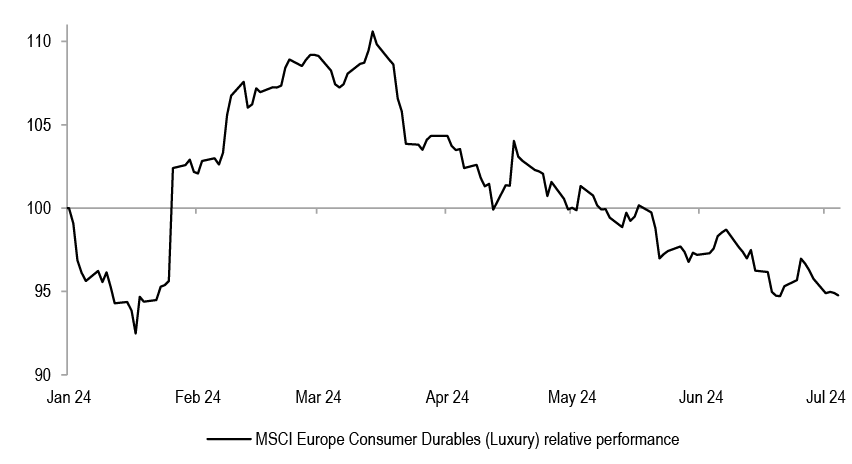
Source: Datastream
Luxury has also struggled in the past months, and we have cautioned that pricing in the sector could come under pressure - see report. Our sector analysts flag muted earnings momentum for the group, and see few positive catalysts for 2H. The key stock within the sector, LVMH, is likely to see topline soften for most segments. This, coupled with FX headwinds, should lead to EBIT margin pressure - see report.
Figure 22: European Luxury 12m Fwd P/E relative
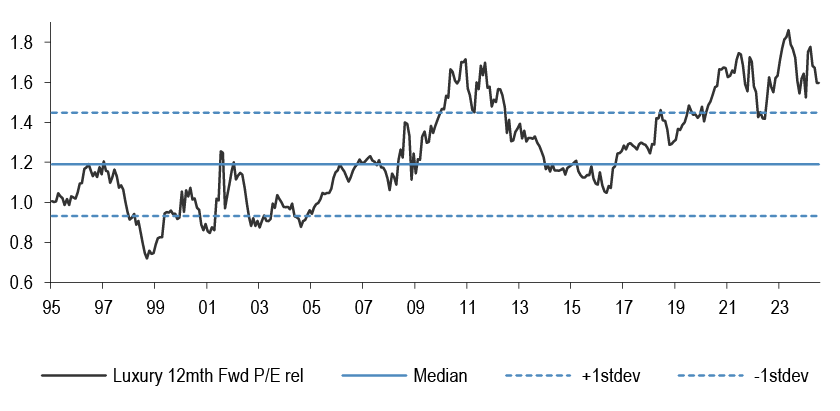
Source: IBES
Luxury stocks still trade outright expensive relative to the market.
...Retail...
Table 3: Profit warnings so far
| Company Name | Company Ticker | Commentary | Date | 1Day Perf relative to market, % | Sector |
| YOUGOV PLC | YOU LN | YouGov shares plunge after polling and data analytics group warned that annual profits would fall short of forecasts | 20 Jun | -47.2% | Communication Services |
| SIG PLC | SHI LN | SIG profit warns due to challenging market conditions | 24 Jun | -5.8% | Industrials |
| AIRBUS SE | AIR FP | Airbus shares fall as plane maker cuts profit forecast as its supply chain disruptions worsened | 25 Jun | -9.2% | Industrials |
| POOL CORP | POOL US | Pool shares slump after swimming pool supplies distributor slashes earnings forecast citing challenges in discretionary parts of its business amid cautious consumer spending | 25 Jun | -8.4% | Consumer Discretionary |
| SOUTHWEST AIRLINES CO | LUV US | Southwest Air cuts revenue outlook as CEO fends off activist | 26 Jun | -0.4% | Industrials |
| WALGREENS BOOTS ALLIANCE INC | WBA US | Walgreens shares plunge on outlook cut and more stores closings in continued challenging environment | 27 Jun | -22.2% | Consumer Staples |
| HENNES & MAURITZ AB-B SHS | HMB SS | H&M profit warns due to a challenging macro environment that will influence purchasing costs and sales revenues | 27 Jun | -12.5% | Consumer Discretionary |
| NIKE INC -CL B | NKE US | Nike tumbles after warning that it expects sales to drop 10% during its current quarter | 28 Jun | -19.6% | Consumer Discretionary |
| AIR FRANCE-KLM | AF FP | Air France expects revenue and profit hit as fliers avoid Paris Olympics | 01 Jul | -1.9% | Industrials |
| NANOCO GROUP PLC | NANO LN | Nanoco Group profit warns because of order delay | 02 Jul | -24.3% | Information Technology |
| NORWEGIAN AIR SHUTTLE AS | NAS NO | Norwegian Air shares slide after the carrier cut its EBIT outlook, citing higher costs, softer traffic demand and aircraft delivery delays from Boeing. | 04 Jul | -16.5% | Industrials |
Source: Bloomberg Finance L.P.
A number of retailers have profit warned in recent weeks.
Figure 23: World Container prices
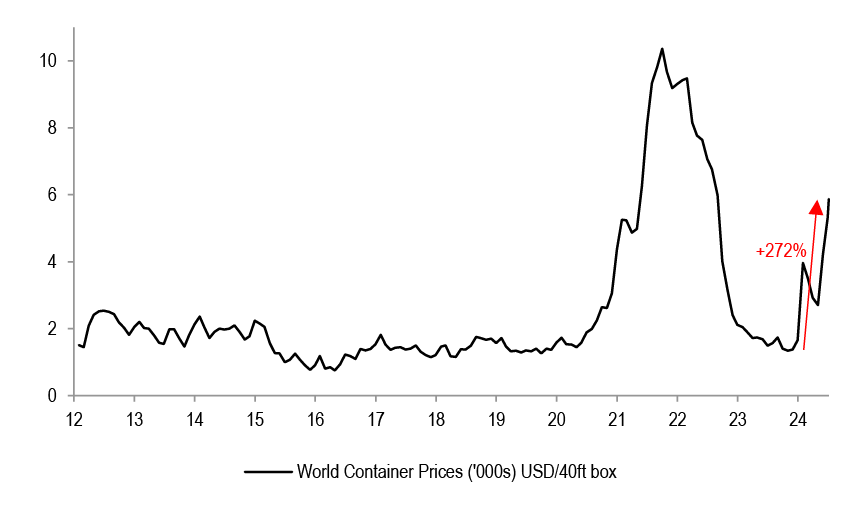
Source: Bloomberg Finance L.P.
Elevated freight rates have been hurting the sector.
Figure 24: DXY ytd
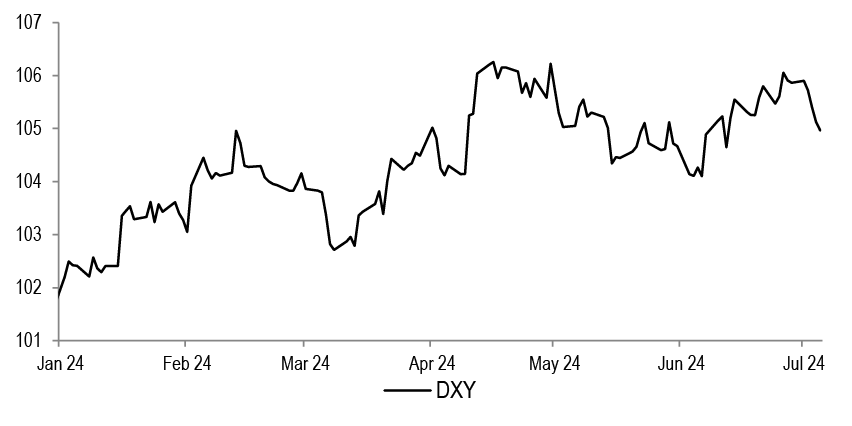
Source: Bloomberg Finance L.P.
The sector also struggles in a stronger dollar environment.
...Hotels, Restaurants and Leisure...
Figure 25: MSCI Europe Hotels,Restaurants&Leisure relative performance
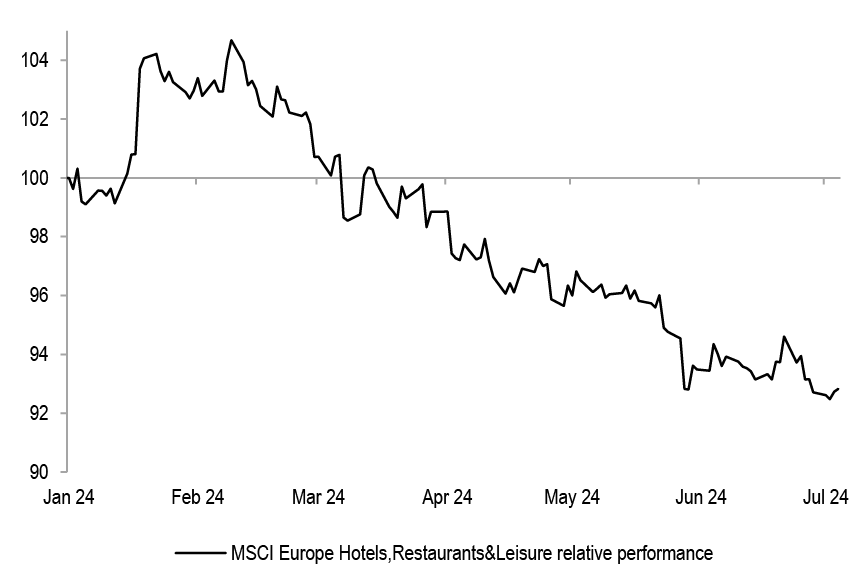
Source: Bloomberg Finance L.P.
The hotels sector has underperformed the broader index by 7% year to date.
Figure 26: Rev Par - Key Regions
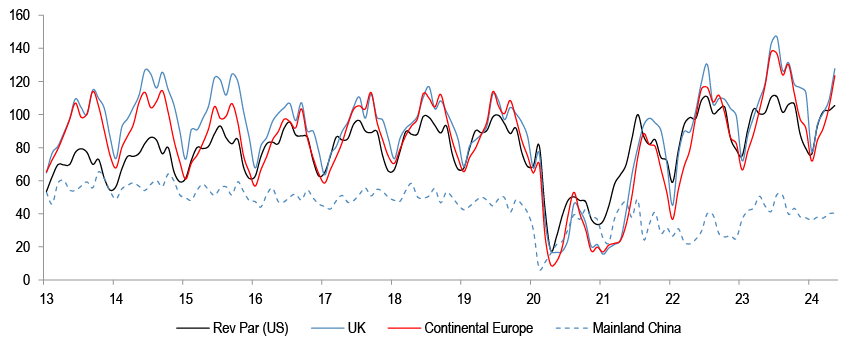
Source: J.P. Morgan European Leisure, Hotels & Gaming research
We note that metrics such as RevPar are holding up relatively well. Our sector analysts believe that this is largely due to the “high-end” segment performing better, while the low-end segment is under pressure. We believe that the sector could come under pressure if pricing and occupancy rates fall from here.
and Airlines
Figure 27: Bloomberg European Airlines relative
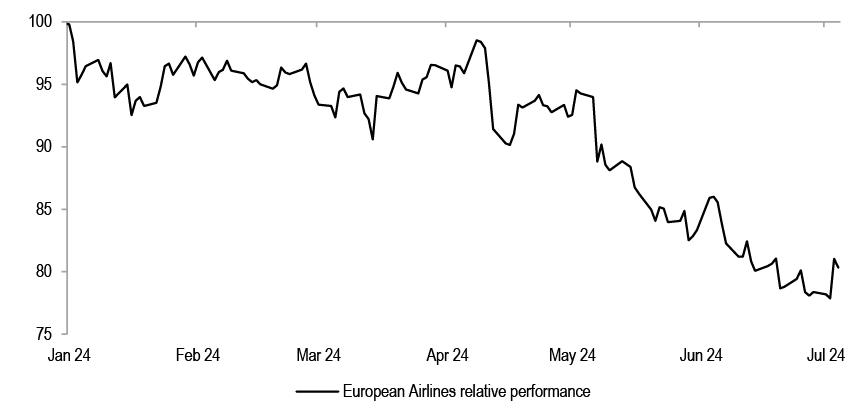
Source: Bloomberg Finance L.P.
Higher oil prices, capacity growth and weakening demand have weighed on Airlines.
Figure 28: Transatlantic capacity growth, in ASKs yoy
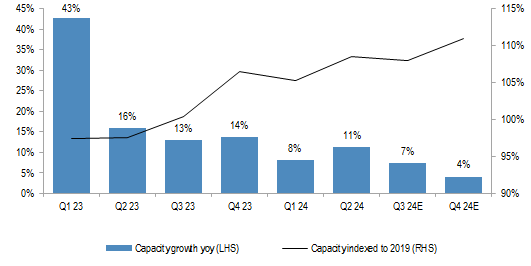
Source: J.P Morgan European Airlines Research
For the Network Carriers, pricing for Q2 could end up softer than expected on elevated capacity growth, a mixed demand backdrop by long-haul route/cabin, and any impact from LCC discounting/short-haul leisure weakness. Softer pricing in Q2 would come at a time when costs remain elevated for the Networks, and may call into question whether peak summer leisure demand will be strong enough to grow pricing in Q3 - see report from our Airlines analyst.
Recent commentary from the LCCs (low cost carriers) has also focused on a more mixed pricing outlook for short-haul leisure.
Economic surprise indices have turned negative in a number of key regions
Figure 29: Key regions CESIs
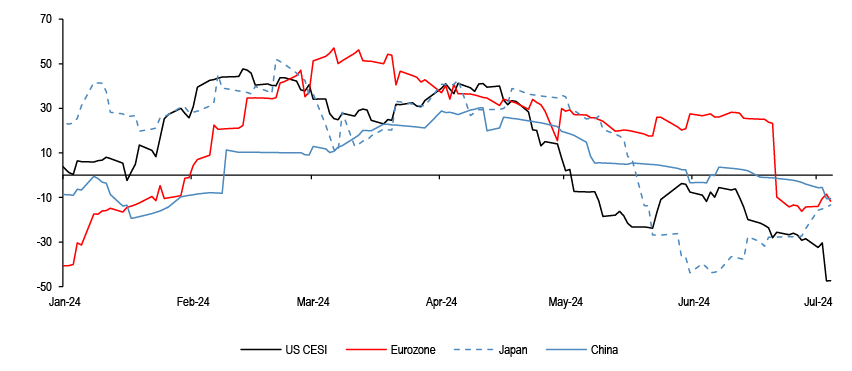
Source: Bloomberg Finance L.P.
Big picture, CESIs have turned negative in most key regions.
Table 4: MSCI Europe sectors relative performance when Euro Area CESI goes below 0 and stays negative for 2 months
| Median | 1m | 3m | 6m | 12m | |
| European Sectors relative | Energy | 0.9% | 3.0% | 5.8% | 1.3% |
| Materials | -1.0% | 0.5% | 1.5% | 1.9% | |
| Industrials | 0.5% | 0.4% | 2.0% | 4.3% | |
| Discretionary | 0.3% | 0.4% | -0.4% | 3.1% | |
| Autos | -1.4% | 0.4% | 0.9% | 6.0% | |
| Consumer Durables | 0.1% | 0.4% | 1.9% | 3.9% | |
| Retailing | -1.2% | 1.2% | -0.2% | 4.2% | |
| Hotels,Restaurants&Leisure | 0.6% | 0.9% | 0.1% | 1.8% | |
| Staples | 0.8% | 0.0% | -0.8% | 1.4% | |
| Healthcare | 1.0% | 1.9% | 0.0% | 1.8% | |
| Financials | -1.9% | -3.0% | -0.2% | -0.3% | |
| Banks | -1.0% | -2.4% | -1.0% | -3.3% | |
| IT | 1.6% | 2.1% | 0.8% | 4.3% | |
| Telecoms | -1.3% | -3.6% | -2.8% | -6.5% | |
| Utilities | 0.3% | 1.1% | 1.3% | -0.1% | |
| Real Estate | 0.9% | -1.2% | -1.0% | -9.8% | |
| Cyclicals Ex Tech vs Defensives | -0.5% | -0.6% | 0.8% | 3.6% |
Source: Datastream, Bloomberg Finance L.P.
This tended to be a problem for Cyclical sectors, and also for Banks.
Table 5: MSCI Europe sectors relative performance when US CESI goes below 0 and stays negative for 2 months
| Median | 1m | 3m | 6m | 12m | |
| European Sectors relative | Energy | -0.5% | 2.0% | 3.5% | -0.6% |
| Materials | -1.9% | -0.3% | 2.5% | 1.1% | |
| Industrials | 0.9% | 1.3% | 0.7% | 2.5% | |
| Discretionary | 0.2% | 0.5% | -1.3% | 2.3% | |
| Autos | 0.4% | 0.9% | -0.9% | 0.2% | |
| Consumer Durables | 0.6% | -0.1% | 4.4% | 9.5% | |
| Retailing | 0.4% | 1.1% | 2.1% | 1.1% | |
| Hotels,Restaurants&Leisure | -0.2% | -1.3% | 0.8% | -0.8% | |
| Staples | 0.8% | 0.9% | 0.1% | 4.5% | |
| Healthcare | 0.9% | -0.4% | 1.3% | 1.3% | |
| Financials | -0.1% | -0.1% | -1.3% | -2.6% | |
| Banks | -0.1% | -0.6% | -3.4% | -8.3% | |
| IT | 0.4% | 0.7% | 0.7% | 2.1% | |
| Telecoms | 1.0% | 0.1% | -1.2% | -2.2% | |
| Utilities | 0.0% | -0.4% | 2.5% | 2.9% | |
| Real Estate | 0.4% | -1.1% | -4.0% | -6.3% | |
| Cyclicals Ex Tech vs Defensives | -0.9% | -1.3% | -0.1% | 0.7% |
Source: Datastream, Bloomberg Finance L.P.
A similar trend is seen when US CESI turns negative, as well.
Figure 30: Banks Net interest income and ECB deposit rate
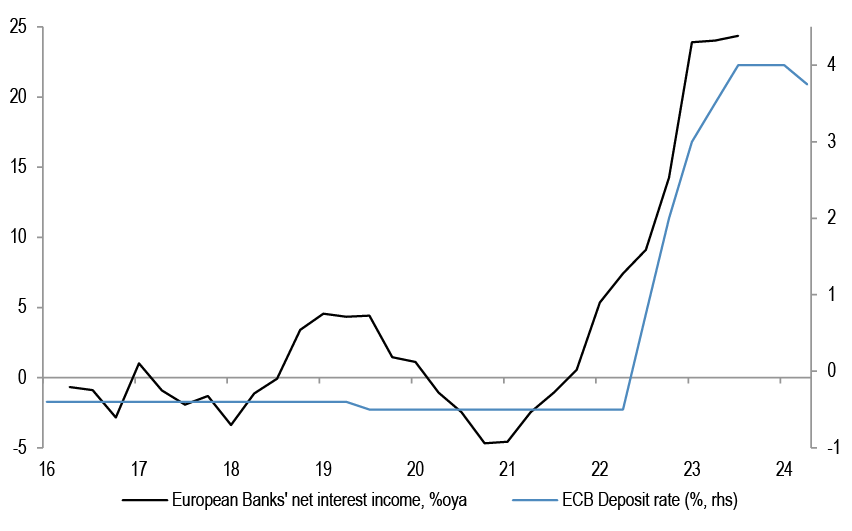
Source: J.P.Morgan
Now, Banks do look attractively priced, but they might end up cheap on peak earnings. Their earnings power is likely to move lower as rates come off.
Equity Strategy Key Calls and Drivers
SPW, an equal-weighted S&P500 index, has stalled since March, and is behind SPX so far this year by more than 10%. We think this is reflecting a changing Growth-Policy narrative vs early 2024. Entering this year, investor expectations were for a Goldilocks outcome – growth acceleration and at the same time quick Fed easing, starting already in March. The early Fed cuts and the consequent improving credit impulse didn’t materialize, which should weigh on growth in 2H. US activity momentum is slowing, with CESI outright negative at present, putting EPS growth projections of as much as 15% acceleration between Q1 and Q4 of this year at risk. Instead of easing preemptively for market-friendly reasons, such as falling inflation, as was the view at the start of the year, the Fed could end up easing, but reactively, in a response to weakening growth. At the same time, there is no safety net any more, the market is positioned long, Vix is at lows, potentially underpricing risks and credit spreads are extremely tight – this is as good as it gets. Adding to the picture strengthening USD and elevated political uncertainty currently, we arrive at a problematic setup for the equity market during summer. In terms of positioning, we have entered this year again OW Growth vs Value style and Large vs Small caps, and we are keeping these for 2H in the US, not expecting much broadening. The recent relative dip due to French political uncertainty is likely to become a buying opportunity as we move through 2H, but we think the risk of further drawdowns is not finished, as the potential new French government will likely try to test the limits of what they can do. Cyclicals were the best performing sectors in Q1, but struggled to outperform in Q2 . We reiterate our barbell of OW Defensives and Commodities.
Table 6: J.P. Morgan Equity Strategy — Factors driving our medium-term views
| Driver | Impact | Our Core Working Assumptions | Recent Developments |
| Global Growth | Neutral | At risk of weakening as consumer strength wanes | Global composite PMI is at 52.9 |
| European Growth | Positive | reset last year, manufacturing improving, consumer can pick up | |
| Monetary Policy | Neutral | Fed pivot could be accompanied by activity weakness | |
| Currency | Neutral | USD could strengthen again | |
| Earnings | Negative | Corporate pricing power is likely to weaken from here | 2024 EPS projections are continuing their downtrend |
| Valuations | Negative | At 21x, US forward P/E is still stretched, especially vs real yield | MSCI Europe on 13.7x Fwd P/E |
| Technicals | Negative | Sentiment and positioning are stretched post the rally since November | RSIs are in overbought territory |
Source: J.P. Morgan estimates
Table 7: : Base Case and Risk
| Scenario | Assumption |
| Upside scenario | No further hawkish tilt by the Fed. No landing |
| Base-case scenario | Inflation to fall further, risk of downturn still elevated. Earnings downside from here |
| Downside scenario | Further Fed tightening and global recession to become a base case again |
Source: J.P. Morgan estimates.
Table 8: Index targets
| Dec '24 Target |
04-Jul-24 | % upside | |
| MSCI Eurozone | 256 | 295 | -13% |
| FTSE 100 | 7,700 | 8,241 | -7% |
| MSCI EUROPE | 1,850 | 2,078 | -11% |
| DJ EURO STOXX 50 | 4,250 | 4,987 | -15% |
| DJ STOXX 600 E | 460 | 518 | -11% |
Source: J.P. Morgan.
Table 9: Key Global sector calls
| Overweight | Neutral | Underweight |
| Healthcare | Technology | Capital Goods ex A&D |
| Telecoms | Mining | Food& Drug Retail |
| Food, Beverage & Tobacco | Transportation | Autos |
| Real Estate | Banks | |
| Utilities | Discretionary | |
| Energy | ||
| Aerospace & Defence |
Source: J.P. Morgan
Table 10: J.P. Morgan Equity Strategy — Key sector calls*
| Sector | Recommendations | Key Drivers |
| Utilities | Overweight | Sector is low beta, has strong cash flow generation, resilient earnings, and power prices are higher than pre-Ukraine but P/E relative is near record cheap |
| Healthcare | Overweight | Potential for lower yields and stronger dollar are supports, better earnings |
| Staples | Overweight | Sector is one of the best performers around the last Fed hike in the cycle, lower bond yields and better relative EPS momentum should help |
| Banks | Underweight | 3 years of strong performance, NII likely peaking, central banks moving to cuts, underprovisioning |
| Autos | Underweight | Pricing and volume could come under pressure with rising inventories, increasing China competition and weaker demand |
| Chemicals | Underweight | The sector trades at 70% premium to the market, well above historical norm. pricing continues to deteriorate, downside risks to current earnings and margin projections |
Source: J.P. Morgan estimates. * Please see the last page for the full list of our calls and sector allocation.
Table 11: J.P. Morgan Equity Strategy — Key regional calls
| Region | Recommendations | J.P. Morgan Views |
| EM | Neutral | China tactical positive call since Q1, but structural concerns remain |
| DM | Neutral | |
| US | Neutral | Expensive with earnings risk. but our ytd Growth style OW helps |
| Japan | Overweight | Large rate differential, TSE reforms, consumer reflation, but JPY needs to show stability |
| Eurozone | Neutral | Eurozone growth differential bottoming, cheap |
| UK | Overweight | Valuations still look very attractive, low beta with the highest regional dividend yield |
Source: J.P. Morgan estimates.
Top Picks
Table 12: J.P. Morgan European Strategy: Top European picks
| Market Cap | EPS Growth | Dividend Yield | 12m Fwd P/E | Performance | |||||||||||
| Name | Ticker | Sector | Rating | Price | Currency | (€ Bn) | 23e | 24e | 25e | 24e | Current | 10Y Median | % Premium | -3m | -12m |
| ENI | ENI IM | Energy | OW | 15 | E | 48.1 | -35% | -14% | 1% | 6.3% | 6.9 | 12.5 | -45% | -5% | 8% |
| TOTALENERGIES | TTE FP | Energy | OW | 66 | E | 156.7 | -33% | -1% | 2% | 4.7% | 7.6 | 10.6 | -28% | -2% | 23% |
| SHELL | SHEL LN | Energy | OW | 34 | E | 215.8 | -23% | 1% | 2% | 3.5% | 8.8 | 11.1 | -21% | 6% | 22% |
| CRH PUBLIC LIMITED | CRH LN | Materials | OW | 73 | U$ | 46.0 | -14% | 25% | 9% | 1.8% | 13.0 | 14.9 | -13% | -13% | 34% |
| RIO TINTO | RIO LN | Materials | OW | 5359 | £ | 106.8 | -11% | 3% | -1% | 6.4% | 9.2 | 10.3 | -11% | 5% | 6% |
| NORSK HYDRO | NHY NO | Materials | OW | 68 | NK | 12.0 | -60% | 26% | 39% | 3.7% | 10.5 | 12.6 | -17% | 0% | 4% |
| ANGLO AMERICAN | AAL LN | Materials | OW | 2434 | £ | 35.4 | -51% | -14% | 19% | 3.1% | 13.8 | 9.5 | 44% | 15% | 4% |
| SCHNEIDER ELECTRIC | SU FP | Industrials | OW | 231 | E | 132.7 | 2% | 15% | 13% | 1.5% | 26.0 | 16.5 | 57% | 11% | 43% |
| ASHTEAD GROUP | AHT LN | Industrials | OW | 5220 | £ | 27.2 | 26% | - | - | 1.5% | 16.3 | 14.1 | 16% | -9% | -3% |
| RYANAIR HOLDINGS | RYA ID | Industrials | OW | 16 | E | 18.7 | - | - | - | 0.0% | 8.1 | 12.7 | -37% | -22% | -5% |
| AIRBUS | AIR FP | Industrials | OW | 136 | E | 109.0 | 10% | -13% | 34% | 1.3% | 21.0 | 18.5 | 13% | -19% | 4% |
| MTU AERO ENGINES HLDG. | MTX GR | Industrials | OW | 255 | E | 13.8 | 24% | 12% | 14% | 0.8% | 19.2 | 18.1 | 6% | 10% | 10% |
| STELLANTIS | STLAM IM | Discretionary | OW | 18 | E | 55.5 | 12% | -14% | 4% | 8.5% | 3.5 | 4.7 | -25% | -27% | 13% |
| BMW | BMW GR | Discretionary | OW | 88 | E | 56.4 | -35% | -7% | 0% | 6.8% | 5.4 | 7.6 | -29% | -23% | - |
| INDITEX | ITX SM | Discretionary | OW | 46 | E | 142.4 | 27% | - | - | 2.6% | 22.9 | 24.1 | -5% | -1% | 29% |
| ADIDAS | ADS GR | Discretionary | OW | 219 | E | 39.7 | -154% | - | 117% | 0.3% | 43.1 | 24.8 | 74% | 10% | 23% |
| RICHEMONT N | CFR SW | Discretionary | OW | 141 | SF | 85.8 | 78% | - | - | 1.7% | 20.0 | 20.8 | -4% | 2% | -6% |
| COMPASS GROUP | CPG LN | Discretionary | OW | 2161 | £ | 43.4 | 50% | 14% | 10% | 1.9% | 21.4 | 20.9 | 2% | -3% | 0% |
| COLRUYT GROUP | COLR BB | Staples | OW | 45 | E | 5.8 | -27% | - | - | 1.8% | 15.0 | 17.6 | -15% | 7% | 29% |
| ANHEUSER-BUSCH INBEV | ABI BB | Staples | OW | 56 | E | 112.2 | -5% | 9% | 13% | 1.4% | 17.0 | 19.4 | -12% | 1% | 7% |
| NOVO NORDISK 'B' | NOVOB DC | Health Care | OW | 970 | DK | 581.8 | 52% | 27% | 24% | 1.0% | 36.7 | 22.8 | 61% | 13% | 80% |
| ASTRAZENECA | AZN LN | Health Care | OW | 12106 | £ | 222.2 | 9% | 12% | 14% | 1.9% | 17.6 | 17.7 | 0% | 13% | 14% |
| SMITH & NEPHEW | SN/ LN | Health Care | OW | 1054 | £ | 11.0 | 1% | 12% | 18% | 2.8% | 13.2 | 18.4 | -28% | 9% | -12% |
| UBS GROUP | UBSG SW | Financials | OW | 27 | SF | 97.5 | -99% | 4327% | 64% | 2.3% | 17.3 | 10.4 | 67% | -4% | 50% |
| NATWEST GROUP | NWG LN | Financials | OW | 326 | £ | 32.0 | 38% | -19% | 9% | 5.2% | 7.5 | 10.0 | -25% | 16% | 35% |
| ING GROEP | INGA NA | Financials | OW | 17 | E | 54.8 | 106% | -9% | 8% | 6.7% | 8.4 | 9.0 | -7% | 6% | 32% |
| INTESA SANPAOLO | ISP IM | Financials | OW | 4 | E | 65.5 | 79% | 19% | 4% | 8.3% | 7.5 | 10.0 | -25% | 6% | 48% |
| LONDON STOCK EXCHANGE GROUP | LSEG LN | Financials | OW | 9274 | £ | 58.4 | 2% | 10% | 13% | 1.2% | 24.6 | 23.0 | 7% | -1% | 13% |
| AMUNDI (WI) | AMUN FP | Financials | OW | 64 | E | 13.2 | 4% | 8% | 7% | 6.4% | 9.7 | 12.6 | -23% | -2% | 18% |
| DASSAULT SYSTEMES | DSY FP | IT | N | 35 | E | 47.6 | 6% | 8% | 9% | 0.8% | 25.9 | 31.7 | -18% | -11% | -12% |
| ASML HOLDING | ASML NA | IT | OW | 984 | E | 397.5 | 41% | -5% | 60% | 0.6% | 40.0 | 27.3 | 47% | 9% | 47% |
| ASM INTERNATIONAL | ASM NA | IT | OW | 717 | E | 35.5 | -8% | 19% | 35% | 0.4% | 43.8 | 16.7 | 163% | 25% | 86% |
| DEUTSCHE TELEKOM | DTE GR | Telecoms | OW | 24 | E | 118.9 | -13% | 14% | 12% | 3.2% | 12.3 | 14.0 | -12% | 7% | 19% |
| BT GROUP | BT/A LN | Telecoms | OW | 139 | £ | 16.4 | 9% | - | - | 5.5% | 7.7 | 8.7 | -11% | 31% | 11% |
| RELX | REL LN | Industrials | OW | 3583 | £ | 79.4 | 12% | 8% | 9% | 1.6% | 27.9 | 19.4 | 44% | 8% | 38% |
| HELLOFRESH | HFG GR | Staples | N | 6 | E | 1.1 | -49% | -62% | 138% | 0.0% | 15.1 | 18.6 | -19% | -6% | -75% |
| RWE | RWE GR | Utilities | OW | 33 | E | 24.7 | 30% | -55% | -26% | 3.0% | 13.8 | 13.0 | 6% | 6% | -18% |
| ENEL | ENEL IM | Utilities | OW | 7 | E | 68.0 | 15% | 10% | 0% | 6.5% | 9.9 | 11.9 | -17% | 10% | 5% |
| SEGRO | SGRO LN | Real Estate | OW | 907 | £ | 14.6 | 6% | 6% | 8% | 3.1% | 25.3 | 25.3 | 0% | 3% | 23% |
Source: Datastream, MSCI, IBES, J.P. Morgan, Prices and Valuations as of COB 4th Jul, 2024. Past performance is not indicative of future returns.
Please see the most recent company-specific research published by J.P. Morgan for an analysis of valuation methodology and risks on companies recommended in this report. Research is available at http://www.jpmorganmarkets.com
Equity Flows Snapshot
Table 13: DM Equity Fund Flows Summary
| Regional equity fund flows | ||||||||||
| $mn | % AUM | |||||||||
| 1w | 1m | 3m | ytd | 12m | 1w | 1m | 3m | ytd | 12m | |
| Europe ex UK | -109 | -393 | 2,153 | 1,180 | -6,860 | 0.0% | -0.1% | 0.6% | 0.4% | -2.2% |
| UK | -857 | -3,067 | -8,580 | -12,728 | -27,899 | -0.3% | -1.1% | -3.2% | -4.6% | -10.3% |
| US | 6,348 | 27,479 | 90,128 | 114,257 | 270,631 | 0.1% | 0.3% | 0.9% | 1.2% | 3.2% |
| Japan | -557 | -9,624 | 3,919 | 12,247 | 25,473 | -0.1% | -1.2% | 0.5% | 1.6% | 3.6% |
Source: EPFR, as of 12th Jun, 2024
Figure 31: DM Equity Fund flows – last month
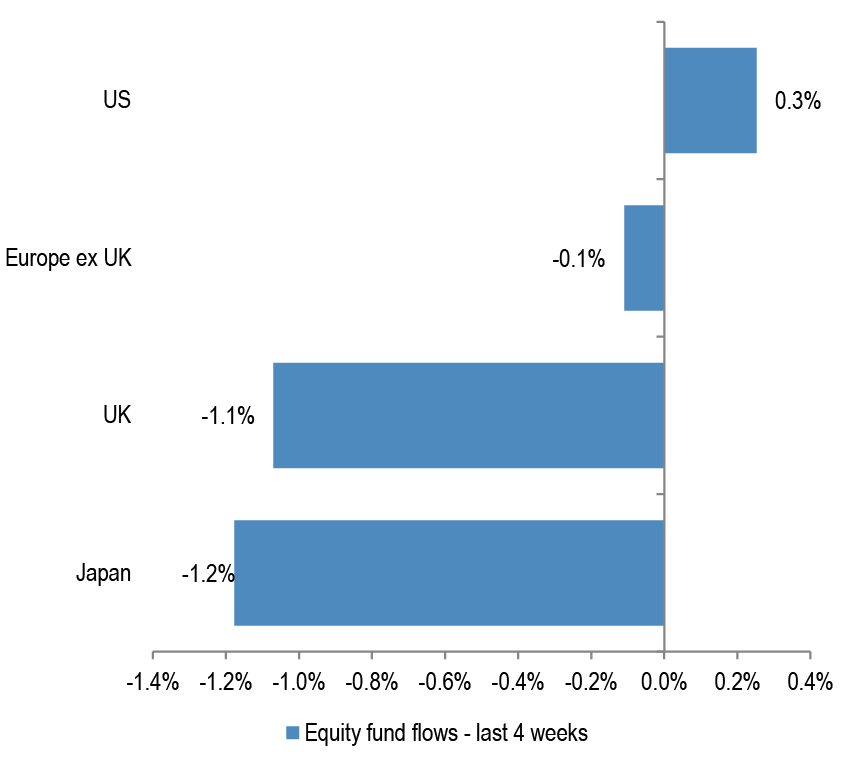
Source: EPFR, Japan includes BoJ purchases.
Figure 32: DM Equity Fund flows – last 12 months
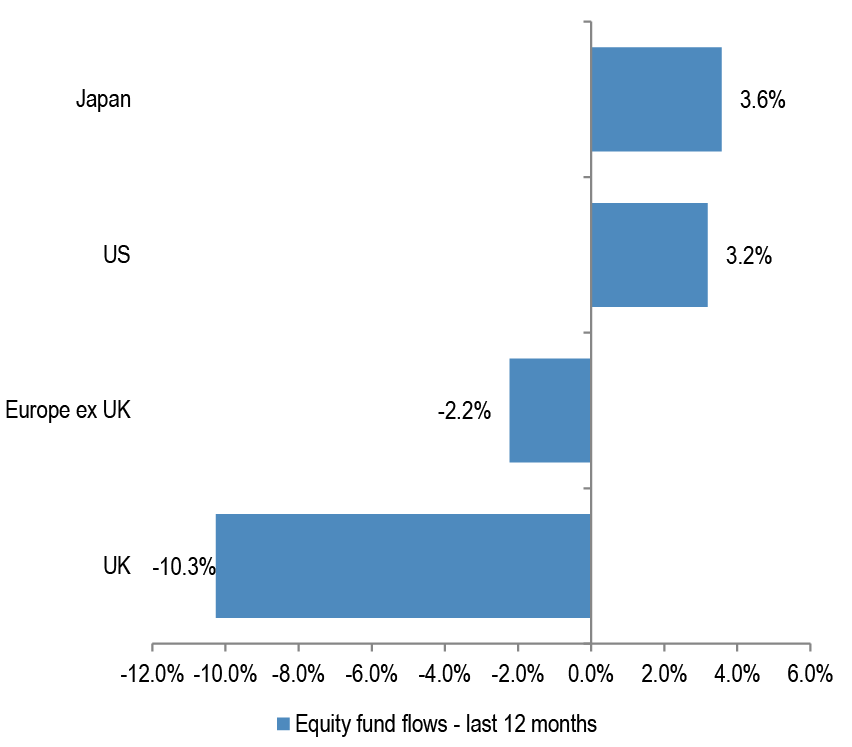
Source: EPFR, Japan includes BoJ purchases.
Figure 33: Cumulative fund flows into regional funds as a percentage of AUM
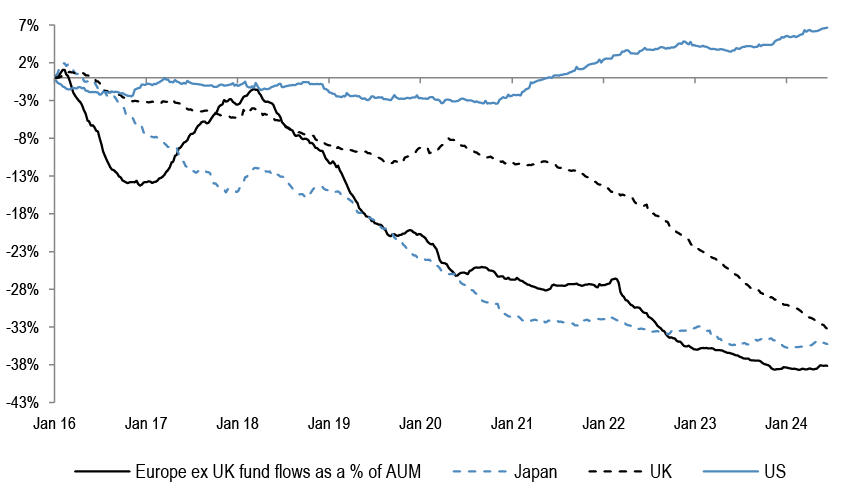
Source: EPFR, as of 12th Jun, 2024. Japan includes Non-ETF purchases only.
Figure 34: Cumulative fund flows into regional equity ETFs as a percentage of AUM
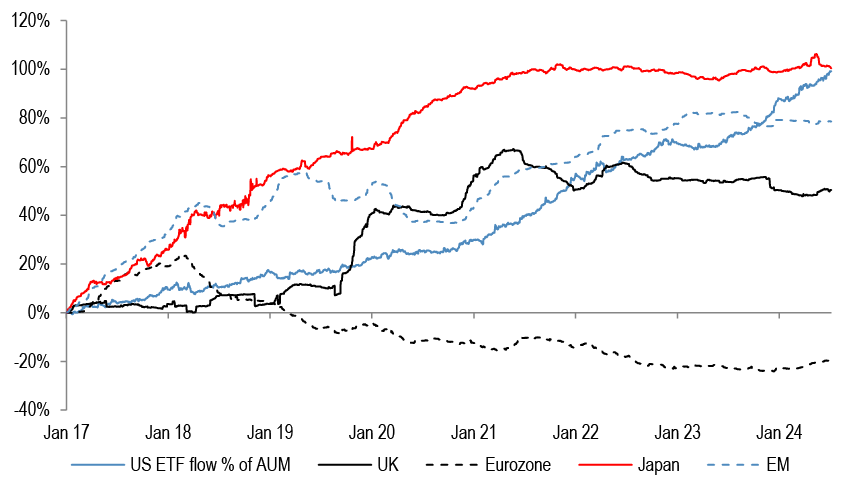
Source: Bloomberg Finance L.P. *Based on the 25 biggest ETF's with a mandate to invest in that particular region. Japan includes BoJ purchases.
Technical Indicators
Figure 35: S&P500 RSI
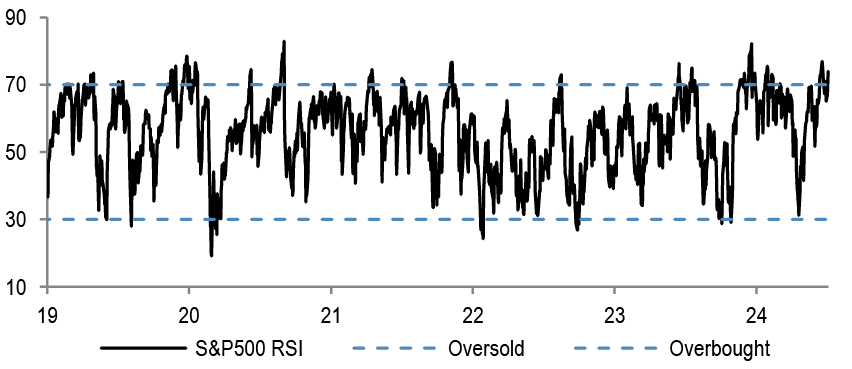
Source: Bloomberg Finance L.P.
Figure 36: EuroStoxx50 RSI
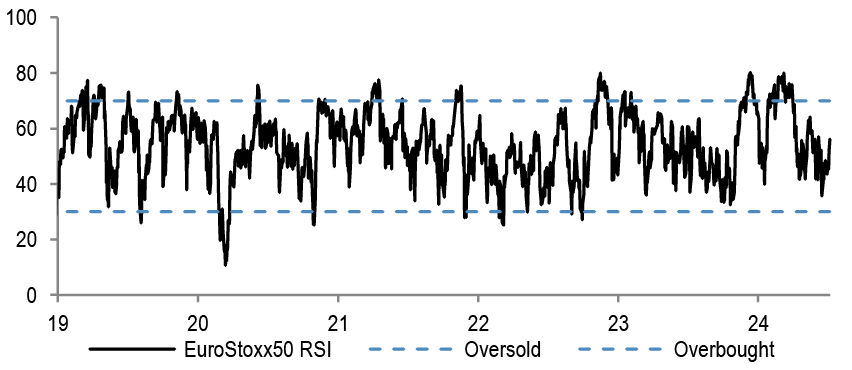
Source: Bloomberg Finance L.P.
Figure 37: AAII Bull-Bear
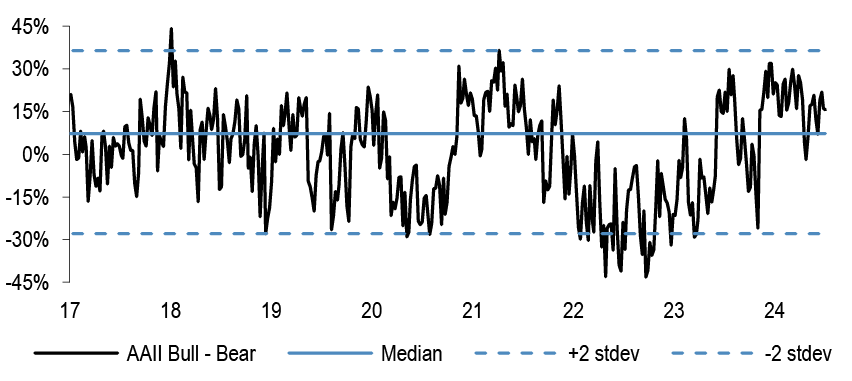
Source: Bloomberg Finance L.P
Figure 38: Put-call ratio
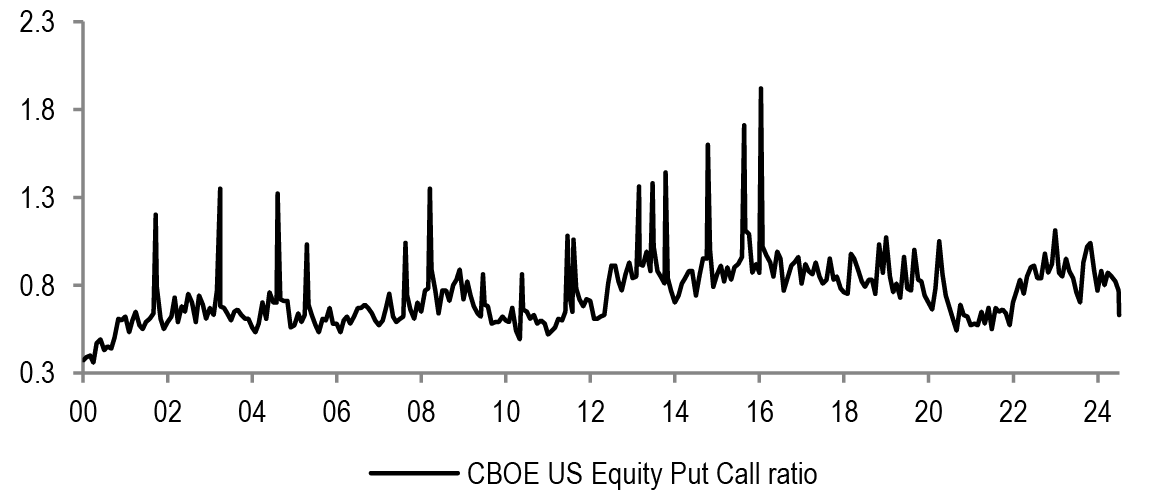
Source: Bloomberg Finance L.P.
Figure 39: Sentix Sentiment Index vs SX5E
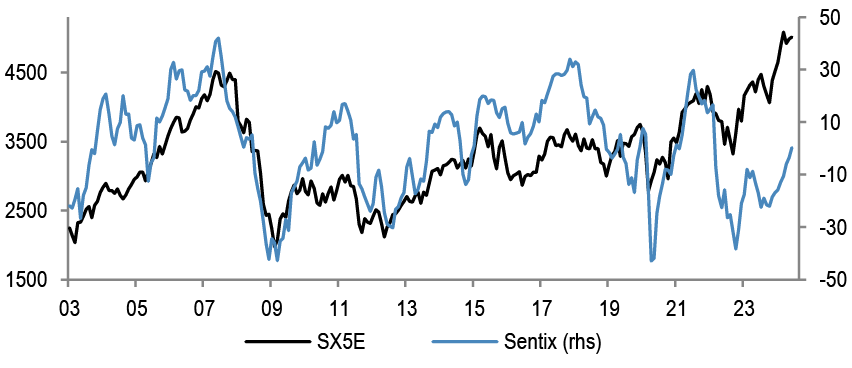
Source: Bloomberg Finance L.P.
Figure 40: Equity Skew
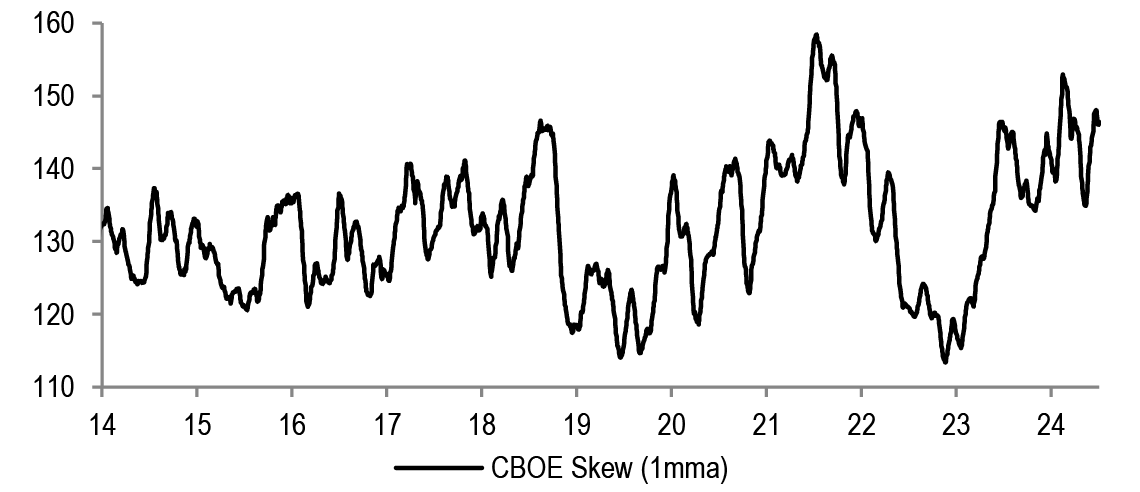
Source: Bloomberg Finance L.P.
Figure 41: Speculative positions in S&P500 futures contracts
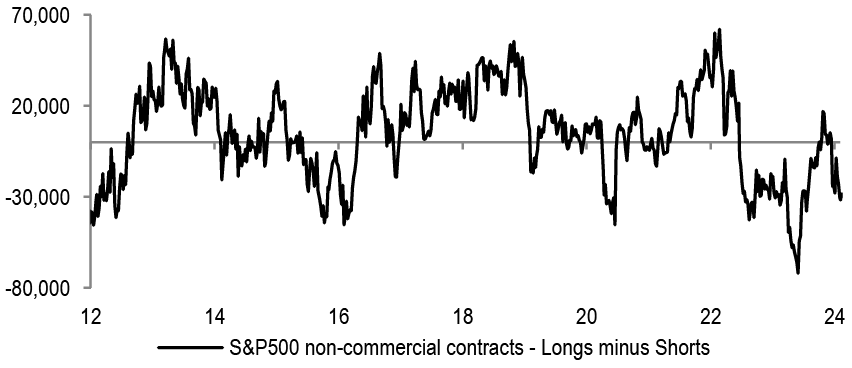
Source: Bloomberg Finance L.P.
Figure 42: VIX
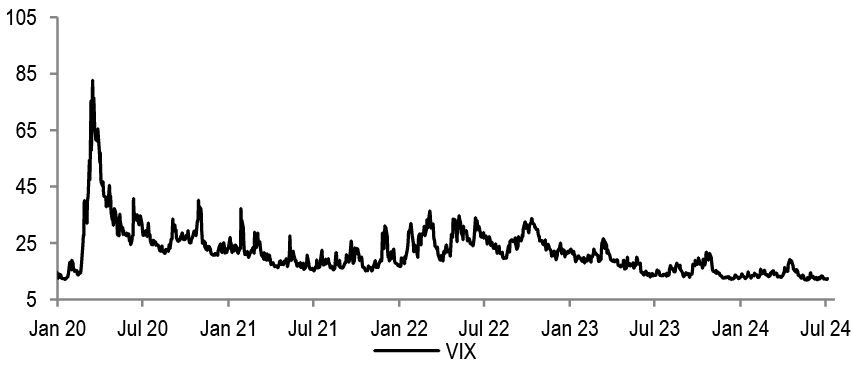
Source: Bloomberg Finance L.P.
Performance
Table 14: Sector Index Performances — MSCI Europe
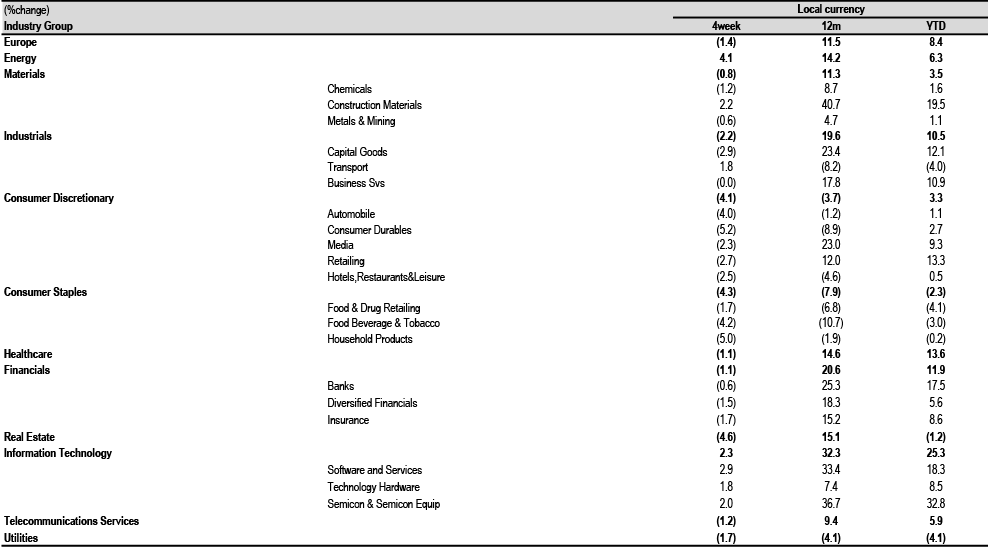
Source: MSCI, Datastream, as at COB 4th Jul, 2024.
Table 15: Country and Region Index Performances
| (%change) | Local Currency | US$ | |||||
| Country | Index | 4week | 12m | YTD | 4week | 12m | YTD |
| Austria | ATX | 1.1 | 15.8 | 8.1 | 0.4 | 14.8 | 5.7 |
| Belgium | BEL 20 | 1.0 | 11.2 | 6.7 | 0.4 | 10.2 | 4.4 |
| Denmark | KFX | (1.0) | 39.9 | 24.3 | (1.6) | 38.5 | 21.5 |
| Finland | HEX 20 | (1.1) | 0.6 | 0.1 | (1.7) | (0.3) | (2.1) |
| France | CAC 40 | (4.3) | 4.4 | 2.0 | (4.9) | 3.5 | (0.2) |
| Germany | DAX | (1.1) | 15.0 | 10.1 | (1.7) | 14.0 | 7.8 |
| Greece | ASE General | (1.2) | 10.5 | 11.0 | (1.8) | 9.5 | 8.6 |
| Ireland | ISEQ | (3.9) | 8.9 | 8.3 | (4.5) | 7.9 | 5.9 |
| Italy | FTSE MIB | (2.1) | 20.1 | 12.4 | (2.7) | 19.1 | 9.9 |
| Japan | Topix | 5.1 | 25.7 | 22.5 | 1.8 | 12.6 | 7.1 |
| Netherlands | AEX | 1.2 | 20.0 | 18.8 | 0.6 | 19.0 | 16.2 |
| Norway | OBX | (0.6) | 12.1 | 6.8 | (0.4) | 12.8 | 2.6 |
| Portugal | BVL GEN | (2.7) | (2.6) | (5.8) | (3.3) | (3.5) | (7.8) |
| Spain | IBEX 35 | (3.3) | 15.4 | 9.5 | (3.9) | 14.4 | 7.2 |
| Sweden | OMX | (1.5) | 12.0 | 7.3 | (2.2) | 15.2 | 2.9 |
| Switzerland | SMI | (1.4) | 7.6 | 8.4 | (2.3) | 7.1 | 1.3 |
| United States | S&P 500 | 3.4 | 24.3 | 16.1 | 3.4 | 24.3 | 16.1 |
| United States | NASDAQ | 5.9 | 31.6 | 21.2 | 5.9 | 31.6 | 21.2 |
| United Kingdom | FTSE 100 | (0.5) | 9.6 | 6.6 | (0.6) | 9.9 | 6.7 |
| EMU | MSCI EMU | (2.0) | 11.2 | 8.3 | (2.6) | 10.2 | 6.0 |
| Europe | MSCI Europe | (1.4) | 11.5 | 8.4 | (2.0) | 11.1 | 5.8 |
| Global | MSCI AC World | 2.5 | 21.1 | 14.2 | 2.3 | 20.1 | 12.6 |
Source: MSCI, Datastream, as at COB 4th Jul, 2024.
Earnings
Table 16: IBES Consensus EPS Sector Forecasts — MSCI Europe
| EPS Growth (%yoy) | |||||
| 2023 | 2024E | 2025E | 2026E | ||
| Europe | (3.8) | 4.3 | 10.1 | 9.1 | |
| Energy | (31.6) | (3.7) | 2.2 | 3.2 | |
| Materials | (39.0) | 7.5 | 14.3 | 8.3 | |
| Chemicals | (39.0) | 23.7 | 18.9 | 13.0 | |
| Construction Materials | 12.2 | 14.3 | 9.5 | 8.7 | |
| Metals & Mining | (46.7) | (4.6) | 10.4 | 3.8 | |
| Industrials | (0.6) | 9.0 | 13.2 | 12.0 | |
| Capital Goods | 20.4 | 12.1 | 15.0 | 11.9 | |
| Transport | (56.0) | (11.0) | (0.5) | 14.6 | |
| Business Svs | 3.2 | 7.8 | 11.4 | 10.4 | |
| Discretionary | 5.0 | 1.8 | 10.9 | 10.2 | |
| Automobile | 1.9 | (6.1) | 6.4 | 6.6 | |
| Consumer Durables | (6.0) | 1.9 | 14.7 | 13.4 | |
| Media | 1.8 | 6.1 | 9.4 | 8.3 | |
| Retailing | 40.3 | 24.3 | 14.8 | 11.4 | |
| Hotels,Restaurants&Leisure | 63.5 | 40.0 | 22.6 | 18.8 | |
| Staples | 2.4 | 2.2 | 8.7 | 7.8 | |
| Food & Drug Retailing | 3.7 | 2.4 | 10.0 | 9.3 | |
| Food Beverage & Tobacco | 2.0 | 0.7 | 8.7 | 7.7 | |
| Household Products | 2.9 | 6.2 | 8.0 | 7.4 | |
| Healthcare | 1.1 | 6.4 | 14.6 | 10.9 | |
| Financials | 15.8 | 8.3 | 7.6 | 8.8 | |
| Banks | 28.8 | 3.6 | 4.4 | 6.8 | |
| Diversified Financials | (20.2) | 19.8 | 21.3 | 19.7 | |
| Insurance | 11.4 | 14.7 | 8.1 | 7.2 | |
| Real Estate | 5.6 | 2.7 | 4.1 | 4.3 | |
| IT | 14.4 | (10.2) | 33.7 | 16.0 | |
| Software and Services | 18.5 | (5.9) | 24.1 | 16.8 | |
| Technology Hardware | (19.1) | 8.7 | 7.5 | 10.6 | |
| Semicon & Semicon Equip | 27.9 | (18.6) | 51.0 | 17.2 | |
| Telecoms | (8.5) | 9.5 | 10.6 | 10.6 | |
| Utilities | 1.9 | (0.2) | 0.4 | 3.9 | |
Source: IBES, MSCI, Datastream. As at COB 4th Jul, 2024.
Table 17: IBES Consensus EPS Country Forecasts
| EPS growth (%change) | |||||
| Country | Index | 2023 | 2024E | 2025E | 2026E |
| Austria | ATX | (23.6) | 6.7 | 4.2 | 5.1 |
| Belgium | BEL 20 | 14.4 | (5.0) | 15.5 | 12.1 |
| Denmark | Denmark KFX | (14.9) | 32.1 | 18.0 | 16.6 |
| Finland | MSCI Finland | (25.2) | 0.8 | 13.8 | 8.8 |
| France | CAC 40 | (2.4) | 0.8 | 9.4 | 8.1 |
| Germany | DAX | 0.2 | 0.8 | 12.5 | 11.0 |
| Greece | MSCI Greece | 15.1 | (6.8) | 3.4 | 10.3 |
| Ireland | MSCI Ireland | 33.8 | 0.4 | 2.9 | 6.5 |
| Italy | MSCI Italy | 8.9 | 0.4 | 3.5 | 5.0 |
| Netherlands | AEX | (2.0) | 2.1 | 12.8 | 8.8 |
| Norway | MSCI Norway | (41.3) | 5.3 | 5.2 | 1.0 |
| Portugal | MSCI Portugal | 16.9 | 17.0 | 0.4 | 7.7 |
| Spain | IBEX 35 | 8.2 | 4.9 | 4.1 | 5.9 |
| Sweden | OMX | 31.9 | 1.6 | 8.7 | 7.1 |
| Switzerland | SMI | (4.5) | 11.7 | 12.6 | 10.4 |
| United Kingdom | FTSE 100 | (10.6) | 1.1 | 8.3 | 7.9 |
| EMU | MSCI EMU | 3.0 | 3.6 | 10.6 | 9.2 |
| Europe ex UK | MSCI Europe ex UK | (0.1) | 5.3 | 10.9 | 9.5 |
| Europe | MSCI Europe | (3.8) | 4.3 | 10.1 | 9.1 |
| United States | S&P 500 | 2.5 | 10.7 | 14.6 | 12.3 |
| Japan | Topix | 18.1 | 8.0 | 10.4 | 8.6 |
| Emerging Market | MSCI EM | (6.5) | 21.6 | 15.9 | 11.0 |
| Global | MSCI AC World | 0.1 | 10.0 | 13.4 | 11.1 |
Source: IBES, MSCI, Datastream. As at COB 4th Jul, 2024** Japan refers to the period from March in the year stated to March in the following year – EPS post-goodwill
Valuations
Table 18: IBES Consensus European Sector Valuations
| P/E | Dividend Yield | EV/EBITDA | Price to Book | |||||||||
| 2024e | 2025e | 2026e | 2024e | 2025e | 2026e | 2024e | 2025e | 2026e | 2024e | 2025e | 2026e | |
| Europe | 14.4 | 13.1 | 12.0 | 3.3% | 3.5% | 3.8% | 8.2 | 7.7 | 7.1 | 2.0 | 1.8 | 1.7 |
| Energy | 8.0 | 7.8 | 7.6 | 5.3% | 5.2% | 5.4% | 3.5 | 3.4 | 3.3 | 1.2 | 1.1 | 1.1 |
| Materials | 16.1 | 14.1 | 13.0 | 3.2% | 3.5% | 3.7% | 7.7 | 6.8 | 6.5 | 1.7 | 1.6 | 1.5 |
| Chemicals | 23.9 | 20.1 | 17.8 | 2.7% | 2.9% | 3.0% | 11.7 | 10.6 | 9.6 | 2.3 | 2.2 | 2.1 |
| Construction Materials | 13.0 | 11.8 | 10.9 | 3.5% | 3.8% | 4.2% | 6.9 | 6.2 | 5.7 | 1.4 | 1.3 | 1.2 |
| Metals & Mining | 11.3 | 10.2 | 9.9 | 3.7% | 4.2% | 4.5% | 5.2 | 4.4 | 4.4 | 1.3 | 1.2 | 1.1 |
| Industrials | 20.1 | 17.7 | 15.8 | 2.3% | 2.5% | 2.8% | 10.4 | 9.4 | 8.6 | 3.4 | 3.1 | 2.9 |
| Capital Goods | 20.0 | 17.4 | 15.6 | 2.2% | 2.4% | 2.7% | 11.1 | 9.6 | 8.8 | 3.5 | 3.2 | 2.9 |
| Transport | 16.1 | 16.1 | 14.1 | 3.1% | 3.2% | 3.3% | 6.7 | 6.9 | 6.3 | 1.9 | 1.8 | 1.7 |
| Business Svs | 23.3 | 20.9 | 19.0 | 2.3% | 2.5% | 2.7% | 13.1 | 12.3 | 11.2 | 6.6 | 6.0 | 5.5 |
| Discretionary | 13.1 | 11.8 | 10.7 | 2.8% | 3.1% | 3.4% | 5.1 | 5.0 | 4.6 | 1.9 | 1.7 | 1.5 |
| Automobile | 5.9 | 5.5 | 5.2 | 5.6% | 5.9% | 6.3% | 1.8 | 1.6 | 1.7 | 0.7 | 0.6 | 0.6 |
| Consumer Durables | 23.6 | 20.6 | 18.1 | 1.8% | 2.1% | 2.3% | 13.9 | 12.6 | 11.3 | 4.0 | 3.6 | 3.3 |
| Media & Entertainment | 17.2 | 15.8 | 14.5 | 2.4% | 2.6% | 2.7% | 12.1 | 9.7 | 9.2 | 2.0 | 2.1 | 1.9 |
| Retailing | 16.2 | 14.1 | 12.6 | 2.4% | 2.5% | 2.8% | 7.1 | 10.2 | 7.5 | 3.6 | 3.1 | 2.7 |
| Hotels,Restaurants&Leisure | 23.3 | 19.0 | 16.0 | 2.0% | 2.6% | 2.9% | 12.2 | 10.4 | 9.4 | 4.5 | 4.1 | 3.6 |
| Staples | 16.9 | 15.5 | 14.4 | 3.2% | 3.4% | 3.6% | 10.7 | 10.0 | 9.2 | 2.8 | 2.7 | 2.5 |
| Food & Drug Retailing | 11.3 | 10.3 | 9.4 | 4.4% | 4.7% | 5.0% | 5.7 | 5.6 | 5.3 | 1.5 | 1.5 | 1.4 |
| Food Beverage & Tobacco | 16.5 | 15.1 | 14.1 | 3.5% | 3.7% | 4.0% | 10.5 | 9.8 | 9.0 | 2.5 | 2.4 | 2.3 |
| Household Products | 20.1 | 18.7 | 17.4 | 2.4% | 2.6% | 2.8% | 13.9 | 12.9 | 11.9 | 4.2 | 4.0 | 3.6 |
| Healthcare | 18.9 | 16.5 | 14.9 | 2.3% | 2.5% | 2.8% | 12.8 | 11.7 | 10.1 | 3.7 | 3.4 | 3.0 |
| Financials | 9.2 | 8.6 | 7.9 | 5.5% | 5.6% | 6.0% | - | - | - | 1.1 | 1.1 | 1.0 |
| Banks | 7.4 | 7.1 | 6.6 | 7.0% | 6.9% | 7.4% | - | - | - | 0.8 | 0.8 | 0.7 |
| Diversified Financials | 14.9 | 12.3 | 10.2 | 2.3% | 2.6% | 2.9% | - | - | - | 1.4 | 1.5 | 1.5 |
| Insurance | 10.7 | 9.9 | 9.2 | 5.6% | 6.0% | 6.4% | - | - | - | 1.7 | 1.6 | 1.5 |
| Real Estate | 14.6 | 14.0 | 13.4 | 4.1% | 4.3% | 4.5% | - | - | - | 0.9 | 0.8 | 0.8 |
| IT | 34.5 | 25.8 | 22.2 | 1.1% | 1.2% | 1.4% | 20.5 | 15.6 | 13.6 | 5.5 | 4.9 | 4.4 |
| Software and Services | 33.4 | 26.9 | 23.0 | 1.3% | 1.4% | 1.5% | 20.3 | 16.1 | 13.9 | 4.6 | 4.2 | 3.8 |
| Technology Hardware | 16.9 | 15.7 | 14.2 | 2.3% | 2.5% | 2.8% | 9.3 | 8.8 | 7.5 | 2.1 | 1.9 | 1.8 |
| Semicon & Semicon Equip | 42.4 | 28.1 | 24.0 | 0.7% | 0.9% | 1.0% | 26.1 | 17.6 | 15.4 | 9.6 | 8.1 | 6.8 |
| Communication Services | 14.9 | 13.4 | 12.1 | 4.3% | 4.3% | 4.6% | 6.6 | 6.2 | 5.7 | 1.5 | 1.4 | 1.4 |
| Utilities | 12.3 | 12.3 | 11.8 | 5.1% | 5.1% | 5.3% | 8.0 | 8.1 | 8.0 | 1.5 | 1.5 | 1.4 |
Source: IBES, MSCI, Datastream. As at COB 4th Jul, 2024.
Table 19: IBES Consensus P/E and 12-Month Forward Dividend Yields — Country Forecasts
| P/E | Dividend Yield | |||||
| Country | Index | 12mth Fwd | 2024E | 2025E | 2026E | 12mth Fwd |
| Austria | ATX | 8.1 | 8.2 | 7.9 | 7.4 | 5.8% |
| Denmark | Denmark KFX | 27.3 | 29.8 | 25.3 | 21.7 | 1.5% |
| Finland | MSCI Finland | 14.9 | 15.9 | 14.0 | 12.9 | 4.4% |
| France | CAC 40 | 12.6 | 13.2 | 12.1 | 11.2 | 3.5% |
| Germany | DAX | 11.9 | 12.7 | 11.3 | 10.2 | 3.4% |
| Greece | MSCI Greece | 29.4 | 30.0 | 29.0 | 26.2 | 1.9% |
| Ireland | MSCI Ireland | 10.8 | 11.0 | 10.6 | 10.0 | 3.7% |
| Italy | MSCI Italy | 9.1 | 9.2 | 8.9 | 8.5 | 5.6% |
| Netherlands | AEX | 15.9 | 16.9 | 15.0 | 13.8 | 2.4% |
| Norway | MSCI Norway | 10.3 | 10.6 | 10.1 | 10.0 | 6.4% |
| Portugal | MSCI Portugal | 14.8 | 14.9 | 14.8 | 13.8 | 3.9% |
| Spain | IBEX 35 | 10.8 | 11.0 | 10.5 | 10.0 | 4.8% |
| Sweden | OMX | 14.7 | 15.4 | 14.1 | 13.3 | 3.8% |
| Switzerland | SMI | 17.0 | 18.0 | 16.0 | 14.5 | 3.2% |
| United Kingdom | FTSE 100 | 11.4 | 11.8 | 10.9 | 10.1 | 4.0% |
| EMU | MSCI EMU | 13.0 | 13.7 | 12.4 | 11.4 | 3.5% |
| Europe ex UK | MSCI Europe ex UK | 14.5 | 15.3 | 13.8 | 12.6 | 3.3% |
| Europe | MSCI Europe | 13.7 | 14.4 | 13.1 | 12.0 | 3.5% |
| United States | S&P 500 | 21.4 | 23.1 | 20.2 | 18.0 | 1.4% |
| Japan | Topix | 15.4 | 15.8 | 14.3 | 13.2 | 2.3% |
| Emerging Market | MSCI EM | 12.3 | 13.2 | 11.6 | 10.3 | 2.9% |
| Global | MSCI AC World | 17.8 | 19.0 | 17.0 | 15.1 | 2.0% |
Source: IBES, MSCI, Datastream. As at COB 4th Jul, 2024; ** Japan refers to the period from March in the year stated to March in the following year – P/E post goodwill.
Economic, Interest Rate and Exchange Rate Outlook
Table 20: Economic Outlook in Summary
| Real GDP | Real GDP | Consumer prices | |||||||||||
| % oya | % over previous period, saar | % oya | |||||||||||
| 2023E | 2024E | 2025E | 4Q23 | 1Q24 | 2Q24E | 3Q24E | 4Q24E | 1Q25E | 4Q23 | 2Q24E | 4Q24E | 2Q25E | |
| United States | 2.5 | 2.3 | 1.7 | 3.4 | 1.4 | 2.0 | 1.0 | 1.0 | 2.0 | 3.2 | 3.3 | 3.0 | 2.4 |
| Eurozone | 0.6 | 0.8 | 1.1 | -0.2 | 1.3 | 1.5 | 1.5 | 1.0 | 1.0 | 2.7 | 2.5 | 2.5 | 2.2 |
| United Kingdom | 0.1 | 1.0 | 0.8 | -1.2 | 2.9 | 2.0 | 1.0 | 1.0 | 0.8 | 4.2 | 2.1 | 2.4 | 2.7 |
| Japan | 1.8 | -0.1 | 0.7 | 0.4 | -1.8 | 1.5 | 1.0 | 0.8 | 0.6 | 2.9 | 2.6 | 2.6 | 3.0 |
| Emerging markets | 4.2 | 4.2 | 3.6 | 4.1 | 6.1 | 3.0 | 3.5 | 3.5 | 3.4 | 3.7 | 3.5 | 3.5 | 3.2 |
| Global | 2.8 | 2.6 | 2.3 | 2.7 | 3.2 | 2.2 | 2.2 | 2.1 | 2.3 | 3.4 | 3.4 | 3.1 | 2.8 |
Source: J.P. Morgan economic research J.P. Morgan estimates, as of COB 28th Jun, 2024
Table 21: Official Rates Outlook
| Forecast for | ||||||||
| Official interest rate | Current | Last change (bp) | Forecast next change (bp) | Sep 24 | Dec 24 | Mar 25 | Jun 25 | |
| United States | Federal funds rate | 5.50 | 26 Jul 23 (+25bp) | Nov 24 (-25bp) | 5.50 | 5.25 | 5.00 | 4.75 |
| Eurozone | Depo rate | 3.75 | 6 Jun 24 (-25bp) | Sep 24 (-25bp) | 3.50 | 3.25 | 3.00 | 2.50 |
| United Kingdom | Bank Rate | 5.25 | 03 Aug 23 (+25bp) | Aug 24 (-25bp) | 5.00 | 4.75 | 4.50 | 4.25 |
| Japan | Pol rate IOER | 0.10 | 19 Mar 24 (+20bp) | 3Q24 (+15bp) | 0.25 | 0.50 | 0.50 | 0.75 |
Source: J.P. Morgan estimates, Datastream, as of COB 28th Jun, 2024
Table 22: 10-Year Government Bond Yield Forecasts
| 10 Yr Govt BY | Forecast for end of | ||||
| 5-Jul-24 | Sep 24 | Dec 24 | Mar 25 | Jun 25 | |
| US | 4.34 | 4.50 | 4.40 | 4.20 | 4.00 |
| Euro Area | 2.59 | 2.40 | 2.20 | 2.10 | 2.00 |
| United Kingdom | 4.16 | 4.10 | 3.95 | 3.85 | 3.75 |
| Japan | 1.08 | 1.20 | 1.45 | 1.45 | 1.60 |
Source: J.P. Morgan estimates, Datastream, forecasts as of COB 28th Jun, 2024
Table 23: Exchange Rate Forecasts vs. US Dollar
| Exchange rates vs US$ | Forecast for end of | ||||
| 4-Jul-24 | Oct 24 | Jan 25 | Apr 25 | Jul 25 | |
| EUR | 1.08 | 1.05 | 1.09 | 1.12 | 1.12 |
| GBP | 1.28 | 1.25 | 1.31 | 1.35 | 1.35 |
| CHF | 0.90 | 0.94 | 0.92 | 0.89 | 0.89 |
| JPY | 161 | 157 | 156 | 155 | 154 |
| DXY | 105.1 | 107.1 | 103.7 | 101.3 | 101.1 |
Source: J.P. Morgan estimates, Datastream, forecasts as of COB 28th Jun, 2024
Sector, Regional and Asset Class Allocations
Table 24: J.P. Morgan Equity Strategy — European Sector Allocation
| MSCI Europe Weights | Allocation | Deviation | Recommendation | ||
| Energy | 5.6% | 8.0% | 2.4% | OW | |
| Materials | 7.0% | 6.0% | -1.0% | N | |
| Chemicals | UW | ||||
| Construction Materials | N | ||||
| Metals & Mining | N | ||||
| Industrials | 15.8% | 14.0% | -1.8% | N | |
| Capital Goods ex Aerospace & Defence | UW | ||||
| Aerospace & Defence | OW | ||||
| Transport | N | ||||
| Business Services | N | ||||
| Consumer Discretionary | 9.1% | 7.0% | -2.1% | UW | |
| Automobile | UW | ||||
| Consumer Durables | N | ||||
| Consumer Srvcs | UW | ||||
| Speciality Retail | UW | ||||
| Internet Retail | UW | ||||
| Consumer Staples | 11.7% | 13.0% | 1.3% | OW | |
| Food & Drug Retailing | UW | ||||
| Beverages | OW | ||||
| Food & Tobacco | OW | ||||
| Household Products | OW | ||||
| Healthcare | 16.0% | 18.0% | 2.0% | OW | |
| Financials | 18.1% | 14.0% | -4.1% | UW | |
| Banks | UW | ||||
| Insurance | N | ||||
| Real Estate | 0.9% | 2.0% | 1.1% | OW | |
| Information Technology | 7.1% | 7.0% | -0.1% | N | |
| Software and Services | N | ||||
| Technology Hardware | N | ||||
| Semicon & Semicon Equip | UW | ||||
| Communication Services | 4.5% | 5.0% | 0.5% | OW | |
| Telecommunication Services | OW | ||||
| Media | N | ||||
| Utilities | 4.4% | 6.0% | 1.6% | OW | |
| 100.0% | 100.0% | 0.0% | Balanced |
Source: MSCI, Datastream, J.P. Morgan.
Table 25: J.P. Morgan Equity Strategy — Global Regional Allocation
| MSCI Weight | Allocation | Deviation | Recommendation | |
| EM | 10.0% | 10.0% | 0.0% | Neutral |
| DM | 90.0% | 90.0% | 0.0% | Neutral |
| US | 70.9% | 68.0% | -2.9% | Neutral |
| Japan | 6.2% | 8.0% | 1.8% | Overweight |
| Eurozone | 8.6% | 8.0% | -0.6% | Neutral |
| UK | 3.8% | 6.0% | 2.2% | Overweight |
| Others* | 10.5% | 10.0% | -0.5% | Neutral |
| 100.0% | 100.0% | 0.0% | Balanced |
Source: MSCI, J.P. Morgan *Other includes Denmark, Switzerland, Australia, Canada, Hong Kong SAR, Sweden, Singapore, New Zealand, Israel and Norway
Table 26: J.P. Morgan Equity Strategy — European Regional Allocation
| MSCI Weight | Allocation | Deviation | Recommendation | |
| Eurozone | 51.0% | 48.0% | -3.0% | Neutral |
| United Kingdom | 22.6% | 25.0% | 2.4% | Overweight |
| Others** | 26.5% | 27.0% | 0.5% | Overweight |
| 100.0% | 100.0% | Balanced |
Source: MSCI, J.P. Morgan **Other includes Denmark, Switzerland, Sweden and Norway
Table 27: J.P. Morgan Equity Strategy — Asset Class Allocation
| Benchmark weighting | Allocation | Deviation | Recommendation | |
| Equities | 60% | 55% | -5% | Underweight |
| Bonds | 30% | 35% | 5% | Overweight |
| Cash | 10% | 10% | 0% | Neutral |
| 100% | 100% | 0% | Balanced |
Source: MSCI, J.P. Morgan

Click here for our weekly podcast
Anamil Kochar (anamil.kochar@jpmchase.com) of J.P. Morgan India Private Limited is a co-author of this report.