
Equity Strategy
Q3 Earnings Preview - earnings downgrades have been significant
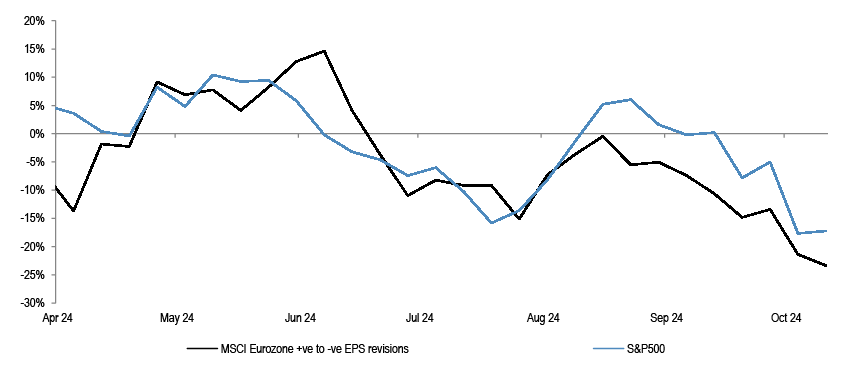
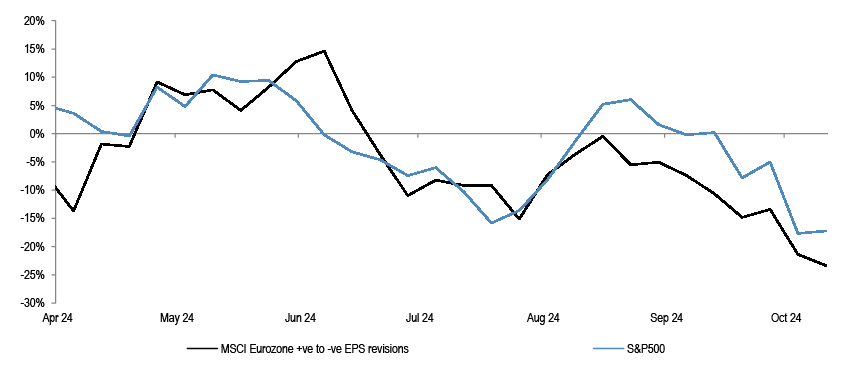
Weekly EPS revisions have turned negative again, in both the US and in Eurozone…
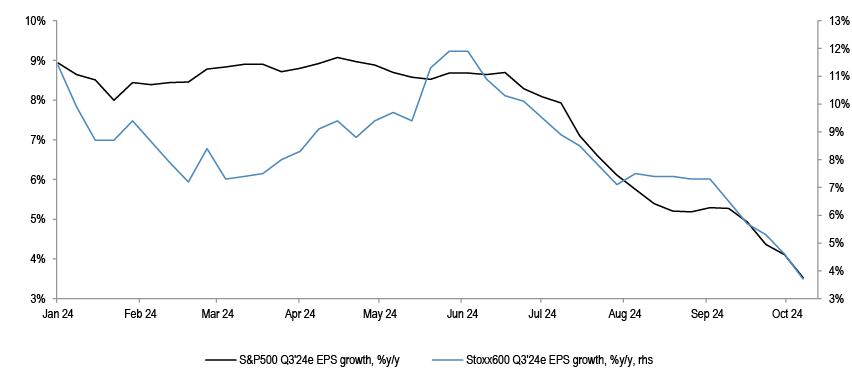
…given the persistent downgrades, the hurdle rate has come down for Q3, suggesting the bar for surprises is lower, which is helpful…
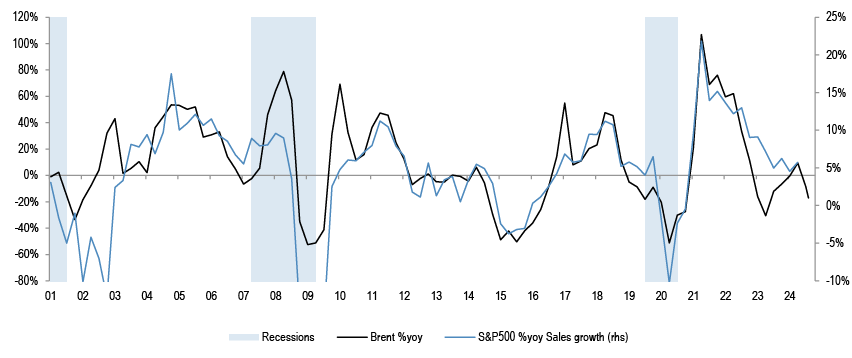
…the risk is that topline keeps decelerating, and could result in renewed earnings downgrades
Source: IBES, Thomson Reuters, Bloomberg Finance L.P.
- Q3 reporting season is heating up. Weekly sellside EPS revisions in both US and in Eurozone are negative again, and appear to be worsening - top chart. In general, the downgrades are concentrated in commodities and in Cyclicals such as Industrials and Discretionary, with the exception of Financials, while Defensive sectors such as Utilities and Real Estate are holding up better.
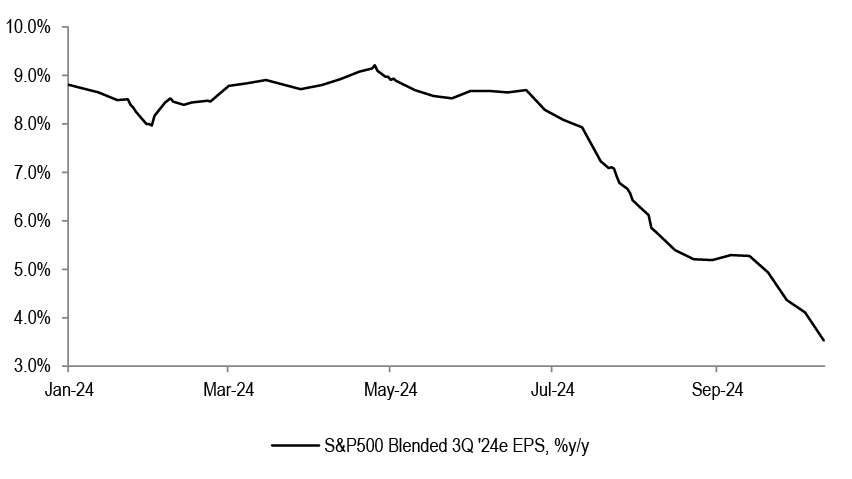
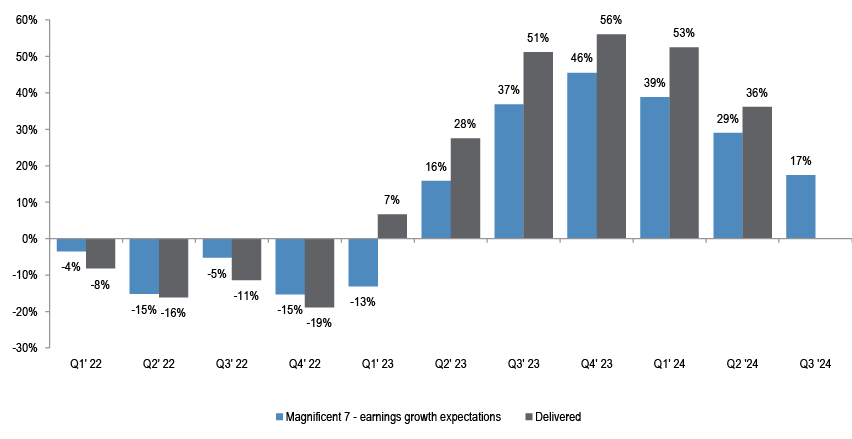
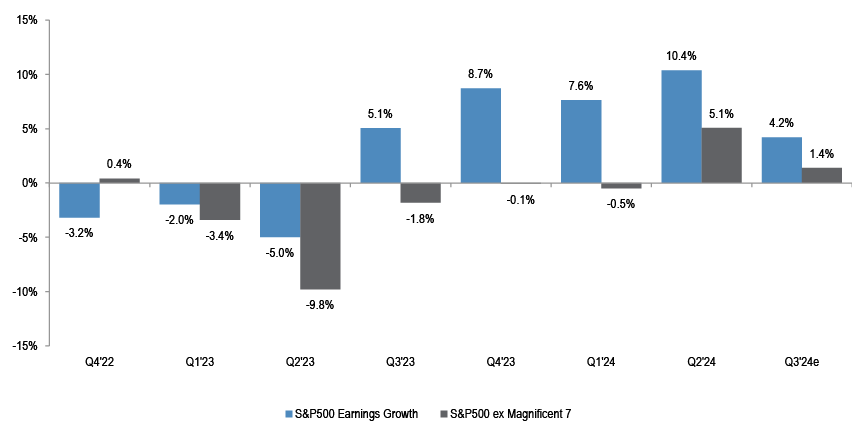
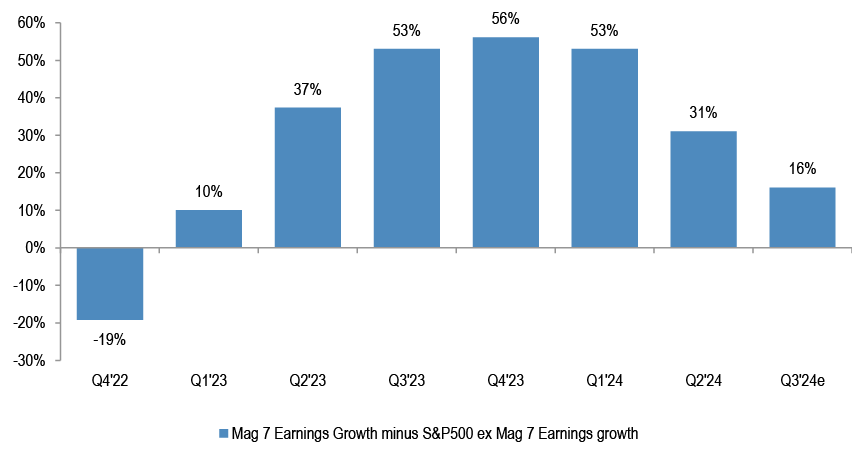
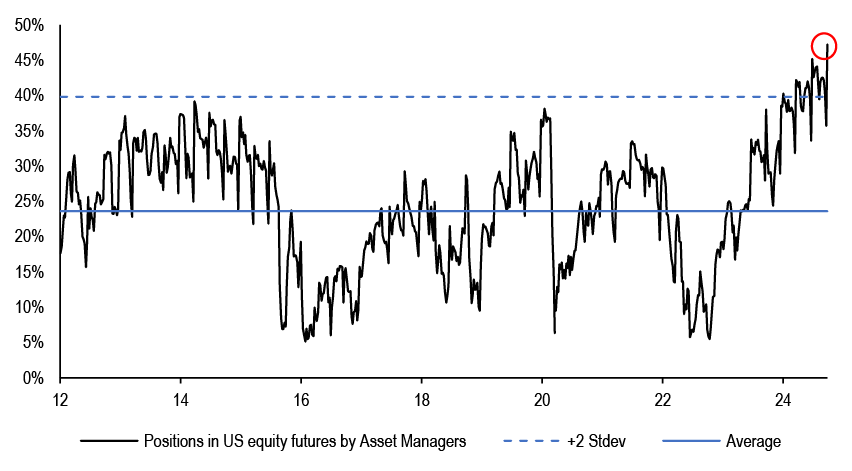
- Given the persistent downgrades, the hurdle rate is lower, with S&P500 Q3 yoy% projection down to 4%, from 8% a few months back. There is not much spread between Cyclicals and Defensives expectations, both of which are around 0-4% yoy rate. Mag-7 forecast is for 17% yoy growth, half of the 36% delivered in Q2 for the group. Ex Mag-7, the Q3 projection is for only 1% EPS growth, but the Mag-7 vs rest of market earnings delivery differential has been narrowing in past quarters. The question is whether the expectations are low enough entering the season, especially given that markets are hovering near highs, and positioning is elevated.
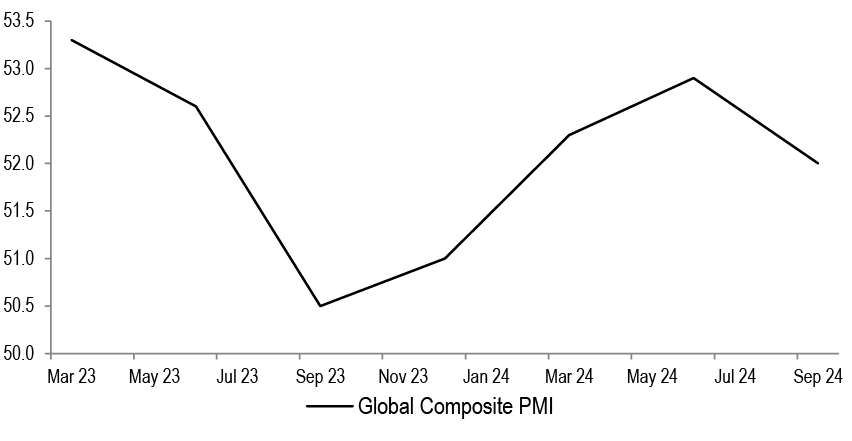
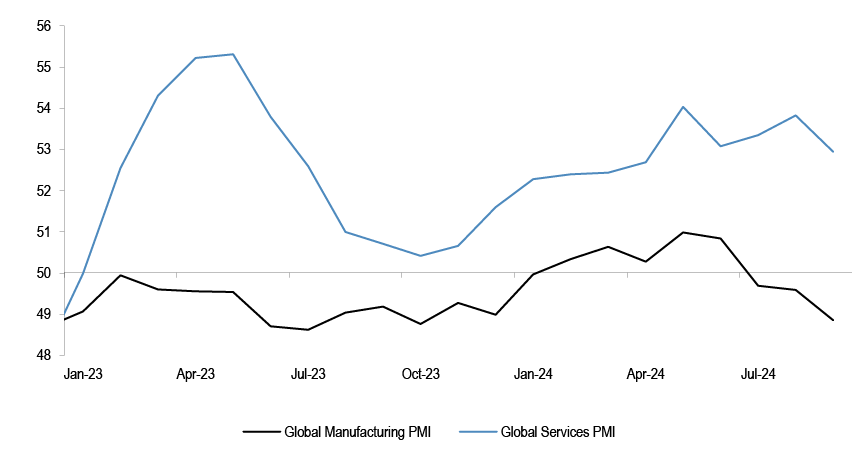
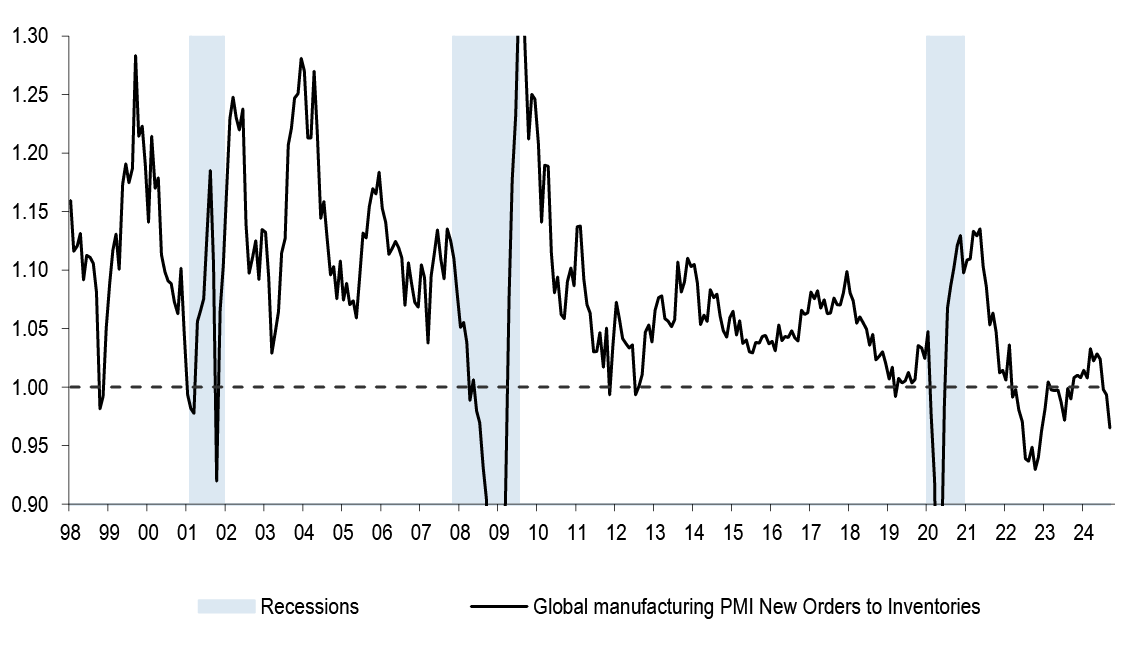
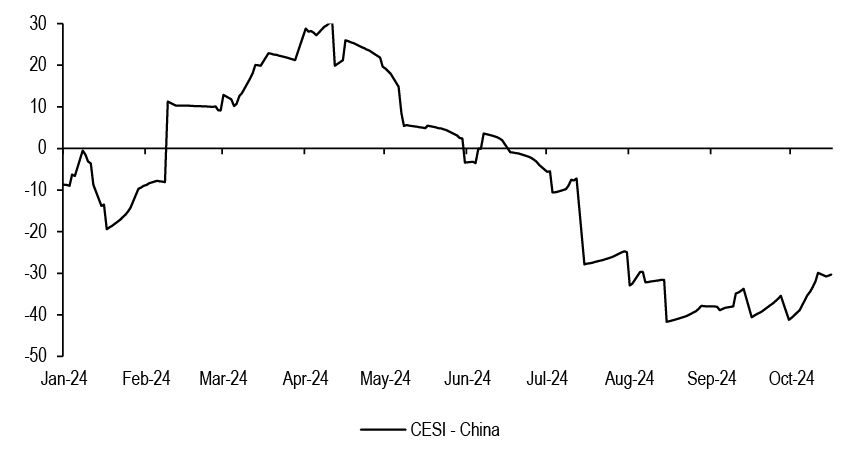
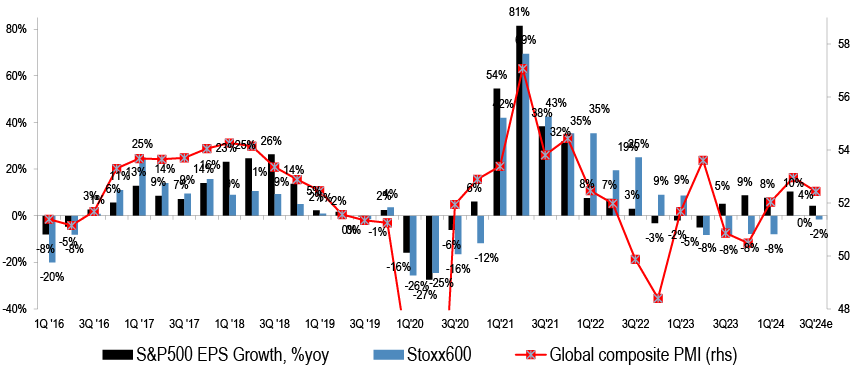
- Global composite PMI lost steam in Q3, after 3 quarters of an acceleration. Both manufacturing and services activity is more mixed, with new orders/inventories ratio falling sharply, and China has softened further in Q3. Given this backdrop, the reduction in the hurdle rate that took place over the past weeks might not necessarily mean we get a positive reaction to results.
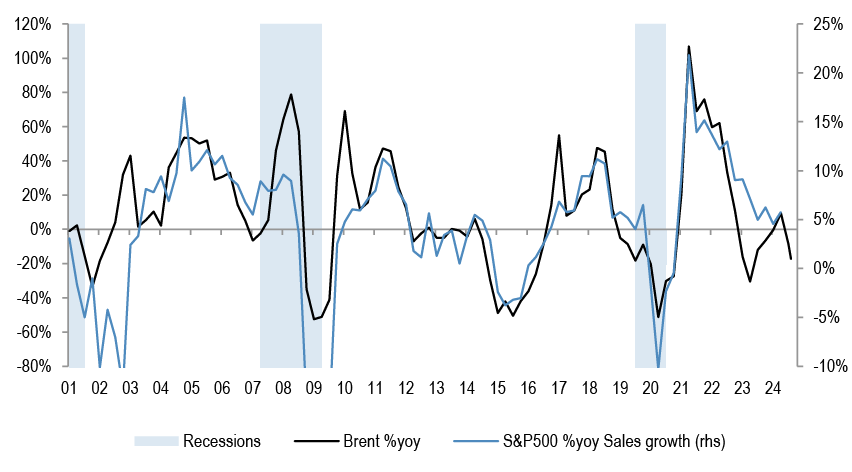
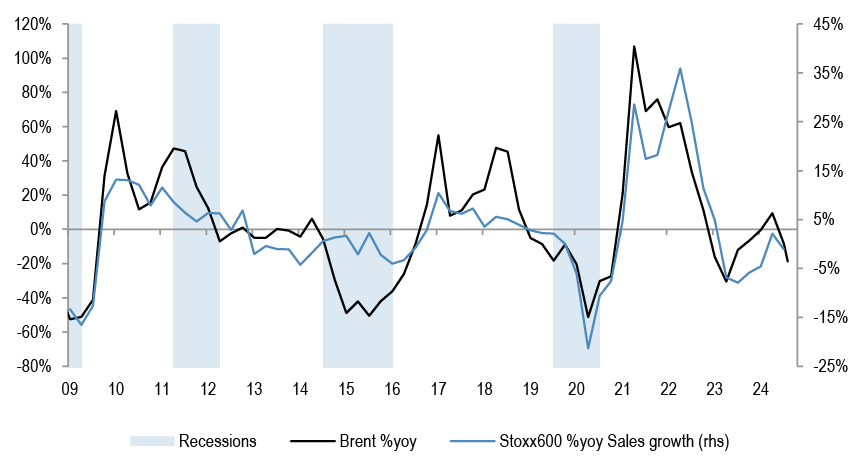
- Topline growth is likely to keep decelerating. Brent is typically strongly positively correlated with sales growth - bottom chart, and is pointing to downside. Profit margins at index level are above past averages, in both the US and in Europe. They could stay so, barring some mix deterioration.
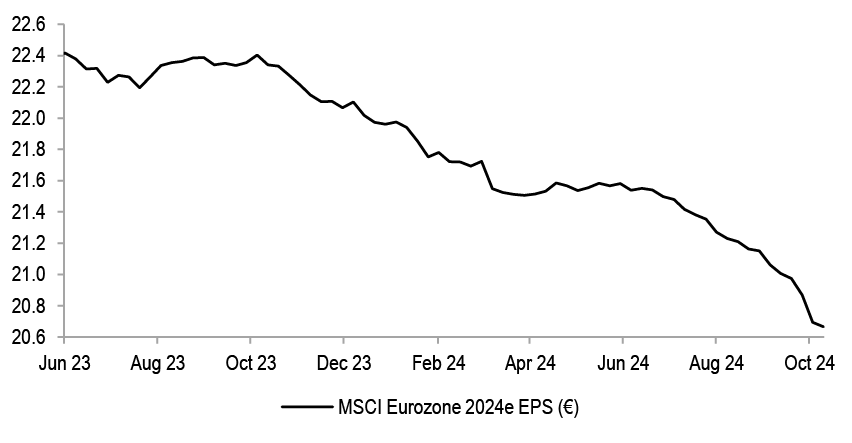
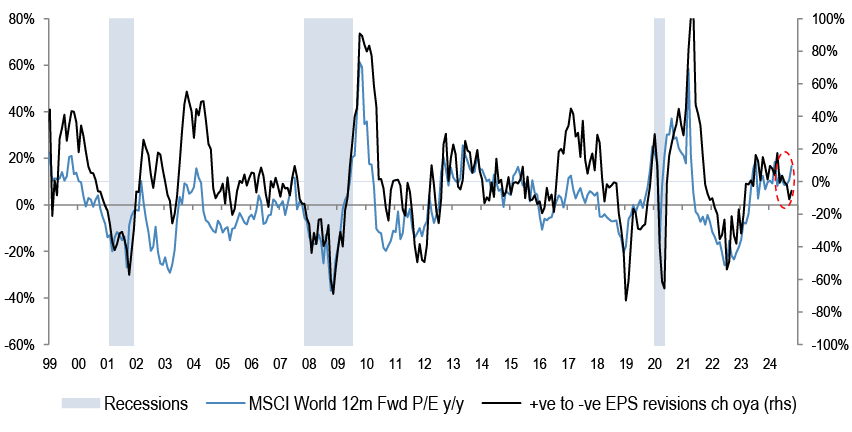
- Separately, NFIB uncertainty index is spiking. The question is will companies risk sounding bullish just ahead of the elections? Given that markets were to a good extent driven by multiple rerating, 2024 EPS projections are at a year low in both the US and in Europe, EPS revisions really need to turn up in order to support P/E multiples. The P/E vs EPS correlation was historically clearly positive, and the gap is opening up.
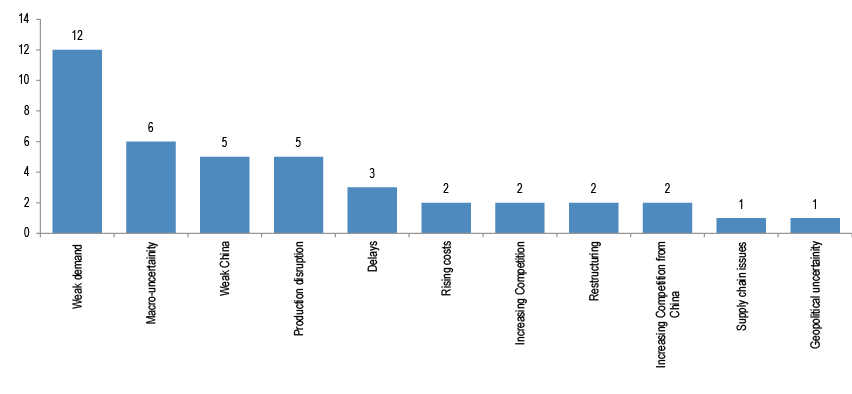
- Over 40 US and European companies have warned in the runup to the current reporting season. The average stock reaction on the day is -10% in Europe, and the key reasons behind these include weak demand and macro uncertainty.
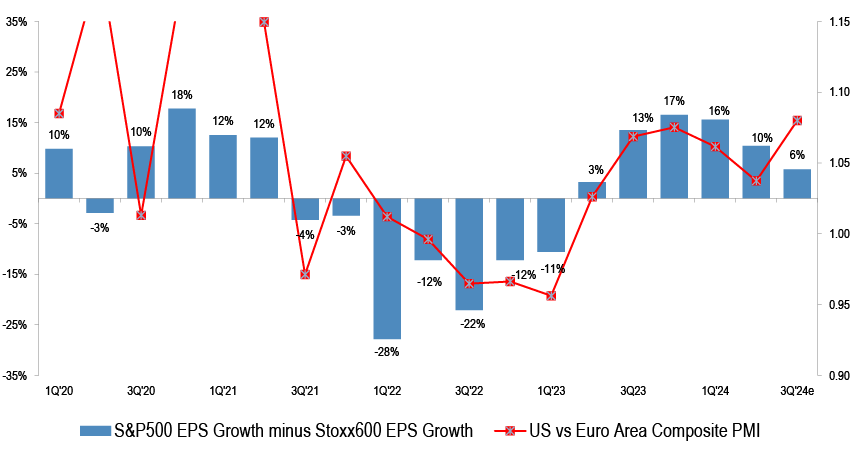
- Regionally, US vs Europe PMI spread is increasing again, which correlates with relative EPS delivery. We reiterated our cautious view on Eurozone.
- At sector level, we remain cautious on chemicals, luxury, industrials, autos, semis and mining. The current weak earnings revisions picture and the potentially soft reporting season might suggest that the rebound in Cyclicals seen in the past 5-6 weeks could lose steam, and that the sector leadership might revert to what transpired in the summer. We would consider buying Cyclicals after Q4 reporting season is done. Q4 results, in Jan-Feb, are also set to be mixed, and will likely see resets to 2025 consensus expectations, which are too high as it stands. Fed cycle lead-lags would also align with this timing.
Q3 Earnings Preview - earnings downgrades have been significant
Q3 earnings season is heating up
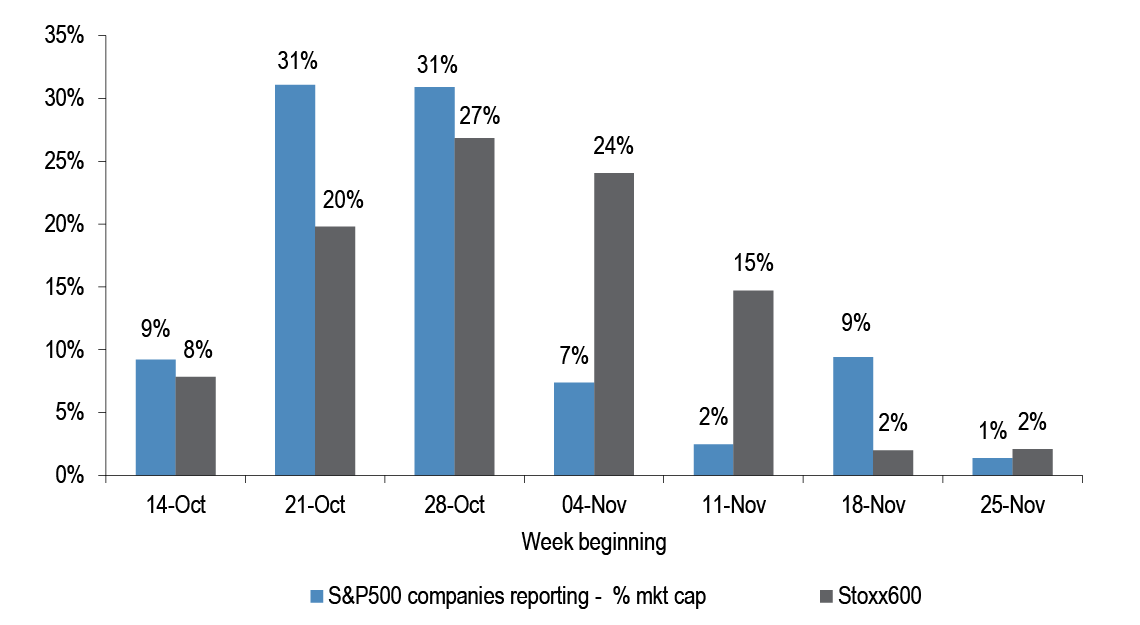
Figure 1: Q3 ‘24 Earnings calendar
Source: Bloomberg Finance L.P.
We are entering the busiest weeks of Q3 reporting season. Nearly 60% of S&P500 market cap is scheduled to report in the coming two weeks, while in Europe around 50% are expected to release earnings over the same period.
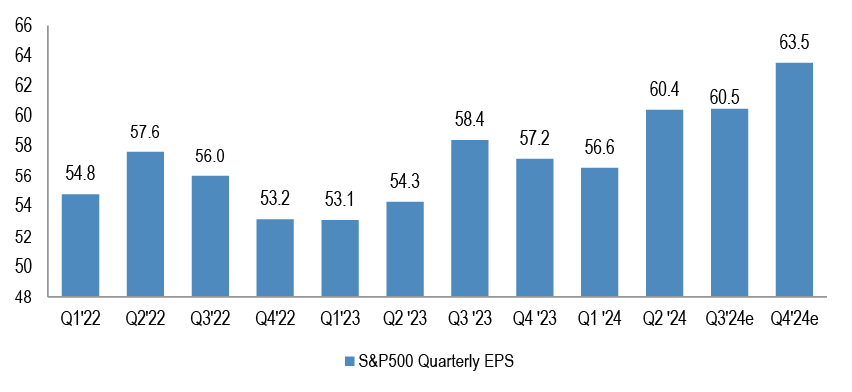
Figure 2: S&P500 Quarterly EPS projections
Source: Thomson Reuters
Consensus is not projecting any sequential improvement in earnings this quarter for S&P500, vs Q2.
Figure 3: Weekly EPS revisions for US and Eurozone
Source: IBES
EPS revisions have turned negative again in both US and Eurozone.
Table 1: Change in MSCI Eurozone sectors’ 2024e EPS since the peak in June
| 2024 EPS | Latest | As of 7th June | Change |
| MSCI Eurozone | 20.7 | 21.5 | -4% |
| Energy | 22.8 | 25.6 | -11% |
| Materials | 14.6 | 16.0 | -9% |
| Industrials | 25.0 | 25.8 | -3% |
| Discretionary | 16.2 | 19.6 | -18% |
| Staples | 11.3 | 11.5 | -2% |
| Healthcare | 12.6 | 12.6 | 0% |
| Financials | 8.3 | 8.2 | 2% |
| IT | 7.9 | 8.1 | -3% |
| Telecoms | 3.6 | 3.6 | -1% |
| Utilities | 11.0 | 10.5 | 5% |
| Real Estate | 44.2 | 43.7 | 1% |
Source: IBES
The bulk of the recent earnings downgrades can be attributed to commodity and consumer sectors. Only Financials among Cyclicals are in the green. Defensive sectors like Utilities and Real Estate are holding up better.
Given the persistent downgrades, the hurdle rate has come down
Figure 4: S&P500 Blended 3Q ‘24e EPS, %y/y
Source: Thomson Reuters
On the back of continue downgrades, Q3 EPS growth projections for S&P500 have been meaningfully downgraded in the last few months, from 8% y/y to 4% y/y growth rate currently.
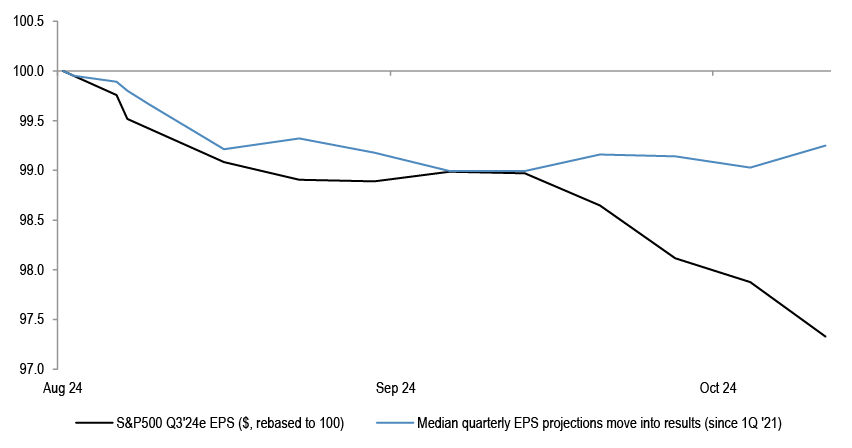
Figure 5: Quarterly EPS projection move into results - Current vs Median
Source: Thomson Reuters
The recent downgrades to EPS expectations are more aggressive than what is typically seen in the runup to past reporting seasons.
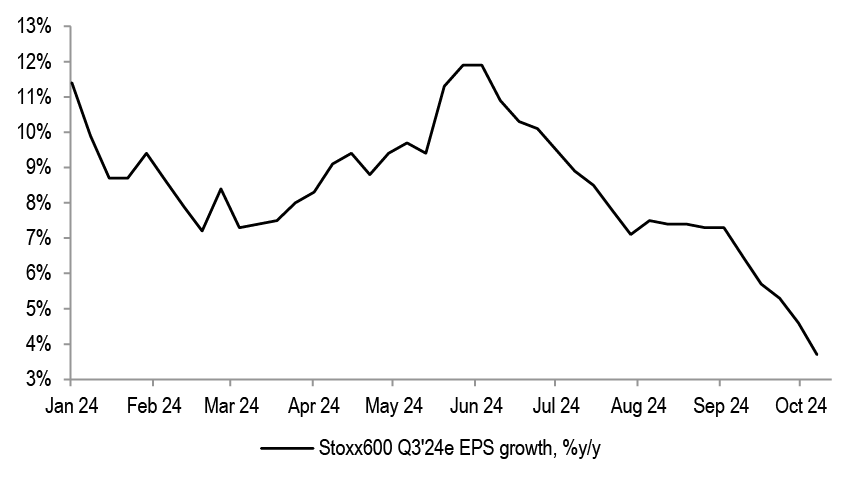
Figure 6: Stoxx600 3Q ‘24e EPS growth, %y/y
Source: Thomson Reuters
The hurdle rate is even lower for Europe, where Q3 EPS growth projections are at -2% y/y, down from 4% a few months ago.
Table 2: Q3 ’24e EPS Growth projections for key regions - sector breakdown
| Q3 '24e EPS growth, %y/y | ||||
| US | Europe | Eurozone | Japan | |
| Energy | -24% | -33% | -28% | -30% |
| Materials | -5% | 29% | 34% | 8% |
| Industrials | 0% | 10% | -1% | 13% |
| Discretionary | 4% | -28% | -31% | 13% |
| Staples | -1% | -2% | 0% | -2% |
| Financials | 1% | 12% | 20% | 13% |
| Health Care | 10% | 13% | 5% | 15% |
| IT | 14% | -6% | -13% | 17% |
| Com. Services | 11% | -2% | -2% | -6% |
| Utilities | 4% | -20% | -19% | -54% |
| Real Estate | 6% | 16% | 2% | -8% |
| Market | 4% | -2% | -2% | 3% |
| Market Ex-Financials | 5% | -8% | -14% | 2% |
| Market Ex-Energy | 6% | 4% | 2% | 4% |
| Cyclicals | 8% | -5% | -13% | 13% |
| Defensives | 7% | 3% | -6% | -16% |
| Value | -6% | -2% | 7% | 6% |
| Growth | 10% | 8% | -2% | 10% |
Source: IBES, J.P.Morgan
Energy and Autos are weighing on overall growth in Europe. In the US, Cyclicals vs Defensives spread is small.
Table 3: Q3 ’24e Median EPS growth projections
| Q3 '24e Median EPS growth, %y/y | ||||
| US | Europe | Eurozone | Japan | |
| Energy | -16% | -26% | -29% | -15% |
| Materials | 4% | 7% | 4% | 20% |
| Industrials | 3% | 4% | 0% | 1% |
| Discretionary | 0% | 6% | 1% | 6% |
| Staples | 1% | 0% | -7% | 0% |
| Financials | 5% | 5% | 11% | 14% |
| Health Care | 1% | 5% | 7% | -1% |
| IT | 5% | 1% | -5% | 13% |
| Com. Services | 0% | 5% | 8% | 1% |
| Utilities | 6% | -18% | -22% | -45% |
| Real Estate | 1% | 13% | 8% | 0% |
| Market | 3% | 3% | 3% | 4% |
| Cyclicals | 3% | 4% | 0% | 7% |
| Defensives | 2% | 1% | 3% | -2% |
Source: IBES, J.P.Morgan
If we look at median earnings growth projections, they are low single digit in all regions, without much spread between Cyclicals’ and Defensives’ earnings growth expectations.
Figure 7: Magnificent 7: earnings growth expectations vs delivered
Source: Bloomberg Finance L.P.
The Mag-7 group has been a significant driver of S&P500 earnings in the past year, and is slowing. Their earnings are expected to grow by 17% y/y this quarter, half of what was delivered in Q2, and a third of Q4 ‘23 delivery.
Figure 8: S&P500 vs S&P500 ex Mag 7 earnings growth
Source: Bloomberg Finance L.P.
Ex Mag-7, S&P500 EPS growth projection stands at 1.4%, positive, but a deceleration from 5% rate seen in Q2.
Figure 9: Mag-7 Earnings Growth minus S&P500 ex Mag-7 Earnings growth
Source: Bloomberg Finance L.P.
The differential between Mag-7 and the rest of S&P500 earnings growth is likely to continue narrowing.
Figure 10: Positions in US Equity futures by Asset Managers and Leveraged Funds
Source: J.P.Morgan Flows & Liquidity team
The question is whether the hurdle rate is low enough, given that the markets are hovering near the highs, and given the stretched investor positioning, as per above chart.
Activity in Q3 was mixed, with global PMIs moving lower
Table 4: Key macro indicators
| 1Q '23 | 2Q '23 | 3Q '23 | 4Q '23 | 1Q'24 | 2Q'24 | 3Q'24 | |
| Real GDP, % oya | |||||||
| US | 2.3% | 2.8% | 3.2% | 3.2% | 2.9% | 3.0% | 2.6% |
| Euro Area | 1.3% | 0.5% | 0.0% | 0.2% | 0.5% | 0.6% | 0.8% |
| Japan | 2.5% | 2.0% | 1.3% | 0.9% | -1.0% | -0.9% | 0.7% |
| EM | 3.5% | 4.5% | 4.3% | 4.7% | 4.5% | 4.4% | 3.7% |
| IP, %oya | |||||||
| US | -0.1% | -0.7% | -0.8% | -0.4% | -0.7% | -0.3% | -0.2% |
| Euro Area | 0.8% | -1.1% | -4.6% | -3.5% | -4.7% | -3.4% | -1.5% |
| Japan | -1.8% | 0.8% | -3.6% | -0.9% | -4.3% | -2.9% | -1.5% |
| PMI Composite | |||||||
| US | 49.7 | 53.6 | 50.8 | 50.8 | 52.2 | 53.5 | 54.3 |
| Euro Area | 52.0 | 52.3 | 47.5 | 47.2 | 49.1 | 51.6 | 50.3 |
| Japan | 51.6 | 53.1 | 52.3 | 50.0 | 51.3 | 51.5 | 52.5 |
| EM | 53.5 | 54.6 | 52.5 | 52.1 | 53.5 | 53.7 | 51.9 |
| German IFO | 92.9 | 91.4 | 86.1 | 85.6 | 85.4 | 88.7 | 84.8 |
| CPI, %oya | |||||||
| US | 5.7% | 4.0% | 3.6% | 3.2% | 3.2% | 3.2% | 2.6% |
| Euro Area | 8.0% | 6.2% | 4.8% | 2.7% | 2.6% | 2.5% | 2.1% |
| Japan | 3.6% | 3.3% | 3.2% | 2.9% | 2.6% | 2.7% | 2.9% |
| EM | 5.4% | 3.5% | 3.8% | 3.7% | 3.7% | 4.0% | 3.6% |
| Consumer Sentiment | |||||||
| US | 64.6 | 62.3 | 69.6 | 64.9 | 78.4 | 71.5 | 68.1 |
| Euro Area | -19.6 | -17.0 | -16.3 | -16.7 | -15.5 | -14.3 | -13.1 |
| Japan | 31.7 | 35.6 | 35.7 | 35.9 | 38.1 | 36.9 | 36.6 |
| Unemployment rate, % | |||||||
| US | 3.5 | 3.6 | 3.7 | 3.8 | 3.8 | 4.0 | 4.2 |
| Euro Area | 6.6 | 6.5 | 6.6 | 6.5 | 6.5 | 6.5 | 6.4 |
| Japan | 2.6 | 2.6 | 2.6 | 2.5 | 2.5 | 2.6 | 2.6 |
Source: J.P.Morgan, Bloomberg Finance L.P., S&P Global
The clear improvement in activity dataflow that was seen in Q2 globally has stalled in Q3, the dataflow has been more mixed of late.
Figure 11: Global Composite PMI
Source: Bloomberg Finance L.P.
Global PMI slowed, after accelerating for 3 quarters.
Figure 12: Global Manufacturing and Services PMI
Source: J.P. Morgan
Services PMI has held up better than manufacturing over the last year, but has also ticked down in the recent print.
Figure 13: Global manufacturing PMI New Orders to Inventories ratio
Source: S&P Global
Lead indicators like the global manufacturing new orders to inventories ratio keep weakening.
Figure 14: CESI - China
Source: Bloomberg Finance L.P.
China activity has been particularly soft up to and including Q3.
Figure 15: S&P500 and Stoxx600 EPS growth vs Global Composite PMI
Source: Bloomberg Finance L.P.
Given the sequentially softer PMI trends, it is right to expect muted earnings delivery, in our view.
Topline growth is likely to keep decelerating
Table 5: Q3 ’24e Sales Growth for key regions
| Q3 '24e Sales growth, %y/y | ||||
| US | Europe | Eurozone | Japan | |
| Energy | -5% | -14% | -5% | 4% |
| Materials | 0% | -2% | -3% | 4% |
| Industrials | -1% | 3% | 2% | 5% |
| Discretionary | 5% | -2% | -2% | 3% |
| Staples | 2% | 0% | 0% | 7% |
| Financials | 2% | 3% | 4% | -7% |
| Health Care | 7% | 6% | 3% | 5% |
| IT | 12% | 2% | 3% | 5% |
| Com. Services | 8% | -1% | -2% | 3% |
| Utilities | 6% | 2% | -3% | -5% |
| Real Estate | 6% | 8% | 7% | 2% |
| Market | 4% | -1% | 0% | 4% |
| Market Ex-Financials | 4% | -2% | -1% | 4% |
| Market Ex-Energy | 5% | 1% | 0% | 4% |
| Cyclicals | 5% | 0% | -1% | 4% |
| Defensives | 6% | 2% | -1% | 3% |
| Value | -1% | -6% | 1% | -1% |
| Growth | 7% | 3% | 2% | 6% |
Source: IBES, J.P.Morgan
On topline, Q3 revenue growth expectations stand at +4% y/y in the US, and -1% y/y in Europe, a continued unwinding of the COVID-driven sales growth surge.
Figure 16: Brent vs S&P500 Sales growth
Source: Bloomberg Finance L.P., S&P Global
The chances are that corporate revenues keep decelerating, towards zero. Brent and US Sales growth are usually positively correlated, and continued oil price weakness points to further downside for topline growth.
Figure 17: Brent vs Stoxx600 Sales growth
Source: Bloomberg Finance L.P., J.P.Morgan
This is the case in Europe, as well.
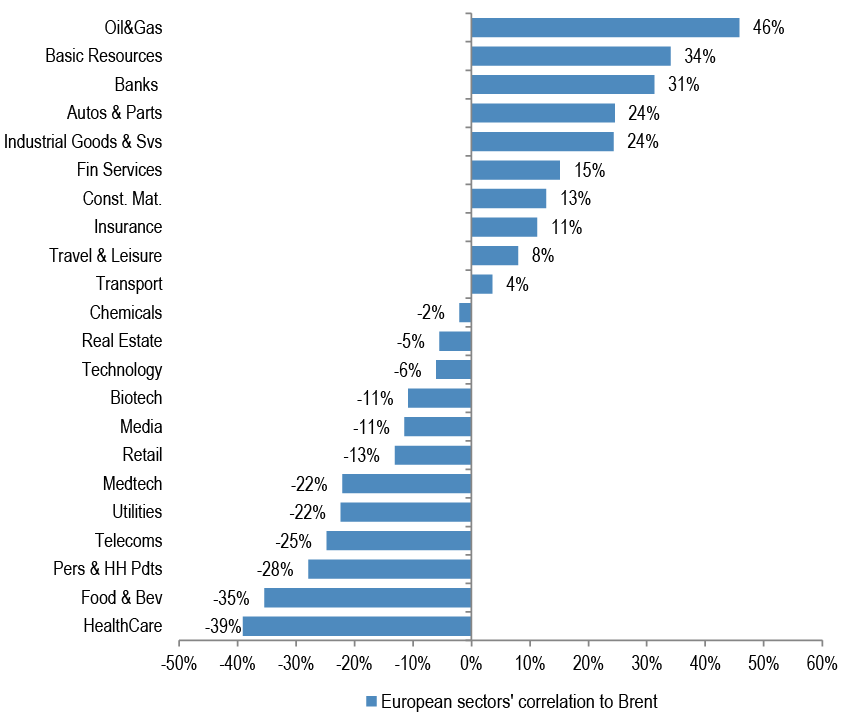
Figure 18: European sectors’ correlation to Brent
Source: Bloomberg Finance L.P>
Other than Energy, Cyclical sectors tend to display the highest positive correlation to oil price, and could see a further hit to their earnings from the falling Brent price.
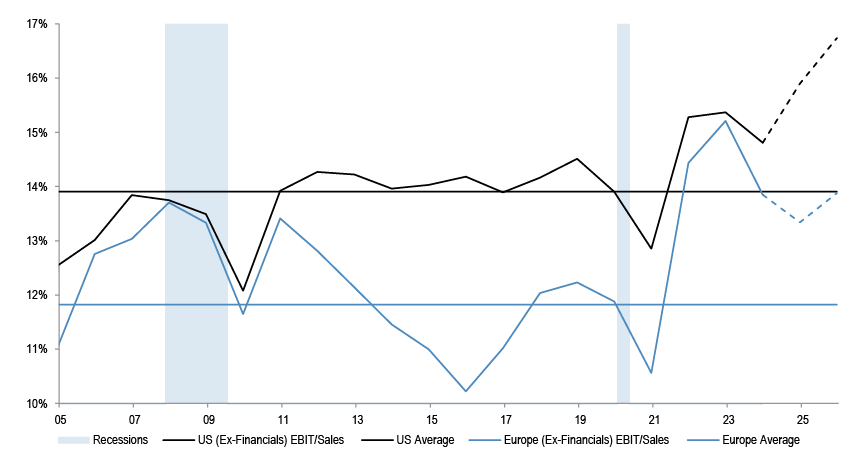
Figure 19: US and European EBIT margins, with consensus projections
Source: IBES
Profit margins are above historical averages in both the US and Europe, and are expected by consensus to pick up further. While that might be too optimistic, margins could maintain their current levels.
Will companies dare to sound optimistic on outlook ahead of the US elections?
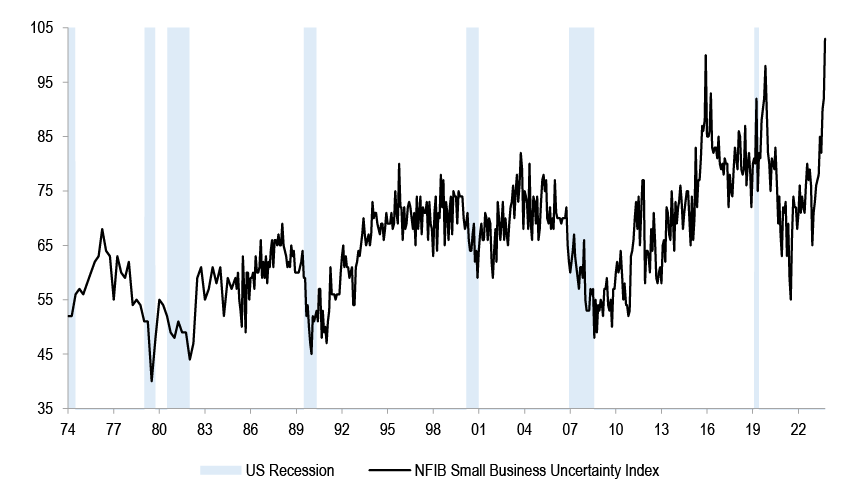
Figure 20: NFIB Small Business Uncertainty Index
Source: Bloomberg Finance L.P.
Small business owners are feeling more uncertain than ever, with election risks around the corner - the small business uncertainty component of the NFIB survey reached its highest recorded level in September. Given this, we do not think corporates are likely to sound very optimistic on their earnings calls.
Earnings improvement will be needed to justify multiple expansion
Table 6: Key regions - Current vs Jan’24 12m Fwd. P/E
| Key regions | Current PE | Jan'24 PE | % change |
| UK | 11.9 | 10.8 | 11% |
| China | 10.1 | 9.1 | 11% |
| World | 19.3 | 17.6 | 10% |
| US | 22.1 | 20.1 | 10% |
| Europe | 13.7 | 13.0 | 5% |
| Eurozone | 13.0 | 12.4 | 5% |
| EM | 12.2 | 11.9 | 2% |
| Japan | 14.3 | 14.1 | 1% |
Source: IBES
So far this year, equity markets enjoyed P/E rerating.
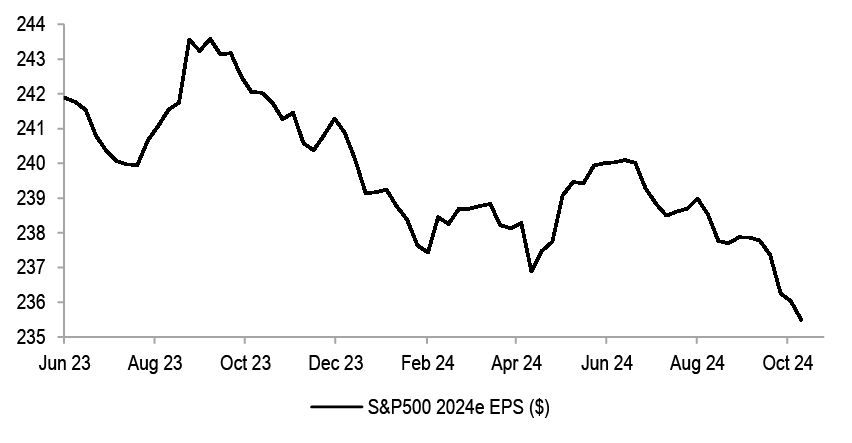
Figure 21: S&P500 2024e EPS
Source: IBES
2024 earnings estimates have been consistently downgraded this year in the US.
Figure 22: MSCI Eurozone 2024e EPS
Source: IBES
The fall is even more stark in Eurozone.
Figure 23: MSCI World 12m Fwd PE and EPS Revisions
Source: IBES
Historically, P/E has been closely aligned to the trajectory of earnings revisions. A gap has opened up recently, indicating that either earnings need to pickup or multiples need to derate, to return to equilibrium.
A rising number of companies are profit warning
Table 7: recent profit warnings in Europe
| Company Name | Ticker | Commentary | Date | 1Day Perf relative to market, % | Sector |
| MERCEDES-BENZ GROUP AG | MBG GY | Weak sales in key Chinese market | 20 Sep | -5.4% | Discretionary |
| ALTEN SA | ATE FP | Project delays continue in Europe | 20 Sep | -2.8% | IT |
| AURUBIS AG | NDA GR | Weaker price environment | 23 Sep | -10.1% | Materials |
| ALPHAWAVE IP GROUP PLC | AWE LN | Negative impacts due to a merger of two clients in South Korea | 23 Sep | -14.1% | IT |
| HENNES & MAURITZ AB-B SHS | HMB SS | Weak macro-economic environment | 26 Sep | -5.9% | Discretionary |
| IG DESIGN GROUP PLC | IGR LN | Cautious customer orders and credit risk concerns in Americas segment | 26 Sep | -25.3% | Discretionary |
| UBISOFT ENTERTAINMENT | UBI FP | Softer than expected launch for Star Wars Outlaws and lower net bookings | 26 Sep | -14.6% | Comm Srvcs |
| FLOWTECH FLUIDPOWER PLC | FLO LN | Delays in large OEM projects | 26 Sep | -22.3% | Industrials |
| FORVIA | FRVIA FP | Market uncertainty and high car inventories | 27 Sep | 10.6% | Discretionary |
| STELLANTIS NV | STLAM IM | Rising industry supply and increased China Competition | 30 Sep | -13.7% | Discretionary |
| ASTON MARTIN LAGONDA GLOBAL | AML LN | Supply Chain disruptions and weak demand in China | 30 Sep | -23.5% | Discretionary |
| VOLKSWAGEN AG | VOW GY | Waning demand for cars and challenging market environment | 30 Sep | -3.3% | Discretionary |
| GERRESHEIMER AG | GXI GY | Weaker demand for Tubular Glass business | 30 Sep | -17.0% | Health Care |
| BOUYGUES SA | EN FP | Higher competition and changing customer landscape | 03 Oct | -3.8% | Industrials |
| VISTRY GROUP PLC | VTY LN | Stubbornly high interest rates and construction costs have limited the amount of homes built | 08 Oct | -23.0% | Discretionary |
| SENIOR PLC | SNR LN | Supply chain issues and regulatory disruption have hobbled aircraft delivery at Boeing and Airbus | 08 Oct | -11.4% | Industrials |
| AQUAPORIN A/S | AQP DC | Unexpected change in demand from key customer | 09 Oct | -4.7% | Industrials |
| INDIVIOR PLC | INDV LN | Increasing competition to treat opioid addiction | 10 Oct | -18.8% | Health Care |
| VESTAS WIND SYSTEMS A/S | VWS DC | Competition from China and weaker growth in US/Europe | 10 Oct | -3.5% | Industrials |
| VALMET OYJ | VALMT FH | Services market developed slower in EMEA, China and Asia Pacific | 11 Oct | -8.3% | Industrials |
| BP PLC | BP/ LN | Fall in oil trading and demand | 14 Oct | -0.8% | Energy |
| LVMH MOET HENNESSY LOUIS VUI | MC FP | Pullback in spending by Chinese consumers | 15 Oct | -1.1% | Discretionary |
| ASML HOLDING NV | ASML NA | Weak demand from chipmakers for its machinery | 15 Oct | -14.8% | IT |
| TECAN GROUP AG-REG | TECN SW | Customers with considerable exposure to Chinese market have deferred significant levels of demand into 2025 | 16 Oct | -14.4% | Health Care |
| REXEL SA | RXL FP | Difficult macro-economic environment in Germany, Austria and Benelux region | 16 Oct | -2.9% | Industrials |
| UPM-KYMMENE OYJ | UPM FH | Demand for products has been weaker than expected | 16 Oct | -3.1% | Materials |
| NESTLE SA-REG | NESN SW | Consumer demand has weakened | 17 Oct | 1.5% | Staples |
| Average | -9.5% |
Source: Bloomberg Finance L.P.
European companies that profit warned over the last month underperformed the market by nearly 10% on average on the day. Broadly,they are citing challenging macro-economic environment and weak demand, particularly from China, as the key reasons for adjusting their profit outlook.
Table 8: recent profit warnings in US
| Company Name | Ticker | Commentary | Date | 1Day Perf relative to market, % | Sector |
| FEDEX CORP | FDX US | Weaker than expected demand in US | 20 Sep | -15.0% | Industrials |
| MATERION CORP | MTRN US | Lower than expected incoming order rates for second half | 02 Oct | -11.7% | Materials |
| LAMB WESTON HOLDINGS INC | LW US | Shuttering of factory, and lower volumes | 02 Oct | 2.6% | Staples |
| NIKE INC -CL B | NKE US | CEO transition | 02 Oct | -6.8% | Discretionary |
| ALBANY INTL CORP-CL A | AIN US | Increased cost assumptions and impact of suspended production at a key customer | 03 Oct | -10.9% | Industrials |
| LEVI STRAUSS & CO- CLASS A | LEVI US | Weak performance in China business | 03 Oct | -7.5% | Discretionary |
| RIVIAN AUTOMOTIVE INC-A | RIVN US | Production disruption from shortage of critical component | 04 Oct | -4.1% | Discretionary |
| PEPSICO INC | PEP US | Weak demand and push back on higher prices | 08 Oct | 1.0% | Staples |
| INMODE LTD | INMD US | Relocation of production outside Israel | 10 Oct | 7.6% | Health Care |
| DOMINO'S PIZZA INC | DPZ US | Challenging macro-economic environment | 10 Oct | -0.9% | Discretionary |
| E2OPEN PARENT HOLDINGS INC | ETWO US | Delays in closing large deals | 10 Oct | -21.4% | IT |
| GIBRALTAR INDUSTRIES INC | ROCK US | Trade and regulatory uncertainties | 11 Oct | -4.9% | Industrials |
| BOEING CO/THE | BA US | Warns of deeper Q3 loss as strikes eat into reserves and work stoppage at its main production hub | 12 Oct | -2.1% | Industrials |
| UNITEDHEALTH GROUP INC | UNH US | Higher medical expenses | 16 Oct | 2.2% | Health Care |
| Average | -5.1% |
Source: Bloomberg Finance L.P.
In the US, the average stock price reaction on the day of profit warnings is -5% relative to the market.
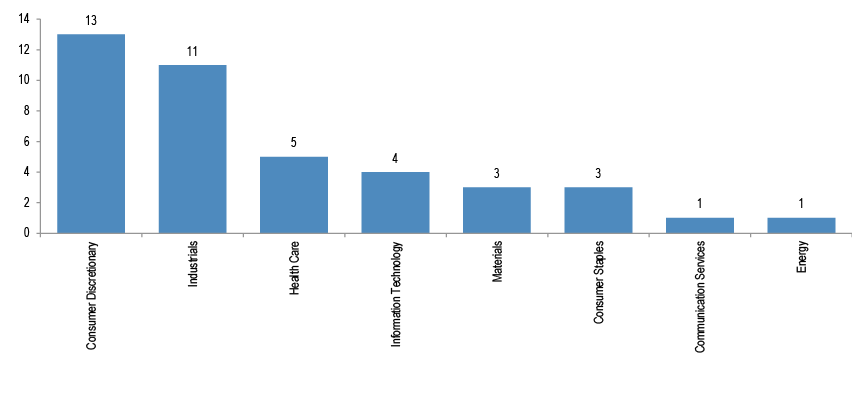
Figure 24: Sector wise breakup for profit warnings
Source: J.P. Morgan.
Consumer stocks are dominating the list of profit warnings so far.
Figure 25: Key reasons for profit warnings
Source: J.P. Morgan.
Majority of stocks have cited weak demand as the reason for lowering guidance.
Regionally, US vs Europe PMI spread is increasing again
Figure 26: S&P500 EPS growth minus Stoxx 600 EPS growth and relative PMI
Source: Bloomberg Finance L.P., J.P. Morgan
The spread between US and European PMIs has improved in Q3, after falling for 2 quarters, implying likely upside to current US vs European EPS estimates.
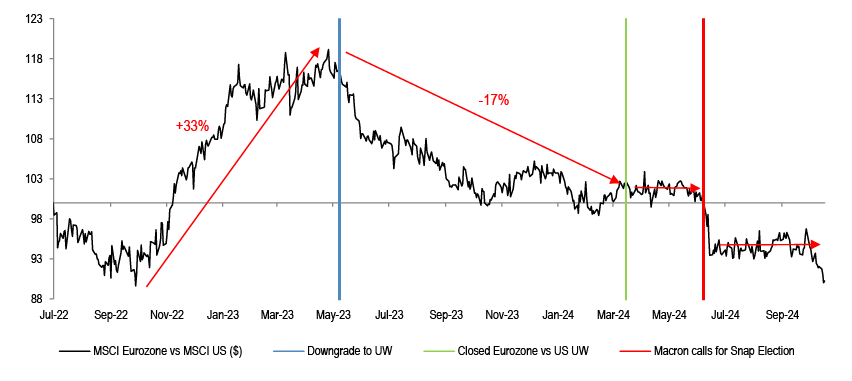
Figure 27: MSCI Eurozone vs US
Source: Datastream
Eurozone equities will likely keep lagging the US, in our view, as growth and earnings continue to underwhelm.
At sector level, we believe the recent Cyclical leadership could fade...
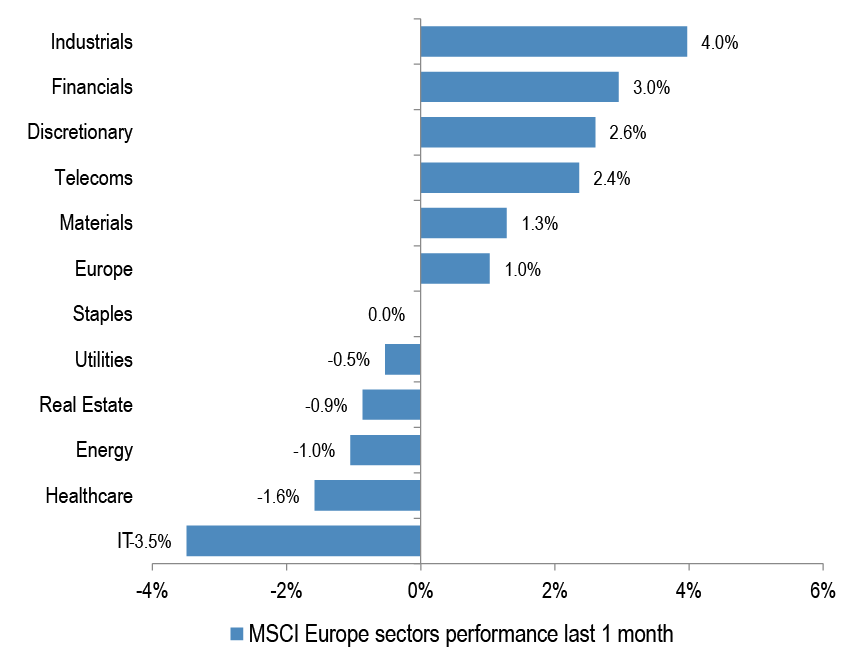
Figure 28: MSCI Europe sectors performance last 1 month
Source: Datastream
Cyclical sectors have performed better in the last weeks, driven by higher yields, China stimulus news and strong labour market data.
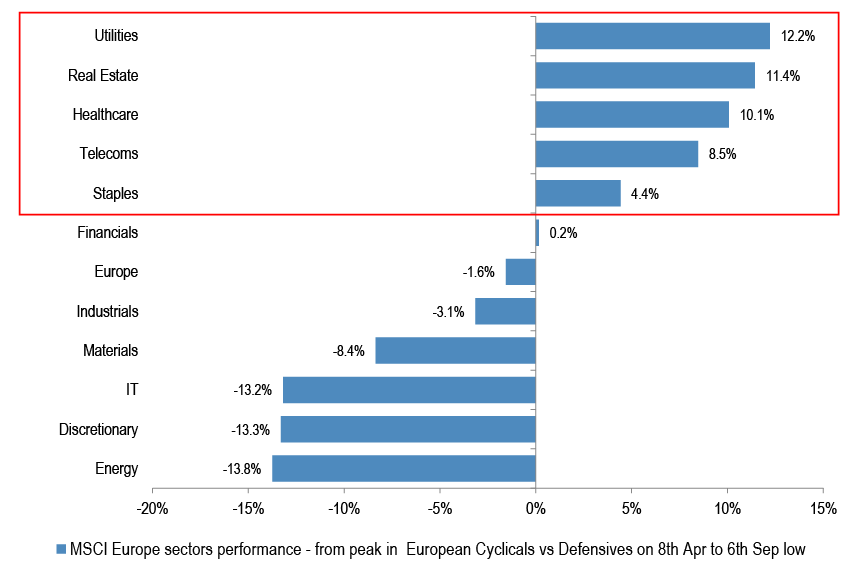
Figure 29: MSCI Europe sector performance in spring and summer
Source: Datastream
This follows a very Defensive sector leadership during the summer.
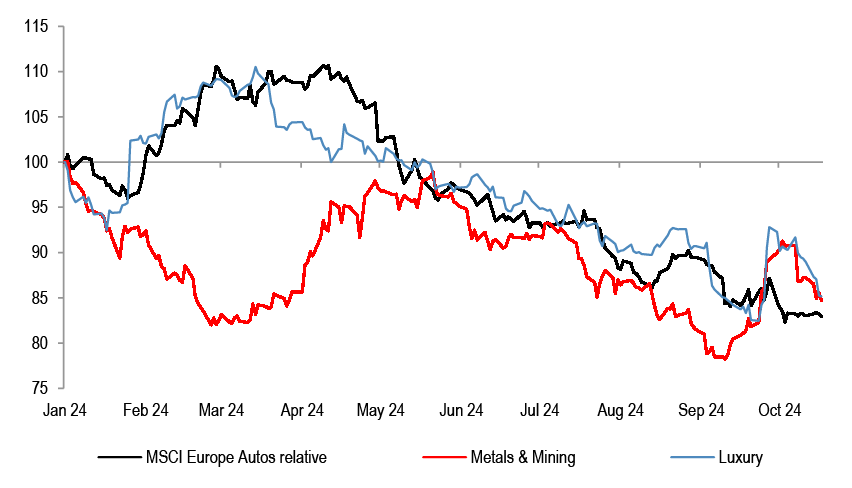
Figure 30: MSCI Europe Autos, Metals & Mining and Luxury relative
Source: Datastream
Cyclical sectors like Autos, Luxury and Mining are lagging again, and we stay cautious on the space.
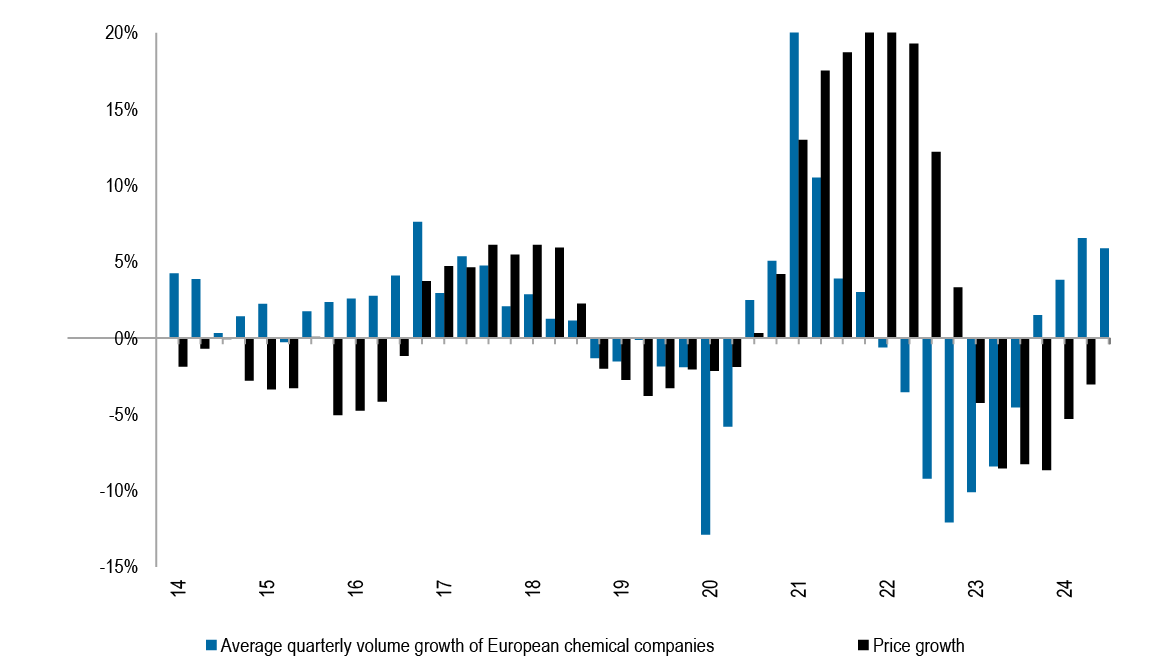
Figure 31: European Chemicals volume and price growth
Source: J.P. Morgan European Chemicals Research
The combination of subdued volume growth and weak pricing has weighed on Chemicals sector’s topline.
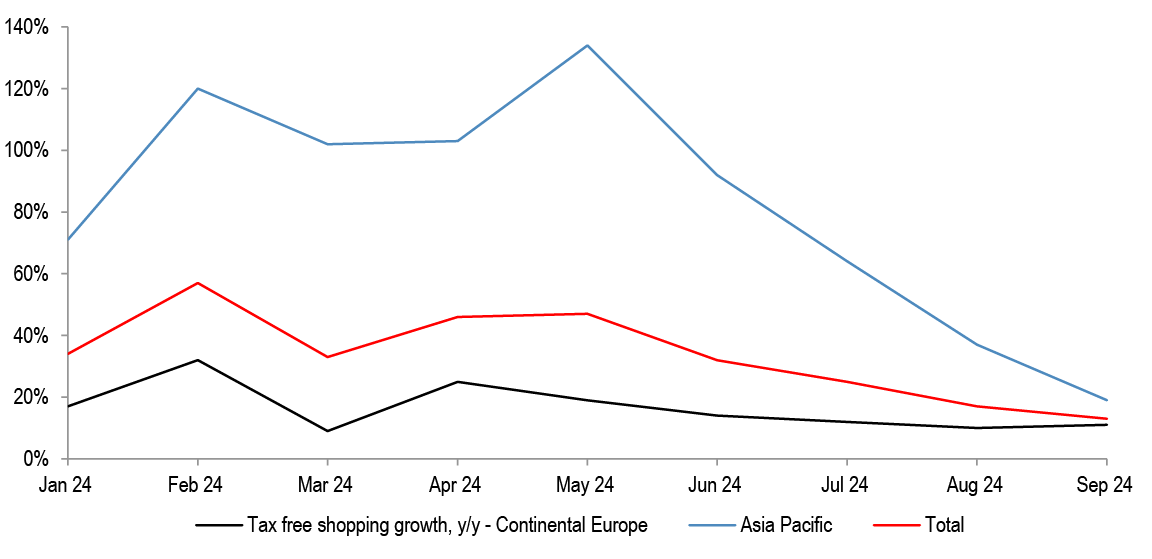
Figure 32: Tax free shopping growth
Source: J.P. Morgan European Luxury Research
Luxury shopping from China/Asia Pacific consumers has fallen materially, weighing on the sector’s profit outlook, given its significant exposure to the region. Potential fiscal stimulus announcements are unlikely to boost high-income consumer spend in a hurry.
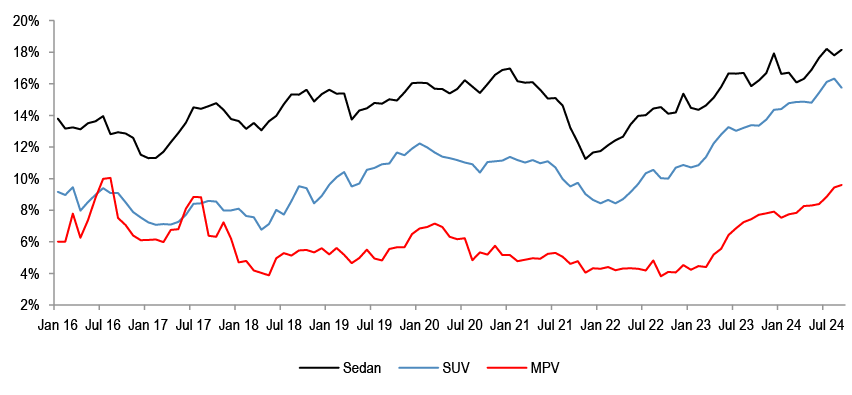
Figure 33: Average discount by vehicle type - China
Source: J.P. Morgan European Autos Research
Autos are having to increase discounts offered on all models.
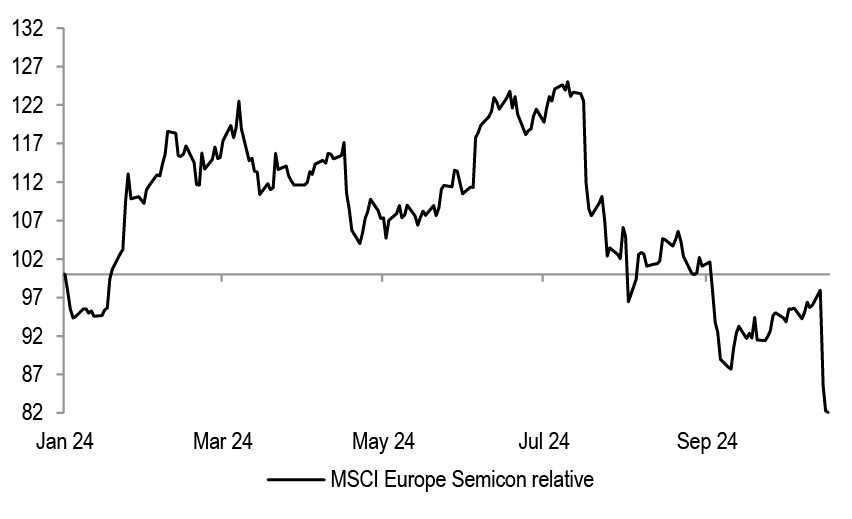
Figure 34: MSCI Europe Semis relative
Source: Datastream
Semiconductors have unwound all their ytd gains, and are now underperforming by 15%. We stay bearish.
...Q4 reporting season is also likely to be weak, where corporates will need to adjust lower lofty 2025 projections; After that, there could be an opportunity for Cyclical sectors
Table 9: US and Europe 2024e and 2025e EPS growth
| 2024e EPS Growth, % | 2025e EPS Growth, % | |||
| Current | Jan '24 | Current | Jan '24 | |
| S&P 500 | 9.5% | 10.8% | 14.9% | 12.8% |
| Stoxx 600 | 2.2% | 6.0% | 9.4% | 9.1% |
Source: IBES
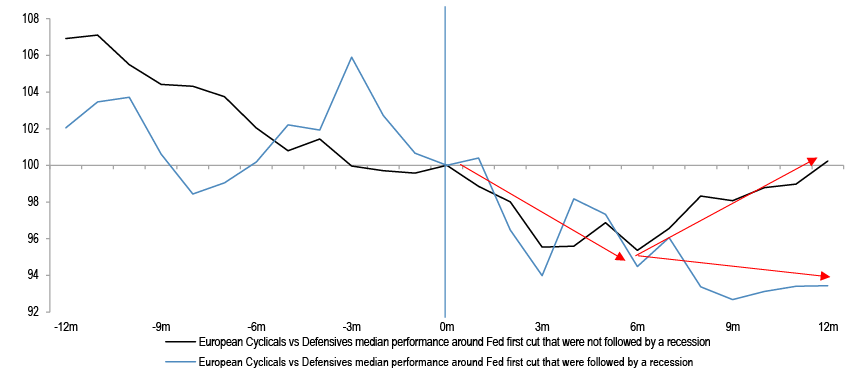
As the consensus EPS growth expectations for this year came down, the implied growth rate for next year increased. We think that Q4 reporting season will also be mixed, and companies will likely use it to lower 2025 growth projections. After that, there could be an opportunity to add to Cyclicals.
Figure 35: European Cyclicals vs Defensives performance around Fed first cut
Source: Datastream
That would align with Fed framework, where Cyclicals start to rally around 6 months post first ease, in the soft landing scenario.
Appendix
Table 10: Q3 Earnings Preview by Sector analysts
| Sector | (+) / (-) | Comments |
| Energy | (+) | Macro is set to (continue to) trump micro into 3Q reporting centred on Middle East risk premium, demand resilience and OPEC+ policy into 1 Dec (tapering of voluntary cuts). With oil forward strips remaining in backwardation sector analysts MTM 2025/26 EPS to the $70 Brent forward O&G scenario analyzed in September (LT $80 unchanged). EU Oils 2025 FCF yield at that deck is a competitive 10.1% with, importantly, an upside sensitivity of ~200bps per $10/bbl (13.8% at $90/bbl). This underpins a fundamental preference for majors which best combine MT leverage and ST resilience - top OWs Shell, Eni, TotalEnergies, OMV. 3Q is characterised by weakened refining and moderated trading; 12M rolling CFFO $160bn is top quartile vs. history but >35% below the 2022 peak. Amidst recent macro volatility, they expect sharp focus on any early perspectives on 2025+ TSR ahead of FYs. |
| Chemicals | (-) | • The macro environment for industrial chemical companies has remained stubbornly difficult and the key top-down indicators have even worsened materially over 3Q24, meaning that the near-term earnings step-up is likely to remain difficult with more cuts likely especially to 2025 consensus (JPMe 2025e EBITDA is 4% below consensus on average). • The timing and magnitude of earnings recovery, which could be substantial, from any material upside in the Chinese macro from the recent/future stimulus actions as well as demand recovery over 2025-26 from the ongoing interest rate cut cycles remains uncertain. • EU chemical stocks valuation, on average, remains at a significant discount to global peers, even on depressed 2024 earnings, and this is prompting a step-up in potentially value-creative portfolio actions. |
| Metals & Mining | (-) | Sector analysts recommended reducing European metals exposure at current levels to mitigate potential trade and tariff-related risks given the mixed near-term risk/reward balance. Similarly, their steel sector outlook remains cautious, with global steel prices likely to remain depressed by ~100Mt of China steel exports. JPM EMEA Metals & Mining proprietary supply and demand forecasts indicate steel oversupply; thus, they expect weak profitability for European steelmakers to persist into 2025. Consequently, they lower our steel price forecasts, driving downgrades to JPM 2025E EBITDA, and they sit ~10% below consensus. |
| Construction Materials | (+)/(-) | Building Materials - Overall for Q3, sector analysts see limited earnings momentum with risks likely skewed to the downside, driven by adverse weather conditions, and thus they could see some vulnerability on Q3 prints. They think a key focus during the season (beyond near term earnings) will be on preliminary 2025 expectations and if backlogs/Management commentary is supportive of positive volume development and thus capacity for the sector to absorb price increases next year. From a stock-level perspective, they continue to favour 1) Saint-Gobain over Sika and 2) Travis Perkins over Howdens, with the latter on Negative Catalyst Watch; and within Heavyside, they are comfortable with the pairing of CRH vs Buzzi, though they think expectations for Heidelberg are rather underwhelming, with +1% LFL EBITDA growth, versus +7% LFL EBIT growth expected at Holcim. Infrastructure - Heading into Q3, they see little risk of disappointment to expectations in the sector, noting performance has lagged the overall market YTD. Although not specific to Q3, they continue to find risk-reward more positive for French stocks, which have been heavily impacted by the French political turmoil and where our sensitivity analysis suggests the market reaction to tax rises has been overdone. In toll roads, into Q3 results, they are most positive on Vinci & Eiffage where they see traffic on French toll roads returning to growth, and expect continued robust momentum in contracting. They expect traffic at Ferrovial’s major asset, the 407-ETR, to lag and remain 1% below the 2019 level, but robust trends at the US ML (albeit with continued impact from profit sharing at some assets). They continue to see more risk on traffic expectations in Q4/FY 25 at Fraport and remind that they have recently upgraded ADP to OW and downgraded Aena to N. Lastly on Getlink, it is too early to see an inflexion point in performance in Q3, although they reiterate their expectations that anti-social dumping law enforcement should help in the coming months. |
| Capital Goods | (+)/(-) | Top-down data-points, company commentary during the September conference season and catch-up calls all point to a backdrop where the majority of end markets are mostly flat/slow/slowing, an overall lacklustre backdrop and one consistent with the ‘two-speed’ world sector analysts described last quarter of ‘electrification and then everything else’. On electrification, across the full electricity value chain and including datacenters, they expect another strong quarter, even though core construction markets remain mostly soft. Outside of that there seems almost nowhere where Q3 commentary has improved and a number of areas where it has declined; general industrial, consistent with PMIs, and automotive, underlined by a stream of profit warnings, stand-out as incrementally worse or at least worse than earlier expectations. The momentum in oil & gas and associated process markets has not reached the heights we expected; mining is solid enough, but really only flattish at present, while pharma and food & beverage remain mixed. The hopes for an improvement in 2025 - semis, resi construction amongst others - are not yet seeing the inflection. A number of markets seem to be being impacted by a slowing in decision-making, perhaps ahead of the US election. By region, Europe manufacturing PMIs remain weak, worryingly so in Germany, the US ISM remains at a low level and China PMIs are weaker than earlier in the year. In short, a lacklustre backdrop though not one outright ‘bad’ given they still expect ~3% organic sales growth in the quarter. |
| Aerospace & Defense | (+)/(-) | Civil Aerospace: AIR had weak deliveries in Q3 24 and sector analysts expect a fairly soft quarter. However, the aero engine companies continue to benefit from very strong aftermarket sales (up c20+% yoy in Q3). Indeed, MTU Aero Engine positively pre-announced its Q3 24 results on Oct 15th. Defence: They expect a fairly undramatic Q3 with companies generally on track to make their FY24 guidance. It is worth remembering that continental European Defence companies on average generate c50% of their FY24 EBITA in Q4 each year, so Q3 is not so important. The outlook for European Defence will be a lot clearer after the US presidential election. |
| Luxury | (-) | Q3 24 reporting season for the luxury industry already started last week, with soft trading updates from LVMH and Ferragamo. These updates failed to reassure investors on growing concerns around slowing Chinese consumers, while confirming that the other nationalities are still yet to inflect back to growth. Overall this early reporting confirmed sector analysts views that luxury fundamentals might remain challenged into year end and 2025, with very limited growth for the sector. Overall, they expect the rest of Q3 24 reporting to further confirm muted trends for the luxury sector, with growth broadly in line with Q2 despite easing comps. They think the main focus of this reporting will be comments from luxury executives regarding China stimulus measures and whether there has been any early evidence of a positive impact on luxury spend specifically. As the consumer environment is turning more volatile, they expect even more polarised performance in the industry with the turnaround stories in particular are likely to remain under most pressure. One of the questions they have received most in recent weeks is whether, following the de-rating, it is now time to step back into the sector. In the context of very muted profit growth, at best, and possibly still not being at the last estimates cut, they see no reason yet to turn more constructive on the sector overall. |
| Retailing | (+) | For calendar Q3, sector analysts expect top-line growth to have been helped by more favourable weather across regions, particularly given generally soft comparatives in Sep. Indeed, several retailers across their coverage have already disclosed very solid Sep trading. More broadly, in Europe across key regions they track, clothing sales averaged +2% yoy in Jul/Aug vs -2% yoy in Q2. Likewise in the UK, clothing retail sales across all data sources they track showed an acceleration in Q3 vs Q2. They would also note that a strong start to Autumn/ Winter selling should be generally supportive for gross margins in the quarter and bring less markdown risk into Q4. The big ticket category has not seen the same acceleration, although has been relatively steady (rather than showing any signs of weakening). |
| Staples | (+)/(-) | Into H2, sector analysts expect the focus to be on the balance of volumes recovery versus easing pricing and accelerated promo and marketing, as well as demand risks in US and China (both on volume and pricing), especially across Beauty and Spirits. They expect Staples adj. FY24 EPS growth to be led by Ingredients 17% and Beers 10%, whilst Food/HPC and Soft Drinks to see 7%, and Spirits remaining weak at -7%. Staples has returned to its long-term PE NTM of 19x and premium to the market of 45%, after underperforming the market YTD, which appears oversold and with the potential for bond proxy support from weakening interest rates. Convergence of multiples continues keeping them wary that high valued stocks are at risk of de-rating as top-line growth decelerates. They favour companies with building volumes momentum and cost tailwinds to margin with valuation support - Unilever/ Danone/ Kerry/Symrise/ABI/Heineken/PUIG/ Beiersdorf all OW. They remain cautious on Spirits amid still deteriorating demand even though we acknowledged of the derating and earnings rebase YTD. |
| Medtech | (-) | Opportunities look limited and uncertainties still persist, all while expectations look full and the sector’s valuation still relatively unattractive (at 22x FY25E PER). Despite near term drop-off/ annualization of several headwinds for the sector, sector analysts think near-term performances will be largely dependent on Management teams’ ability to manage FY25 expectations at Q3 results. They have seen early indications on this from the Gerresheimer profit warning, where Management reset FY24 and FY25 outlook and shares were down 18% on the day of the announcement. Against the current backdrop, they continue to prefer names with compelling valuations. Stock-level convictions are for: • Top long: S&N (OW, AFL) and Fresenius SE (OW) • Top short: Carl Zeiss (UW, Negative Catalyst Watch) and FME (UW) |
| Banks | (+)/(-) | The Banks sector has outperformed the Market by c17% YTD total return, now trading on 7.4x PE, 1.0x PTNAV for a RoTE of 13.7% 2026E. Our sector analysts have taken a bottom up approach to stock selection where they see a) above average pre-provision operating profit growth, b) non-interest income gearing given the declining rate outlook, particularly through investment banking revenues, iii) cost discipline, iv) high payout potential especially in cash terms. Their Top Picks are DBK, BARC, UBS, UCG, ISP. Key topical areas include 3Q results as well as forward looking commentary across 2024 and the medium term: 1) The NII outlook/sensitivities considering Euro rate cuts, with a) volatile rate curves with the forward curve lower compared to 2Q and indicating ECB rate cuts towards 2% in the medium term, b) rising deposit betas and the deposit pricing actions following rate cuts, c) ongoing risks of deposit migration particularly with rates declining, d) higher wholesale funding costs with refinancing needs (e.g. TLTRO, TFSME), e) hedging actions. Commentary around the outlook for loan growth and potential impact of lower rates on loan demand, asset pricing and margins will also be in focus. 2) The outlook for Fees given rising equity markets in 3Q which could impact flows and AUM, IB performance with Global IBs 3Q forecasted at FICC Revenues -4% YoY, Equities Revenues +8% YoY and IBD +26% YoY led by DCM. 3) Inflationary impacts on the cost base which are lagging the decline in headline inflation including stickier wage inflation, as well as the outlook for investment/regulatory spend. 4) Asset quality trends which remain benign except in specific segments (e.g. US consumer, CRE). 5) Capital return for some banks in 3Q (e.g. ING, HSBC) and capital build progression across the sector, with Basel 4 implementation expected from year end. |
| Diversified Financials | (+)/(-) | • Private markets asset managers: While sector analysts lowered their H2 24E carried interest and investment income estimates for most private markets managers following H1 results, they believe investor focus during this quarter will be on the message from management teams on realisations into next year, and they remain constructive on carried interest and investment income expectations for 2025E given improving transaction volumes seen in recent months. With EQT having already reported Q3 numbers, the focus now shifts to ICG which is reporting H1 25 results on 13th November and where they expect solid progress in terms of fundraising and deployment, but we are below consensus on balance sheet returns. Additionally, they have placed Bridgepoint on Positive Catalyst Watch going into their CMD on October 24th, as they believe It will be an opportunity for management to refresh the equity story for the first time since their 2021 IPO and provide some confidence in the growth outlook to investors (especially before Bridgepoint is relatively illiquid and only reports twice a year). • Traditional asset managers: Despite solid market performance continuing across public markets, they expect flows to continue to gravitate towards lower margin products such as passive and money market as well as active fixed income, which could prevent a material rerating of the shares in the short term. On the flipside, their European Flow Tracker for Q3 24 pointed to a notable improvement of open ended long-term net flows at Abrdn (N) and good progress for Schroders’ open ended fund flows (OW) as well. • Exchanges: They think Q3 will be dominated by the Euronext CMD where they expect Euronext will provide updated targets around revenue and EBITDA growth to 2027E. They also expect additional colour on key initiatives (e.g., fixed income trading, derivatives trading & clearing) as well as M&A and capital distribution. For LSEG, they expect all eyes to be on the development of ASV as well as on any updated on the Microsoft product rollout. On a similar note, they expect the focus to be on Investment Management Solutions for Deutsche Börse , with a focus on the growth momentum for SimCorp. • Wealth platforms: They are most cautious on the Nordics due to NII headwinds and have placed Avanza on Negative Catalyst Watch reflecting additional idiosyncratic downside risks in relation to increased competition in Sweden from Nordnet and potential hikes in OpEx/CAPEX to enable their cloud migration. Looking at the UK, Quilter has already reported a very strong set of numbers, including a material beat on net flows), while St. James’s Place had a very reassuring Q3 24 print which highlighted the strong Q2 was not a one-off. |
| Insurance | (+) | Sector analysts remain positive on the European Insurance sector into 3Q earnings given stronger life insurance growth trends over the year to date than in 2023, and their belief that concerns around negative experience variances impacting the CSM of life insurance names will likely settle. In non-life they expect continued positive margin developments as strong pricing trends in retail lines earlier in the year and in some commercial (re)insurance lines continue to earn through. Overall, they continue to believe that consensus earnings expectations for the sector are low and the sector could outperform these into FY24E results. There will be a lot of focus on recent nat cat losses, including early estimates and guidance from non-life (re)insurers on the impact of the Hurricanes Milton and Helene in the US, as well as other major weather events (e.g. in Canada). Their sense is that the likely industry losses from these events will probably be lower than initially feared in the days leading up to Storm Milton but it is still likely to be a substantial event. They expect a lot of focus on what this could mean for pricing, particularly reinsurance pricing. They expect property cat reinsurance pricing to still be slightly down in 2025 in spite of weather events leading to downgrades for reinsurers if claims are beyond Q4 loss budgets given very strong 1H underwriting performance from the reinsurers. |
| General Healthcare | (+)/(-) | Sector analysts anticipate a mixed 3Q’24 earnings season for EU Pharma where they are MSD below to in-line with Consensus for 3Q earnings, though Consensus FY24 forecasts should remain broadly unchanged, given they anticipate the majority of companies to either reiterate or modestly upgrade their LC 2024 guidance. They therefore overall don’t see big FY24 revisions post 3Q, despite quarterly softness for Astra, GSK and Novo. |
| Software | (+) | Q3 cloud revenue growth could see a minor headwind from the discretionary/transactional business. That said, overall demand remains robust which should allow backlog growth to remain solid and SAP should continue to see upside to EBIT/FCF as restructuring benefits continue to flow through. Dassault Systemes – limited visibility into Q3 given recent volatility and potential headwinds/delays that could persist (automotive, aerospace, French election etc). That said, CFO comments at a recent conference suggest a degree of comfort around guidance and closing out any slipped deals from Q2 could also be supportive. Sector analysts base case is towards the lower end of current FY guidance, with upside from potentially closing a mega deal in Q4. Capgemini - They expect investor focus to centre on the pace of sequential growth improvement into Q3 (JPMe -1.2% yoy organic growth implying ~110bps sequential acceleration vs. Q2’24), any commentary around automotive and aerospace outlook (given recent profit warnings from European OEMs and labour strikes), growth developments across North America and Europe (particularly France), GenAI commentary, headcount evolution and any changes in discretionary spending. Sage – FY25 guidance unlikely to surprise positively given (1) growth moderation (whilst slowing) is still occurring, (2) management may want to lean conservative given challenging macro. They think growth guidance mid-point may fall slightly below current 2025 consensus growth, while on margins consensus already builds in the midpoint of the level that management would typically talk to (50-100bps). However, if guidance is deemed sufficiently de-risked they can see a path for investor conviction to begin building again. |
| Telecoms | (+) | Expect a robust quarter, with trends similar to Q2, in contrast to growing uncertainties elsewhere. |
| Utilities | (+) | Sector analysts expect European utilities to continue to report robust earnings in Q3, maintaining the trend of meeting or beating the run rate of 2024 guidances across the board and therefore (again) putting upside pressure eon consensus earnings. Generation & Supply profits should be well supported by strong hydro conditions, volume growth thanks to the heat waves during the summer and the recovery in power prices feeding through into the achieved prices by the merchant portion of the portfolio. Besides, they expect the larger integrated utilities to have captured incremental margins thanks to the volatility in the gas and the power price and the optionality provided by their integrated portfolios and trading platforms. Results in the network operations should be less surprising and attention in this segment should be more focused on regulatory announcements due in December, particularly in the UK, Spain and Italy. |
Source: J.P. Morgan.
Equity Strategy Key Calls and Drivers
At the market level, we looked for consolidation in SX5E through summer, and stay with that call, for now. We are not out of the woods yet on the political front, both internally and with respect to US elections, and Eurozone PMIs keep weakening. China stimulus news is helpful, but it works with a lag - current soft China M1 points to a further rollover in Euro activity from here. The key driver of equity markets will remain the growth outlook. Here, the soft landing call is universally accepted, but it might not be getting a full confirmation for a while longer, global manufacturing PMI new orders to inventories ratio is sliding and certain labour market indicators are mixed. After the bounce back in bond yields in the past weeks, they could resume moving lower, on falling inflation, mixed activity, as well as given continued rate cuts. China stimulus is so far mostly monetary in nature, and even as it might aid direct equity exposure, it is likely not yet a game changer to counter structural growth headwinds, we remain bearish on Autos in particular. In terms of style positioning, we have in June reversed our longstanding preference for large over small caps, and believe small caps are attractive on a 1-2 year horizon, from here. Within Europe, we believe UK stays an OW.
Table 11: J.P. Morgan Equity Strategy — Factors driving our medium-term views
| Driver | Impact | Our Core Working Assumptions | Recent Developments |
| Global Growth | Neutral | Hard labour market data has been a bright spot, but that can change quickly | Global composite PMI is at 48.8 |
| European Growth | Positive | Activity momentum is slowing | Eurozone Manufacturing PMI is at 45.0 |
| Monetary Policy | Neutral | Fed started cutting, but likely in the backdrop of weakening growth, and not just due to more benign inflation prints | |
| Currency | Neutral | USD could strengthen again | |
| Earnings | Negative | Earnings resiliency to fade, profit margins are at risk | 2024 EPS projections are continuing their downtrend |
| Valuations | Negative | At 22x, US forward P/E is still stretched, especially vs real yield | MSCI Europe on 13.7x Fwd P/E |
| Technicals | Negative | Sentiment and positioning are on the complacent side | Households’ equity weight as a share of total assets is at record high |
Source: J.P. Morgan estimates
Table 12: : Base Case and Risk
| Scenario | Assumption |
| Upside scenario | No further hawkish tilt by the Fed. No landing |
| Base-case scenario | Inflation to fall further, risk of downturn still elevated. Earnings downside from here |
| Downside scenario | Further Fed tightening and global recession to become a base case again |
Source: J.P. Morgan estimates.
Table 13: Index targets
| Dec '24 Target |
17-Oct-24 | % upside | |
| MSCI Eurozone | 256 | 295 | -13% |
| FTSE 100 | 7,700 | 8,385 | -8% |
| MSCI EUROPE | 1,850 | 2,082 | -11% |
| DJ EURO STOXX 50 | 4,250 | 4,947 | -14% |
| DJ STOXX 600 E | 460 | 524 | -12% |
Source: J.P. Morgan.
Table 14: Open trades
| Trade | Ticker | Date of inception | % change since inception |
| Long MSCI Europe Healthcare | MSRLHC Index | 07/10/2024 | 2% |
| Long FTSE250 vs FTSE100 | MCX Index vs UKX Index | 07/10/2024 | 1% |
| Short MSCI Eurozone Banks vs MSCI Eurozone | MIULBANK Index vs MSDLEMU Index | 07/10/2024 | -1% |
| Long MSCI Europe Energy | MSRLENRG Index | 07/10/2024 | -4% |
| Long MSCI Europe Aerospace & Defence | MIRLAEDE Index | 07/10/2024 | 6% |
| Long MSCI Japan Small Caps | MCLAJN Index | 07/10/2024 | -2% |
| Long Topix | TPX Index | 07/10/2024 | -2% |
| Short MSCI Europe Autos vs MSCI Europe Luxury | MSRLAUTO Index vs MSRLCDUR Index | 07/10/2024 | -7% |
We are closing our Long MSCI Europe Aerospace Defense trade
Source: J.P. Morgan, Bloomberg Finance L.P.
Table 15: Key Global sector calls

Source: J.P. Morgan
Table 16: J.P. Morgan Equity Strategy — Key sector calls*
| Sector | Recommendations | Key Drivers |
| Utilities | Overweight | Sector is low beta, has strong cash flow generation, resilient earnings, have strong pricing and less regulatory uncertainty |
| Healthcare | Overweight | Potential rebound in dollar will aid the sector, earnings are holding up |
| Staples | Overweight | Valuations have improved significantly, lower bond yields and better relative EPS momentum should help |
| Banks | Underweight | vulnerable to peaking earnings, NII likely peaking, falling central bank rates and rising deposit betas |
| Autos | Underweight | Cheap, but with structural concerns and vulnerable to potential slowing in consumer, pricing and volume could come under pressure |
| Chemicals | Underweight | The sector trades at 65% premium to the market, well above historical norm. pricing remains weak, downside risks to current earnings and margin projections |
Source: J.P. Morgan estimates. * Please see the last page for the full list of our calls and sector allocation.
Table 17: J.P. Morgan Equity Strategy — Key regional calls
| Region | Recommendations | J.P. Morgan Views |
| EM | Neutral | Trade uncertainty could pick up again, risk of stronger USD |
| DM | Neutral | |
| US | Neutral | Expensive with earnings risk |
| Japan | Overweight | Large rate differential, TSE reforms, consumer reflation, but JPY needs to show stability |
| Eurozone | Neutral | Eurozone growth differential bottoming, cheap, wait for a better entry point |
| UK | Overweight | Valuations still look very attractive, low beta with the highest regional dividend yield |
Source: J.P. Morgan estimates.
Top Picks
Table 18: J.P. Morgan European Strategy: Top European picks
| Market Cap | EPS Growth | Dividend Yield | 12m Fwd P/E | Performance | |||||||||||
| Name | Ticker | Sector | Rating | Price | Currency | (€ Bn) | 23e | 24e | 25e | 24e | Current | 10Y Median | % Premium | -3m | -12m |
| ENI | ENI IM | Energy | OW | 14 | E | 46.5 | -35% | -26% | 3% | 6.5% | 7.6 | 12.2 | -38% | 0% | -9% |
| TOTALENERGIES | TTE FP | Energy | OW | 60 | E | 143.3 | -33% | -12% | -1% | 5.1% | 7.9 | 10.6 | -25% | -5% | -5% |
| SHELL | SHEL LN | Energy | OW | 31 | E | 190.4 | -23% | -3% | -5% | 3.9% | 8.7 | 11.0 | -21% | -7% | -4% |
| CRH PUBLIC LIMITED | CRH LN | Materials | OW | 94 | U$ | 58.7 | -14% | 27% | 9% | 1.4% | 15.9 | 14.8 | 7% | 16% | 61% |
| NORSK HYDRO | NHY NO | Materials | OW | 69 | NK | 11.7 | -60% | 21% | 43% | 3.6% | 9.8 | 12.3 | -20% | 5% | 11% |
| ANGLO AMERICAN | AAL LN | Materials | N | 2338 | £ | 37.6 | -51% | -21% | 11% | 3.2% | 14.7 | 9.5 | 54% | 3% | 3% |
| SCHNEIDER ELECTRIC | SU FP | Industrials | OW | 247 | E | 142.4 | 2% | 13% | 14% | 1.4% | 27.3 | 16.8 | 63% | 9% | 63% |
| ASHTEAD GROUP | AHT LN | Industrials | OW | 5898 | £ | 31.0 | 26% | - | - | 1.3% | 18.3 | 14.1 | 29% | 9% | 19% |
| RYANAIR HOLDINGS | RYA ID | Industrials | OW | 17 | E | 19.1 | - | - | - | 0.0% | 11.1 | 12.6 | -12% | 3% | 16% |
| AIRBUS | AIR FP | Industrials | OW | 141 | E | 111.9 | 10% | -17% | 35% | 1.3% | 21.3 | 18.7 | 14% | 7% | 11% |
| MTU AERO ENGINES HLDG. | MTX GR | Industrials | OW | 312 | E | 16.8 | 24% | 21% | 13% | 0.6% | 21.2 | 18.5 | 15% | 24% | 87% |
| STELLANTIS | STLAM IM | Discretionary | OW | 12 | E | 36.1 | 12% | -53% | 18% | 13.0% | 3.7 | 4.5 | -18% | -36% | -37% |
| BMW | BMW GR | Discretionary | OW | 75 | E | 47.8 | -35% | -23% | 6% | 8.0% | 5.2 | 7.4 | -30% | -16% | - |
| INDITEX | ITX SM | Discretionary | OW | 55 | E | 170.1 | 27% | - | - | 2.2% | 26.6 | 24.0 | 11% | 21% | 56% |
| ADIDAS | ADS GR | Discretionary | OW | 226 | E | 40.6 | -154% | - | 103% | 0.3% | 33.7 | 25.7 | 31% | -3% | 28% |
| RICHEMONT N | CFR SW | Discretionary | OW | 127 | SF | 79.7 | 78% | - | - | 1.9% | 19.4 | 20.8 | -6% | -7% | 20% |
| COMPASS GROUP | CPG LN | Discretionary | OW | 2527 | £ | 51.5 | 50% | 14% | 11% | 1.6% | 24.6 | 21.0 | 17% | 16% | 22% |
| COLRUYT GROUP | COLR BB | Staples | OW | 41 | E | 5.3 | -27% | - | - | 1.9% | 13.6 | 17.6 | -23% | -9% | 1% |
| ANHEUSER-BUSCH INBEV | ABI BB | Staples | OW | 61 | E | 122.3 | -5% | 10% | 12% | 1.3% | 17.9 | 19.1 | -6% | 8% | 19% |
| NOVO NORDISK 'B' | NOVOB DC | Health Care | OW | 817 | DK | 488.8 | 52% | 23% | 26% | 1.2% | 29.5 | 22.9 | 29% | -11% | 15% |
| ASTRAZENECA | AZN LN | Health Care | OW | 12024 | £ | 223.9 | 9% | 11% | 15% | 1.9% | 17.4 | 17.8 | -2% | -2% | 7% |
| SMITH & NEPHEW | SN/ LN | Health Care | OW | 1121 | £ | 11.8 | 1% | 11% | 20% | 2.6% | 13.8 | 18.3 | -24% | 3% | 18% |
| UBS GROUP | UBSG SW | Financials | OW | 28 | SF | 103.9 | -99% | 5397% | 31% | 2.1% | 15.7 | 10.4 | 51% | 2% | 25% |
| NATWEST GROUP | NWG LN | Financials | OW | 363 | £ | 36.2 | 38% | -9% | 3% | 4.7% | 7.4 | 9.8 | -25% | 10% | 57% |
| ING GROEP | INGA NA | Financials | OW | 16 | E | 52.8 | 106% | -6% | 4% | 6.9% | 7.8 | 8.9 | -12% | -6% | 27% |
| INTESA SANPAOLO | ISP IM | Financials | OW | 4 | E | 72.6 | 91% | 15% | 5% | 7.5% | 7.9 | 10.0 | -21% | 9% | 64% |
| LONDON STOCK EXCHANGE GROUP | LSEG LN | Financials | OW | 10490 | £ | 66.9 | 2% | 9% | 12% | 1.1% | 26.9 | 23.1 | 16% | 12% | 28% |
| AMUNDI (WI) | AMUN FP | Financials | OW | 70 | E | 14.4 | 4% | 10% | 7% | 5.8% | 10.2 | 12.5 | -19% | 7% | 34% |
| DASSAULT SYSTEMES | DSY FP | IT | N | 33 | E | 44.0 | 6% | 7% | 8% | 0.6% | 24.2 | 31.7 | -24% | -4% | -7% |
| ASML HOLDING | ASML NA | IT | OW | 634 | E | 253.4 | 41% | -5% | 32% | 1.0% | 26.5 | 27.5 | -4% | -27% | 11% |
| ASM INTERNATIONAL | ASM NA | IT | OW | 513 | E | 25.4 | -8% | 19% | 32% | 0.5% | 29.6 | 17.0 | 74% | -24% | 33% |
| DEUTSCHE TELEKOM | DTE GR | Telecoms | OW | 28 | E | 140.3 | -13% | 14% | 10% | 2.7% | 14.3 | 13.9 | 3% | 17% | 39% |
| BT GROUP | BT/A LN | Telecoms | OW | 148 | £ | 17.7 | 9% | - | - | 5.2% | 8.0 | 8.5 | -6% | 5% | 26% |
| RELX | REL LN | Industrials | OW | 3725 | £ | 83.4 | 12% | 6% | 9% | 1.6% | 28.7 | 19.6 | 47% | 7% | 28% |
| HELLOFRESH | HFG GR | Staples | N | 8 | E | 1.5 | -49% | -99% | 7314% | 0.0% | 22.2 | 18.4 | 21% | 35% | -66% |
| RWE | RWE GR | Utilities | OW | 32 | E | 23.4 | 30% | -54% | -26% | 3.2% | 14.0 | 13.1 | 7% | -4% | -7% |
| ENEL | ENEL IM | Utilities | OW | 7 | E | 74.4 | 15% | 10% | 0% | 5.9% | 10.9 | 11.8 | -8% | 8% | 27% |
| SEGRO | SGRO LN | Real Estate | OW | 848 | £ | 13.8 | 6% | 6% | 7% | 3.3% | 23.1 | 25.5 | -9% | -9% | 15% |
Source: Datastream, MSCI, IBES, J.P. Morgan, Prices and Valuations as of COB 17th Oct, 2024. Past performance is not indicative of future returns.
Please see the most recent company-specific research published by J.P. Morgan for an analysis of valuation methodology and risks on companies recommended in this report. Research is available at http://www.jpmorganmarkets.com
Equity Flows Snapshot
Table 19: DM Equity Fund Flows Summary
| Regional equity fund flows | ||||||||||
| $mn | % AUM | |||||||||
| 1w | 1m | 3m | ytd | 12m | 1w | 1m | 3m | ytd | 12m | |
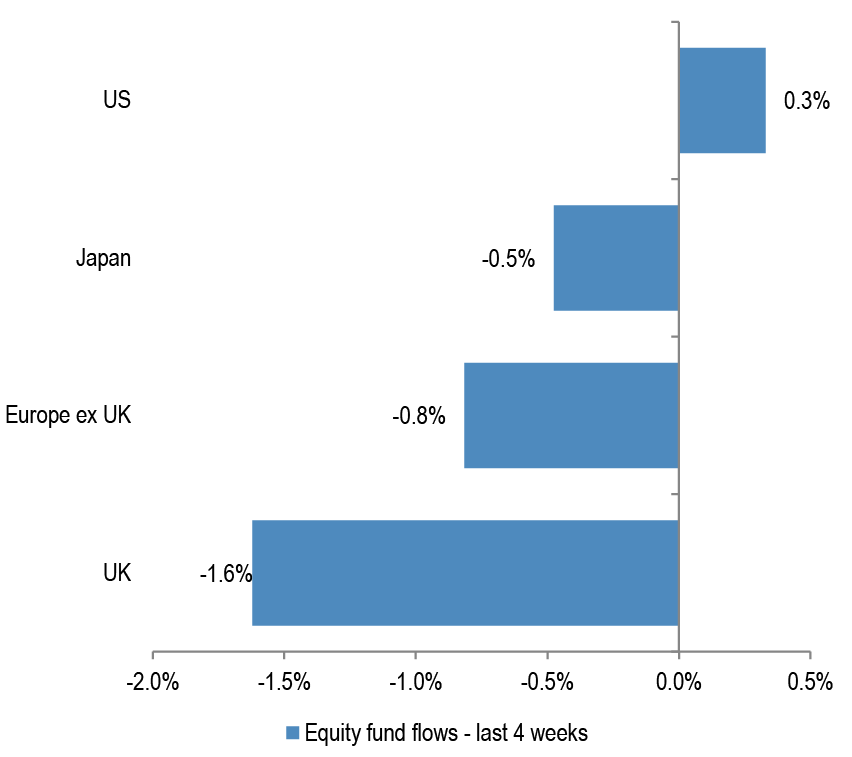
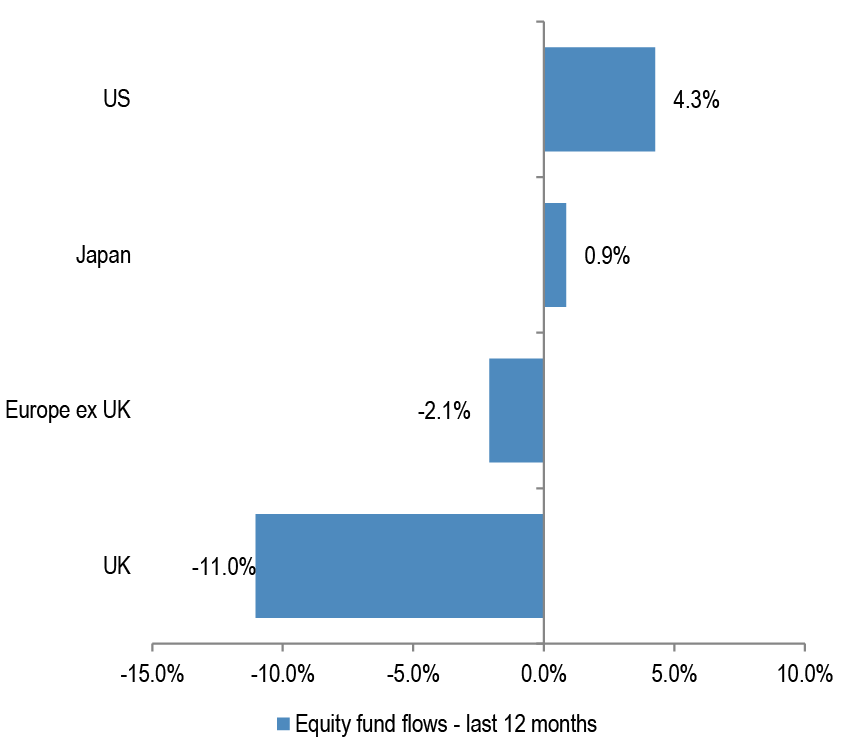
| Europe ex UK | -51 | -2,832 | -3,846 | -4,133 | -5,989 | 0.0% | -0.8% | -1.1% | -1.3% | -2.1% |
| UK | -638 | -4,646 | -8,353 | -23,018 | -27,611 | -0.2% | -1.6% | -3.0% | -8.4% | -11.0% |
| US | 2,694 | 37,580 | 123,921 | 265,212 | 359,426 | 0.0% | 0.3% | 1.1% | 2.7% | 4.3% |
| Japan | -8,831 | -3,895 | 204 | 10,173 | 5,792 | -1.0% | -0.5% | 0.0% | 1.4% | 0.9% |
Source: EPFR, as of 09th Oct, 2024
Figure 36: DM Equity Fund flows – last month
Source: EPFR, Japan includes BoJ purchases.
Figure 37: DM Equity Fund flows – last 12 months
Source: EPFR, Japan includes BoJ purchases.
Figure 38: Cumulative fund flows into regional funds as a percentage of AUM
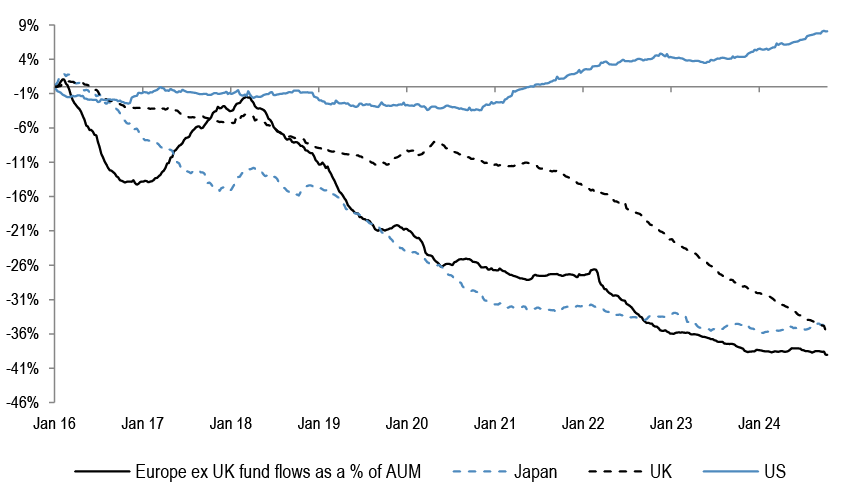
Source: EPFR, as of 09th Oct, 2024. Japan includes Non-ETF purchases only.
Figure 39: Cumulative fund flows into regional equity ETFs as a percentage of AUM
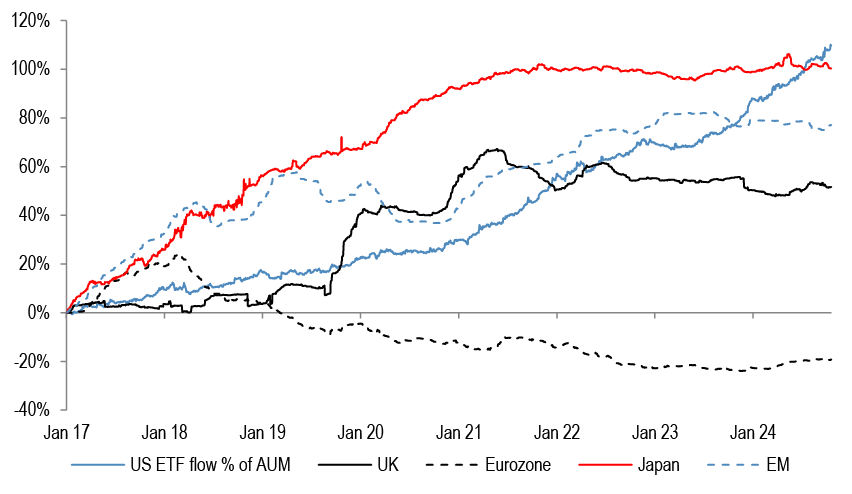
Source: Bloomberg Finance L.P. *Based on the 25 biggest ETF's with a mandate to invest in that particular region. Japan includes BoJ purchases.
Technical Indicators
Figure 40: S&P500 RSI
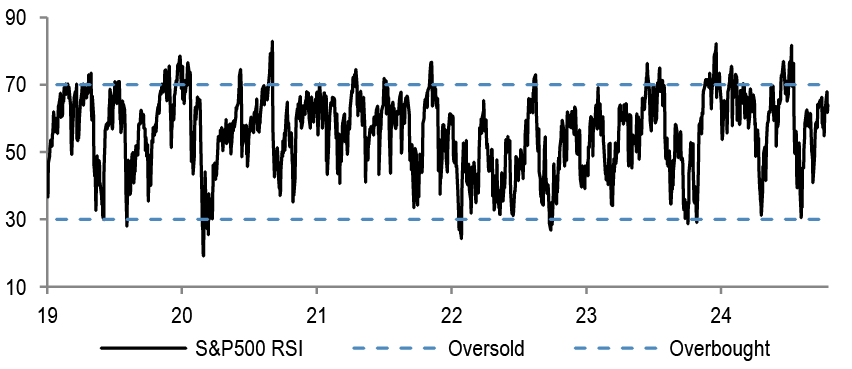
Source: Bloomberg Finance L.P.
Figure 41: EuroStoxx50 RSI
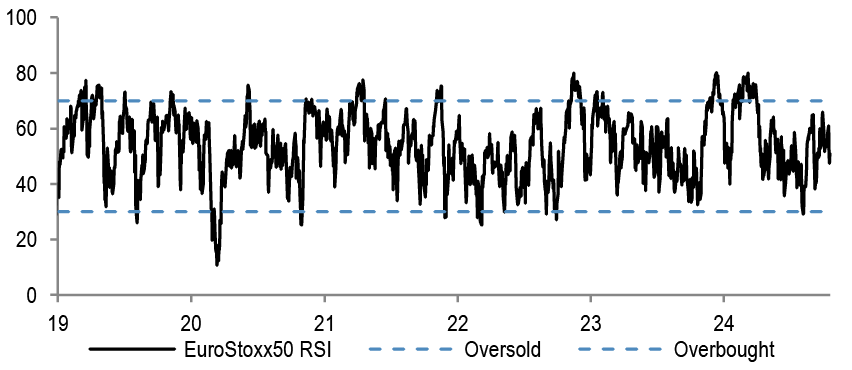
Source: Bloomberg Finance L.P.
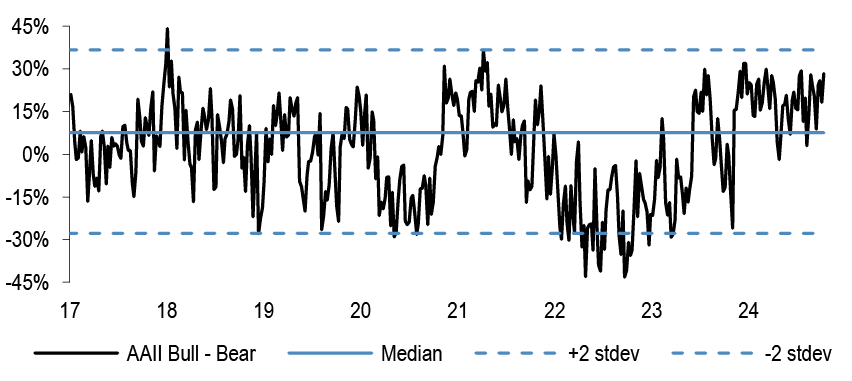
Figure 42: AAII Bull-Bear
Source: Bloomberg Finance L.P
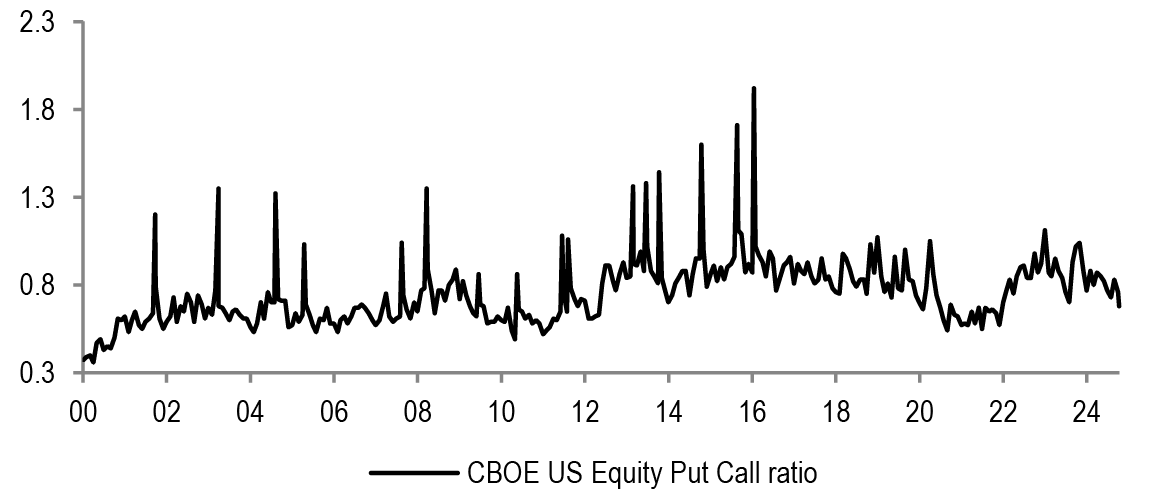
Figure 43: Put-call ratio
Source: Bloomberg Finance L.P.
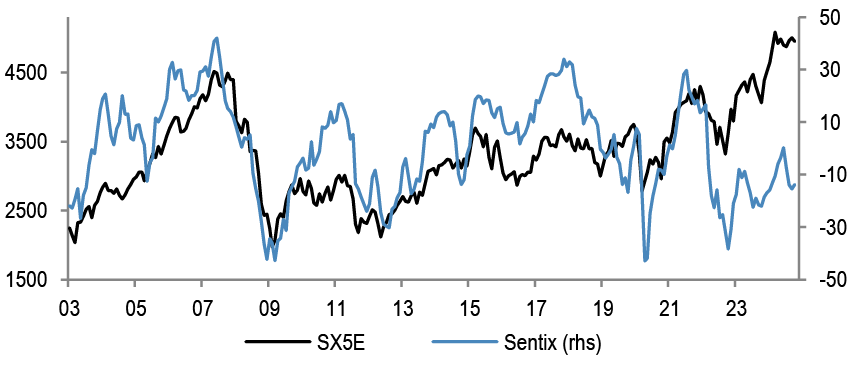
Figure 44: Sentix Sentiment Index vs SX5E
Source: Bloomberg Finance L.P.
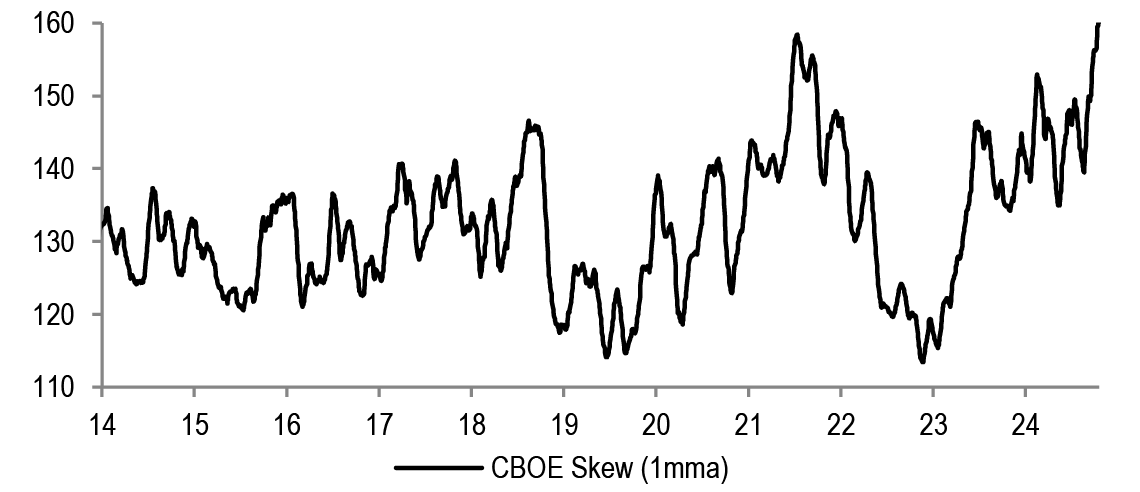
Figure 45: Equity Skew
Source: Bloomberg Finance L.P.
Figure 46: Speculative positions in S&P500 futures contracts
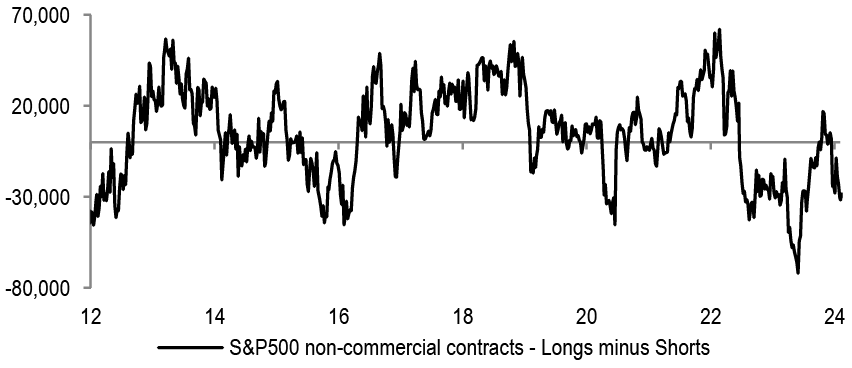
Source: Bloomberg Finance L.P.
Figure 47: VIX
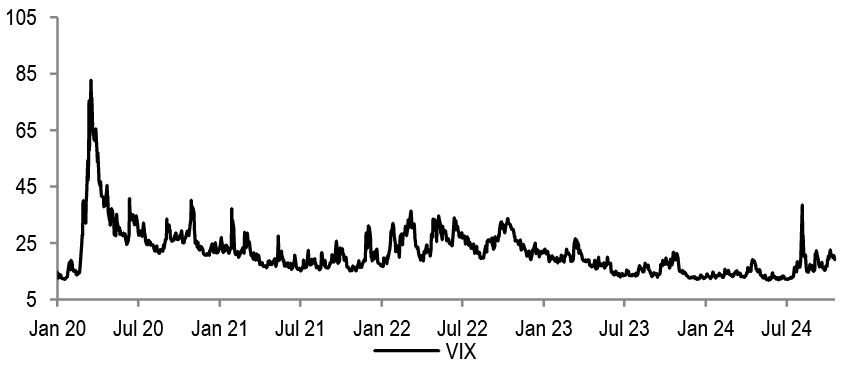
Source: Bloomberg Finance L.P.
Performance
Table 20: Sector Index Performances — MSCI Europe
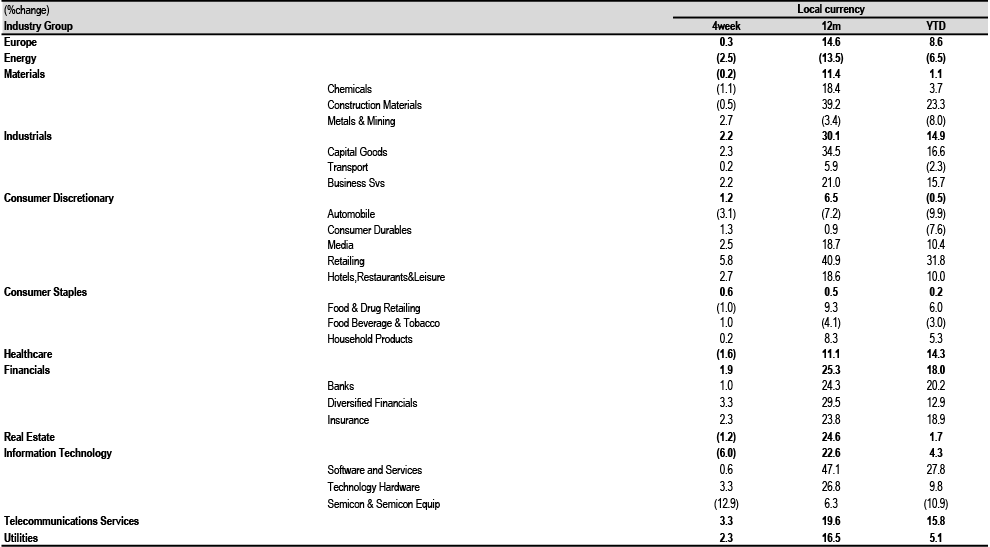
Source: MSCI, Datastream, as at COB 17th Oct, 2024.
Table 21: Country and Region Index Performances
| (%change) | Local Currency | US$ | |||||
| Country | Index | 4week | 12m | YTD | 4week | 12m | YTD |
| Austria | ATX | (1.1) | 14.7 | 5.1 | (3.8) | 17.5 | 3.0 |
| Belgium | BEL 20 | 1.9 | 23.2 | 16.9 | (0.9) | 26.1 | 14.6 |
| Denmark | KFX | (7.0) | 13.9 | 11.2 | (9.5) | 16.7 | 8.9 |
| Finland | HEX 20 | 0.4 | 7.2 | 0.1 | (2.3) | 9.7 | (1.9) |
| France | CAC 40 | (0.4) | 7.9 | 0.5 | (3.1) | 10.4 | (1.5) |
| Germany | DAX | 3.1 | 28.4 | 16.9 | 0.3 | 31.5 | 14.6 |
| Greece | ASE General | 0.7 | 23.0 | 11.3 | (2.0) | 25.9 | 9.0 |
| Ireland | ISEQ | (1.5) | 20.1 | 12.4 | (4.2) | 22.9 | 10.2 |
| Italy | FTSE MIB | 2.9 | 23.5 | 15.4 | 0.1 | 26.5 | 13.2 |
| Japan | Topix | 2.7 | 17.3 | 13.6 | (2.1) | 17.0 | 6.7 |
| Netherlands | AEX | (1.1) | 22.0 | 14.2 | (3.8) | 24.9 | 11.9 |
| Norway | OBX | 2.1 | 5.8 | 8.0 | (1.8) | 6.0 | 0.3 |
| Portugal | BVL GEN | (0.9) | 3.5 | (6.7) | (3.6) | 6.0 | (8.6) |
| Spain | IBEX 35 | 1.1 | 28.0 | 17.8 | (1.7) | 31.1 | 15.5 |
| Sweden | OMX | (0.3) | 19.0 | 7.9 | (3.6) | 23.4 | 3.3 |
| Switzerland | SMI | 2.0 | 13.8 | 10.5 | 0.0 | 18.4 | 7.5 |
| United States | S&P 500 | 2.2 | 33.6 | 22.5 | 2.2 | 33.6 | 22.5 |
| United States | NASDAQ | 2.0 | 35.8 | 22.4 | 2.0 | 35.8 | 22.4 |
| United Kingdom | FTSE 100 | 0.7 | 9.2 | 8.4 | (1.3) | 16.6 | 10.6 |
| EMU | MSCI EMU | 0.3 | 18.0 | 8.5 | (2.4) | 20.8 | 6.4 |
| Europe | MSCI Europe | 0.3 | 14.6 | 8.6 | (2.2) | 18.7 | 7.1 |
| Global | MSCI AC World | 2.1 | 28.5 | 18.9 | 1.3 | 29.4 | 17.9 |
Source: MSCI, Datastream, as at COB 17th Oct, 2024.
Earnings
Table 22: IBES Consensus EPS Sector Forecasts — MSCI Europe
| EPS Growth (%yoy) | |||||
| 2023 | 2024E | 2025E | 2026E | ||
| Europe | (3.9) | 2.3 | 9.0 | 10.1 | |
| Energy | (31.5) | (12.5) | (1.7) | 5.2 | |
| Materials | (39.3) | 2.2 | 15.1 | 10.7 | |
| Chemicals | (39.1) | 26.0 | 16.3 | 14.1 | |
| Construction Materials | 12.7 | 13.5 | 9.6 | 8.7 | |
| Metals & Mining | (46.8) | (15.9) | 14.3 | 7.7 | |
| Industrials | (0.8) | 9.7 | 11.8 | 12.4 | |
| Capital Goods | 19.9 | 12.2 | 14.4 | 12.4 | |
| Transport | (55.3) | (4.3) | (7.7) | 14.5 | |
| Business Svs | 3.1 | 6.0 | 10.7 | 10.9 | |
| Discretionary | 4.7 | (12.5) | 13.6 | 13.0 | |
| Automobile | 1.7 | (25.4) | 11.7 | 11.7 | |
| Consumer Durables | (5.5) | (8.0) | 14.2 | 13.9 | |
| Media | 1.7 | 5.1 | 8.7 | 8.7 | |
| Retailing | 39.7 | 25.5 | 14.0 | 13.4 | |
| Hotels,Restaurants&Leisure | 61.7 | 32.5 | 20.3 | 16.6 | |
| Staples | 2.2 | 1.2 | 6.9 | 7.6 | |
| Food & Drug Retailing | 3.7 | 2.1 | 10.0 | 9.5 | |
| Food Beverage & Tobacco | 1.9 | (1.4) | 6.1 | 7.6 | |
| Household Products | 2.8 | 8.2 | 7.7 | 6.8 | |
| Healthcare | 1.1 | 7.0 | 14.4 | 11.4 | |
| Financials | 15.4 | 11.2 | 5.9 | 9.6 | |
| Banks | 28.8 | 6.2 | 2.2 | 8.0 | |
| Diversified Financials | (19.8) | 29.8 | 15.2 | 18.7 | |
| Insurance | 11.3 | 13.8 | 9.0 | 7.4 | |
| Real Estate | 5.6 | 4.9 | 2.2 | 3.5 | |
| IT | 14.4 | (11.7) | 30.2 | 17.2 | |
| Software and Services | 18.5 | (6.8) | 24.2 | 16.5 | |
| Technology Hardware | (19.1) | 9.7 | 3.9 | 11.3 | |
| Semicon & Semicon Equip | 28.0 | (21.2) | 45.6 | 19.3 | |
| Telecoms | (8.7) | 9.7 | 9.8 | 10.3 | |
| Utilities | 2.1 | 3.3 | (1.2) | 4.3 | |
Source: IBES, MSCI, Datastream. As at COB 17th Oct, 2024.
Table 23: IBES Consensus EPS Country Forecasts
| EPS growth (%change) | |||||
| Country | Index | 2023 | 2024E | 2025E | 2026E |
| Austria | ATX | (27.1) | 7.2 | 1.7 | 5.4 |
| Belgium | BEL 20 | 15.8 | (4.5) | 12.3 | 14.0 |
| Denmark | Denmark KFX | (14.3) | 31.4 | 16.3 | 17.4 |
| Finland | MSCI Finland | (24.9) | (4.6) | 12.4 | 13.9 |
| France | CAC 40 | (1.5) | (4.8) | 8.8 | 9.8 |
| Germany | DAX | 0.2 | (3.4) | 12.6 | 11.4 |
| Greece | MSCI Greece | 45.3 | 11.4 | (1.1) | 5.2 |
| Ireland | MSCI Ireland | 59.9 | 5.4 | (4.4) | 6.8 |
| Italy | MSCI Italy | 9.2 | (12.0) | 6.5 | 7.6 |
| Netherlands | AEX | (1.7) | 0.1 | 11.1 | 10.2 |
| Norway | MSCI Norway | (40.6) | 2.5 | 5.1 | 1.3 |
| Portugal | MSCI Portugal | 16.9 | 14.5 | (2.2) | 8.5 |
| Spain | IBEX 35 | 8.4 | 5.8 | 3.4 | 6.5 |
| Sweden | OMX | 31.4 | 1.2 | 6.6 | 8.3 |
| Switzerland | SMI | (4.6) | 13.6 | 9.5 | 10.4 |
| United Kingdom | FTSE 100 | (10.1) | (1.1) | 7.4 | 9.2 |
| EMU | MSCI EMU | 3.1 | 0.5 | 10.0 | 10.2 |
| Europe ex UK | MSCI Europe ex UK | (0.2) | 3.7 | 9.8 | 10.4 |
| Europe | MSCI Europe | (3.9) | 2.3 | 9.0 | 10.1 |
| United States | S&P 500 | 2.4 | 9.5 | 14.9 | 13.0 |
| Japan | Topix | 18.2 | 9.0 | 9.1 | 8.6 |
| Emerging Market | MSCI EM | (5.6) | 22.6 | 15.3 | 11.6 |
| Global | MSCI AC World | 0.3 | 9.1 | 13.0 | 11.8 |
Source: IBES, MSCI, Datastream. As at COB 17th Oct, 2024** Japan refers to the period from March in the year stated to March in the following year – EPS post-goodwill
Valuations
Table 24: IBES Consensus European Sector Valuations
| P/E | Dividend Yield | EV/EBITDA | Price to Book | |||||||||
| 2024e | 2025e | 2026e | 2024e | 2025e | 2026e | 2024e | 2025e | 2026e | 2024e | 2025e | 2026e | |
| Europe | 14.7 | 13.5 | 12.3 | 3.3% | 3.4% | 3.7% | 8.5 | 8.1 | 7.5 | 2.0 | 1.9 | 1.8 |
| Energy | 7.8 | 7.9 | 7.5 | 6.0% | 5.8% | 6.0% | 3.4 | 3.7 | 3.3 | 1.1 | 1.1 | 1.0 |
| Materials | 17.0 | 14.8 | 13.4 | 3.0% | 3.3% | 3.6% | 8.1 | 7.2 | 6.7 | 1.7 | 1.6 | 1.5 |
| Chemicals | 25.0 | 21.5 | 18.8 | 2.4% | 2.5% | 2.7% | 12.7 | 11.4 | 10.3 | 2.4 | 2.3 | 2.2 |
| Construction Materials | 14.3 | 13.0 | 12.0 | 3.4% | 3.7% | 4.1% | 7.2 | 6.6 | 6.0 | 1.5 | 1.4 | 1.3 |
| Metals & Mining | 11.8 | 10.4 | 9.6 | 3.8% | 4.4% | 4.9% | 5.3 | 4.6 | 4.5 | 1.2 | 1.2 | 1.1 |
| Industrials | 20.6 | 18.4 | 16.4 | 2.2% | 2.4% | 2.7% | 10.5 | 9.7 | 8.9 | 3.4 | 3.3 | 3.0 |
| Capital Goods | 20.8 | 18.2 | 16.2 | 2.1% | 2.3% | 2.6% | 11.4 | 10.1 | 9.1 | 3.5 | 3.4 | 3.1 |
| Transport | 15.0 | 16.2 | 14.1 | 3.1% | 3.1% | 3.3% | 6.0 | 6.6 | 6.3 | 1.8 | 1.8 | 1.7 |
| Business Svs | 24.5 | 22.1 | 19.9 | 2.2% | 2.3% | 2.5% | 13.6 | 13.0 | 11.9 | 6.9 | 6.3 | 5.7 |
| Discretionary | 14.4 | 12.7 | 11.2 | 2.5% | 2.8% | 3.1% | 6.3 | 5.8 | 5.3 | 2.1 | 1.9 | 1.8 |
| Automobile | 6.6 | 5.9 | 5.3 | 4.9% | 5.3% | 5.9% | 2.2 | 1.5 | 1.3 | 0.7 | 0.7 | 0.6 |
| Consumer Durables | 23.1 | 20.2 | 17.8 | 1.8% | 2.0% | 2.3% | 14.0 | 13.1 | 11.6 | 4.3 | 4.0 | 3.6 |
| Media & Entertainment | 17.2 | 15.8 | 14.6 | 2.4% | 2.6% | 2.7% | 12.1 | 9.7 | 9.1 | 2.0 | 2.1 | 2.0 |
| Retailing | 18.4 | 16.1 | 14.2 | 2.0% | 2.2% | 2.4% | 8.8 | 11.6 | 10.2 | 4.4 | 3.7 | 3.4 |
| Hotels,Restaurants&Leisure | 24.1 | 20.0 | 17.2 | 2.3% | 2.5% | 2.8% | 12.4 | 10.9 | 9.8 | 5.4 | 4.9 | 4.3 |
| Staples | 17.4 | 16.2 | 15.1 | 3.1% | 3.3% | 3.5% | 10.8 | 10.1 | 9.4 | 2.9 | 2.8 | 2.6 |
| Food & Drug Retailing | 12.3 | 11.2 | 10.2 | 4.0% | 4.3% | 4.6% | 5.8 | 5.7 | 5.4 | 1.7 | 1.6 | 1.6 |
| Food Beverage & Tobacco | 16.9 | 15.9 | 14.8 | 3.4% | 3.6% | 3.8% | 10.6 | 10.0 | 9.3 | 2.6 | 2.5 | 2.3 |
| Household Products | 20.6 | 19.1 | 17.9 | 2.4% | 2.5% | 2.7% | 13.9 | 13.0 | 12.1 | 4.3 | 4.0 | 3.6 |
| Healthcare | 19.0 | 16.6 | 14.9 | 2.2% | 2.4% | 2.7% | 12.5 | 11.5 | 10.4 | 3.8 | 3.5 | 3.1 |
| Financials | 9.6 | 9.1 | 8.3 | 5.3% | 5.3% | 5.7% | - | - | - | 1.2 | 1.1 | 1.1 |
| Banks | 7.2 | 7.0 | 6.5 | 7.0% | 6.8% | 7.3% | - | - | - | 0.9 | 0.8 | 0.8 |
| Diversified Financials | 15.7 | 13.7 | 11.5 | 2.2% | 2.5% | 2.7% | - | - | - | 1.4 | 1.6 | 1.5 |
| Insurance | 11.7 | 10.7 | 10.0 | 5.1% | 5.5% | 5.8% | - | - | - | 1.9 | 1.8 | 1.7 |
| Real Estate | 15.2 | 14.9 | 14.4 | 3.9% | 4.1% | 4.3% | - | - | - | 0.9 | 0.9 | 0.9 |
| IT | 28.7 | 22.0 | 18.8 | 1.2% | 1.4% | 1.5% | 17.5 | 15.0 | 12.6 | 4.7 | 4.3 | 3.8 |
| Software and Services | 35.7 | 28.7 | 24.6 | 1.2% | 1.3% | 1.4% | 20.4 | 17.4 | 15.0 | 5.0 | 4.5 | 4.1 |
| Technology Hardware | 16.8 | 16.2 | 14.5 | 2.3% | 2.5% | 2.7% | 9.2 | 8.8 | 8.0 | 2.1 | 2.0 | 1.9 |
| Semicon & Semicon Equip | 28.8 | 19.8 | 16.6 | 1.0% | 1.2% | 1.4% | 19.3 | 15.6 | 12.5 | 6.4 | 5.8 | 4.9 |
| Communication Services | 16.0 | 14.6 | 13.2 | 3.9% | 3.9% | 4.2% | 6.9 | 6.5 | 6.1 | 1.6 | 1.6 | 1.5 |
| Utilities | 12.8 | 13.0 | 12.4 | 4.7% | 4.7% | 4.9% | 8.2 | 8.4 | 8.2 | 1.7 | 1.6 | 1.5 |
Source: IBES, MSCI, Datastream. As at COB 17th Oct, 2024.
Table 25: IBES Consensus P/E and 12-Month Forward Dividend Yields — Country Forecasts
| P/E | Dividend Yield | |||||
| Country | Index | 12mth Fwd | 2024E | 2025E | 2026E | 12mth Fwd |
| Austria | ATX | 7.9 | 8.0 | 7.9 | 7.5 | 5.8% |
| Denmark | Denmark KFX | 23.6 | 26.8 | 23.1 | 19.6 | 1.9% |
| Finland | MSCI Finland | 15.8 | 17.4 | 15.5 | 13.6 | 4.3% |
| France | CAC 40 | 13.2 | 14.2 | 13.0 | 11.9 | 3.5% |
| Germany | DAX | 12.6 | 14.0 | 12.4 | 11.1 | 3.3% |
| Greece | MSCI Greece | 21.9 | 21.7 | 21.9 | 20.9 | 2.2% |
| Ireland | MSCI Ireland | 10.8 | 10.4 | 10.9 | 10.2 | 3.5% |
| Italy | MSCI Italy | 10.2 | 10.8 | 10.1 | 9.4 | 5.4% |
| Netherlands | AEX | 14.8 | 16.1 | 14.5 | 13.1 | 2.5% |
| Norway | MSCI Norway | 10.7 | 11.1 | 10.6 | 10.5 | 6.1% |
| Portugal | MSCI Portugal | 15.0 | 14.8 | 15.1 | 13.9 | 3.9% |
| Spain | IBEX 35 | 11.5 | 11.8 | 11.5 | 10.8 | 4.7% |
| Sweden | OMX | 15.1 | 15.9 | 14.9 | 13.8 | 3.7% |
| Switzerland | SMI | 17.1 | 18.4 | 16.8 | 15.2 | 3.2% |
| United Kingdom | FTSE 100 | 11.8 | 12.5 | 11.6 | 10.7 | 3.9% |
| EMU | MSCI EMU | 13.2 | 14.3 | 13.0 | 11.8 | 3.4% |
| Europe ex UK | MSCI Europe ex UK | 14.4 | 15.6 | 14.2 | 12.9 | 3.3% |
| Europe | MSCI Europe | 13.7 | 14.7 | 13.5 | 12.3 | 3.5% |
| United States | S&P 500 | 21.9 | 24.8 | 21.6 | 19.1 | 1.4% |
| Japan | Topix | 13.7 | 14.5 | 13.3 | 12.2 | 2.5% |
| Emerging Market | MSCI EM | 12.4 | 13.9 | 11.8 | 10.8 | 2.8% |
| Global | MSCI AC World | 18.1 | 20.1 | 17.9 | 15.9 | 2.0% |
Source: IBES, MSCI, Datastream. As at COB 17th Oct, 2024; ** Japan refers to the period from March in the year stated to March in the following year – P/E post goodwill.
Economic, Interest Rate and Exchange Rate Outlook
Table 26: Economic Outlook in Summary
| Real GDP | Real GDP | Consumer prices | |||||||||||
| % oya | % over previous period, saar | % oya | |||||||||||
| 2023 | 2024E | 2025E | 1Q24 | 2Q24 | 3Q24 | 4Q24E | 1Q25E | 2Q25E | 2Q24 | 4Q24 | 2Q25 | 4Q25 | |
| United States | 2.9 | 2.7 | 1.9 | 1.6 | 3.0 | 2.7 | 1.3 | 1.7 | 1.7 | 3.2 | 2.7 | 2.1 | 2.3 |
| Eurozone | 0.5 | 0.7 | 1.0 | 1.3 | 0.8 | 1.0 | 1.0 | 1.0 | 1.0 | 2.6 | 2.1 | 1.9 | 1.8 |
| United Kingdom | 0.3 | 0.9 | 0.8 | 2.8 | 1.8 | 1.0 | 1.0 | 0.8 | 0.5 | 3.5 | 2.1 | 2.8 | 3.1 |
| Japan | 1.7 | -0.1 | 1.1 | -2.4 | 2.9 | 1.5 | 1.2 | 1.0 | 0.6 | 2.5 | 2.7 | 3.5 | 2.9 |
| Emerging markets | 4.2 | 4.0 | 3.6 | 6.0 | 1.7 | 3.0 | 4.0 | 3.6 | 3.7 | 4.0 | 3.5 | 3.2 | 3.0 |
| Global | 2.8 | 2.6 | 2.4 | 3.3 | 1.9 | 2.4 | 2.4 | 2.4 | 2.3 | 3.3 | 2.9 | 2.8 | 2.7 |
Source: J.P. Morgan economic research J.P. Morgan estimates, as of COB 17th Oct, 2024
Table 27: Official Rates Outlook
| Forecast for | ||||||||
| Official interest rate | Current | Last change (bp) | Forecast next change (bp) | Dec 24 | Mar 25 | Jun 25 | Sep 25 | |
| United States | Federal funds rate | 5.00 | 18 Sep 24 (-50bp) | Nov 24 (-25bp) | 4.50 | 4.00 | 3.50 | 3.00 |
| Eurozone | Depo rate | 3.50 | 17 Oct 24 (-25bp) | Dec 24(-25bp) | 3.00 | 2.50 | 2.00 | 2.00 |
| United Kingdom | Bank Rate | 5.00 | 01 Aug 24 (-25bp) | Nov 24 (-25bp) | 4.75 | 4.50 | 4.25 | 4.00 |
| Japan | Pol rate IOER | 0.25 | 31 Jul 24 (+15bp) | Dec 24 (+25bp) | 0.50 | 0.50 | 0.75 | 0.75 |
Source: J.P. Morgan estimates, Datastream, as of COB 17th Oct, 2024
Table 28: 10-Year Government Bond Yield Forecasts
| 10 Yr Govt BY | Forecast for end of | ||||
| 18-Oct-24 | Dec 24 | Mar 25 | Jun 25 | Sep 25 | |
| US | 4.09 | 3.90 | 3.65 | 3.50 | 3.40 |
| Euro Area | 2.21 | 2.10 | 2.00 | 1.95 | 1.90 |
| United Kingdom | 4.09 | 3.85 | 3.75 | 3.65 | 3.55 |
| Japan | 0.98 | 1.10 | 1.05 | 1.25 | 1.20 |
Source: J.P. Morgan estimates, Datastream, forecasts as of COB 04th Oct, 2024
Table 29: Exchange Rate Forecasts vs. US Dollar
| Exchange rates vs US$ | Forecast for end of | ||||
| 10-Oct-24 | Dec 24 | Mar 25 | Jun 25 | Sep 25 | |
| EUR | 1.09 | 1.05 | 1.12 | 1.12 | 1.15 |
| GBP | 1.31 | 1.24 | 1.30 | 1.32 | 1.37 |
| CHF | 0.86 | 0.86 | 0.82 | 0.82 | 0.82 |
| JPY | 149 | 142 | 141 | 140 | 139 |
| DXY | 103.0 | 105.5 | 100.3 | 99.9 | 97.7 |
Source: J.P. Morgan estimates, Datastream, forecasts as of COB 04th Oct, 2024
Sector, Regional and Asset Class Allocations
Table 30: J.P. Morgan Equity Strategy — European Sector Allocation
| MSCI Europe Weights | Allocation | Deviation | Recommendation | ||
| Energy | 5.6% | 8.0% | 2.4% | OW | |
| Materials | 7.0% | 6.0% | -1.0% | N | |
| Chemicals | UW | ||||
| Construction Materials | N | ||||
| Metals & Mining | N | ||||
| Industrials | 15.8% | 14.0% | -1.8% | N | |
| Capital Goods ex Aerospace & Defence | UW | ||||
| Aerospace & Defence | OW | ||||
| Transport | N | ||||
| Business Services | N | ||||
| Consumer Discretionary | 9.1% | 7.0% | -2.1% | UW | |
| Automobile | UW | ||||
| Consumer Durables | N | ||||
| Consumer Srvcs | UW | ||||
| Speciality Retail | UW | ||||
| Internet Retail | UW | ||||
| Consumer Staples | 11.7% | 13.0% | 1.3% | OW | |
| Food & Drug Retailing | UW | ||||
| Beverages | OW | ||||
| Food & Tobacco | OW | ||||
| Household Products | OW | ||||
| Healthcare | 16.0% | 18.0% | 2.0% | OW | |
| Financials | 18.1% | 14.0% | -4.1% | UW | |
| Banks | UW | ||||
| Insurance | N | ||||
| Real Estate | 0.9% | 2.0% | 1.1% | OW | |
| Information Technology | 7.1% | 7.0% | -0.1% | N | |
| Software and Services | N | ||||
| Technology Hardware | N | ||||
| Semicon & Semicon Equip | UW | ||||
| Communication Services | 4.5% | 5.0% | 0.5% | OW | |
| Telecommunication Services | OW | ||||
| Media | N | ||||
| Utilities | 4.4% | 6.0% | 1.6% | OW | |
| 100.0% | 100.0% | 0.0% | Balanced |
Source: MSCI, Datastream, J.P. Morgan.
Table 31: J.P. Morgan Equity Strategy — Global Regional Allocation
| MSCI Weight | Allocation | Deviation | Recommendation | |
| EM | 10.0% | 10.0% | 0.0% | Neutral |
| DM | 90.0% | 90.0% | 0.0% | Neutral |
| US | 70.9% | 68.0% | -2.9% | Neutral |
| Japan | 6.2% | 8.0% | 1.8% | Overweight |
| Eurozone | 8.6% | 8.0% | -0.6% | Neutral |
| UK | 3.8% | 6.0% | 2.2% | Overweight |
| Others* | 10.5% | 10.0% | -0.5% | Neutral |
| 100.0% | 100.0% | 0.0% | Balanced |
Source: MSCI, J.P. Morgan *Other includes Denmark, Switzerland, Australia, Canada, Hong Kong SAR, Sweden, Singapore, New Zealand, Israel and Norway
Table 32: J.P. Morgan Equity Strategy — European Regional Allocation
| MSCI Weight | Allocation | Deviation | Recommendation | |
| Eurozone | 51.0% | 48.0% | -3.0% | Neutral |
| United Kingdom | 22.6% | 25.0% | 2.4% | Overweight |
| Others** | 26.5% | 27.0% | 0.5% | Overweight |
| 100.0% | 100.0% | Balanced |
Source: MSCI, J.P. Morgan **Other includes Denmark, Switzerland, Sweden and Norway
Table 33: J.P. Morgan Equity Strategy — Asset Class Allocation
| Benchmark weighting | Allocation | Deviation | Recommendation | |
| Equities | 60% | 55% | -5% | Underweight |
| Bonds | 30% | 35% | 5% | Overweight |
| Cash | 10% | 10% | 0% | Neutral |
| 100% | 100% | 0% | Balanced |
Source: MSCI, J.P. Morgan

Click here for our weekly podcast
Anamil Kochar (anamil.kochar@jpmchase.com) of J.P. Morgan India Private Limited is a co-author of this report.