
U.S. Fixed Income Markets Weekly
Cross Sector P. White, L. Wash, H. Cunningham
Treasury yields and corporate spreads have largely retraced their post-payrolls move, supported by the relative strength of the data and normalization in risk sentiment. Next week we look for initial claims to remain rangebound and we think Chair Powell will provide little clarity at next week’s Jackson Hole symposium. RRP balances have declined to around $300bn and amid the tightening in liquidity conditions, we think QT has a few more months left.
Governments J. Barry, P. White, A. Borges, L. Wash
Markets are pricing in a less dovish path than our forecast, but we remain patient before adding duration given long investor positioning. Jackson Hole speeches have not traditionally led to large yield moves, except in 2020 and 2022; we do not expect clear guidance from Chair Powell next week. We contrast the upcoming easing cycle with other easing cycles: policy is more restrictive than at any point in the last 30 years, pointing toward a deeper easing cycle, but financial conditions are easy and financial stress is low, making the case for a slower pace of cuts. Hold 5s/30s steepeners as a low-beta long with a better carry profile ahead of the first cut. We review June TIC data. Initiate tactical 5yx5y inflation swap longs.
Interest Rate Derivatives S. Ramaswamy, I. Ozil, P. Michaelides, A. Parikh
Policy uncertainty is back, and with it jump risk - stay bullish on short expiry volatility despite apparently rich valuations. Maintain front end swap spread wideners, and add exposure to narrower 10Y swap spreads and a flatter 3s/7s swap spread curve. Position for a flattening of the TU inter-CTD swap spread curve. Reserves and RRP are approaching levels where liquidity is less ample - QT is likely in its end game with a few more months of headroom. An analysis of 3M expiry implieds suggests that election premia being priced currently are lower than in May, and in a smaller post-election time window.
Short-Term Fixed Income T. Ho, P. Vohra
Short-term credit investors continue to favor bank CP/CD FRNs over fixed, with this trend likely to continue in the near term. RRP balances have decreased from their local peak but may be nearing a floor. We review July MMF holdings.
MBS and CMBS J. Sim
Continue to prefer UIC conventionals. The July remit data show that serious delinquency rate for private label CMBS increased to 4.74% and we continue to see elevated levels of DLQ buyouts and loan modifications in the CRE CLO market.
ABS and CLOs A. Sze, R. Ahluwalia
BB subprime auto ABS spreads have recovered, fully erasing the previous week’s widening. We widened our base case CLO T1 AAA new issue spread forecast to 150bp (from 130bp prior) and introduced a 175-200bp risk case in the event of a hard landing.
High Yield N. Jantzen, T. Linares
High-yield bond spreads of 369bp are well inside last week’s wide of 424bp, whereas yields (7.65%) too have fallen to a low since August 2022. And tightening 48bp, 52bp, 55bp off the wide, BB, B, and CCC spreads are now wider by 1bp, 16bp, and 42bp in August, respectively.
Municipals P. DeGroot, Y. Tian, R.Gargan
Elevated tax-exempt supply is expected to persist with market reception beholden to rate volatility. We find value in certain high-quality, high-vol structures and examine sector ratings change over economic cycles.
Emerging Markets L. Oganes
In EM fixed income, we are MW GBI-EM local rates, CEMBI and EMBIGD. EM bond flows were -$1.4bn (-0.36% of weekly AUM, down from -$1.0bn).
Summary of Views
| SECTOR | CURRENT LEVEL | YEAR END TARGET | COMMENT |
| Aug 16, 2024 | Dec 31, 2024 | ||
| Treasuries | |||
| 2-year yield (%) | 4.07 | 3.20 | Maintain 5s/30s steepeners and 75:6 weighted 5s/10s/30s belly-cheapening butterflies to position for higher term premium |
| 10-year yield (%) | 3.89 | 3.50 | |
| Technical Analysis | |||
| 5-year yield (%) | 3.77 | 3.10 | The rally has entered a more linear phase now |
| 5s/30s curve (bp) | 38 | 90 | The curve has broken out of its multi-year base pattern |
| TIPS | |||
| 10-year TIPS breakevens (bp) | 212 | 200 | Initiate tactical 5yx5y inflation swap longs |
| Interest Rate Derivatives | |||
| 2-year SOFR swap spread (bp) | -18 | -6 | Policy uncertainty is back, and with it jump risk - stay bullish on short expiry volatility despite apparently rich valuations. Maintain front end swap spread wideners, and add exposure to narrower 10Y swap spreads and a flatter 3s/7s swap spread curve. Position for a flattening of the TU inter-CTD swap spread curve. An analysis of 3M expiry implieds suggests that election premia being priced currently are lower than in May, and in a smaller post-election time window. |
| 5-year SOFR swap spread (bp) | -29 | -22 | |
| 10-year SOFR swap spread (bp) | -44 | -37 | |
| 30-year SOFR swap spread (bp) | -80 | -79 | |
| Agency MBS | |||
| FNMA 30yr 5.5% Front Tsy OAS (bp) | 24 | 25 | Mortgages tightened on the back of weaker economic data |
| RMBS Credit | |||
| CRT M1B/M2 (DM@10CPR) | 1MS + 170bp | 1MS + 175bp | At the top of the capital structure, higher coupons (5.5-6.5s) do not have a ton of refinancing pressure in the near term. Spreads should hold firm. In credit, home prices remain supportive, but spreads are very tight. We look for more sideways moves in the second half. |
| RMBS 2.0 PT (6s) | 1-16bk of TBA | 1-12bk of TBA | |
| AAA Non-QM | I + 140bp | I + 150-175bp | |
| ABS | |||
| 3-year AAA card ABS to Treasuries (bp) | 50 | 40 | ABS spreads mostly stable over the first two weeks of July, with strong bids for benchmark credit card and FFELP ABS |
| CMBS | |||
| 10yr conduit CMBS LCF AAA | 103 | 95 | LCF AAAs look Freddie K A2 spreads look about fair to their corporate and mortgage comps. |
| 10yr Freddie K A2 | 53 | 48 | |
| Investment-grade corporates | |||
| JULI spread to Treasuries (bp) | 111 | 110 | HG spreads recovered from the sell-off and are back close to our YE target. Expecting a grind tighter into month-end so long as yields remain rangebound. |
| High yield | |||
| Domestic HY Index spread to worst (bp) | 368 | 380 | We believe HY spreads will be supported in the near-term by resilient earnings, steady inflows, and lighter capital market activity in 3Q |
| Credit Derivatives | |||
| High Grade (bp) | 52 | 50 | Credit has outperformed relative to both equity and equity volatility in the recent selloff. Buying CDS index protection funded by selling VIX futures screens attractive at current levels |
| High Yield | $106.5/337bp | 350 | |
| Short-term fixed income | |||
| EFFR (%) | 5.33 | 4.10 | Funding conditions should remain benign, with liquidity remaining abundant, limiting any potential impacts to EFFR/SOFR, T-bills/OIS, and CP/OIS spreads. We do not expect MMF reform to have any outsized impact on money market credit spreads. Treasury repo clearing remains work in progress, though concerns about readiness are emerging. |
| SOFR (%) | 5.35 | 4.10 | |
| CLOs | |||
| US CLO Primary AAA (Tier 1, bp) | 135 | SOFR + 150 | We widened our base case CLO T1 AAA new issue spread forecast to 150bp (from 130bp prior) and introduced a 175-200bp risk case in the event of a hard landing. |
| Municipals | |||
| 10-year muni yield (%) | 2.82 | 2.10 | Finding sustained market consensus while navigating transition to an easing cycle may be difficult, but we suggest playing the long game, and buying municipal bonds with a longer term perspective, particularly in periods where Treasuries sell-off. We suggest adding idiosyncratic municipal risk opportunistically on market weakness, and highlight potential market cheapening in the period before the election. |
| 30-year muni yield (%) | 3.57 | 3.10 | |
| Emerging Markets | |||
| Hard currency: EMBIG Div (bp) | 400 | 400 | MW EMBIGD |
| Hard currency: CEMBI Broad (bp) | 230 | 220 | MW CEMBI Br |
| Local currency: GBI-EM yield (%) | 6.25% | 5.58% | MW local rates |
Source: J.P. Morgan
US Fixed Income Overview
Roundtrip
- Economics: Headline CPI rose 0.2% last month while the core index increased 0.165%, leaving the year-ago rate to moderate to 3.2%. Meanwhile total retail sales increased 1.0% m/m while the control series rose 0.3% last month. Initial claims declined to 227k and we expect filings to remain roughly constant at 230k at the next print
- Treasuries: Markets are pricing in a less dovish path than our forecast, but we remain patient before adding duration given long investor positioning. Jackson Hole speeches have not traditionally led to large yield moves, except in 2020 and 2022; we do not expect clear guidance from Chair Powell next week. We contrast the upcoming easing cycle with other easing cycles: policy is more restrictive than at any point in the last 30 years, pointing toward a deeper easing cycle, but financial conditions are easy and financial stress is low, making the case for a slower pace of cuts. Hold 5s/30s steepeners as a low-beta long with a better carry profile ahead of the first cut.
- Interest Rate Derivatives: We remain long volatility expressed in 5-year tails as elevated policy uncertainty leads to higher jump risk and more frequent jump days. Normalizing repo rates are likely to bias the front end of the swap spread curve wider while ongoing QT and elevated Treasury supply are likely to bias the long end narrower. We favor 3s/7s maturity matched swap spread curve flatteners. Liquidity conditions have tightened and we think QT is in its endgame, with reserves likely to reach $3tn and RRP balances slightly below $300bn by YE24
- Short Duration: RRP balances have trended lower, reaching $330bn on 8/16, and positive T-bill issuance over the past couple weeks has likely contributed to this trend. That said, we may be reaching a floor as net T-bill issuance stalls in early-September and as MMFs keep some amount of exposure meet liquidity needs. We expect RRP balances to hover near low to mid-$300bn range for the remainder of the month
- Securitized Products: Higher coupons outperformed lower coupons, reflecting shifting demand and relative value up the stack. We prefer UIC conventionals and are underweight 4.5s and 5s. We think mortgage rates can fall to 6% by year-end, but this will have a limited impact on house prices. In CMBS, we think upper IG mezz bonds look cheap to similar duration single-A corporates
- Corporates: HG spreads have now nearly round tripped the most recent selloff. Demand remains solid, especially from overseas investors but the 10s30s spread curve has lagged as yields nudge lower and long-end supply picks up.We revise higher our CLO T1 AAA new issue spread YE24 forecast from 130bp to 150bp
- Near-term catalysts: Aug flash manufacturing PMI (8/22), Aug flash services PMI (8/22), Jackson Hole Symposium (Aug 22-24), Aug Employment (9/6)
Must Read This Week
Flows & Liquidity: How much liquidity deterioration?, Nikolaos Panigirtzoglou, 8/14/24
U.S. Bond Futures Rollover Outlook: September 2024 / December 2024, Srini Ramaswamy
US: The when and why of intermeeting Fed rate cuts, Michael Hanson and Michael Feroli, 8/9/24
US: Peering through the choppiness in claims, Abiel Reinhart, 8/9/24
Focus: Concerning signs as balance sheets normalize, Murat Tasci, 8/9/24
Gradualism under pressure, Bruce Kasman, Joseph Lupton, and Nora Szentivanyi, 8/7/24
‘Mission Accomplished’ on MBS vs HG Corps, Nathaniel Rosenbaum and Nick Maciunas, 8/6/24
And Now Hear This…
At Any Rate - July CPI, Jackson Hole, and Jittery markets, Phoebe White and Michael Hanson, 8/15/24
At Any Rate - Treasury futures roll, Srini Ramaswamy and Ipek Ozil, 8/14/24
At Any Rate - July Morning turns into Cruel Summer, Jay Barry and Srini Ramaswamy, 8/9/24
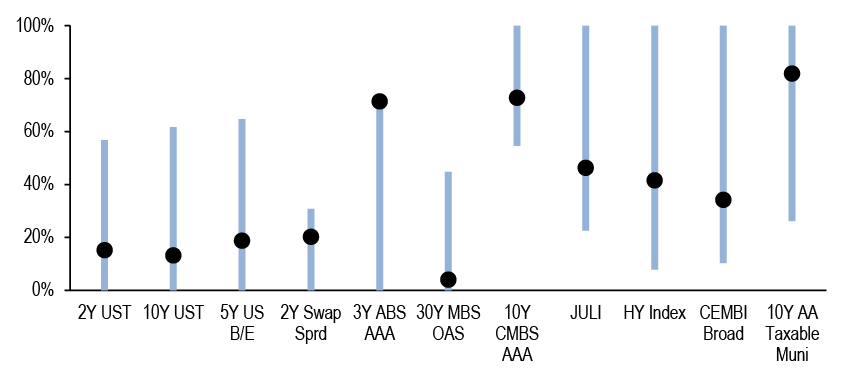
In the wake of the July employment report, Treasury yields initially plunged and corporate spreads widened before retracing these moves over the fortnight supported by the relative strength in the data and a normalization in risk sentiment ( Figure 1). Market liquidity conditions have also largely rebounded amid the decline in volatility. While limited, the data over the past two weeks has assuaged the worst fears surrounding an impending slowdown. The July CPI report delivered on expectations, as the core index rose 0.165% m/m last month to leave the year-ago rate to cool to 3.2% with most categories outside shelter flagging as soft, and we are currently tracking core PCE increased 0.122% in July (see US: Cooler July CPI, as expected, Michael Hanson, 8/14/24). Meanwhile the July retail sales report beat expectations, with the total index rising 1.0% m/m and the control group moving up by 0.3%, and strong consumer spending to start 3Q24 presents upside risk to our GDP tracking (see US: July retail sales suggest no slowing in 3Q real spending, Abiel Reinhart, 8/15/24). Most notably, initial jobless claims moved down from a peak 250k at the end of July to 227k, suggesting that after adjusting for one-off shocks emanating from recent weather events and auto-plant shutdowns, the level of claims are not significantly higher than in recent summers (see US: Jobless claims moved down, Murat Tasci, 8/15/24). As we look ahead, all eyes will be focused on initial claims next week, as it will overlap with the employment survey reference week, and we expect claims to remain roughly stable around 230k (see Economics). We also look forward to Powell’s comments at Jackson Hole, though it is unlikely the Chair will offer too much granularity on the magnitude or pace of easing given the importance of the upcoming August employment report.
Figure 1: Treasury yields have backed off their lows and credit spreads from their wides, as the relative strength in the data and risk sentiment has supported a normalization following the July payrolls report
Respective yields and spreads (black dots) within their 1-month range (blue section), normalized as a percentage of their 3-month histories; %
Source: J.P. Morgan
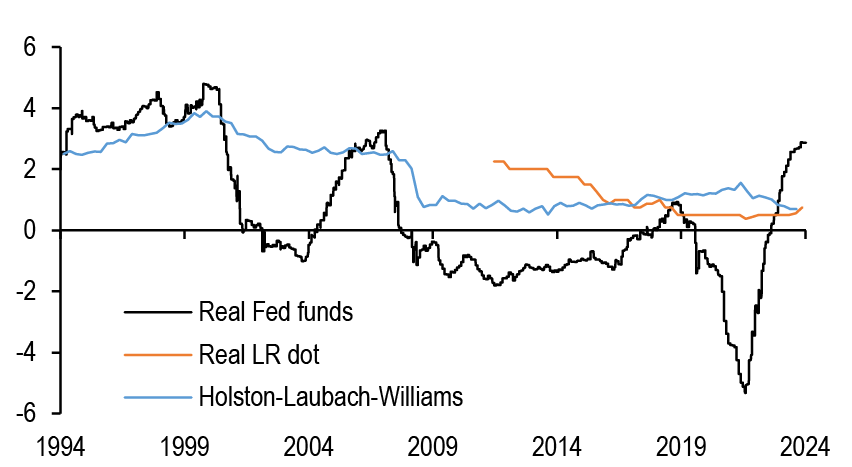
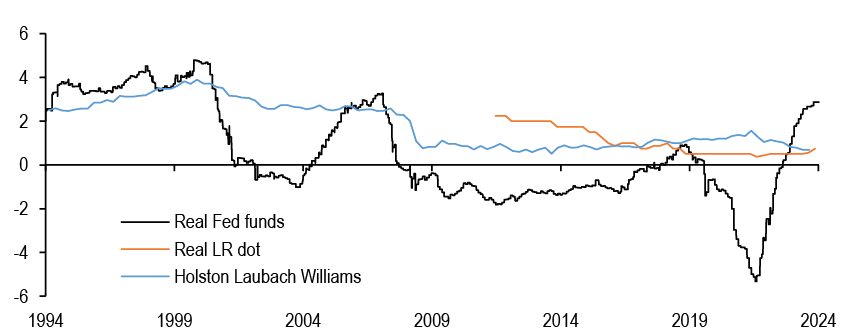
Against the backdrop of easing inflation pressures and above-trend growth, the real Fed funds rate is decidedly more restrictive than before prior easing cycles and it is notable that Fed speakers from across the spectrum have recently highlighted the need to moderate this stance ( Figure 2). Thus, with the disinflationary process resuming and labor markets significantly looser than they were a year ago, we think this makes the case for substantial Fed easing in the coming months, and we continue to project 50bp cuts in September and November before downshifting to 25bp through late-2025. However, markets have clearly moved in the opposite direction this week, pricing in just 30bp of easing by the September FOMC meeting, and 94bp for 2024. It’s tempting to add duration here, with markets pricing a slower and shallower path of cuts than our modal view, but we prefer to be patient, knowing that position technicals could be a drag over the near term. Specifically, our Treasury Client Survey index has extended significantly over the last few weeks to the longest levels since December. Should the conditions present themselves, we would look to add duration in the 3- to 5-year sector of the curve. Meanwhile, we maintain our 5s/30s steepener position as a lower-beta duration long with a better carry profile which is both supported by historical steepening pattern into Fed easing cycles and reinforced by higher term premium (see Treasuries).
Turning to inflation markets, TIPS breakevens lagged the recovery in other markets and remain cheap versus our fair value estimates. With the Fed likely to begin cutting rates next month, we note that breakevens have not exhibited a consistent performance around the start of prior easing cycles. However, a Fed that is cutting due to risks coming into better balance and a desire to return policy rates quickly to neutral should be more supportive for breakevens than a Fed that is behind the curve. Meanwhile, technicals have turned more supportive as well. Demand for TIPS-focused funds has picked up alongside the decline in real yields and improvement in realized TIPS returns, driving the 4-week moving average of inflows to its highest level in more than 2 years. Along the curve, the intermediate sector offers value, and we prefer to express longs in inflation swaps rather than breakevens, given that IOTAs remain tight. Thus, we recommend tactical longs in 5Yx5Y inflation swaps (see TIPS).
Figure 2: The Fed funds rate is considerably more restrictive than at any point over the last 30 years
Real Fed funds rate*, real longer-run median Fed dot, and Holston-Labach-Williams natural rate of interest rate; %
Source: J.P. Morgan., Federal Reserve bank of New York, Bloomberg Finance L.P.
*Fed funds target less core PCE oya
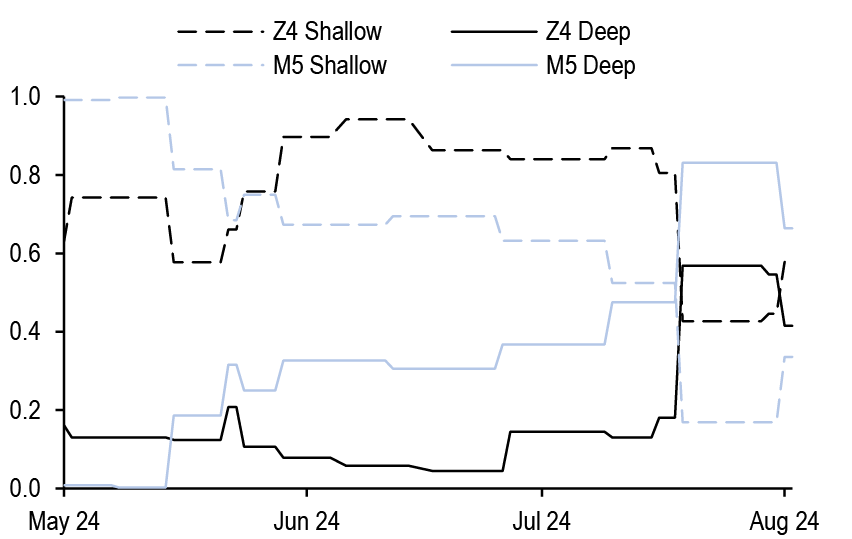
Figure 3: Policy uncertainty remains elevated and is also a feature in 2025, not just this year
Total weights on YE24 and 1H25 policy rate scenarios representing Shallow Cuts*, and Deep Cuts*, as calculated from a decomposition of the implied probability distribution associated with Dec 2024 and June 2025 SOFR futures; May 2024 – Current
Source: J.P. Morgan
* Shallow Cuts correspond to the total weights on the 0 Cut,1 Cut, 2 Cuts, and 3 Cuts scenarios for YE24, and 0 Cut,1 Cut, 2 Cuts, 3 Cuts, and 5 Cuts scenarios for 1H25 . Deep Cuts correspond to the total weights on the >3 Cuts scenarios for YE24, and 7 Cut and 9 Cut scenarios for 1H25. YE24 scenarios outlined in Figure 2 of What’s the rush?.
** We enumerate a list of scenario-specific Normal distributions with fixed standard deviations and means that are separated by 25bp, and then require the implied distribution to be a weighted combination of these individual distributions. The weights are then solved for, by fitting to the observed prices of calls and puts at various different strikes. For more details of our approach, see What’s the rush?.
While it is highly likely the Fed will deliver a cut next month, the magnitude and subsequent pace of easing still remain highly uncertain and this leaves markets in a state of limbo as there is likely to be little clarity provided over the near-term. Indeed implied probability density functions inferred from call and put premia on Z4 SOFR futures indicate comparable weights between both shallow-cut and deep cut scenarios, leaving policy uncertainty elevated ( Figure 3). Against this backdrop high jump risk combined with more frequent jump days is manifesting in high delivered volatility and we think implieds look cheap considering these factors. Thus we maintain our long volatility bias and continue to express this in 5-year tails. We also maintain our swap spread curve flattening bias, as normalization in repo rates should bias front-end spreads wider whereas ongoing QT and elevated duration supply in Treasury markets should bias the long-end narrower. We like expressing this theme through a 3s/7s maturity matched swap spread curve flattener, which additionally is near the steep end of its one year range (see Interest Rate Derivatives).
Turning to the Fed’s balance sheet, RRP balances have trended lower, reaching $330bn on 8/16, and fell as low as $287bn on 8/7, a level not seen since May 2021. Positive net T-bill issuance over the past couple of weeks has likely contributed to the lower facility balance, though we might be approaching some sort of floor as the uptick in net T-bill issuance stalls in early-September. Furthermore, MMFs maintain some amount of exposure to the Fed’s ON RRP to help meet their liquidity needs that cannot be entirely met with repo or T-bills alone. For the remainder of the month, we expect RRP balances to hover in the low to mid-$300bn range (see Short-term fixed income).
This is close to our $250-300bn guesstimate for the likely floor on O/N RRP balances that will be needed for well-functioning repo markets. This raises two important and related questions. First, is liquidity in the system (i.e., the combination of Reserves as well as RRP) still ample? Second, given the likely outlook for the Fed's major liabilities, how much further can QT continue? We argue the ampleness of liquidity is best estimated by examining the response of broader short rates (such as SOFR) to quantity shocks. Borrowing the essence of the idea in the recent note by Fed staff, we look at the empirical relationship between changes in the SOFR-versus-top-of-the-band differential and percentage changes in total liquidity (i.e., Reserves plus RRP balances). The rising magnitude of this rolling (negative) beta does indeed point to tightening liquidity conditions, and suggests that QT is in its endgame, with perhaps a few more months left. Overall, we project the Fed’s balance sheet to end the year at ~$7Tn, with Reserves flat at current levels, ON RRP balances slightly below $300bn, and a lower TGA ( Figure 4, see Interest Rate Derivatives).
Figure 4: We estimate that the Fed's balance sheet will end the year at ~$7Tn, with Reserves essentially flat to current levels, RRP balances ending slightly below $300bn, and with TGA lower from current levels
Current* and projected total Fed balance sheet assets, RRP, TGA, Reserves, and Commercial bank deposits** through 2024, $bn; 8/15/2024
| End-of-the-month | Fed Assets | RRP | TGA | Reserves | Commercial Bank Deposits | ||
| O/N RRP | Foreign RRP | Total RRP | |||||
| Current | 7229 | 327 | 395 | 722 | 789 | 3339 | 17564 |
| Aug-24 | 7206 | 325 | 395 | 720 | 775 | 3332 | 17609 |
| Sep-24 | 7161 | 253 | 395 | 648 | 850 | 3283 | 17620 |
| Oct-24 | 7118 | 281 | 395 | 676 | 775 | 3288 | 17673 |
| Nov-24 | 7074 | 259 | 395 | 654 | 775 | 3266 | 17706 |
| Dec-24 | 7033 | 287 | 395 | 682 | 700 | 3272 | 17760 |
Source: J.P. Morgan., FRED, Federal Reserve H.4.1, Federal Reserve H.8
*Current as of 8/15/2024 Fed H.4 release
**Deposits as of 8/16/2024 Fed H.8 release
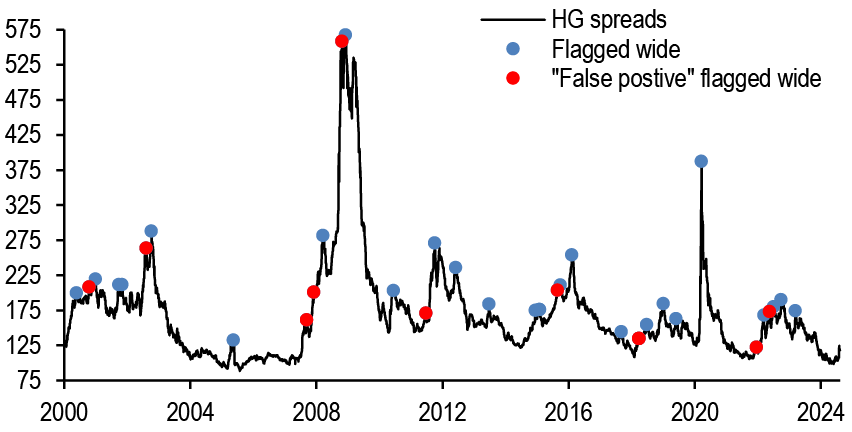
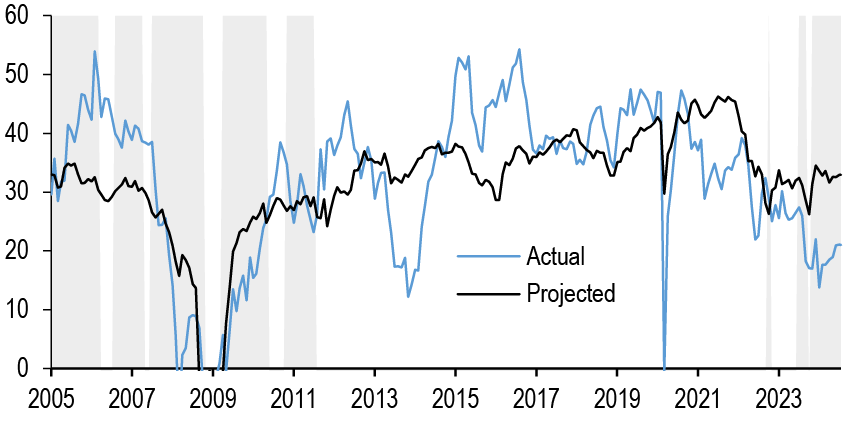
High grade credit spreads widened materially in the wake of the July employment report, reaching a YTD high of 125bp on the JULI, before retracing back to pre-payrolls levels in the following fortnight. As HG spreads have made a rapid retracement, some investors have expressed skepticism as to the durability of the ongoing spread rally. Time will tell if the current selloff will mark a local high or something more, but our analysis has shown that it has been, historically speaking, advantageous to buy the dip in HG, as 70% of the time when spreads widened materially, they subsequently rallied over the next three months ( Figure 5, see JPM Daily Credit Strategy & CDS/CDX am update, Eric Beinstein, 8/15/24). Turning to relative value, we note that the 10s/30s curve looks too flat when compared to 30-year Treasury yields, and we could expect this curve to steepen as yields decline into the Fed cutting cycle, especially as the recent dearth in long-end issuance has begun to reverse ( Figure 6, see JPM Daily Credit Strategy & CDS/CDX am update, Eric Beinstein, 8/14/24). We find little evidence that Japanese investors have pared down their cross-currency exposure to US credit amid the carry unwinds, as overnight net buying has been elevated and the relative value proposition of HG credit for Japanese buyers improved as volatility drove JGB yields lower (see JPM Daily Credit Strategy & CDS/CDX am update, Eric Beinstein, 8/13/24).
Down the capital structure, high yield bond spreads declined by 15bp to 369bp and yields collapsed to 7.65%, the lowest level since August 2022, as economic data have bolstered the Goldilocks narrative of positive growth with moderate inflation while 2Q earnings are meeting elevated consensus estimates. That said, concerns over future cooling are still present, as CCC spreads are 42bp wider on the month compared to BB and B spreads wider by 1bp and 16bp, respectively. Meanwhile leverage loan spreads have tightened by 4bp over the past week, amid moderating retail outflows and light capital market activity (see High Yield). We widen our CLO T1 AAA new issue spread YE24 forecast from 130bp to 150bp given the historical precedent for negative returns for risk assets once the Fed begins easing combined with the likely reduction in floater demand. This raises the risk that refi/reset activity may not remain quite as strong, especially as some 16% of the universe is coming out of non-call period in 2024, of which the majority is currently in-the-money (see CLOs).
Figure 5: There have been 37 moderate to major HG selloffs since 2000, and spreads rallied over the next 3 months in 26 of these episodes
JULI spread versus positive and false positive flagged wide during selloffs*; bp
Source: J.P. Morgan
*Selloff is defined as a point where spreads are at their widest in 3 months and remain the widest over next 1 month, and is further restricted to points where peak spread was at least 15bp wider than tightest over past 3 months. Positive flag is where the selloff corresponds to the peak in spreads over the subsequent 3 months, and false positive when spreads are wider over the next 3 months. See JPM Daily Credit Strategy & CDS/CDX am update, Eric Beinstein, 8/15/24
Figure 6: The 10s/30s HG spread curve appears too flat with respect to 30-year Treasury yields
10s/30s spread curve versus regression* model predicted 10s/30s spread curve; bp
Source: J.P. Morgan
* Regression model: 67.65 -5.27*30-year UST yield (%) -0.11*JULI spread (bp), R^2 = 48%, SE = 9.7bp
Shaded areas are where UST 30-year yields = 4 to 5%
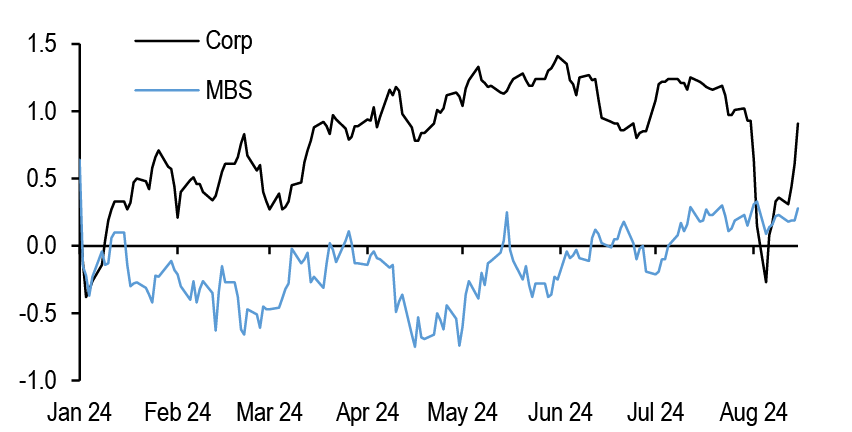
Turning to mortgages, higher coupon spreads continue to recover from their early August widening while lower coupons are a touch wider, perhaps on the margin reflecting concerns over bank and/or foreign portfolio reallocations or simply cheaper opportunities up the stack. Spreads remain on the snugger side of things, but the performance of mortgages in the flash rally reinforces the thesis among many mortgage-overweight money managers that mortgages offer comparable yields with less downside risk in sharp rallies to IG ( Figure 7). From this perspective, the recent retracement in corporate spreads may prove a headwind, but lower yields should be supportive of fund inflows and overall we would expect more neutral positioning going forward (see ‘Mission Accomplished’ on MBS vs. HG Corps, Nathaniel Rosenbaum and Nick Maciunas, 8/6/24). We continue to prefer UIC conventionals and are underweight 4.5s and 5s (see Agency MBS).
With a Fed easing cycle likely around the corner, we expect mortgage rates to fall marginally below 6% by the end of the year if our interest rate forecast is realized. This would improve affordability and potentially thaw a frozen housing market, but we do not expect this to be a massive driver of higher home prices as waiting sellers will likely be met by eager buyers, raising supply and demand commensurately. Indeed we look for only another 1.5% of HPI growth over the next 6months. What does this mean for relative value in the non-agency space? At the top of the capital structure, higher coupons (5.5 - 6.5s) should not face much refinancing pressure for the rest of the year and spreads should hold firm. Lower coupons meanwhile would benefit from even a modest pick-up in turnover. In credit, home prices remain supportive but spreads are tight and we look for a more sideways move in the second half. As such any spike in broader credit should be viewed as an opportunity to buy(see RMBS).
ABS spreads narrowed this week following the previous week’s volatility, with demand picking up in the higher yielding segments. Indeed the reaction function of ABS spreads to broader market volatility has been consistent in recent years with lower tier credit showing a higher beta than cash surrogate ABS versus comparable unsecured corporates. This offers a buying opportunity for ABS across the credit spectrum against the base case of no recession in the year ahead. Turning to auto loan ABS, we note that affordability appears to be returning to the market as collateral APRs have levelled off/started to decline this year, loan terms are extending, and monthly prepayments continue to fall. Delinquencies and losses have only modestly deteriorated on the prime side - likely due to the catch-up of compounding effects of inflation on household and consumer expenses among higher quality borrowers- and no worse on subprime in recent originations. Under our base unemployment forecasts, we do not expect significant deterioration in curing trends or an outsized uptick in loss ramps for prime vintages (see ABS).
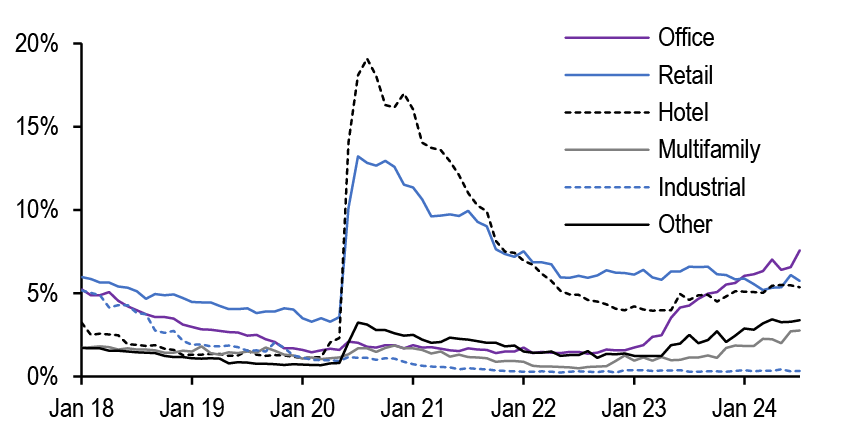
In the CRE space, on-the-run conduit CMBS spreads widened 4-11bp across the stack, with AS bonds underperforming both within the stack and relative to similar duration single-A corporates. With expectations of a slowing but not breaking economy, we believe upper IG mezz bonds have sold off too much and appear cheap compared to similar duration single-A corporates. Agency CMBS spreads also widened over the past two weeks and Fannie DUS 5/4.5s appear cheap to 30-year FN 5s on both an OAS and ZV comparison. The July remit data show that serious delinquency rate for private label CMBS reached 4.74%, representing a 20bp increase from the prior month, with office loans the marginal driver of the increase ( Figure 8). Finally,we continue to see elevated levels of DLQ buyouts and loan modifications in the CRE CLO market, with $527mn in reinvestments through the entire CRE CLO market in July representing the highest volumes since October 2023 (see CMBS).
Figure 7: YTD excess returns flipped in favor of MBS during the flash rally for the first time since January
YTD Cumulative excess returns on the Bloomberg Corporate and MBS indices, %
Source: J.P. Morgan, Bloomberg L.P.
Figure 8: Within CMBS, office loans were the marginal driver of the increase in serious delinquencies last month
60d+ delinquency rate (including NP matured and FC/REO) by property type, as of July 2024; 5
Source: J.P. Morgan, Trepp
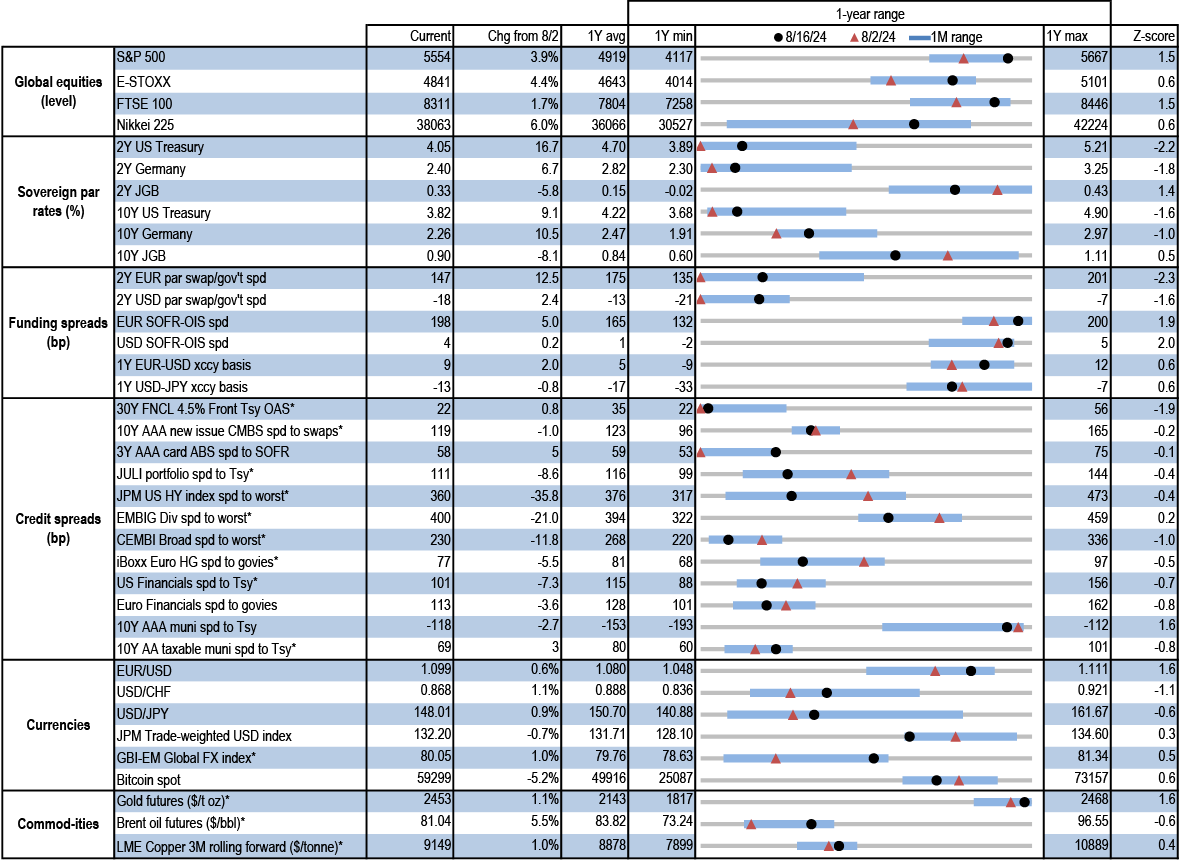
Figure 9: Cross sector monitor
Current levels, change since 8/02/24, 1-year average, minimum, maximum, and current z-score for various market variables; units as indicated
Source: J.P. Morgan, Bloomberg Finance L.P., ICE, IHS Markit
* 8/15/24 levels for 30Y FNCL, AAA CMBS, JULI, US HY, EMBIG, CEMBI, iBoxx Euro HG, US financials, AA taxable munis, GBI-EM Global FX, gold, and brent oil; 8/16/24 levels for all others
Figure 10: YTD returns on various fixed income indices; %
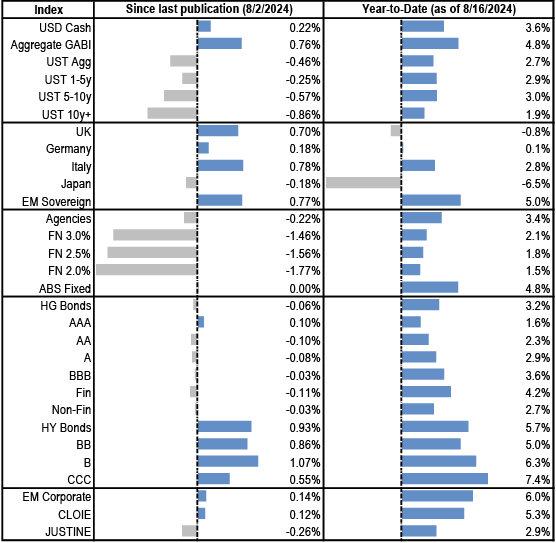
Source: J.P. Morgan
Economics
- The July CPI report was tame, as the core measure increased only 0.17%
- Firm retail sales trend led us to revise up 3Q GDP growth to 1.25%
- Initial jobless claims move lower as automaker-related distortions fade
- Powell’s Jackson Hole remarks next week unlikely to tip hand for September FOMC
The immaculate disinflation thesis received more support this week, as inflation continues to moderate against a backdrop of healthy growth in economic activity. The CPI report for July was benign as the ex-food and energy core measure increased only 0.17%, and over the last year is up 3.2%. After a few unwelcome upside surprises at the beginning of the year, core inflation has been well behaved more recently, increasing at only a 1.6% annual rate over the last three months. The lagging rental measures are still slow to moderate, but excluding shelter costs core inflation was up 1.7% in the 12 months through July.
Meanwhile, most indicators of growth were generally favorable this week. Most notably, retail sales rose 1.0% in July and the core “control” measure increased 0.3%. These figures suggest real consumer spending is off to a good start in 3Q and accordingly we revised up our estimate of current-quarter GDP growth to 1.25%. We also separately rejiggered the contour of real GDP growth for 2025, effectively swapping the first-half and second-half growth profiles to reflect more modest growth in 1H25 followed by a moderately stronger rebound in 2H25 as the impact of the front-loaded Fed easing cycle starting next month percolates through the economy. This revision leaves 4Q/4Q and year-on-year growth for 2025 unchanged.
The latest jobless claims data also peeled back some of the recent increase, suggesting the deterioration in labor market conditions seen in the July employment report is not building on itself. Some of the prior rise in claims may owe to extended automaker shutdowns, a factor that also weighed on the July industrial production report released this week. State-level data suggest some drag on payrolls in Texas that might be attributed in part to Hurricane Beryl; impacted sectors showed an earlier rise in jobless claims as well, so we could see a modest bounce-back in August nonfarm payrolls. Beryl does not appear to have distorted the national unemployment rate, however, although the automaker shutdowns might have led to temporary layoffs in the Midwest.
The data flow next week slows to a trickle. Instead, the most notable development will likely be Fed chair Powell’s remarks at the annual Jackson Hole symposium. There has been only limited Fed-speak since the disappointing July jobs report. Of those who have spoken most have asserted that risks to the employment and inflation mandates are close to balanced. They generally have also judged that policy is currently restrictive. In this setting we think it makes sense to get policy back to neutral quickly and believe a 50bp reduction in the funds rate at the September FOMC meeting is warranted. That said, we doubt Chair Powell will pre-judge the outcome of that meeting, given almost a full month of data releases between now and then.
Inflation genie gets back in the bottle
This week saw the release of the full suite of July inflation data—CPI, PPI, and import prices—and the net result is that we expect only a modest 0.12% increase in the core PCE price gauge last month. Both headline and core CPI rose 0.2% on the month, with core very close to our expectations (a realized 0.165% unrounded print versus our forecast of 0.170%) but headline slightly softer. As a result, the year-ago pace of headline CPI inflation eased a tenth to 2.9%, while core slid a tenth to 3.2% as expected (Figure 1).
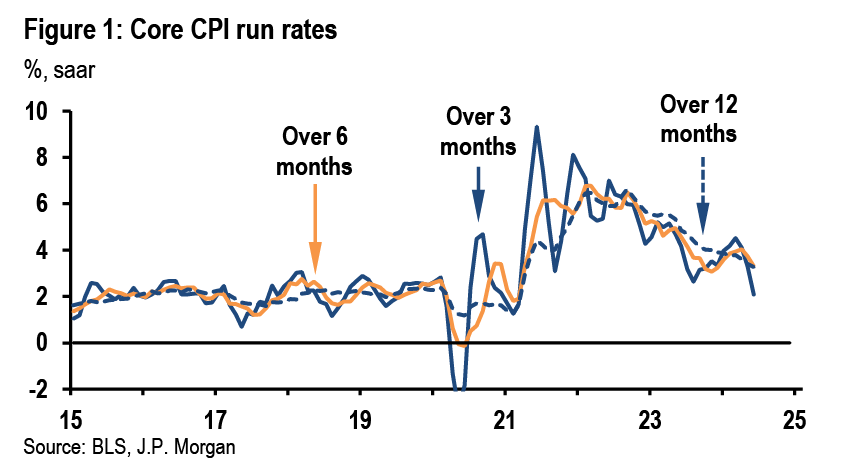
Both of these readings mark the slowest annual pace of inflation since 2021. The unexpected softness in headline can largely be traced to a flat contribution from energy on the month, while food prices rose 0.2% as expected. Away from food and energy, the details on the core were more varied but broadly aligned with our expectations. Core services firmed 0.3% while core goods declined 0.3% for July. The former was the strongest in three months while the latter was the softest reading for core goods prices in a year.
As we forecasted, shelter prices firmed on the month—albeit a bit more than anticipated, with owners’ equivalent rent (OER) up 0.4% and tenants’ rent up 0.5% on the month (Figure 2).
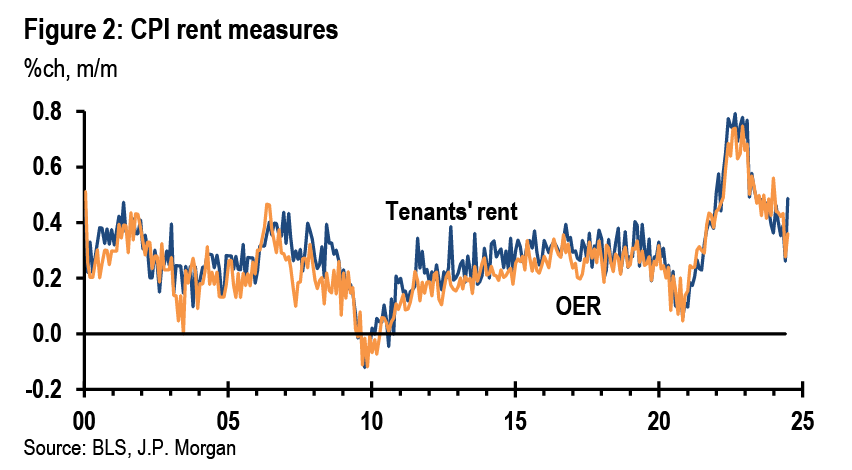
New and used vehicle prices eased broadly as forecast as well, with the latter accelerating their recent monthly pace of decline to 2.3%. Industry data point to a reversal of this drag in coming months. Airfares (down 1.6%) and postage (up 0.8%) also provided offsetting but broadly anticipated swings last month. Motor vehicle insurance costs appear to have resumed their upward trend after a brief interruption in May; they rose 1.2% in July. More surprising was the 0.3% drop in medical care services, which appears to have been nearly entirely due to an unexpected 1.9% decline in outpatient hospital services. The rest of the subcomponents for medical services rose last month, and several accelerated.
The July producer price index (PPI) report was generally softer than expected, re-establishing a disinflationary trend for producers’ prices after some firming earlier this year. The headline final demand measure rose 0.1% on the month, while the core PPI index (excluding food and energy) was unchanged. With revisions to prior months, year-ago headline PPI inflation has cooled to 2.2% from an upwardly-revised 2.7% in June, while core eased to 2.4%oya from 3.0% in June. Although the pass-through from producer into consumer prices is incomplete and of variable length, the July reading is well within the range that allows the Fed to continue to place its primary focus on the labor market at upcoming policy decisions.
Consumer spending stays firm
The July retail sales report came in strong and points to another solid gain in real consumer spending in 3Q. Based on the retail data as well as a reported decline in utilities in the IP report, our expectation is that real PCE rose 0.2%-0.3%m/m in July. Even if there were no further gains in spending in August and September, real PCE for the quarter would still increase a solid 2.1%q/q, saar.
Total retail sales increased 1.0%m/m in July, supported by a 3.6%m/m increase in sales at motor vehicle and parts dealers. These data are consistent with a 4.2%m/m rebound in unit vehicle sales reported for July. Excluding autos and gas, total sales rose 0.4%. The control category, which further excludes food services and building materials, rose a high-side 0.3%, which comes after a large 0.9% increase the prior month. The control category rose 4.9%3m/3m, saar, reversing a slowdown earlier in the year (Figure 3).
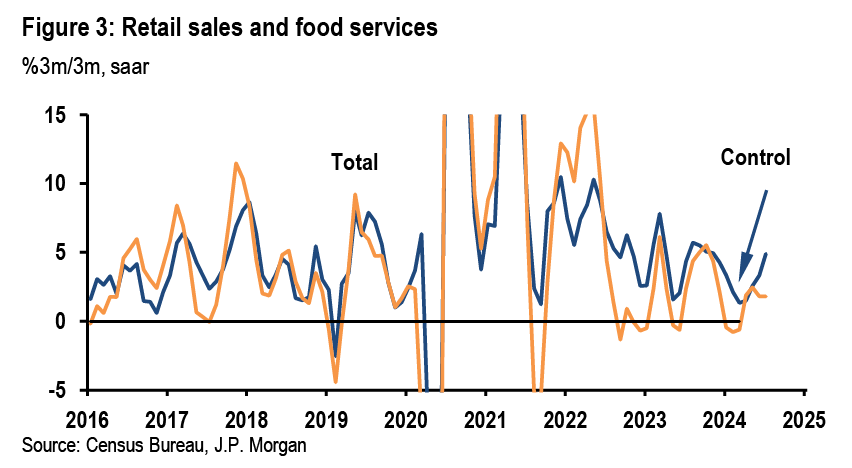
We had expected food services to be a drag on sales given the signal from Chase card data, but in fact that category rose 0.3%m/m. That said, the 2% annualized increase over the last three months is still a slow pace. Results for housing-related components were also decent, as sales at building material stores rose 0.9% while furniture, electronic, and appliance store sales increased 1.0% in July. Sales at both of these store types have trended upward from earlier in the year after being weak last year. Sales in some of the other larger categories, including grocery stores, general merchandise stores, and e-commerce, were all up on the month as well.
Stronger than expected retail sales data for July paint a relatively upbeat picture for consumers, but the preliminary August print of the University of Michigan’s consumer sentiment index showed only a mild improvement that was driven by the expectations component while current conditions index slid a bit. Inflation expectations remained unchanged both at the one-year (2.9%) and five-year (3.0%) horizons.
Housing starts slide
Housing starts and permits declined substantially in July, with starts down 7%m/m to 1.238mn saar, and permits down 4% to 1.396mn saar. Moreover, there were net downward revisions to starts in prior months. The decline in total starts was driven by a 14% plunge in the single-family segment, which left them near their cycle lows from early 2022. Despite modest declines in mortgage interest rates that are likely to continue as the Fed easing cycle commences, we think residential investment growth in the GDP accounts should be soft in 2H given the past declines and given that units under construction are still falling from elevated levels. In addition, builders have been giving a lot of rate incentives to buyers, which they may withdraw as mortgage rates decline.
Excerpted from, United States Data Watch , Michael Feroli, August 16, 2024
Treasuries
Just keep starin’ at the sun, pray for summer’s end
- With the disinflationary process resuming and labor markets looser, the path for substantial Fed easing in the coming months is becoming clearer. We continue to forecast 50bp cuts in September and November, followed by 25bp cuts through summer 2025. Though markets are pricing in a less dovish path than our own forecasts, we think we can be patient before adding duration...
- ...We think investor positioning has had a role in the recent move to higher yields: our Treasury Client Survey Index has reached its highest level since December. This level of the survey index has historically preceded rising yields in subsequent weeks, indicating potential near-term bearish risks
- Chair Powell’s Jackson Hole speech will be closely watched. Historically, these events have not driven significant volatility in Treasuries, except in 2020 and 2022. We do not expect the Chair to give granular policy guidance, as the magnitude of easing will depend on labor market data, particularly the August employment report
- The current environment does not closely resemble the periods prior to the last 4 easing cycles. Policy is more restrictive than at any other point in in the last quarter-century, suggesting more significant easing than in 1995 and 2019, but financial conditions are easier and displaying less stress than prior to the 2001 and 2007 cycles
- We continue to favor 5s/30s steepeners as a representation of our strategic view, as the curve tends to steepen ahead of the first rate cut. This trade behaves like a lower-beta duration long with a better carry profile. The rapid growth of the Treasury market and reliance on price-sensitive investors warrant higher term premiums and steeper curves
- 2s/5s steepeners are becoming more attractive, but a weak employment report is needed to shift steepening exposure further in the curve
- Foreign investors purchased $17bn of long-term Treasuries in June, the least since December 2023, with demand concentrated among Euro-area investors while net selling pressure emanated from Japan
Market views
It’s been a wild two weeks since our last US-FIMS publication, with yields plunging first in the aftermath of the weak July employment report and later following weakness in risk assets due to the unwind of the Yen carry trade. However, yields have risen off their lows, supported by a rebound in risk assets and relative strength in data: with these moves, markets have normalized strongly from their most extreme levels on August 5 ( Figure 11). Initial claims have fallen more than 20k from their local peak just two weeks ago and are firmly back in the range they’ve held since early summer, and the 4-week average has retreated back as well. With the rises in July concentrated in Texas and Michigan now fading, it appears these were indeed technical, related to Hurricane Beryl and auto plant shutdowns, respectively (see US: Jobless claims moved down, Murat Tasci, 8/15/14). Separately, the July retail sales report came in strong, pointing to upside risk to growth early in 3Q24: control group sales rose 0.3% over the month (consensus: 0.1%), and early in the quarter, this indicates consumption has not stepped down materially from the 2.3% pace in 2Q24 (see US: July retail sales suggest no slowing in 3Q real spending, Abiel Reinhart, 8/15/24). Since our last weekly publication on August 2, 2-, 5-, 10- and 30-year yields have risen by 20bp, 15bp, 10bp, and 4bp, respectively.
Figure 11: Most asset classes have retraced significantly from their extremes on August 5, supported by stronger labor market and consumption data
Current values for various asset classes, 1-week change, distance from August 5th extremes, with 1-month statistics; units as indicated
| Asset | Last | 1wk chg | Dist from Aug 5 low | 1m min | 1m max | 1m range |
| 2y UST; % | 4.07 | 5.1 | 18.3 | 3.87 | 4.52 | 65 |
| 10y UST; % | 3.89 | -1.6 | 10.9 | 3.78 | 4.28 | 50 |
| 5s/30s UST curve; bp | 38.4 | -6.5 | -6.1 | 28.5 | 49.3 | 21 |
| 10y TIPS breakevens; bp | 209.8 | -2.3 | 3.5 | 203.4 | 229.9 | 26 |
| 3mx10y vol; bp/day | 6.99 | -0.05 | 0.11 | 5.91 | 7.12 | 1.2 |
| S&P 500; | 5554.3 | 210 | 367.9 | 5186.3 | 5667.2 | 480.9 |
| JULI; bp | 110 | -8 | -14.6 | 104.7 | 124.6 | 20 |
| USD/JPY; | 147.7 | -0.2 | 5.1 | 142.6 | 158.6 | 16.0 |
| Brent oil; $/bbl | 79.58 | -2.72 | 3.28 | 76.3 | 85.11 | 8.8 |
Source: J.P. Morgan
Though there was normalization in markets this week, it can’t be ignored that inflation data was benign once again. Headline CPI rose 0.2%, allowing the year-ago rate to tick lower to 2.9%, while core CPI also rose 0.2% (0.165% unrounded), leaving the year-ago rate at 3.2%. With CPI and PPI data in hand, we estimate a 0.12% rise in core PCE in July, with the year-ago rate holding steady at 2.6% (see US: Cooler July CPI, as expected, Michael Hanson, 8/14/24). Given three consecutive months of cooler inflation prints and the ongoing cooling in labor markets, this ratifies the market’s expectation the Fed will ease next month. It’s notable that the CPI data seemed to contribute to a tone shift from Fed speakers this week: Bostic’s (Atlanta, nv) comments shifted markedly in two days, hinting at support for a September ease. Separately, Goolsbee (Chicago, nv) and Musalem (St. Louis, nv) both discussed the restrictive stance of monetary policy and seemed comfortable with easing in the near future ( Figure 12). While the Fed is focused on the totality of the data in determining when to lower rates, it seems that this week’s CPI data was the proverbial “nail in the coffin,” though markets have clearly been in this camp for weeks.
Figure 12: The tone from Fed officials seemed to shift following the July CPI report, as various speakers hinted at a September cut and highlighted the restrictive stance of policy
Selected comments from this week’s Fedspeak
| Date | Speaker | Comments |
| 10-Aug | Bowman (v) | "I will remain cautious in my approach to considering adjustments to the current stance of policy." (…) "It will become appropriate to gradually lower the federal funds rate to prevent monetary policy from becoming overly restrictive." |
| 13-Aug | Bostic (Atl, v) | "We want to be absolutely sure," (…) “It would be really bad if we started cutting rates and then had to turn around and raise them again.” |
| 14-Aug | Goolsbee (Chi, nv) | "It feels like, on the margin, I’m getting more concerned about the employment side of the mandate." (…) "[interest rates are] very restrictibe" (...) "If you were going into a recession or you believe that you were going into recession, that would affect the rate at which you’d be doing the cuts” (...) “Conditions are what will warrant the size of the cuts" |
| 15-Aug | Bostic (Atl, v) | "[Fed can't] afford to be late" (…) "I'm open to something happening in terms of us moving before the fourth quarter" |
| 15-Aug | Musalem (St. L, nv) | "Monetary policy is moderately restrictive" (...) "From my perspective, the risk to both sides of the mandate seem more balanced" (…) "Accordingly, the time may be nearing when an adjustment to moderately restrictive policy may be appropriate as we approach future meetings" (…) "There are risks of cutting too early or too much" (...) " |
| 16-Aug | Goolsbee (Chi, nv) | “There are some various leading indicators of recession, and some of those are giving warning lights, but there’s cross currents” (…) "You don't want to tighten any longer than you have to" (…) "[size of September ease] Everything is always on the table" |
Source: Federal Reserve, Bloomberg Finance L.P.
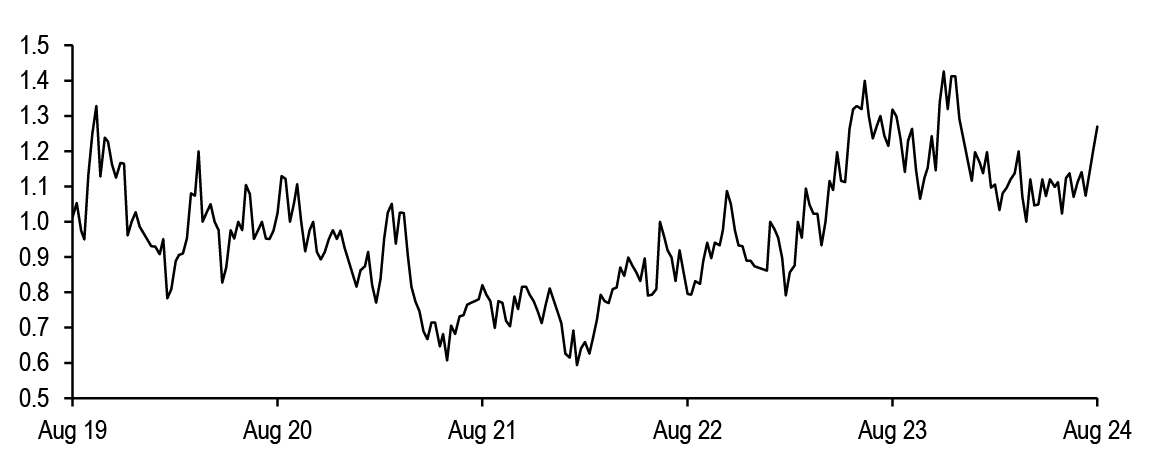
From a high-level perspective, it may seem strange that yields rose this week in the face of inflation data that gives the FOMC confidence inflation is trending back toward 2%, but fleeting expectations of an intermeeting or larger-sized cuts were being driven by fears of a more severe slowing in growth and weakening in labor markets, and this week’s data helped to ease those fears for now. What’s more, we think investor positioning has played a role as well : our Treasury Client Survey Index extended significantly over the last few weeks, to the longest levels since December ( Figure 13). Thus, it could be that this week’s moves were somewhat exaggerated by investor positioning as well, as the index had risen to 1.27, nearly 1.5 standard deviations above its 1-year average. Historically, when the Treasury Client Survey Index has moved to this level, yields have consistently risen over the ensuing weeks (see Survey says Using the Treasury Client Survey to predict rates moves, 7/21/23). We will be interested to see next week’s survey, as this technical factor leaves the risks skewed more bearishly over the very near term.
Figure 13: Our Treasury Client Survey Index rose to its highest levels since December, a move that has been traditionally consistent with yields rising over the following weeks
J.P. Morgan Treasury Client Survey Index*;
Source: J.P. Morgan*(Longs +Neutrals)/(Shorts+Neutrals)
As we look ahead, policymakers and academics will descend on Jackson Hole late next week for the Kansas City Fed’s annual monetary policy symposium, and Chair Powell will speak on the economy at 10am ET next Friday morning. Given this backdrop, we think it’s worthwhile to go back and look at the behavior of the Treasury market in the day and week after the Chair’s appearance at Jackson Hole. These events have not frequently corresponded with large moves in Treasury yields, either on the day of the speech or in the week following the Chair’s remarks, as Jackson Hole has not typically been a forum for discussing the near-term path of Fed policy ( Figure 14). 2020 and 2022 were exceptions: in 2022, Chair Powell used this forum to push back on expectations for easing in the following year, and this event represented a turning point for policy expectations, with long-term yields rising more than 100bp over the next two months (see Short but not sweet, Michael Feroli, 8/26/22). Separately, in 2020, Chair Powell formally announced the adoption of flexible average inflation targeting (see We know what they want but we just don’t know how they go about getting it, Michael Feroli, 8/27/20). However, we think it’s unlikely Chair Powell offers too much granular policy guidance, as the expected magnitude of eases in September and beyond will probably depend highly on the evolution of labor market data, and the August employment report will be key in that regard.
Figure 14: Fed Chair speeches at Jackson Hole drove significant Treasury moves in only 2020 and 2022
Jackson Hole Symposium agendas, Fed Chair speeches, and changes in 10-year Treasury yields on the day of the Chair speech as well as in the following 5 days; bp
| Year | Symposium agenda | Chair remarks | Date | 10-year UST chg | |
| Day of | Next 5d | ||||
| 2016 | Designing Resilient Monetary Policy Frameworks for the Future | The Federal Reserve’s Monetary Policy Toolkit: Past, Present and Future | 26-Aug-16 | 5.7 | -3.6 |
| 2017 | Fostering a Dynamic Global Economy | Financial Stability a Decade after the Onset of the Crisis | 25-Aug-17 | -2.2 | -1.4 |
| 2018 | Changing Market Structures and Implications for Monetary Policy | Monetary Policy in a Changing Economy | 24-Aug-18 | 0.5 | 2.7 |
| 2019 | Challenges for Monetary Policy | Challenges for Monetary Policy | 23-Aug-19 | -8.3 | -2.1 |
| 2020 | Navigating the Decade Ahead: Implications for Monetary Policy | New Economic Challenges and the Fed’s Monetary Policy Review | 27-Aug-20 | 5.9 | -12.4 |
| 2021 | Macroeconomic Policy in an Uneven Economy | Monetary Policy in the Time of COVID | 27-Aug-21 | -3.1 | 1.0 |
| 2022 | Reassessing Constraints on the Economy and Policy | Monetary Policy and Price Stability | 26-Aug-22 | 1.1 | 15.5 |
| 2023 | Structural Shifts in the Global Economy | Inflation: Progress and the Path Ahead | 25-Aug-23 | 0.4 | -6.6 |
| Avg | 0.0 | -0.9 | |||
| St. dev. | 4.4 | 7.6 | |||
Source: Federal Reserve, J.P. Morgan
Away from the near-term event risks, we’ve often debated whether the coming easing cycle will look more like the shallow maintenance cutting cycles of 1995 or 2019, or the full-blown easing cycles of 2001 or 2007. With the data we have in hand now, we do not think the current cycle resembles any of these cycles in the modern monetary policymaking era since the Fed began releasing policy statements in 1994. On one hand, the easing in inflation pressure against the backdrop of above-trend growth has this cycle somewhat reminiscent of the mini 75bp cycles of 1995 or 2019, but the similarities end here.
The current stance of monetary policy is decidedly more restrictive than it was in these other episodes: the real Fed funds rate is approximately 2.75%, a full 200bp above the Fed’s real longer-run dot. Using either the Fed’s longer-run dot (with data back to 2012) or the Holston-Laubach-Williams r* estimate, policy rates were negligibly restrictive in 2019, and only about 100bp restrictive in mid-1995 before the first cut ( Figure 15). To be fair, in 1995, the Fed had the luxury of shallow cuts because the neutral rate of interest was rising thanks to the IT-driven productivity boom, and it’s hard to say whether we are at the early stages of another productivity boom now. However, even if we adjust these measures of neutral policy rates higher by 50bp, there would still be more than 150bp of easing to bring policy rates back to more neutral levels, or twice the magnitude of shallower cycles.
Figure 15: The Fed funds rate is considerably more restrictive than at any point over the last 30 years...
Real Fed funds rate*, real longer-run median Fed dot, and Holston-Labach-Williams natural rate of interest rate; %
Source: Federal Reserve, J.P. Morgan
Source: J.P. Morgan., Federal Reserve bank of New York, Bloomberg Finance L.P.* Fed funds target less core PCE oya
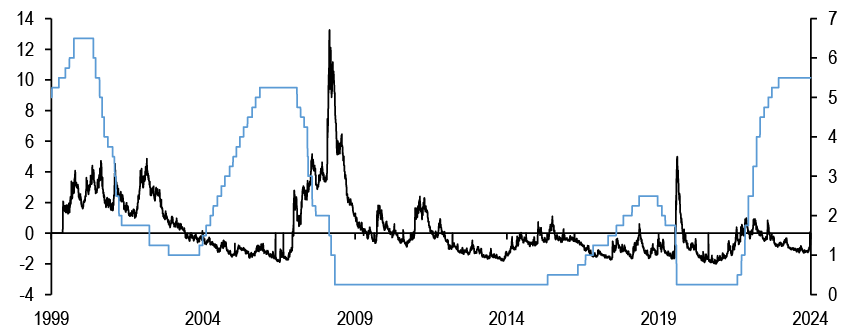
Thus, could this cycle more closely resemble the 2001 and 2007 easing cycles, when the Fed eased aggressively for more than a year in each instance? We think it’s hard to make these comparisons, as financial conditions are clearly easier and showing fewer signs of stress than they did prior to these other major easing cycles. Figure 16 shows the OFR’s Financial Stress Index, and this series began in 1999. The index indicates financial stress is well below its longer-term averages, while this index demonstrated financial stress was more acute before the Fed began easing in 2001 or 2007. Certainly, were financial conditions to tighten more aggressively, the analog could tip in favor of these more aggressive easing cycles, but this is not apparent right now.
Figure 16: ...but as of now there are few signs of financial stress to motivate a deeper easing cycle like 2001 or 2007
OFR US Financial Stress Index (lhs) versus Fed funds target rate (rhs; %)
Source: OFR, J.P. Morgan
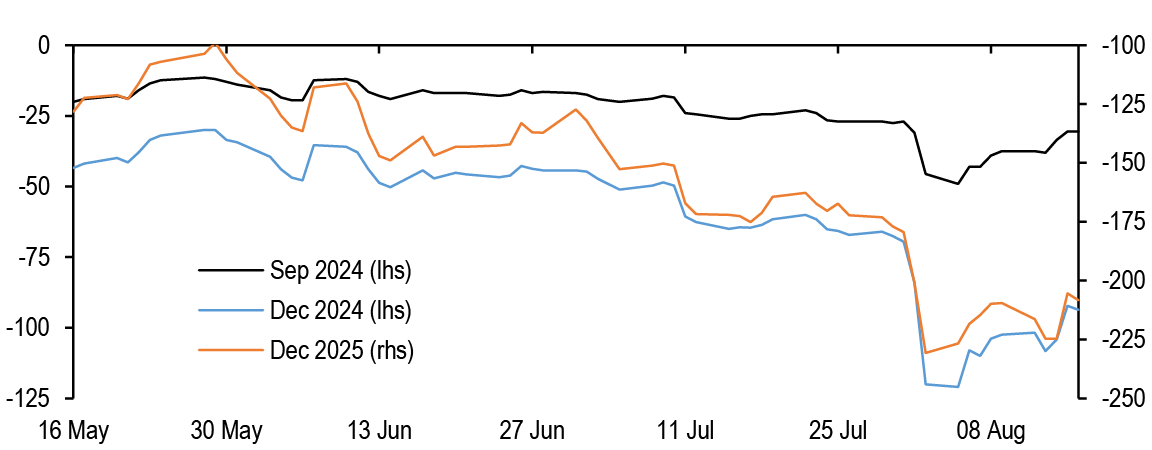
Overall, with the disinflationary process resuming and labor markets substantially looser than they were a year ago, we think this makes the case for substantial Fed easing in the coming months, and we continue to project 50bp cuts in September and November before downshifting to 25bp through late 2025. However, markets have clearly moved in the opposite direction this week, pricing in just 30bp of easing by the September FOMC meeting and 94bp for 2024 ( Figure 17). It’s tempting to add duration here, with markets pricing a slower and shallower path of cuts than our modal view, but we prefer to be patient, knowing that the position technicals we described above could be a drag over the near term. Should the conditions present themselves, we would look to add duration in the 3- to 5-year sector of the curve.
Figure 17: Markets are pricing in a less dovish path, but we do not yet recommend fading this
Easing priced by September and December 2024 (lhs), and December 2025 FOMC meetings (rhs); bp for both axes
Source: J.P. Morgan
Turning to the curve our views are unchanged, and we continue to favor 5s/30s steepeners for multiple reasons. First, as we’ve written in this piece multiple times over the last 8 to 9 months, the curve tends to steepen outside in, with the long end steepening ahead of the first cut, as medium-term monetary policy expectations ease. This steepening tends to occur consistently as the time to the first cut draws near, suggesting this is no time to pare back on steepening exposure. Second, this trade tends to behave like a lower-beta duration long with a better carry profile than an outright long position. Third, as the rapid growth of the Treasury market outstrips demand from its traditional base of less price-sensitive investors like the Fed, foreign official investors, and US commercial banks, and relies more heavily on price-sensitive investors, this warrants higher term premium and steeper curves (see In the eye of the beholder, 9/12/23). Now it’s clear our choice of steepener biases us toward a more normalizing Fed cutting cycle: our recent work has found that the behavior of the front end varies greatly, traditionally trading in a range around shallower easing cycles, and steepening sharply in more aggressive easing cycles. In this vein, 2s/5s is beginning to look more attractive, as the risks point toward quicker and deeper cuts, but we think it will require another weak employment report to have us shift our steepening exposure further in the curve.
June TIC update
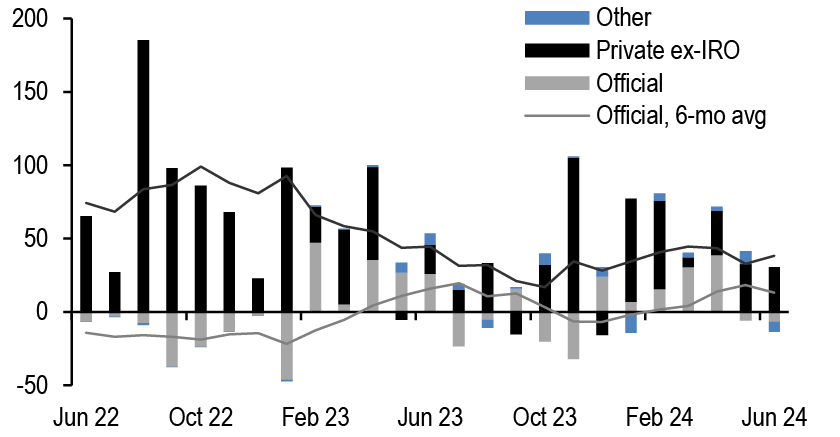
Turning to the monthly TIC data, foreign investors purchased $17bn long-term Treasuries over the month of June, below the six-month average, and the weakest month of net purchases since December 2023. Private investors added $23bn, a step down from the $41bn of purchases in May, which includes $7bn of net selling from International and Regional Organizations (IROs), the first month of net selling from this community since January. Meanwhile foreign official investors sold $6bn for the second consecutive month ( Figure 18).
Figure 18: Foreign investors on net purchased $17bn of long-term Treasuries in June, the least since December 2023...
Total net sales of long-term Treasuries by US residents by sector and 6-mo. moving average; $bn
Source: Treasury International Capital System
Figure 19: ...and geographically, demand was concentrated in Europe while net selling flows emanated from Japan
Net sales of long-term Treasuries by US residents from April- June 2024 by region as well as cumulative net sales year-to-date; $bn
| Region | Jun-24 | May-24 | Apr-24 | YTD 2024 |
| Euro Area† | 20.6 | 10.0 | 8.1 | 83.1 |
| China | 5.9 | -23.9 | 23.9 | -38.8 |
| Ireland | 0.2 | 5.7 | 0.3 | 13.3 |
| Oil Exporters* | -2.2 | 2.1 | 0.3 | 10.4 |
| EM ex-China** | -2.3 | 13.1 | 15.5 | 51.6 |
| UK | -5.1 | 15.2 | -3.7 | 25.9 |
| Cayman Islands | -10.7 | 3.7 | 18.0 | 2.0 |
| Japan | -30.1 | -5.8 | -4.6 | 8.8 |
Source: Treasury International Capital System
*Oil exporters include all OPEC members (excluding Equatorial Guinea & Angola) and also include Bahrain, Indonesia & Oman
**EM ex-China includes Russia, Brazil, African countries, Taiwan (China), South Korea and Mexico
† Euro area include Austria, Belgium, Cyprus, Estonia, Finland, France, Germany, Greece, Ireland, Italy, Latvia, Luxembourg, Malta, Netherlands, Portugal, Slovakia, Slovenia, Spain
Turning to the geographical composition, Figure 19 shows that flows were rather muted across the domiciles we monitor. That said, demand in June was concentrated among European investors, who net purchased $20.6bn of long-term Treasuries over the period. Indeed, European investors have comprised the largest source of demand for US Treasuries this year, as buying US bonds on both a rolling and matched-maturity FX hedged basis remains attractive (see Global Fixed Income Markets Weekly, 8/2/24). Within this group, French investors purchased $18bn over the month, accounting for the lion’s share of this demand. Meanwhile Japan investors sold $30bn of long-term Treasuries, the largest monthly sale since September 2022. This should not come as a surprise as more granular data from the MoF showed that Japanese investors net sold $4.26bn JPY of foreign bonds in June, of which roughly 60% were USD-denominated, with the majority of this selling pressure emanating from banks. Selling continued at a more moderate $2.11bn JPY pace in July (see Japan Flows in Pictures, Takafumi Yamawaki, 8/8/24).
Trade recommendations
- Maintain 5s/30s steepeners
- Stay long 100% risk, or $112mn notional of T 4.875% Oct-28s
- 100% risk, or $29.9mn notional of T 4.75% Nov-53s
- (US Treasury Market Daily, 11/22/23: P/L since inception: 10.3bp)
- Maintain 75%/6% weighted 5s/10s/30s belly-cheapening butterflies
- Stay long 75% risk, or $43mn notional of T 4.625% Sep-28s
- Stay short 100% risk, or $33.3mn notional of T 3.875% Aug-33s
- Stay long 6% risk, or $1mn notional of T 4.125% Aug-53s
- (US Fixed Income Markets Weekly, 9/29/23: P/L since inception: -6.5bp)
Figure 20: Closed trades in last 12 months
P/L reported in bp of yield unless otherwise indicated
| TRADE | ENTRY | EXIT | P/L |
| Duration | |||
| 5-year duration longs | 08/04/23 | 09/08/23 | -27.6 |
| 5-year duration longs | 10/03/23 | 11/02/23 | 14.9 |
| 7-year duration shorts | 11/03/23 | 11/22/23 | -7.9 |
| 30-year duration shorts | 12/15/23 | 01/04/24 | 10.9 |
| 5-year duration longs | 01/19/24 | 02/01/24 | 25.3 |
| 5-year duration longs | 02/09/24 | 03/07/24 | 3.3 |
| Equi-notional 2s/5s flatteners | 05/31/24 | 06/06/24 | 16.0 |
| 5-year duration shorts | 06/14/24 | 07/01/24 | 21.9 |
| 30% 2-year duration short | 07/12/24 | 07/31/24 | -1.8 |
| Curve | |||
| 10s/30s steepener | 12/16/22 | 09/29/23 | 3.0 |
| 10s/30s steepener | 11/03/23 | 11/22/23 | -7.3 |
| 2s/5s flatteners | 12/08/24 | 05/17/24 | 6.0 |
| Relative value | |||
| 100:96 weighted 3.5% Feb-39 / 3.75% Nov-43 flatteners | 07/28/23 | 08/16/23 | 3.2 |
| 2.75% Aug-32/ 3.5% Feb-39 steepeners | 01/10/24 | 01/26/24 | 5.2 |
| 20s/ old 30s flatteners | 02/15/24 | 05/10/24 | -2.6 |
| 100:97 weighted 3.75% Apr-26/ 4.625% Sep-26 flatteners | 04/12/24 | 05/17/24 | 2.2 |
| 100:95 weighted 4% Feb-28 / 4% Feb-30 steepeners | 02/23/24 | 05/31/24 | -6.6 |
| 50:50 weighted 3s/5s/7s belly-richening buterflies | 03/15/24 | 06/14/24 | 2.1 |
| 100:98 weighted 4.75% Feb 37s / 4.5% Aug 39s steepeners | 06/14/24 | 07/12/24 | 2.6 |
| 100:95 weighted 0.625% Jul-26s / 1.25% Dec-26s steepeners | 07/12/24 | 08/14/24 | 1.5 |
| Number of positive trades | 14 | ||
| Number of negative trades | 6 | ||
| Hit rate | 70% | ||
| Aggregate P/L | 64.3 |
Source: J.P. Morgan
Technical Analysis
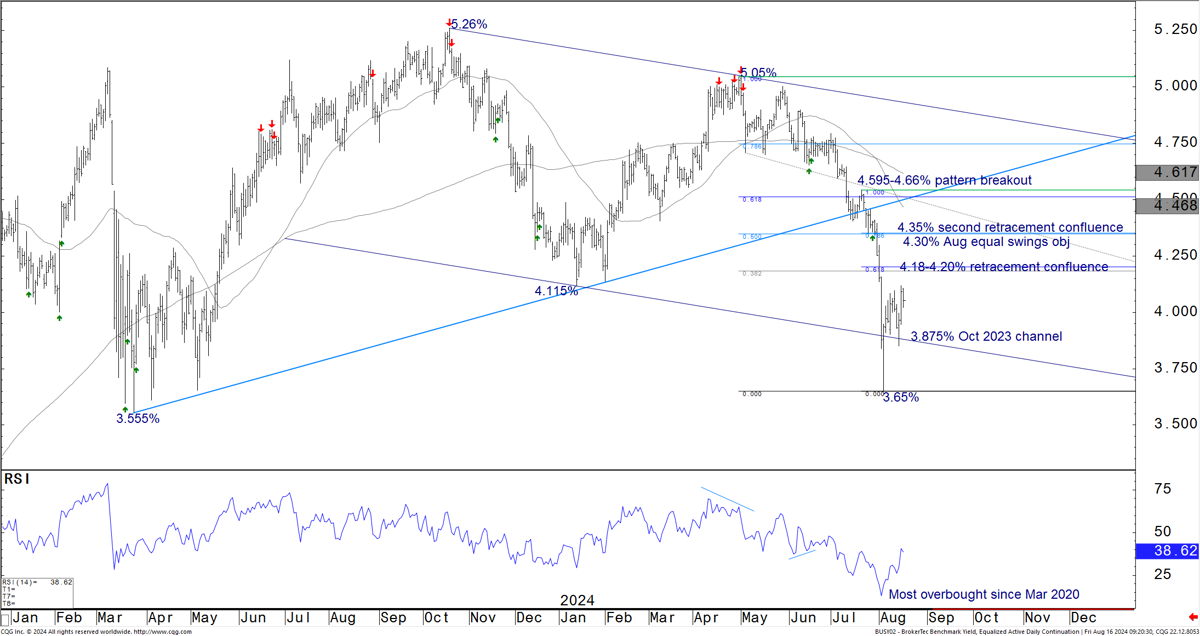
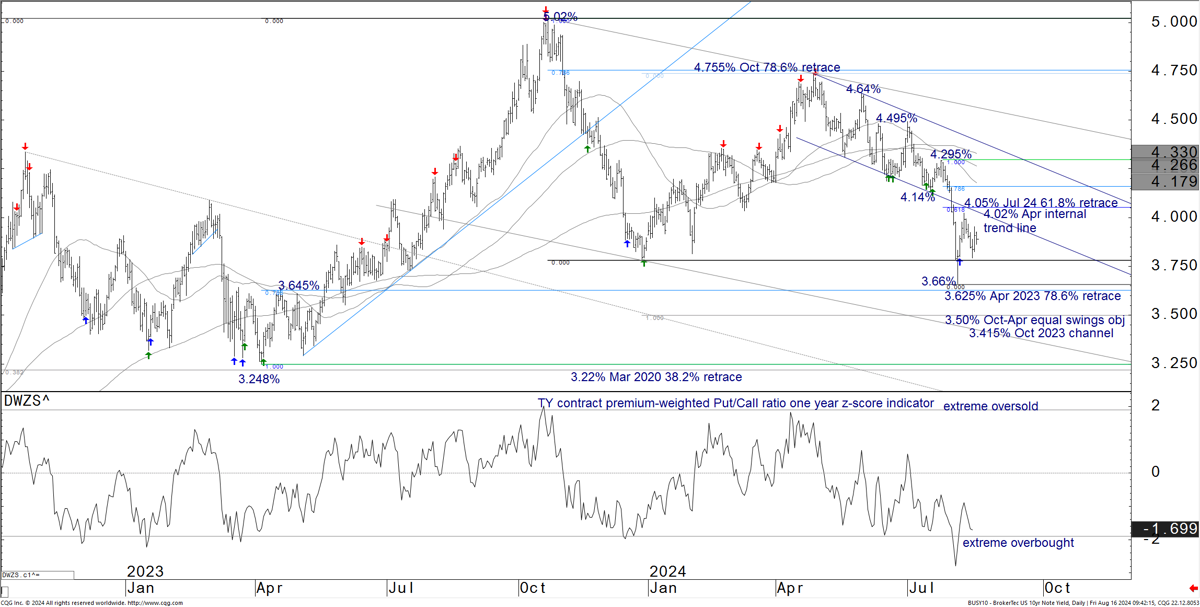
- The 2-year note backup from 3.65% approaches the first zone of potential support at 4.115-4.20%. We expect the market to find its footing near that support or the 4.30-4.35% second confluence of levels over the near term. Bigger picture, what appears to be a multi-year yield top pattern developing behind the 3.55% Mar 2022 yield low and other signals across markets that point to the potential transition to an end-of-cycle dynamic leave us looking for late-summer consolidation to give way to an impulsive break to lower yield levels into 2025 as a bull market enters its acceleration phase.
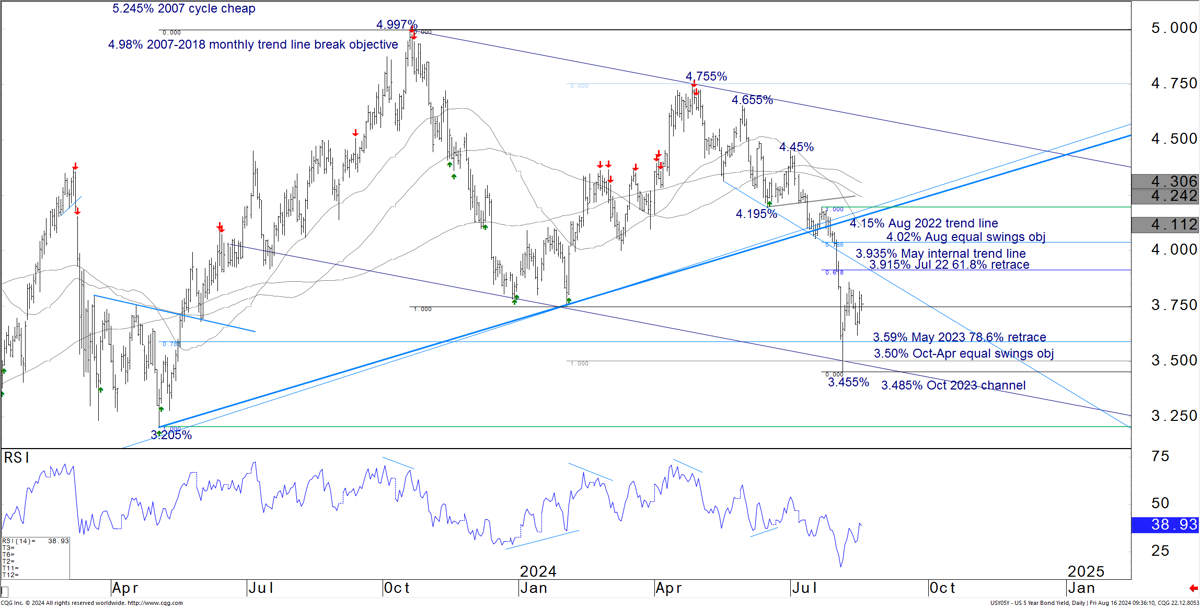
- The 5-year note consolidates after the mid-summer acceleration to lower yields. We expect the 3.91-4.02% support zone to cap yields through late summer. A break through 4.15-4.20% is needed to derail the bullish pattern structure at this point. The rally stalled near the 3.50% Oct-Apr equal swings objective and the associated channel trend line. We suspect that area will act as resistance for a few weeks.
- The 10-year note yield bullishly consolidates behind the 3.625% Apr 2023 78.6% retrace and in front of key support at 4.02-4.14%. We expect those two zones to define the trading range into the early fall. The next zone of chart resistance sits at 3.22-3.248%, targets for later this year or early 2025.
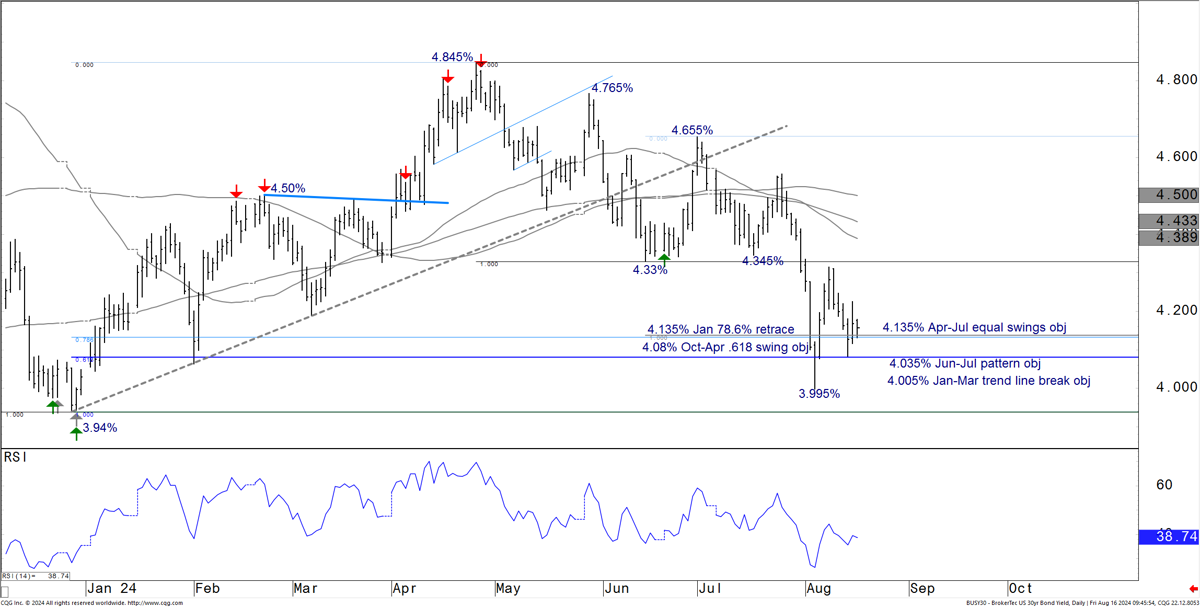
- The 30-year bond bullishly consolidates richer than the 4.33-4.345% Jun-Jul pattern riches and in front of the 4.40-4.50% confluence of moving averages. Look for further coiling around the 4.00% area in the weeks ahead.
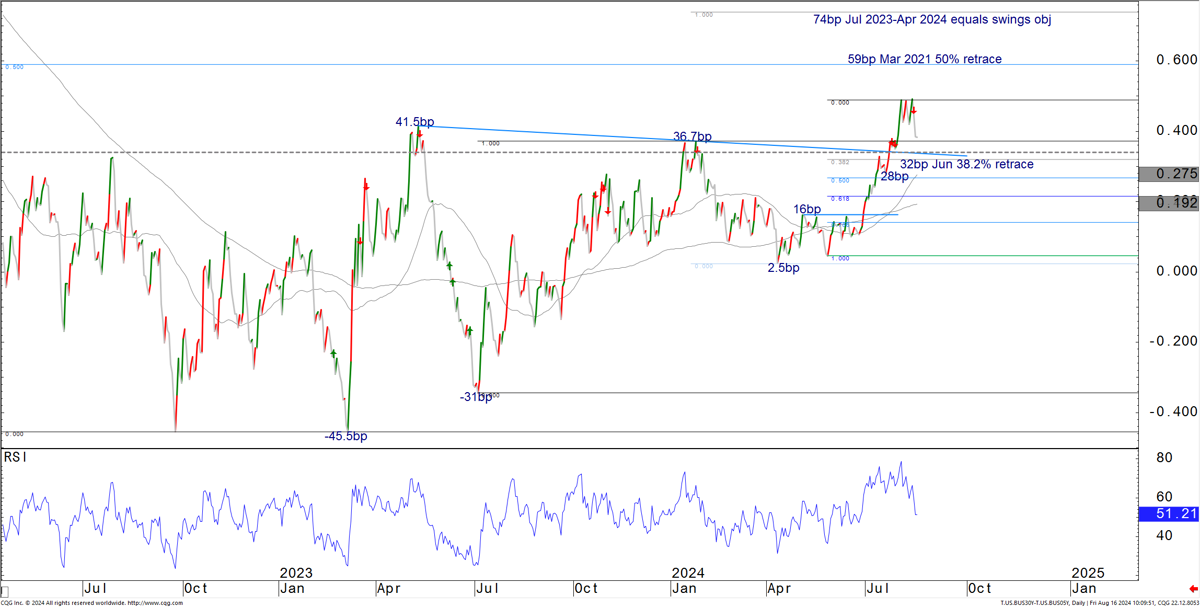
- Look for continued 5s/30s curve range trading below the 59bp Mar 2021 50% retrace and above the 28-32bp support zone in the weeks ahead. We think that range will consolidate the breakout from the 2022-2024 base pattern and give way to a more aggressive steepening trend in the months ahead.
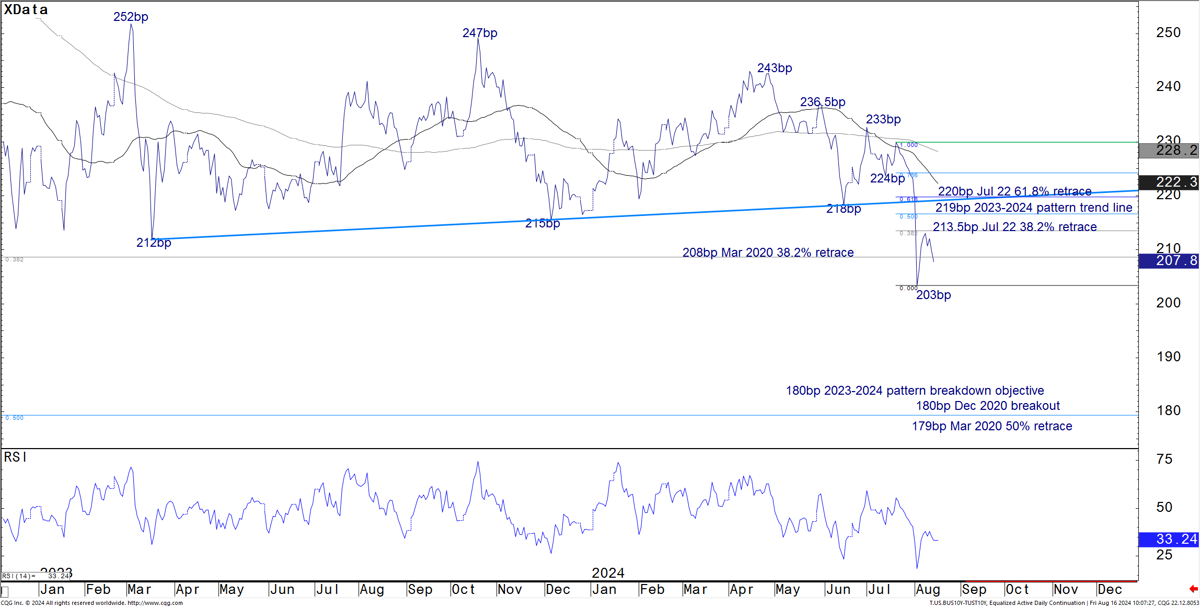
- The 10-year TIPS breakevens rebound from the 203bp Aug low stalled at the key 215-219bp breakdown resistance zone. We used the test of that resistance as an opportunity to initiate a tightening trade. While the market can see more backing and filling over the near term, we expect additional tightening pressure to build later this year and into 2025. We see the 180bp area as a base-case target for that period.
US
While we believe the Apr-Aug moves kicked off powerful trend dynamics that will lead to further bond market rally impulses into 2025, we suspect the rest of the month will give market participants the opportunity to enjoy what are usually heavy vacation weeks. We are looking for further consolidation after the early-Aug cascade to lower global bond yields. That same consolidation is likely to play out on curve and TIPS breakevens charts. The speed at which some equity indexes retook ground over the past week lowers our conviction that trends have entered a more acute phase of an end-of-cycle transition to some degree. However, the majority of those markets are still trading below Jun-Jul breakdown levels and thus still look vulnerable into risk-off seasonals that take hold into Sep provided they respect that resistance over the near term. For now, we suggest carrying a full 5s/30s curve steepening trade and a newly added 10-year TIPS breakevens tightening trade that we entered as the market tested expected resistance levels. We will look for opportunities to enter outright duration longs if the markets respect support as we anticipate in late Aug.
At the front end, the 2-year note has nearby support at the 4.115% Jan yield low, 4.18-4.20% Apr-Jul Fibonacci retracement confluence and payrolls bull gap ( Figure 21). We are looking for material buying interest to contain Aug-Sep backups near there, or at the 4.30-4.35% second zone of levels. As we get increased confidence in which of those two it will be, we will look to start entering a bullish trade. The medium-term bullish chart structure stays in gear as long as the market does not cheapen back thorugh the 4.595-4.66% pattern breakout levels and moving averages.
Figure 21: The 2-year note backup from 3.65% approaches the first zone of potential support at 4.115-4.20%. We expect the market to find its footing near that support or the 4.30-4.35% second confluence of levels over the near-term...
2-year note yield, daily bars with momentum divergence signals; %
Source: J.P. Morgan, CQG
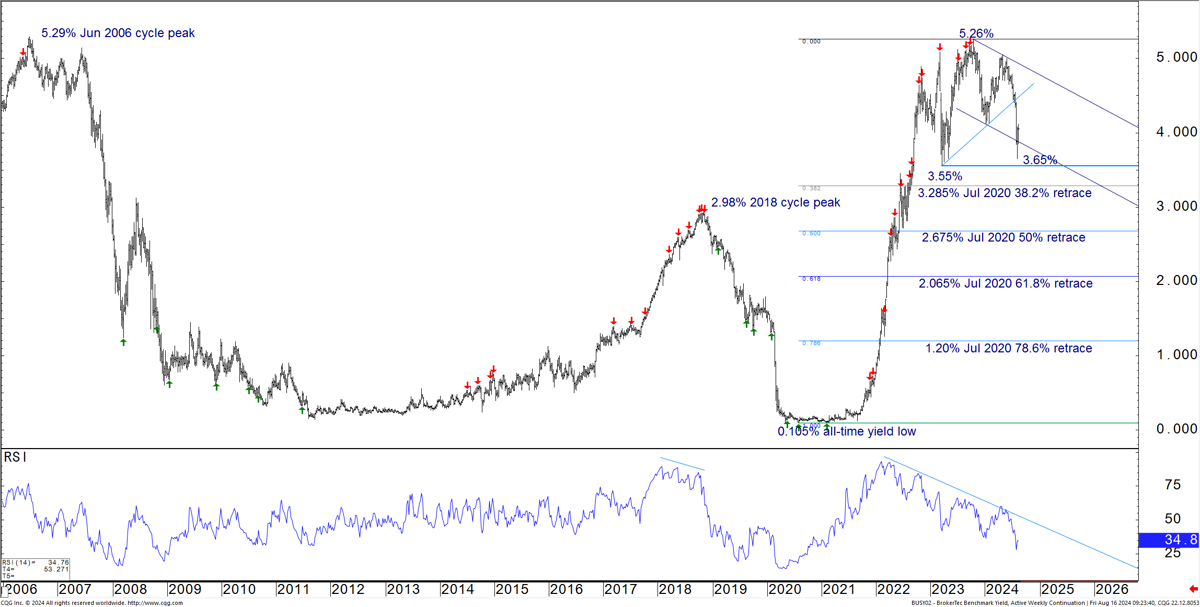
Bigger picture, we view the late-2022 through 2024 price action that has developed cheaper than 3.50% as a large bullish reversal pattern ( Figure 22). We suspect bullish consolidation to continue behind the 3.55% Mar 2022 yield low through the fall, but see the prospects for a release richer growing as the months roll by. Next resistance rests at the 3.285% Jul 2022 38.2% retrace and then 2.98% 2018 bear cycle cheap. We think the market will challenge those levels later this year or into early 2025.
Figure 22: … Bigger picture, what appears to be a multi-year yield top pattern developing behind the 3.55% Mar 2022 yield low and other signals across markets that point to the potential transition to an end-of-cycle dynamic leave us looking for late-summer consolidation to give way to an impulsive break to lower yield levels into 2025 as a bull market enters its acceleration phase.
2-year note yield, weekly bars with momentum divergence signals; %
Source: J.P. Morgan, CQG
The 5-year note has a similar short-, medium-, and longer-term pattern setup. Nearby support rests at the 3.915% Jul 22 61.8% retrace and 3.935% May internal trend line ( Figure 23). Medium-term bulls keep the agenda as long as backups respect the 4.02% Aug equal swings objective, 4.15% Aug 2022 trend line, and 4.195% Jun 14 yield low. While the recent data have reduced some angst regarding US growth, we do not envision a retest of those cheaper levels going forward. The Aug rally satalled near the 3.50% Oct-Apr equal swings objective and 3.485% Oct 2023 channel. Look for that area to keep a floor under yields for a few weeks. Next resistance rests at the 3.205% May 2023 yield low.
Figure 23: The 5-year note consolidates after the mid-summer acceleration to lower yields. We expect the 3.91-4.02% support zone to cap yields through late summer. A break through 4.15-4.20% is needed to derail the bullish pattern structure at this point. The rally stalled near the 3.50% Oct-Apr equal swings objective and the associated channel trend line. We suspect that area will act as resistance for a few weeks.
5-year note, daily bars with momentum divergence signals; %
Source: J.P. Morgan, CQG
The 10-year note backup from near the 3.625% Apr 2023 78.6% retrace has stalled in front of key support at the 4.02% Apr internal trend line, 4.05% Jul 24 61.8% retrace, and 4.14% Jul 17 yield low ( Figure 24). The market is currently working off the most extreme overbought reading on our TY premium-weighted Put/Call ratio z-score indicator since 2021, but the absence of the momentum divergence signaling that normally accompanies a more lasting trend reversal points to bull market consolidation and not a protracted retracement to higher yield levels. We suspect the intermediate sector will spend a few weeks in a 3.65% to 4.15% range and pressure to lower yields in the months ahead. Next resistance rests at the 3.50% Oct-Apr equal swings objective, with longer-term levels at the 3.248% Apr 2023 yield low and 3.22% Mar 2020 38.2% retrace.
Figure 24: The 10-year note yield bullishly consolidates behind the 3.625% Apr 2023 78.6% retrace and in front of key support at 4.02-4.14%. We expect those two zones to define the trading range into the early fall. The next zone of chart resistance sits at 3.22-3.248%, targets for later this year or early 2025.
10-year note yield, daily bars with momentum divergence and TY premium-weighted Put/Call z-score signals; %
Source: J.P. Morgan, CQG, CME
Figure 25: The 30-year bond bullishly consolidates richer than the 4.33-4.345% Jun-Jul pattern riches and in front of the 4.40-4.50% confluence of moving averages. Look for further coiling around the 4.00% area in the weeks ahead.
30-year bond yield, daily bars with momentum divergence signals; %
Source: J.P. Morgan, CQG
Figure 26: Look for continued 5s/30s curve range trading below the 59bp Mar 2021 50% retrace and above the 28-32bp support zone in the weeks ahead. We think that range will consolidate the breakout from the 2022-2024 base pattern and give way to a more aggressive steepening trend in the months ahead.
5s/30s curve, daily closes; bp
Source: J.P. Morgan, CQG
Figure 27: The 10-year TIPS breakevens rebound from the 203bp Aug low stalled at the key 215-219bp breakdown resistance zone. We used the test of that resistance as an opportunity to initiate a tightening trade. While the market can see more backing and filling over the near term, we expect additional tightening pressure to build later this year and into 2025. We see the 180bp area as a base-case target for that period.
10-year TIPS breakevens, daily closes; bp
Source: J.P. Morgan, CQG
This report was excerpted from Global Fixed Income Technical, Jason Hunter, August 16, 2024
TIPS Strategy
Initiate 5Yx5Y inflation swap longs
- Core CPI came in close to expectations, with some offsetting surprises within the details, and does little to change our medium -term inflation outlook. The fixings continue to imply a softer core CPI inflation over the balance of the year relative to our forecast
- Despite a partial rebound in breakevens over the last two weeks, the product has lagged the recovery in other markets and breakevens remain cheap versus our fair value estimates. Given the recent improvement in economic data, we now recommend initiating long exposure
- With the Fed likely to begin cutting rates next month, we note that breakevens have not exhibited a consistent performance around the start of prior easing cycles. However, a Fed that is cutting due to risks coming into better balance and a desire to return policy rates quickly to neutral should be more supportive for breakevens than a Fed that is behind the curve
- Demand for TIPS-focused funds has picked up alongside the decline in real yields and improvement in realized TIPS returns, driving the 4-week moving average of inflows to its highest level in more than 2 years
- Along the curve, the intermediate sector offers value, and we prefer to express longs in inflation swaps rather than breakevens, given that IOTAs remain tight. 5Yx5Y inflation swaps also avoid the seasonally negative carry of spot breakeven positions
Market views
Over the last two weeks, 5-, 10-, and 30-year breakevens widened 8bp, 8bp, and 6bp, respectively, alongside an improvement in economic data. Specifically, the ISM employment index rose from 46.1 to 51.1, and initial jobless claims moved back down to 227K, after rising to 250K two weeks ago. The July retail sales data came in stronger than expected, leading our economists to revise up their 3Q real consumption growth estimate to 2.0% from 1.1% previously (see US: July retail sales suggest no slowing in 3Q real spending, Abiel Reinhart, 8/15/24). Inflation news was relatively benign. Though core PPI was softer than expected, with the index unchanged in July, core CPI came in line with expectations, rising 0.17% m/m and leaving the year-ago rate unchanged at 3.2%. With CPI and PPI data in hand, we estimate a 0.12% rise in core PCE in July, with the year-ago rate holding steady at 2.6% (see US: Cooler July CPI, as expected, Michael Hanson, 8/14/24).
Turning to the details of the CPI report, the headline CPI-U NSA printed at 314.54 in July, below the market fixing of 314.63. Energy prices were flat on the month, while food prices rose 0.2% as expected. Meanwhile, core goods prices fell 0.32%, the softest reading since January, held down by a 2.3% decline in used vehicle prices ( Figure 28). Though industry data imply another decline in used car prices in August, more recent data have shown an increase in prices, and we generally look for greater stability in vehicle prices over the remainder of the year relative to what we’ve observed YTD (see Focus: Vehicle Prices, Michael Feroli, 7/19/24). Core services also came in line with our forecast, rising 0.31%, though with some offsetting surprises within the details. Rent and OER firmed somewhat more than anticipated, rising 0.49% and 0.36%, respectively, with both components rising faster in larger cities. Overall, this does not derail our view that we should see softer rent inflation readings over the balance of the year, particularly on a seasonally-adjusted basis. However, we note that fundamentals in the rental market remain strong, which could make it difficult for rent inflation to return to its pre-pandemic pace, absent more significant economic weakening (see CMBS Weekly, Chong Sin, 8/2/24). Away from rents, medical care services came in softer than expected, driven by an outsized 1.9% decline in outpatient hospital services, which is unlikely to be repeated going forward. Other components were generally in line with expectations.
Figure 28: Core CPI rose 0.17% m/m in July, with strength in rent components offset by unexpected weakness in medical care services
Select categories of core CPI; units as indicated
| Category | Weight | % m/m | % 3m saar |
| Core Goods | 23.68% | -0.32% | -1.9% |
| New vehicles | 4.62% | -0.2% | -3.3% |
| Used cars and trucks | 2.52% | -2.3% | -12.3% |
| Other core goods | 16.54% | 0.0% | 0.1% |
| Core Services | 76.32% | 0.31% | 2.7% |
| Rent of primary residence | 9.61% | 0.49% | 4.7% |
| OER | 33.55% | 0.36% | 4.4% |
| Core services ex-rent & OER | 33.16% | 0.21% | 0.4% |
| Lodging away from home | 1.68% | 0.2% | -7.4% |
| Health insurance | 1.01% | -0.4% | 0.8% |
| Airline fares | 0.94% | -1.6% | -34.0% |
| Auto insurance | 3.50% | 1.2% | 8.2% |
| Other core services | 27.71% | 0.2% | 1.4% |
| Core CPI | 100.00% | 0.17% | 2.1% |
Source: J.P. Morgan, BLS
Figure 29: The fixings imply very soft core CPI inflation over coming months
CPI fixings and implied inflation rates*; units as indicated
| Month | Fixing | Implied headline % m/m sa | Implied headline % oya | Implied core % m/m sa | Implied core % oya |
| Aug-24 | 314.700 | 0.10% | 2.50% | 0.09% | 3.07% |
| Sep-24 | 314.840 | 0.16% | 2.29% | 0.15% | 2.90% |
| Oct-24 | 314.660 | 0.06% | 2.27% | 0.21% | 2.87% |
| Nov-24 | 314.070 | 0.17% | 2.29% | 0.12% | 2.67% |
| Dec-24 | 313.850 | 0.26% | 2.32% | 0.12% | 2.51% |
| Jan-25 | 315.210 | 0.19% | 2.20% | 0.28% | 2.40% |
| Feb-25 | 316.370 | 0.19% | 1.95% | 0.22% | 2.26% |
| Mar-25 | 317.880 | 0.21% | 1.78% | 0.43% | 2.33% |
| Apr-25 | 318.820 | 0.22% | 1.68% | 0.21% | 2.25% |
| May-25 | 319.560 | 0.07% | 1.75% | 0.02% | 2.10% |
| Jun-25 | 320.210 | 0.11% | 1.92% | 0.02% | 2.06% |
Source: J.P. Morgan
* To derive market-implied core inflation rates, J.P. Morgan forecasts for food and energy CPI are used
Over the past month or so, we have recommended a neutral stance on breakevens and had noted in late July that we would look for cheaper valuations to add bullish exposure. Though that cheapening came in the wake of the July employment report, we were patient to initiate wideners given that the details of the report, combined with the large move up in initial jobless claims, suggested a greater risk of a more significant deterioration in labor markets than we had expected (see TIPS Strategy, 8/2/24). However, the improvement in data over the last two weeks, including the full reversal lower in claims, leaves us more comfortable with fading the cheapening. Indeed, we think there’s room for breakevens and inflation swaps to richen in the near term for a number of reasons.
First, the very front end of the curve continues to imply a very soft trajectory for core CPI inflation over coming months, well below our own forecast. Specifically, we estimate the fixings imply roughly a 0.15% m/m pace on average through October, below our own forecasts near a 0.21% m/m pace ( Figure 29). As discussed above, though we look for some softening in rent inflation through the fall, the weakness in some of the other categories are unlikely to be repeated, which should drive a modest rebound in the pace of sequential core CPI inflation.
Second, though breakevens across the curve have already partially rebounded from their narrowest levels alongside better data, the recovery in inflation has lagged other markets, and intermediate breakevens in particular remain near their narrowest levels since the failure of SVB ( Figure 30). Meanwhile 10-year breakevens still appear roughly 11bp too narrow versus our fair value framework, more than the standard error of the model ( Figure 31).
Figure 30: Despite rebounding partially wider alongside better data, intermediate breakevens remain near their narrowest levels since the failure of SVB...
1-month forward, seasonally-adjusted breakevens; bp
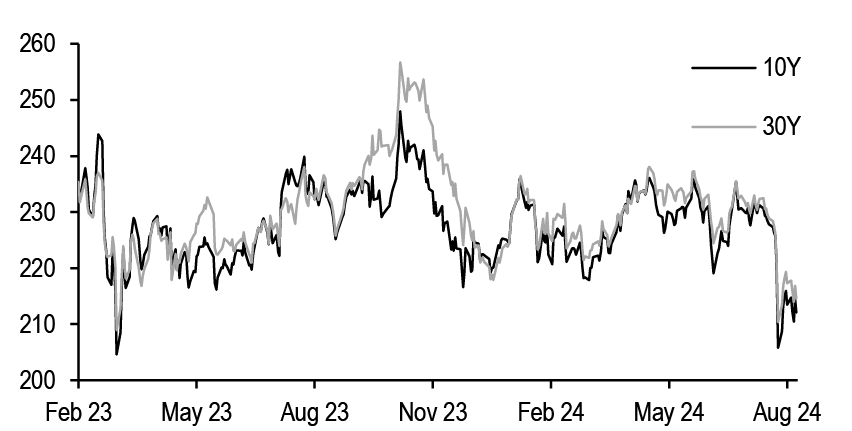
Source: J.P. Morgan
Figure 31: ...and remain 11bp narrow versus our fair value framework
Residual on J.P. Morgan 10-year breakeven fair value model*; bp
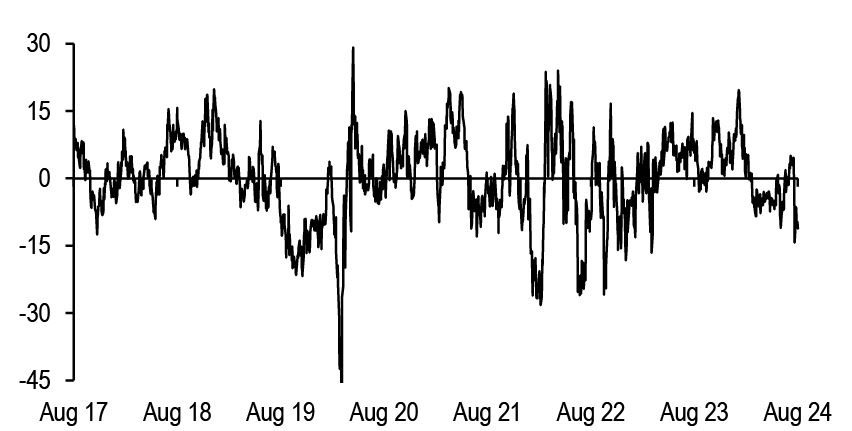
Source: J.P. Morgan
*1m-forward, seasonally-adjusted breakevens are regressed on the J.P. Morgan Commodity CurveIndex (JPMCCI) as well as its square and the 3mx3m/15mx3m OIS curve; regression over the last 7years; R2=93%, SE=9bp
Third, with the Fed very likely to begin cutting interest rates next month, we think the context in which the Fed is easing and the evolution of the economic data is likely to be important in determining the path forward for breakevens. A Fed that is cutting due to risks coming into better balance and a desire to return policy rates quickly to neutral to sustain a soft landing should be far more supportive for breakevens than a Fed that is behind the curve and responding to a deterioration in labor markets. Notably, even as nominal yields have consistently declined in the months around the first ease in a cutting cycle, the behavior of breakevens has not been uniform. Figure 32 shows the cumulative change in 10-year breakevens from 1 month prior to the first ease through 3 months after for each of the last three easing cycles. While breakevens narrowed at the start of the 2001 easing cycle, breakevens widened in 2007 and were virtually unchanged in 2019.
Fourth, given the significant decline in real yields over recent months and the improvement in realized TIPS returns, inflows into TIPS-focused funds have picked up, despite the continued moderation in inflation: Figure 33 shows that the 4-week moving average of weekly net inflows has risen to $215mn, the highest in over 2 years. Meanwhile end-user takedown at TIPS auctions has continued to come near record levels, with takedown at the July 10-year auction rising to 92.1%. Against this backdrop, we think it’s unlikely that the recent cheapening in breakevens can be sustained.
Figure 32: TIPS breakevens have not displayed a consistent pattern in the months after the first ease in a cycle
Cumulative change in 10-year TIPS breakevens from 1 month prior to the first ease in a cycle through 3 months after; bp
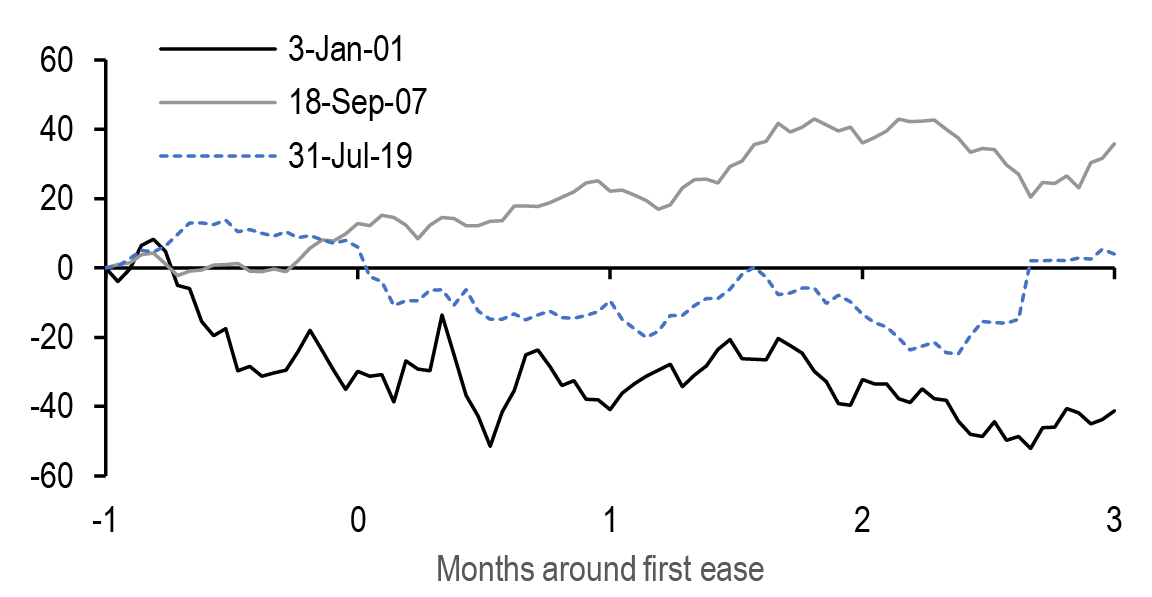
Source: J.P. Morgan
Figure 33: As expected, the improvement in realized TIPS returns has driven a pickup in inflows to TIPS-focused funds
Weekly net inflows into TIPS-focused ETFs and 4-week moving average; $mn
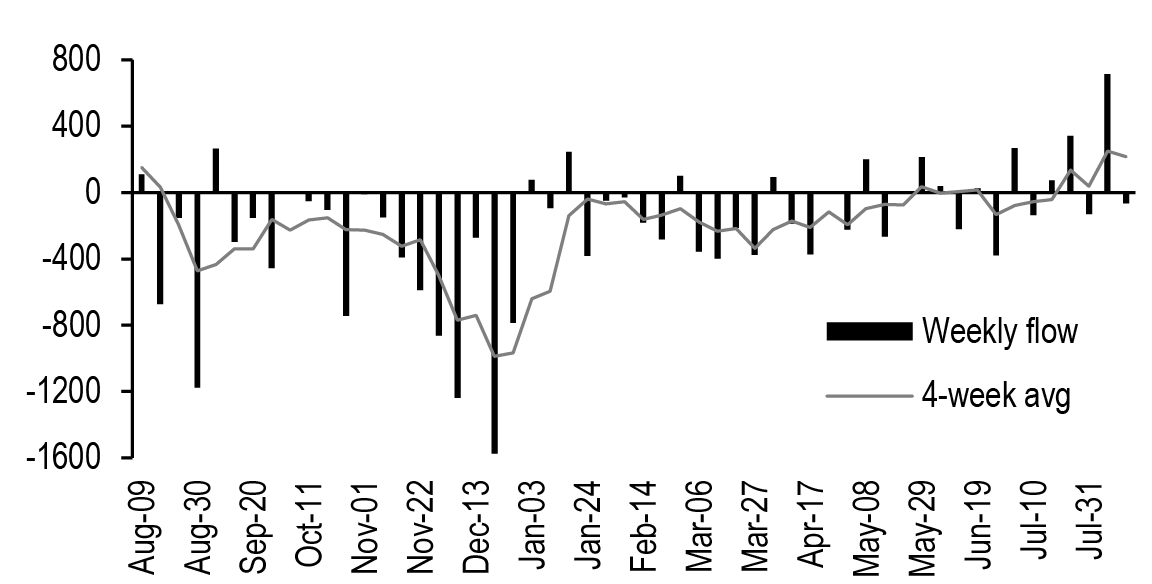
Source: EPFR
Along the curve, we think the intermediate sector offers value, having underperformed versus the wings in recent weeks. Notably, the 5Yx5Y/10Yx20Y curve has steepened sharply, trading 1.3 standard deviations above its 1-year average ( Figure 34), and the 2Yx3Y/5Yx5Y/10Yx20Y PCA-weighted butterfly is trading at its cheapest levels of the past year. Moreover, consistent with the valuation signal from our fair value framework, we can see that 5Yx5Y inflation swaps had been tightly correlated with 5Yx5Y Treasury yields for much of the last 9 months before deviating sharply in recent weeks ( Figure 35). 5Yx5Y inflation swaps offer the benefit of relative value along the curve while also avoiding the seasonally negative carry of spot breakevens. Lastly, we’ve discussed in the past, we prefer to express longs in inflation swaps rather than cash breakevens, given that IOTAs continue to trade near multiyear tights and likely have room to widen further from here (see TIPS Strategy, 7/26/24). Putting the pieces together, we recommend adding tactical longs in 5Yx5Y inflation swaps at current levels (see Trade recommendations).
Figure 34: Along the curve, we think the intermediate sector offers value, having underperformed versus the wings in recent weeks
5Yx5Y/10Yx20Y inflation swap curve; bp
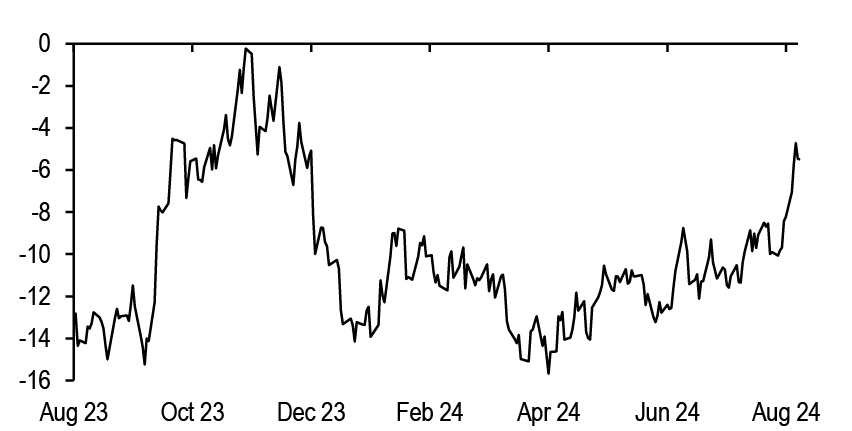
Source: J.P. Morgan
Figure 35: 5Yx5Y inflation swaps had been tightly correlated with 5Yx5Y Treasury yields for much of the last 9 months before deviating sharply in recent weeks
5Yx5Y inflation swaps (LHS) versus 5Yx5Y Treasury yields (RHS) derived from our par curve; % both axes
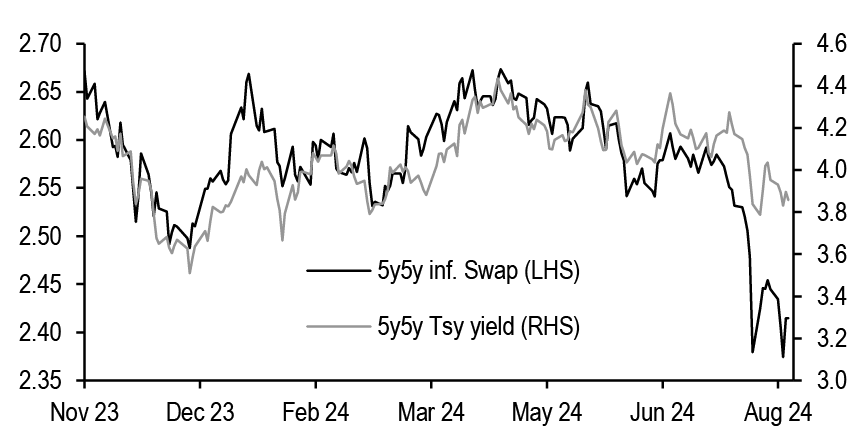
Source: J.P. Morgan
Trade recommendations
- Initiate 5yx5y inflation swap longs
- Initiate long 100% risk, or $50mn notional of 5yx5y inflation swap (swap start: 8/20/29, swap end: 8/20/34) at 243.0bp.
Figure 36: Trade performance over the past 12 months
P/L reported in bp of yield unless otherwise indicated
| TRADE | ENTRY | EXIT | P/L | |
| 1Yx1Y inflation swap longs | 6/14/2024 | 7/10/2024 | 17.5 | |
| Jul 24/Jul 25 BE wideners | 5/10/2024 | 5/28/2024 | 11.7 | |
| 10Yx20Y breakeven wideners | 4/12/2024 | 4/26/2024 | 4.7 | |
| Long 5Y TIPS | 3/20/2024 | 4/25/2024 | -31.0 | |
| 6mx1Y breakeven wideners | 4/5/2024 | 4/19/2024 | 7.3 | |
| Old 10s/30s breakeven curve steepeners | 2/23/2024 | 4/12/2024 | -5.6 | |
| Long 1Y inflation swaps (hedged) | 3/8/2024 | 4/5/2024 | 7.0 | |
| 5-year TIPS longs | 2/9/2024 | 3/7/2024 | 9.9 | |
| 10-year energy-hedged BE narrowers | 1/19/2024 | 1/30/2024 | 7.5 | |
| 30-year breakeven narrowers | 11/9/2023 | 12/7/2023 | 21.7 | |
| 5Yx5Y inflation swap shorts | 9/29/2023 | 10/13/2023 | 2.8 | |
| 3Yx2Y breakeven narrowers | 7/28/2023 | 9/12/2023 | 5.3 | |
| AGGREGATE: | ||||
| Number of trades | 12 | |||
| Number of winners | 10 | |||
| Hit ratio | 83% | |||
| Aggregate P/L (bp of yield) | 58.8 | |||
Source: J.P. Morgan
Interest Rate Derivatives
Hopscotch
- Policy uncertainty is back in the picture. Although markets appear to agree on September with respect to timing, the pace and extent of easing remains uncertain for this year and the next. Such policy uncertainty is an important driver of jump risk, which is already evident. All of this supports a bullish view on short expiry volatility, despite the apparent richness of implieds - although implied volatility in most sectors appears rich relative to our fair value estimates, our analysis suggests that policy uncertainty is currently significant enough to be a strong offset. Therefore, we maintain our bullish stance on short expiry vol
- The zero duration swap spread appears too narrow to fair value and we believe this is likely to correct in the near term as dealer capacity returns in repo markets. With front end spreads appearing to find a bottom, we maintain our widening bias on swap spreads at the front end
- At the same time, term funding premium is likely biased wider in coming weeks and months, which should pressure longer maturity swap spreads narrower and the spread curve flatter - initiate 10Y swap spread narrowers and initiate 3s/7s spread curve flatteners
- One a relative basis, the swap spread curve between the 2-year note front and back contract CTDs appears too steep, likely because of futures market technicals, and should correct as the roll progresses - initiate 0.875% Jun 2026 / 0.875% Sep 2026 maturity matched swap spread curve flatteners
- The ampleness of Reserves received some attention this week, thanks to recent work by Fed staff that outlines an elegant approach to measuring this by examining the slope of the demand curve in the fed funds market. We borrow the spirit of this work, but believe that it is important to (i) expand the concept of liquidity to include RRP as well as Reserves, and (ii) focus on SOFR rather than the effective funds rate when examining the sensitivity to quantity shocks. Our expanded analysis suggests that liquidity conditions are clearly tightening and QT is likely in its end game. But thanks to a tapered pace, a little more room for RRP declines, and an expected reduction in the TGA later this year, there will likely be a few more months of headroom for QT before it ends. We look for QT to reach an end later this year with the Fed balance sheet near ~$7tn, RRP balances slightly below ~$300bn and Reserves near ~$3.3tn
- Earlier this month, the expiry of benchmark 3M expiry swaptions first crossed the November election date. By examining the relative performance of election-impacted expiries (3M in this case) versus a control expiry such as the 6M, we can infer election premia being priced into the vol markets. The current experience suggests that options markets view election risk as extending to ~4 business days after election, for a cumulative election premium of ~6 additional vol days. This is lower than the experience in May when 6M expiries first crossed the election - back then, cumulative premia peaked near 15 additional vol days, spanning a period ending 7 business days after the election. This is a reminder that shifts in election sentiment could impact short expiry implied volatility in coming weeks
- We include a short summary of our outlook for Treasury futures calendar spreads as we head towards the September - December roll cycle; we recommend selling the FV and buying the US weighted calendar spreads
Hopscotch
August started with a bang, as the soft Payrolls report caused markets to pivot sharply towards pricing in aggressive easing, and yields reached their recent trough on that same day (the 2nd of August). But even right then, it appeared to be an over-reaction. After all, earlier that same week, Fed Chair Powell had noted during the press conference that the Fed would watch the data, not data points. Given that, the post-Payrolls appeared to be a case of "too-much, too-soon" even then. The past two weeks appear to be proving that point. Forward OIS rates have risen rather steadily from their post-NFP lows, and are now near the higher end of their 2-week range (Figure 1). This normalization in Fed expectations has been helped by Fed-speak in recent weeks. As seen in Figure 2, it is apparent that Fed speakers have increased their focus on labor markets relative to inflation, but they also appeared to dispel or downplay recession fears (Figure 2). All in all, markets appear engaged in a game of hopscotch, collectively trying to land on the correct square.
Figure 1: Forward OIS rates have risen steadily from their post-NFP lows
Forward 1M OIS rates and statistics at FOMC meeting dates for Sep 2024, Nov 2024, Dec 2024, and Jan 2025, 8/2/2024 - 8/16/2024; %
| start | chg | end | min | mean | median | max | ||
| Forward OIS atmeeting dates | Sep | 4.87 | 0.15 | 5.02 | 4.84 | 4.94 | 4.95 | 5.02 |
| Nov | 4.44 | 0.28 | 4.72 | 4.44 | 4.59 | 4.61 | 4.72 | |
| Dec | 4.13 | 0.26 | 4.39 | 4.12 | 4.27 | 4.29 | 4.41 | |
| Jan | 3.90 | 0.25 | 4.15 | 3.89 | 4.04 | 4.03 | 4.17 |
Source: J.P. Morgan.
Figure 2: Fed speakers are now focused on both inflation and labor markets, but voiced caution in terms of cutting expectations and downplayed recession risks
Selected Fed-speak excerpts, 8/2/2024 - 8/16/2024
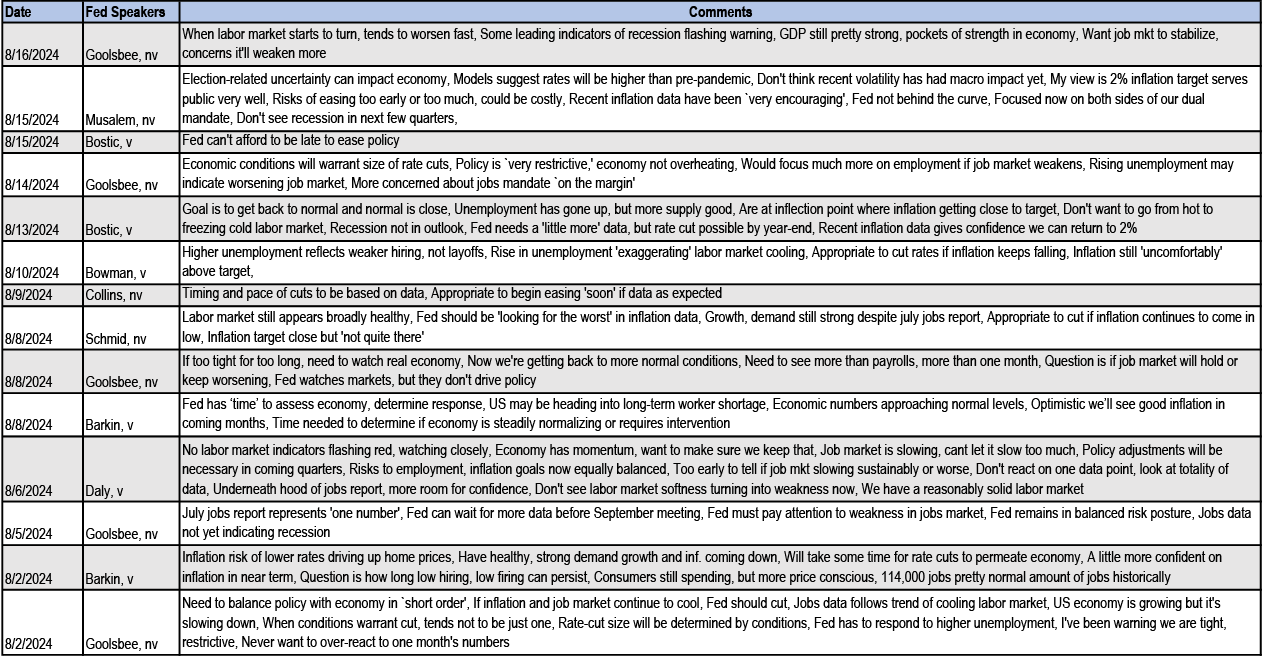
Source: J.P. Morgan., Bloomberg Finance L.P.
Going forward, given the extent of retracement that has already happened, front end yields and Fed expectations will likely remain rangebound in the near term, until more clarity emerges from next month's employment report (which remains 3 weeks away), or perhaps at the Jackson Hole symposium next week. Thus, until then, markets will likely remain somewhat in limbo, but in a state of heightened sensitivity to data. We have often noted that policy uncertainty is an important driver of jump risk, and policy uncertainty is now back after several months of relative clarity. To be sure, it now appears highly likely that rate cuts will begin in September, but the pace and extent of easing remain uncertain in the eyes of the market. By carefully de-constructing the implied probability density function inferred from call and put premia on Z4 SOFR futures, we obtain combination weights (which must sum to one) that are associated with policy outcome scenarios (see Powell sees the data, markets see one data point more details). Right now, the sum total of weights associated with shallow-cut scenarios (defined as under 75bp of easing by year end, or under 150bp by mid-2025) is quite comparable with the total weight on deep cut scenarios (defined as 125bp or more of rate cuts by year end, or 175bp or more easing by mid-2025). This means that policy uncertainty is once again elevated, after a brief 2-month period where markets had converged on shallow-cut expectations. Moreover, such policy uncertainty is also a feature further forward, which can be seen by examining implied distributions on June 2025 SOFR futures as well (Figure 3).
Figure 3: Policy uncertainty remains elevated, not just in the near term but also at a mid-2025 horizon
Total weights on YE24 and 1H25 policy rate scenarios representing Shallow Cuts*, and Deep Cuts*, as calculated from a decomposition of the implied probability distribution associated with Dec 2024 and June 2025 SOFR futures**; May 2024 – Current
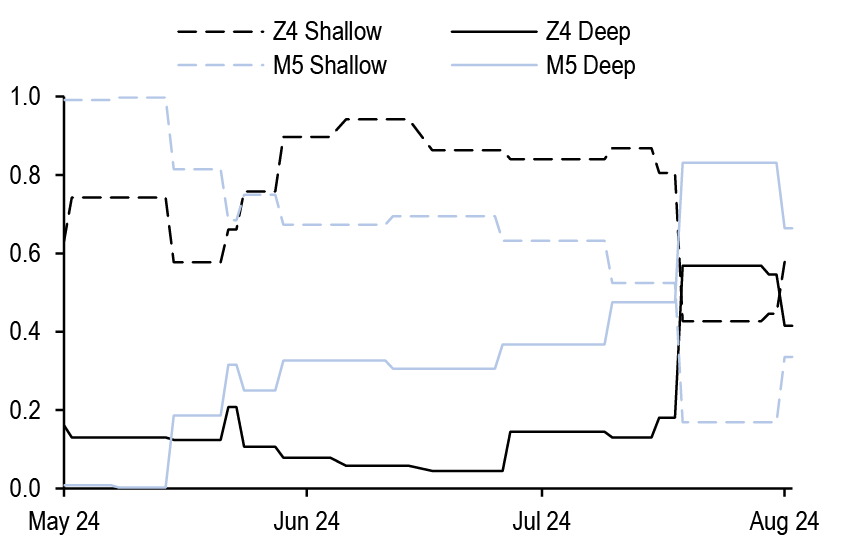
Source: J.P. Morgan.
* Scenarios involving 75bp or less in rate cuts by YE24, or 150bp or less of rate cuts by mid-2025, are defined as shallow cut scenarios. Deep cut scenarios are those with even more easing by those respective horizons. For more details, see Figure 2 of What’s the rush?.
** We enumerate a list of scenario-specific Normal distributions with fixed standard deviations and means that are separated by 25bp, and then require the implied distribution to be a weighted combination of these individual distributions. The weights are then solved for, by fitting to the observed prices of calls and puts at various different strikes. For more details of our approach, see What’s the rush?.
Figure 4: The frequency of jumps is already higher, and will likely remain so thanks to policy uncertainty
Rolling 2-week jump frequency (%), and policy certainty metric (right, inverted)**, 6/20 - current
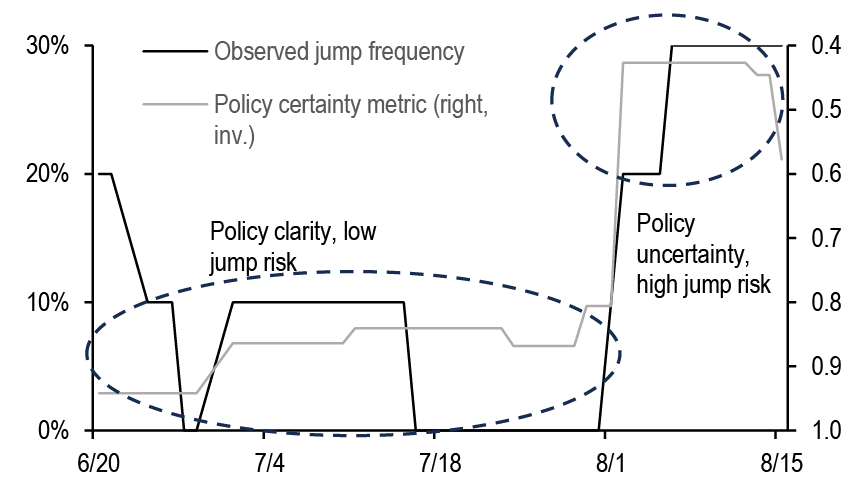
Source: J.P. Morgan.
*A jump is defined as any daily change in UST 10Y yields over 10bp, on an absolute basis. Jump frequency is defined as the number of times a jump has occurred in the past two weeks, divided by the number of observations in that period** Policy certainty metric is the weight on the "shallow" cuts scenario (for YE24) as defined in Figure 3. A high weight on this scenario implies policy certainty, and a weight closer to 0.5 implies policy uncertainty
But why do we dissect implied distributions to measure policy uncertainty in this manner? Because policy uncertainty is an important driver of jump risk - as new information causes markets to reassess these weights, that can result in large moves in forward OIS rates since the cone of policy outcomes is quite wide. Indeed, this is already evident - in the two weeks since Payrolls, there have been three days when 10-year yields changed by 10bp or more from the previous days close (Figure 4). Thus, jump risk is already high, resulting in high delivered volatility. This is a strong argument in favor of maintaining a bulllish stance on short expiry volatility going forward. But one factor that stands in opposition is valuations. Our longer term fair value framework, which uses 5 years of history and is based on intuitive observables (see Interest Rate Derivatives 2024 Mid-Year Outlook) suggests that implieds currently are rich with respect to fair value (Figure 5). This is especially true in shorter expiry / shorter tail structures, where the residuals are above 0.5 bp/day. Is this sufficient to erode the case for bullish vol exposure?
We think it is not, and we can see this in two independent ways. One, given the current observed frequency of jumps, and assuming this persists (which we think is likely), and given the typical size of moves on jump and non-jump days, delivered volatility will likely be above current levels of implied volatility. This is seen in Figure 6, where we project future delivered using a simple calculation that assumes current jump frequencies and jump and non-jump move magnitudes in each sector. Of course, this relies heavily on jump frequency assumptions.
Figure 5: Implied volatility appears rich compared to our longer term fair value framework...
Residual from our implied volatility fair value framework*, 8/15/2024; bp/day
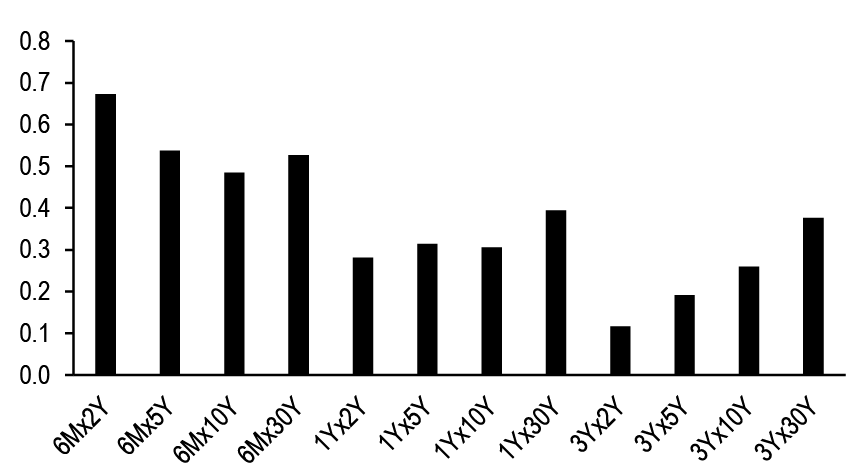
Source: J.P. Morgan.
* For details please see Interest Rate Derivatives 2024 Mid-Year Outlook
Figure 6: … but appears cheap given the observed frequency of jumps and size of typical moves in the past two weeks
Observed jump frequency* (%), average jump size and non-jump size (bp), as well as projected realized volatility** and current implied volatility (bp/day), 8/15/2024

Source: J.P. Morgan.
*A jump is defined as any daily change in yields over 10bp, on an absolute basis. Jump frequency is defined as the number of times a jump has occurred in the past two weeks** Calculated as square root of jump size squared times jump frequency plus non-jump size squared times non-jump frequency
A more robust approach to answering this question also points to the same conclusion. We turn to our empirical model for daily delta hedged short gamma returns, which we modify to include the current implied volatility residual (to capture the impact of current valuations) as well as our metric for policy clarity (as a factor that drives jump risk). Figure 7 shows regression statistics from our empirical model. As one might expect, policy clarity and a high residual benefit short gamma positions, and the corresponding coefficients all have the expected signs (except in 2Y tails, where the ex ante residual turns out to be statistically less significant.
As Figure 7 shows, returns from selling volatility over the next month are projected to be mostly flat, despite the richness in implieds. Thus the carry cost of holding long volatility positions in short expiries is likely to be fairly low. Therefore, given the potential for significant moves and high jump risk in the next few weeks from Jackson Hole symposium, PCE and August payrolls, we maintain our long volatility bias in shorter expiries, and continue to recommend expressing it in 5-year tails.
Figure 7: Returns from selling volatility are likely to be flat in the near-term
Statistics from regressing* monthly short delta hedged straddle returns (bp/notional) against ex-ante implied vol (bp/day), ex-ante metric of policy expectations stability** (unitless) ,ex-ante ATMF (%), and ex-ante residual† (bp/day) as well as current (8/15) values of drivers and projection and normalized projection***

Source: J.P. Morgan.
*Regression over past 6 months** Policy expectations stability is defined as the weight on "shallow cuts" scenario shown in Figure 3***Projection is calculated by using the current drivers and the coefficients. Normalized projection is calculated by dividing the projection by standard error
†Residual from fair value framework as shown in Figure 5
Swap spreads
In a period where yield levels and the curve have been fairly volatile, swap spreads have been rather stable. After trading in relatively tight ranges of 1.5-2.5bp, swap spreads are roughly flat across the curve - maturity matched swap spreads are about 1bp wider in the front end, modestly narrower in the belly of the curve, and flat at the long end (Figure 8).
Figure 8: Swap spreads have remained stable over the past two weeks
Selected statistics for maturity matched SOFR swap spreads, 8/2 - 8/16; bp
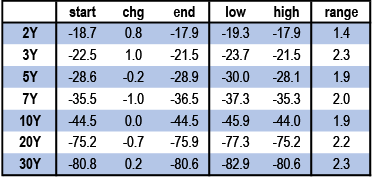
Source: J.P. Morgan.
We continue to view swap spreads predominantly through the lens of the macro-drivers that shape the term structure of swap spreads - term funding premium, which specifies the slope of the term structure, and zero-duration spreads, which specifies the intercept and thus the level of front end spreads more broadly (for more details on our framework, see Term Funding Premium and the Term Structure of SOFR Swap Spreads). Currently, term funding premium stands near its lows of the past 5 months or so, and is now about 0.25bp/year below fair value (Figure 9). Should this correct itself, which we expect since this has been reasonably mean-reverting around estimates of fair value, that would imply a narrowing bias of 2bp and 4bp respectively in 10- and 30-year swap spreads, respectively. But at the front end, perhaps the bigger driver of swap spreads in recent weeks has been zero duration spreads, which have narrowed sharply on an outright basis as well as relative to its fair value - currently, we estimate that zero-duration spreads are as much as 7bp too narrow relative to fair value (Figure 10). We believe this will correct in the near term. As we have noted recently (see Joie de Louvre), the cheapness of zero-duration spreads was likely due to upward pressure on GC repo rates stemming from repo market plumbing issues as foreign dealers pulled back in late June and July. But this appears to be normalizing and money market funds' allocations to repo has climbed recently, as evidenced by the sharp drop in O/N RRP balances (see July MMF holdings update: MMFs and their use of Fed ON RRP, T. Ho, 8/15/2024). In other words, the RRP appears to be finally playing its role in moderating stresses in repo markets. This is healthy, and we expect GC repo rates to drift back lower in coming weeks, which should help support a normalization in zero duration spreads.
Figure 9: Term funding premium stands near its recent lows, and is now about 0.25bp/year below fair value
Term funding premium*, actual versus current (8/14) fair value**, 3/4/2024 - 8/14/2024; (bp/year)
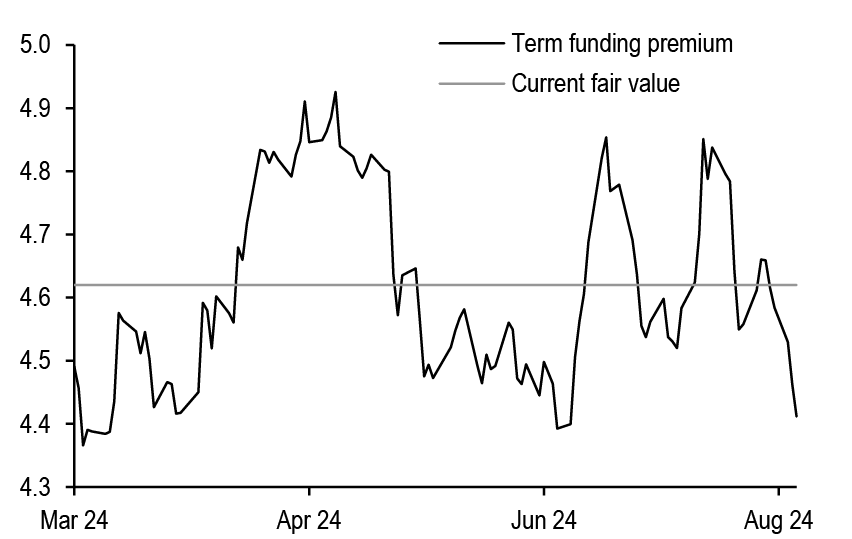
Source: J.P. Morgan.
* For details on our methodology for calculating Term funding premium, see Term Funding Premium and the Term Structure of SOFR Swap Spreads
** For details on our fair value framework for term funding premium, see Interest Rate Derivatives 2024 Mid-Year Outlook
Figure 10: We estimate that zero-duration spreads are as much as 7bp too narrow relative to fair value
Residual from regression of zero-duration swap spread* versus its drivers**, past 6 months; bp
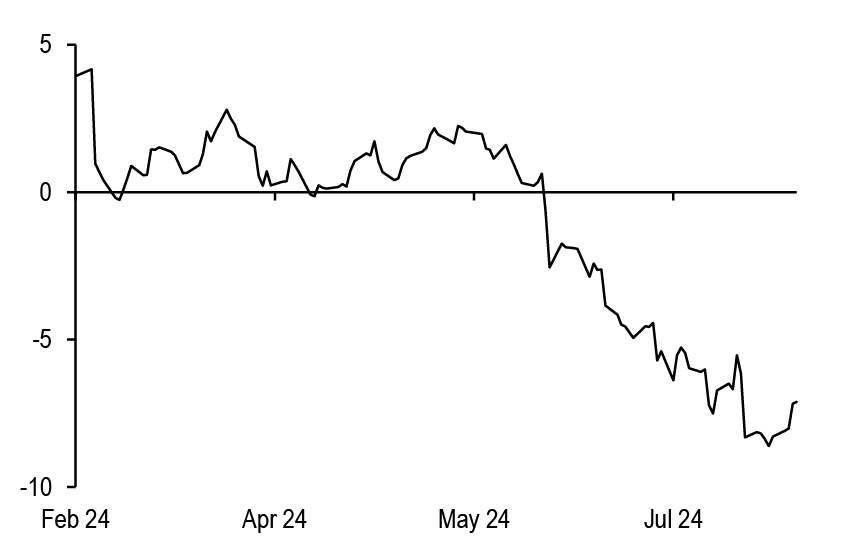
Source: J.P. Morgan.
* For details on our methodology for calculating Zero-duration swap spreads, see Term Funding Premium and the Term Structure of SOFR Swap Spreads
** For details on our fair value framework for zero-duration swap spreads, see Interest Rate Derivatives 2024 Mid-Year Outlook
These two observations together underpin our views on swap spreads across the curve. First, our anticipation of wider zero-duration spreads is a factor that strongly supports a widening bias in front end spreads, since the front end will be much less negatively impacted by any increase in term funding premium. The case for front end wideners is further strengthened by the fact that we would expect 2- and 3-year swap spreads to trade ~2bp wide to the fitted term structure. In other words, as seen in Figure 11 , 2- and 3-year maturity matched swap spreads are currently trading pretty close to the fitted term structure of spreads (that is specified by term funding premium and zero-duration spreads), but empirical models of historical deviations suggest that they should trade slightly wide relative to the term structure (to the tune of 1.5-2bp). Thus, all things considered, we maintain our bullish bias on front end swap spreads.
In the 10- and 30-year sectors, the upward impact on spreads from a widening in zero-duration spreads will likely be counteracted by three other considerations. First, a near term correction in term funding premium, should it occur, would pressure 10- and 30-year spreads narrower by ~2bp and ~4bp respectively. Second, and perhaps more important, we also expect term funding premium to drift higher over the medium term on the back of continuing QT and elevated duration supply in the Treasury market. Should term funding premium climb to 5bp/year by year end as we projected (see Interest Rate Derivatives 2024 Mid-Year Outlook), that would imply an additional 4-5bp and 8-10bp of narrowing pressure respectively. Even if this is only partially realized, the narrowing pressures at the long end are significant. Lastly, Figure 11 also suggests that 10Y and 30Y spreads are currently trading above the fitted term structure by ~2bp more than we would expect based on empirical models of historical deviations. Thus, given this confluence of factors, we are biased towards narrower swap spreads in the long end of the curve (see Trade recommendations).
Figure 11: 10Y and 30Y spreads are currently trading above the fitted term structure by ~2bp more than we would expect based on empirical models of historical deviations
Swap spread deviation* and fair value (expected)** swap spread deviation relative to the term structure of swap spreads for 2Y, 3Y, 5Y, 7Y, 10Y, 20Y, and 30Y swap spreads, 8/16/2024; bp
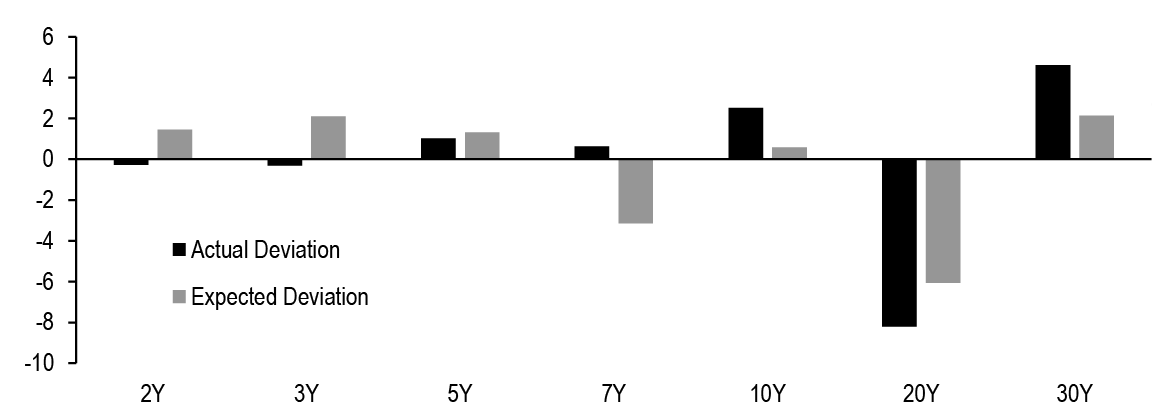
Source: J.P. Morgan.
* Swap spread deviation relative to the term structure of swap spreads is calculated for any given day as the actual maturity matched swap spread minus the fitted value as of that day. The fitted value is calculated from a cross sectional regression of maturity matched swap spreads at benchmark tenors (2s, 3s, 5s, 7s, 10s, 20s, 30s) versus their modified durations, and evaluated at the OTR note’s modified duration.
** Expected deviation is detailed in our note (Term Funding Premium and the Term Structure of SOFR Swap Spreads)
The above discussion also implies a straightforward flattening bias on the broader swap spread curve, and we recommend maintaining such positions. One such trade that currently appears attractive is a 3s/7s maturity matched swap spread curve flattener. The fundamental case for this is covered in the discussion above - an upward bias in zero duration spread as well as term funding premium, and an upward bias in 3Y spreads relative to the term structure, and a downward bias in 7Y spreads relative to the term structure, all support a 3s/7s swap spread curve flattener. But even when viewed much more simply, the 3s/7s maturity matched swap spread curve is at the steep end of its range over the past year, and appears poised to correct (Figure 12). Therefore, we now recommend positioning for a flatter 3s/7s swap spread curve (see Trade recommendations).
Finally, on a relative basis, we recommend positioning for a flatter swap spread curve between the 0.875% June 2026 and 0.875% Sep 2026 issues. These two issues are CTD into Sep and Dec 2-year note contracts, and the steepening of this spread curve is likely the result of futures market technicals (Figure 13). This means that once the roll happens and open interest migrates from the Sep to Dec contracts, this idiosyncratic steepness of the spread curve will likely correct itself. Therefore, we recommend this trade (see Trade recommendations).
Figure 12: The 3s/7s maturity matched swap spread curve is at the steep end of its range over the past year, and appears poised to correct
3s/7s maturity matched OTR swap spread curve, past 1 year; bp
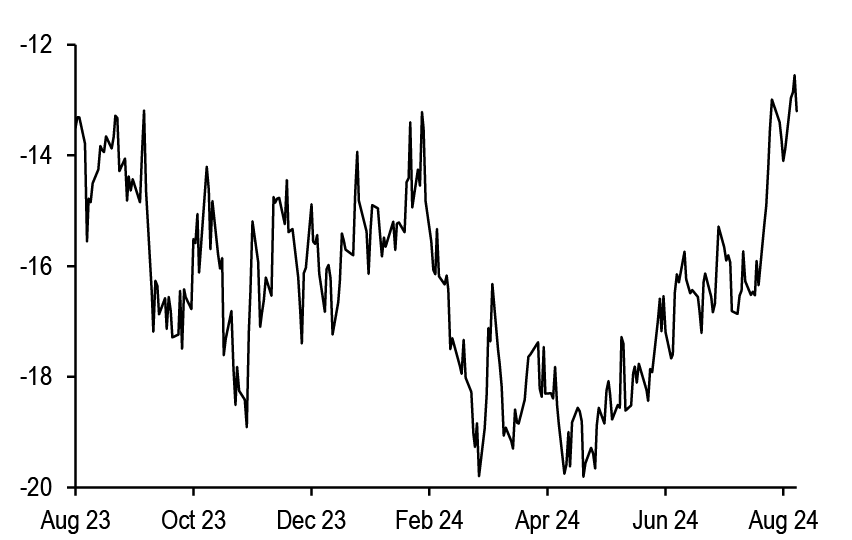
Source: J.P. Morgan.
Figure 13: The spread curve between the front and back CTDs into the 2-year note contract has steepened idiosyncratically, and should correct itself as the Treasury futures roll progresses
Maturity matched swap spread curve between TU Sep CTD (0.875% Jun 2026) and TU Dec CTD (0.875% Sep 2026) candidates, past 1 year; bp
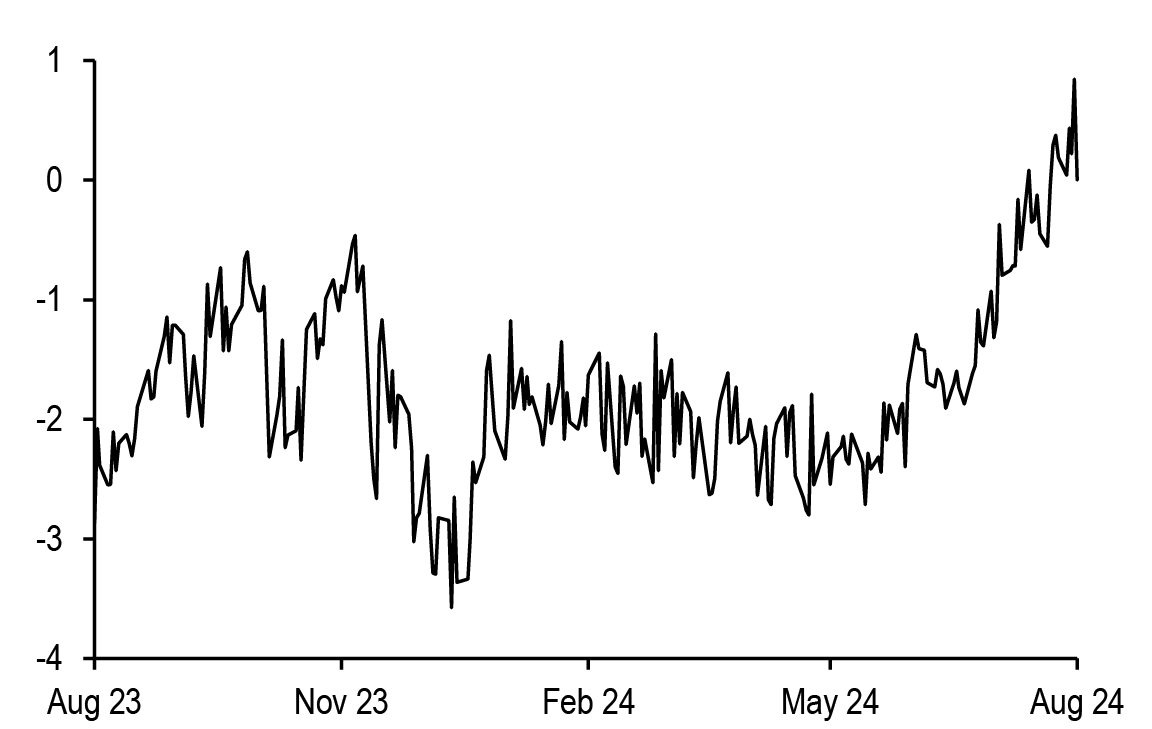
Source: J.P. Morgan.
Ampleness of liquidity and the outlook for the Fed’s balance sheet
As we noted above when discussing repo market developments, money market funds have recently grown their dealer repo exposure at the expense of the O/N RRP facility. Locally, this is a positive - indeed, such reallocations between the O/N RRP and the private repo market will likely help GC repo rates decline from their recent highs relative to the RRP rate. But one consequence of this has also been that O/N RRP balances have now fallen to just over $300bn. This is close to our $250-300bn guesstimate for the likely floor on O/N RRP balances that will be needed for well-functioning repo markets.
This raises two important and related questions. First, is liquidity in the system (i.e., the combination of Reserves as well as RRP) still ample? Second, given the likely outlook for the Fed's major liabilities, how much further can QT continue?
The first question is a variation on a closely related question recently addressed by Fed staff in a research note and blog post on Liberty Street Economics (see Scarce, Abundant, or Ample? A Time-Varying Model of the Reserve Demand Curve, Federal Reserve Bank of New York, May 2022 (Revised April 2024) and When Are Central Bank Reserves Ample?, Liberty Street Economics, 8/13/2024). Specifically, they explore the question of whether Reserves are ample. To answer this, they describe an elegant approach to measuring the ampleness of Reserves that is based on estimating the slope of the Reserve demand curve. In other words, in a world of scarce Reserves, the effective funds rate ought to exhibit greater sensitivity to quantity shocks, while such sensitivity would likely be small in an abundant Reserves regime.
Here, we rephrase their question and adapt their approach in two important ways. First, we note that volumes in the fed funds market are quite small relative to risk free short term markets as a whole - the volume of repo transactions used in estimating SOFR, for instance, are upwards of $2tn, versus a much smaller $100bn in the fed funds market. Since the Fed likely does focus on a broader complex of short rates rather than just the effective funds rate when assessing its monetary policy’s operational effectiveness, we believe it is preferable to measure ampleness by looking at the response of broader rates such as SOFR. Second, we also believe that the question itself must be recast in a manner that also includes RRP balances. This is true for at least two reasons. First, Reserves appear to have become quite sticky at ~$3.3tn. As seen in Figure 14, Reserves have basically remained flat all year in a +/- $100bn range, while RRP balances have fallen by nearly $400bn.The current level of Reserves is a high enough level that would previously have been thought of as quite abundant, but the remarkable stickiness of Reserves around this level suggests that RRP balances are more likely to be the source of marginal liquidity right now.
Second, the recent behavior of GC repo rates is additional evidence in support of the importance of RRP balances as a source of marginal liquidity. After all, the steady upward rise in GC repo rates since late June likely happened because of issues such as counterparty limits facing money market funds. The fact that it happened at a time when Reserves were elevated but not deployed into repo markets suggests that they are less important as a source of marginal liquidity.
Therefore, to summarize, we believe that (i) liquidity is better defined as the sum of Reserves plus RRP balances, and (ii) the ampleness of liquidity is best estimated by examining the response of broader short rates (such as SOFR) to quantity shocks. Borrowing the essence of the idea in the recent note by Fed staff (but devoid of its statistical rigor in the interest intuition and simplicity), we look at the empirical relationship between changes in the SOFR-versus-top-of-the-band differential and percentage changes in total liquidity (i.e., Reserves plus RRP balances). This rolling empirical beta (rolling 1Y history, using weekly changes) is shown in Figure 15 - as can be seen, the rising magnitude of the (negative) beta in recent months does indeed point to tightening liquidity conditions, and suggests that QT is in its endgame. A different bottoms-up analysis by our Short Term market strategists also concludes that we are not too far from a floor on RRP balances (see July MMF holdings update: MMFs and their use of Fed ON RRP, T. Ho, 8/15/2024).
Figure 14: Reserves have remained mostly flat all year in, while RRP balances have fallen by nearly $400bn
Cumulative change in Fed balance sheet Reserves, RRP, and TGA, 1/5/2024 - 8/14/2024; $bn
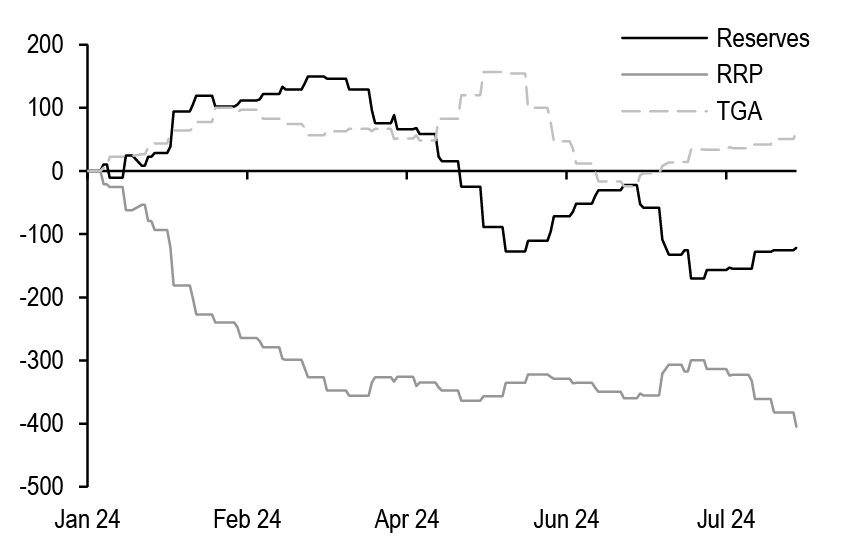
Source: J.P. Morgan., FRED, Federal Reserve H.4.1, Federal Reserve H.8
Figure 15: Liquidity conditions appear to be tightening as QT is now in its endgame
Rolling 1Y beta of weekly changes in the SOFR minus FF target differential (bp) versus weekly percent change in total liquidity (defined as Reserves plus RRP), past 3 years
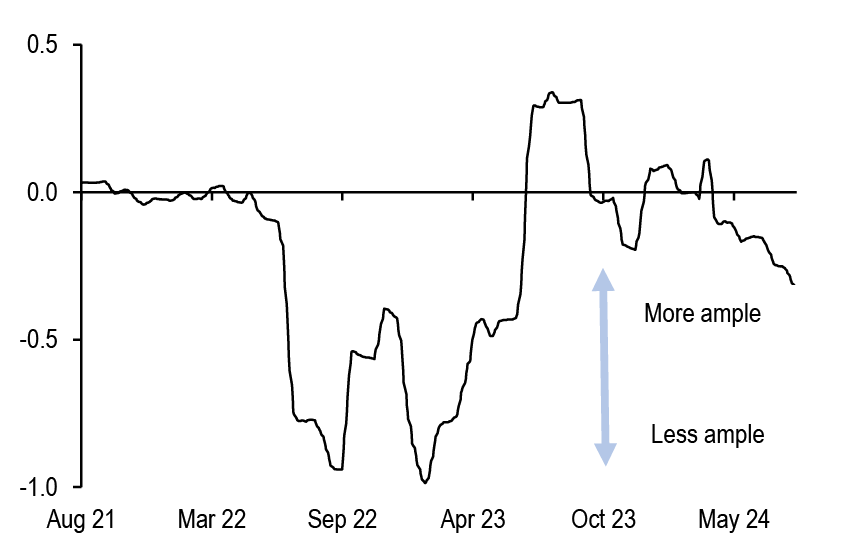
Source: J.P. Morgan.
Fortunately, the fact that (i) QT is now happening at a tapered pace, (ii) there is perhaps a little more room for RRP balances to decline before it becomes critically low based on our Short Term strategists' $200-325bn estimate, and (iii) the anticipated decline in the TGA once we get past 3Q, collectively create some limited headroom for QT to continue. Thus, we see QT as being in its end game, but with perhaps a few more months left. Our projections for the Fed's balance sheet are shown in Figure 16 - we now estimate that the Fed's balance sheet will end the year at ~$7tn, with Reserves essentially flat to current levels, O/N RRP balances dipping in the near term but recovering to slightly below $300bn, and with TGA lower from current levels.
Figure 16: Projections for the Fed’s total balance sheet assets and key liabilities
Current* and projected total Fed balance sheet assets, RRP, TGA, Reserves, and Commercial bank deposits** through 2024, $bn; 8/15/2024
| End-of-the-month | Fed Assets | RRP | TGA | Reserves | Commercial Bank Deposits | ||
| O/N RRP | Foreign RRP | Total RRP | |||||
| Current | 7229 | 327 | 395 | 722 | 789 | 3339 | 17564 |
| Aug-24 | 7206 | 325 | 395 | 720 | 775 | 3332 | 17609 |
| Sep-24 | 7161 | 253 | 395 | 648 | 850 | 3283 | 17620 |
| Oct-24 | 7118 | 281 | 395 | 676 | 775 | 3288 | 17673 |
| Nov-24 | 7074 | 259 | 395 | 654 | 775 | 3266 | 17706 |
| Dec-24 | 7033 | 287 | 395 | 682 | 700 | 3272 | 17760 |
Source: J.P. Morgan., FRED, Federal Reserve H.4.1, Federal Reserve H.8
* Current as of 8/15/2024 Fed H.4. release
** Deposits as of 8/16/2024 Fed H.8. release
Election Premium in Swaptions
About 10 days ago, the benchmark 3M expiry sector of the swaptions market started to expire after the US Presidential election in November. The same thing happened with 6M expiries back in May and we noted back then that a comparison of the impacted expiry (6M back then) versus a "control" expiry (we used 3M back in May) can shed light on the election premium being priced into vol markets (see election enters). Now that the 3M benchmark expiry has crossed the election, we can repeat the exercise in reverse (3M expiries being the election-impacted expiry, and 6M being the control expiry) to infer the election premium that is now being priced into swaptions.
To quickly recap our approach - we start by estimating the recent beta between changes in the impacted expiry (3M) implied vols and the control expiry (6M) implieds. Using this beta and the change in the control expiry implied volatility, we calculate an expected change in 3M expiry implied volatility on each day. By comparing this to the actual change, we can estimate the election premium on a per-day basis as well as the cumulative impact being priced in.
There are two questions one could ask with respect to election premia. First, how many post-election days does the swaptions market deem to be impacted and worthy of some incremental election premium. Second, what is the market's assessment of the total election premium once all the impacted days are included within the benchmark expiry window.
Figure 17 seeks to answer these questions, by calculating the cumulative election premia priced into the impacted expiry for each day after the election was first crossed, using 10Y tails. As can be seen, cumulative election premia in 3M expiries quickly ramped up to their peak of ~6 additional vol days, within a mere 3-4 days after 3M expiries first crossed the election. This suggests that markets view the event risk surrounding the election as relatively brief, impacting only 3-4 days after the election. Moreover, the cumulative election premium is about 6 additional vol days, as also seen in the figure. This is quite different with the election premia that were being priced in back in May - back then, cumulative election premia on 10Y tails reached a peak of nearly 15 additional vol days, and did so 6 business days after first crossing the election. In other words, election premia currently being priced into the swaptions market is less than half as much in total as it was back in May, and is being priced into an impacted time window that is only 3-4 business days after the election (as opposed to 6 business days back in May). Lastly, Figure 18 shows the cumulative premia being priced into different tails. As seen here, the message is fairly similar across tails, and 3M expiry implied volatility across different tails are all pricing in a cumulative 5-6 additional vol days. This is likely a reflection of shifts in the election landscape, and is a reminder that shifting election sentiment can have very real impacts on short expiry implieds going forward, in sectors where the expiry falls after the election.
Figure 17: Markets appear to view the event risk surrounding the election as relatively brief, impacting only 3-4 days after the election
Number of election premium days as priced in to 10-year tails * calculated for 2024 election-impacted business days**, versus # business days after the election

Source: J.P. Morgan.
* Election premia is calculated by using 6Mx10Y swaptions for the May period, and 3Mx10Y swaptions for the August period. See footnote under Figure 18 for details on our method for calculating election premia
** Election-impacted business days are defined as the number of business days where 6M (May) and 3M (August) expiry swaptions expire after the Presidential election
Figure 18: Comparing the last two week’s moves in 3M expiries to 6M expiries allows us to tease out the cumulative election premium priced into swaptions
Beta of 3M expiry swaptions to 6M expiry swaptions as of 8/5/24†, Implied volatility in 3M and 6M expiries on various tails, weekly change in 6M expiry implied vol, expected change* in 3M expiry implied vol, actual change in 3M expiry implied vol, excess change**, and the cumulative election premium*** being priced into 3M expiry swaptions on various tails; as of 8/15/24
| 3M vs 6M expiry beta | Implied vol 08/05 | Implied vol 08/15 | Chg in 6M | Exp. Chg in 3M | Act Chg in 3M | Excess Chg | Election Prem (# of days) | |||
| Tail | 3M | 6M | 3M | 6M | ||||||
| 2Y | 1.42 | 8.44 | 8.19 | 8.13 | 7.76 | -0.42 | -0.60 | -0.31 | 0.29 | 4.8 |
| 3Y | 1.45 | 8.34 | 8.04 | 8.10 | 7.67 | -0.37 | -0.54 | -0.24 | 0.30 | 4.9 |
| 5Y | 1.42 | 7.79 | 7.52 | 7.70 | 7.26 | -0.26 | -0.37 | -0.09 | 0.28 | 4.9 |
| 7Y | 1.40 | 7.41 | 7.20 | 7.38 | 6.99 | -0.21 | -0.29 | -0.02 | 0.27 | 4.9 |
| 10Y | 1.38 | 6.88 | 6.76 | 6.95 | 6.62 | -0.14 | -0.19 | 0.06 | 0.26 | 5.0 |
| 20Y | 1.34 | 6.43 | 6.39 | 6.56 | 6.28 | -0.11 | -0.15 | 0.12 | 0.27 | 5.5 |
| 30Y | 1.32 | 6.10 | 6.12 | 6.27 | 6.03 | -0.08 | -0.11 | 0.17 | 0.28 | 6.0 |
Source: J.P. Morgan.
†Beta of 3M expiry swaptions to 6M expiry swaptions is calculated as the 3-month beta of weekly changes as of 8/5/24, before 3M expiry options included the election event risk
* Expected change in 3M expiry implied vol is calculated as the change in 6M expiry implied vol from 8/5 to 8/15, multiplied by the 3M vs 6M expiry beta
** Excess change in 3M implied vol is calculated as Actual change in 3M implied vol minus Expected change in 3M implied vol.
*** The cumulative election premium is calculated as 3M actual implied vol squared, times 63, divided by 3M expected implied vol squared, minus 63.
Treasury Futures September - December Rollover Outlook Summary
As we approach the period where the majority of Treasury futures positions will need to be rolled forward from September to December expiries, we discuss our outlook for the various Treasury futures calendar spreads. A detailed discussion may be found in our U.S. Bond Futures Rollover Outlook September 2024 / December 2024, and we include a short summary here.
As we noted earlier, policy uncertainty is back in the picture, and it can also have an impact on calendar spreads. First, near term Fed expectations get priced into forward repo rates between the Sep and Dec contract delivery horizons. Lower (higher) forward repo rates imply higher (lower) carry on the back contract CTD, and therefore lower (higher) forward prices, which in turns widens (narrows) the calendar spread. Thus, volatile Fed expectations can beget volatile calendar spreads. Second, shifts in Fed expectations also have the potential to shift optimal delivery in December to last delivery day, which could bring about additional cheapening in the back contract. In all sectors but the 2-year note, back contract CTDs have coupons in the mid-4% range. Given our current Fed outlook (we look for two 50bp cuts in Sep and Nov, and a 25bp cut in Dec), this implies a forward repo rate outlook of ~4.3-4.4% in the month of December (Figure 19). This means that back contract CTDs will likely experience carry that is cuspy - i.e., either modestly positive or modestly negative carry in the month of December. But if Fed easing expectations turn more aggressive, December carry could turn positive and shift optimal delivery to late in the month. All else equal, this implies additional cheapening in the back contract (to account for one more month of then-positive carry) and additional widening pressure on calendar spreads.
Our best guess is that risks to Fed expectations continue to be two-sided from here, and will likely remain stable over the horizon of this roll especially with the passing of recent economic data. Recent Fed-speak suggests that the Fed will likely not rush to ease aggressively in response to one data point after having exercised considerable patience thus far. Continued retracement towards higher yields on the back of strong data implies some upside pressure on forward financing rates. But there is an offset to this, stemming from a likely retracement in GC repo rates relative to RRP rates / SOFR, which seems to be already underway (see Joie de Louvre). Thus, all told, we expect financing rates to be rangebound over the roll horizon, but the risk to calendar spreads from this factor is now higher than it has been in recent quarters.
Policy uncertainty also has an impact on market liquidity and volatility. As might be expected, liquidity provision is quite dependent on policy clarity and therefore it is unsurprising that market depth was quick to tumble last week (and recovered since). But, this backdrop of policy uncertainty, elevated volatility and weaker broad-market liquidity is likely to exacerbate the effect of any technical imbalances. Commercial accounts are either moderately or significantly net long in all sectors except for the classic bond contract, and since these investors prefer to avoid delivery and roll their positions early, this preponderance of commercial longs can lead to selling pressure on calendar spreads going into first notice day. Given that net commercial futures open interest is significantly elevated in the five-year note (FV) and ultra-long bond (WN) contracts, as well as somewhat elevated in the two-year note (TU) and ten-year note (TY) sectors, we expect technical narrowing pressures to be significant in these sectors. In the ultra ten-year note (UXY) contract, net commercial longs are closer to recent averages and we expect modest narrowing pressure in this sector. In the classic bond contract, commercial accounts are net short as well as well below historical average levels - technicals (all else equal) could exert widening pressure in this sector (see Figure 20).
Figure 19: Optimal delivery in the December contract can shift to last delivery day or become cuspy if more aggressive easing gets priced in
Term repo and forward repo for different policy paths*, and optimal delivery date for the December contract CTD under each scenario
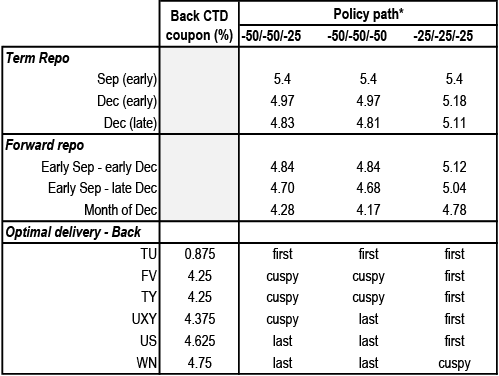
Source: J.P. Morgan.
* Projections assume that the IOER/GC basis is zero.
** Policy path assumes the eases shown take effect on September, November and December meeting dates and repo rates are calculated as a weighted average of policy rates, weighted by the number of days between each meeting
Figure 20: Commercial accounts are net long in all sectors but the US and UXY contracts
3-year statistics* on net commercial longs for the various treasury futures contracts; ‘000s of contracts, past 3Y history

Source: J.P. Morgan., CFTC
* Current as of 8/9/2024
Delivery optionality and basis convergence is likely to be a factor in the ultra-long bond contract and (to a much lesser extent) the classic bond contract. In the ultra-long bond contract, the front basis is underpricing the wildcard, and could widen as we head into the roll. Moreover, in the back month, the CTD’s much higher coupon and conversion factor make for a much smaller wildcard option value. Thus, a widening of the front WN basis will likely help pressure the WN calendar narrower. In the classic bond contract, the back net basis is underpricing delivery optionality to the tune of ~2.5/32nds. Although back bases do not usually exhibit basis convergence during the roll to the same degree that front bases do, we think in this case back basis convergence could exert some widening pressure on the calendar spread. In all the other contracts, we don’t expect basis convergence to be a driving factor of calendar spreads.
As of this writing all contracts have different CTDs into front and back contracts, which creates the potential for the curve between CTDs to impact the calendar spread in each sector. As we discussed earlier in the piece, in the TU contract, the maturity matched swap spread curve between the front and back CTDs appears too steep relative to recent history. A correction in this could richen the front CTD relative to the back, which would exert widening pressure on the calendar spread. In the FV contract, the yield curve between the front and back contract CTDs is near the steep end of its range in recent months, mostly as a result of fairly recent moves. A flattening would exert narrowing pressure on the calendar spread . Similarly, in the TY sector, the sharp recent steepening of the spread curve suggests that the back CTD has significantly richened relative to the front - a correction would (all else equal) pressure the calendar spread wider. Additionally, given the different CTDs into the front and back contracts in all sectors, we recommend BPV-weighted hedge ratios when rolling positions forward to mitigate the directional exposure of calendar spreads.
In summary (Figure 21), we are bearish on the weighted ultra-long bond contract calendar spread as the wildcard option is underpriced in the front contract and commercial accounts are net long; we are bullish on the classic bond contract calendar spread on the back of back-basis convergence towards fair value and investor positioning; we are mildly bearish on the weighted ultra ten-year note contract calendar spread on the back of investor positioning; we are bearish on the weighted five-year note calendar spread as commercial accounts are significantly net long and the CTD curve between the front and back contract appears too steep; and we are neutral on the ten-year note and two-year note weighted calendar spreads due to offsetting influences from investor positioning and CTD relative value considerations.
Figure 21: We are bearish on the weighted calendar spreads in the WN and FV sectors, mildly bearish in the UXY sector, bullish on the weighted calendar spreads in the US sector, and neutral on the weighted calendar spreads in the TY and TU sectors
Details for various Treasury future contracts including front price, calendar spread (/32nds), hedge ratios (as of 8/13), CTD characteristics (as of 8/13), view and drivers on each of the calendar spreads.

Source: J.P. Morgan.* Hedge Ratio: recommended number of Back contracts per 1000 Front contracts. Contract prices and calendar spread levels are based on live levels on 8/16/2024. Calendar spread levels are quoted at theoretical mids and front contract prices are quoted at the bid side.
Trading Recommendations
- Initiate 10Y swap spread narrowers
Term funding premium has decreased and is near its recent lows, and a near term correction would pressure 10-year spreads narrower by ~2bp. We also expect term funding premium to drift higher over the medium term on the back of continuing QT and elevated duration supply in the Treasury market. Should term funding premium reach our YE24 projections, that would imply an additional 4-5bp of narrowing pressure on 10-year spreads. Lastly, fair value considerations suggest that 10-year spreads are currently trading above the fitted term structure by ~2bp more than we would expect based on empirical models of historical deviations.
-Receive fixed in 4.375% May 2034 maturity matched SOFR swap spreads. Sell $100mn notional of the 4.375% May 2034 (yield: 3.892%, PVBP: $822.6/bp per mn notional), and receive fixed in $100mn notional of a maturity matched SOFR swap (coupon: 3.444%, PVBP: $822.3/bp per mn notional) at a swap spread of -44.8bp. - Initiate 3s/7s swap spread curve flatteners
The 3s/7s maturity matched swap spread curve is at the steep end of its range over the past year, and appears poised to correct. Also, an upward bias in zero duration spreads as well as term funding premium, an upward bias in 3Y spreads relative to the term structure, and a downward bias in 7Y spreads relative to the term structure, all support a 3s/7s swap spread curve flattener.
-Pay fixed in 3.75% August 2027 maturity matched SOFR swap spreads. Buy $100mn notional of the 3.75% August 2027 (yield: 3.868%, PVBP: $279.2/bp per mn notional), and pay fixed in $95.9mn notional of a maturity matched SOFR swap (coupon: 3.652%, PVBP: $291.0/bp per mn notional) at a swap spread of -21.6bp.
-Receive fixed in 4.875% October 2030 maturity matched SOFR swap spreads. Sell $49.3mn notional of the 4.875% October 2030 (yield: 3.799%, PVBP: $566.5/bp per mn notional), and receive fixed in $50.5mn notional of a maturity matched SOFR swap (coupon: 3.447%, PVBP: $553.2/bp per mn notional) at a swap spread of -35.2bp. - Initiate 0.875% June 2026 / 0.875% September 2026 swap spread curve flatteners
The swap spread curve between the 0.875% June 2026 and 0.875% Sep 2026 issues has steepened idiosyncratically, as the result of futures market technicals. This means that once the roll happens and open interest migrates from the Sep to Dec contracts, this steepening will likely correct itself.
-Pay fixed in 0.875% June 2026 maturity matched SOFR swap spreads. Buy $100mn notional of the 0.875% June 2026 (yield: 4.09%, PVBP: $171.2/bp per mn notional), and pay fixed in $92.9mn notional of a maturity matched SOFR swap (coupon: 3.916%, PVBP: $184.3/bp per mn notional) at a swap spread of -17.4bp.
-Receive fixed in 0.875% September 2026 maturity matched SOFR swap spreads. Sell $88.7mn notional of the 0.875% September 2026 (yield: 3.998%, PVBP: $192.9/bp per mn notional), and receive fixed in $82.1mn notional of a maturity matched SOFR swap (coupon: 3.831%, PVBP: $208.4/bp per mn notional) at a swap spread of -16.7bp. - Initiate calendar spread wideners in US Futures
We are bullish on the US calendar spread on the back of basis convergence and the net open interest in commercial accounts being significantly short.
-Buy 1000 US calendar spreads at -5.25/32nds. This trade uses a 1000:1000 hedge ratio between front and back contracts, as per the recommendation in Figure 21. - Initiate calendar spread narrowers in FV Futures
We are bearish on the weighted FV calendar spread on the back of elevated net commercial longs and relative value in the yield curve between the front and back CTDs.
-Sell 933 FV calendar spreads at -17.5/32nds and sell an additional 67 FVU4 contracts at 108-23.5. This trade uses a 1000:933 hedge ratio between front and back contracts, as per the recommendation in Figure 21. - Maintain longs in 6Mx5Y swaption implied volatility on an outright basis, delta hedged daily
P/L on this trade is currently -0.7abp. For original trade write up, see Fixed Income Markets Weekly 2024-08-02. - Maintain conditional exposure to a flatter 1s/7s swap yield curve in a selloff using 6M expiry payer swaptions
P/L on this trade is currently -4bp. For original trade write up, see Fixed Income Markets Weekly 2024-07-12. - Continue to overweight 6Mx5Y swaption straddles versus 150% of the vega risk in 6Mx30Y straddles
P/L on this trade is currently -1.8abp. For original trade write up, see Fixed Income Markets Weekly 2024-07-12. - Maintain TU/TY invoice spread curve flatteners (1:0.35 weighted)
P/L on this trade is currently -6.6bp. For original trade write up, see Fixed Income Markets Weekly 2024-06-07. - Continue to Pay-fixed in 4.625% Feb ‘26 maturity matched swap spreads
P/L on this trade is currently -1.2bp. For original trade write up, see Fixed Income Markets Weekly 2024-05-31. - Maintain 1:0.75 risk weighted 7s/10s maturity matched swap spread curve steepeners
P/L on this trade is currently -2.8bp. For original trade write up, see Fixed Income Markets Weekly 2024-05-31. - Continue to Pay-fixed in 4.375% Aug ‘28 maturity matched swap spreads
P/L on this trade is currently -1.2bp. For original trade write up, see Fixed Income Markets Weekly 2024-05-31. - Continue to overweight 1Yx10Y straddles versus a gamma-neutral amount of 1Yx15Y straddles
P/L on this trade is currently -2.2abp. For original trade write up, see Fixed Income Markets Weekly 2024-05-03. - Stay long A+100 1Yx5Y payer swaptions versus selling A-100 1Yx5Y receiver swaptions, delta-hedged daily, to position for a correction in skew
P/L on this trade is currently -10.6abp. For original trade write up, see Fixed Income Markets Weekly 2024-04-19.
- Continue to overweight 6Mx5Y and 6Mx30Y swaption volatility (vega weights of 0.32 and 0.76, respectively) versus selling 6Mx10Y swaption volatility
P/L on this trade is currently 0abp. For original trade write up, see Fixed Income Markets Weekly 2024-04-05.
Closed trades over the past 12 months
P/L reported in bp of yield for swap spread, yield curve and misc. trades, and in annualized bp of volatility for option trades, unless otherwise specified
Note: trades reflect Thursday COB levels, and unwinds reflect Friday COB levels
| Trade | Entry | Exit | P/L |
| Spreads and basis | |||
| 2Y spread widener | 6/2/2023 | 8/18/2023 | 1.6 |
| 10Y spread narrower | 7/28/2023 | 8/18/2023 | 1.1 |
| 10Y spread narrower | 8/25/2023 | 9/8/2023 | 1.6 |
| 3Y spread widener | 8/18/2023 | 9/22/2023 | (0.2) |
| FV invoice spread wideners by buying FVZ3 and paying fixed in a forward starting swap |
9/8/2023 | 9/29/2023 | (2.2) |
| Initiate 10s/30s swap spread curve flatteners | 9/15/2023 | 10/13/2023 | 0.3 |
| 2Y spread narrowers | 10/13/2023 | 10/27/2023 | 1.2 |
| 5s/10s swap spread curve flatteners, paired with a 10% risk-weighted 5s/10s Treasury curve flattener | 10/13/2023 | 12/8/2023 | 1.2 |
| FV/UXY invoice spread curve flatteners , paired with a 10% risk-weighted FV/UXY Treasury futures curve flattener | 10/13/2023 | 12/8/2023 | 1.7 |
| Initiate swap spread narrowers in the 2Y sector | 11/3/2023 | 12/8/2023 | 3.9 |
| Initiate swap spread wideners in the 5Y sector | 11/3/2023 | 12/8/2023 | (3.2) |
| Initiate 20s/30s swap spread curve flatteners hedged with a 35% risk-weighted 20s/30s Treasury curve flattener | 9/29/2023 | 1/5/2024 | 0.2 |
| Initiate 3s/5s swap spread curve flatteners | 12/8/2023 | 1/5/2024 | 0.9 |
| Initiate swap spread wideners in the 5Y sector | 1/5/2024 | 1/19/2024 | 4.2 |
| Pay in 1.375% Nov ‘31 maturity matched swap spreads paired with 5% risk in 5s/10s OTR Treasury curve steepeners | 1/10/2024 | 1/26/2024 | 2.4 |
| Initiate 5s/30s swap spread curve flatteners | 12/15/2023 | 2/2/2024 | 3.8 |
| Initiate swap spread narrowers in the 30Y sector | 1/5/2024 | 2/2/2024 | 0.2 |
| Maintain a widening bias on swap spreads in the belly but switch to the 2.625% Feb 2029 issue | 1/19/2024 | 2/23/2024 | 2.4 |
| Maintain a widening bias on swap spreads in the belly using the 2.625% Feb 2029 issue, but hedge the narrowing risk from higher implied volatility with a long in 2Yx2Y swaption straddles | 1/19/2024 | 2/23/2024 | 2.7 |
| Initiate 2s/5s (100:60 weighted) maturity matched swap spread curve steepeners | 1/26/2024 | 2/23/2024 | (3.3) |
| Pay-fixed in 2.125% May ‘26 maturity matched swap spreads | 3/15/2024 | 3/22/2024 | 3.6 |
| Pay-fixed in 1.875% Jul ‘26 maturity matched swap spreads | 3/22/2024 | 4/5/2024 | 3.4 |
| Initiate 20s/30s 1.33:1 wtd maturity matched spread curve steepeners hedged with a 30% risk weighted 20s/30s steepener, but use an equi-notional blend of the Nov 53s and Aug 53s to create a synthetic approximate par bond in the 30Y leg | 2/23/2024 | 4/12/2024 | (2.5) |
| Initiate 30Y swap spread wideners | 3/15/2024 | 4/12/2024 | (0.1) |
| Pay in 4% Jan ‘27 maturity matched swap spreads | 4/5/2024 | 4/26/2024 | 2.2 |
| Initiate 10Y swap spread wideners using the Nov ‘33 issue | 3/8/2024 | 5/17/2024 | 0.9 |
| Initiate exposure to a steeper 7s/10s 1:0.75 weighted swap spread curve, and we recommend implementing the 7Y narrower leg with TYM4 invoice spreads | 5/10/2024 | 5/28/2024 | 0.3 |
| Initiate 1:0.9 risk weighted 20s/30s maturity matched swap spread curve steepeners | 5/31/2024 | 6/14/2024 | 3.9 |
| Initiate 5s/10s off-the-run swap spread curve steepeners (100:60 weighted) | 3/8/2024 | 7/12/2024 | (4.7) |
| Initiate 7s/10s swap spread curve steepeners paired with 25% risk in a 7s/10s UST curve steepener | 3/22/2024 | 7/12/2024 | (0.2) |
| Pay in Feb 2037 maturity matched swap spreads versus receiving in USU4 invoice spreads | 6/14/2024 | 7/12/2024 | 0.8 |
| Buy Feb 37s versus selling USU4 Futures | 6/14/2024 | 7/12/2024 | 2.7 |
| Pay-fixed in 1.875 Feb 2027 maturity matched swap spreads | 4/26/2024 | 7/26/2024 | (5.9) |
| Initiate 5s/30s spread curve flatteners | 5/3/2024 | 7/26/2024 | 5.1 |
| Pay-fixed in 4% Feb 2034 maturity matched swap spreads | 5/17/2024 | 7/26/2024 | (6.7) |
| Initiate 10s/30s swap spread curve flatteners | 7/26/2024 | 8/2/2024 | (0.8) |
| Duration and curve | Entry | Exit | P/L |
| 2Yx1Y / 3Mx15Y flattener, plus 58% long in 2Yx1Y and 8% short in 6Mx6M | 07/14/23 | 08/18/23 | (26.3) |
| Initiate 6M fwd 1s/20s flatteners paired with 20% risk weighted longs in 3Mx6Mand 60% risk-weighted longs in Reds | 07/28/23 | 08/18/23 | (35.7) |
| Initiate conditional exposure to a flatter 1s/10s swap yield curve in a selloff using 3M expiry receiver swaptions | 07/28/23 | 08/18/23 | (6.2) |
| Initiate 3M forward 2s/7s swap curve flatteners hedged with a 35% risk weighted long in the 1Yx1Y sector | 08/04/23 | 08/18/23 | (13.9) |
| Initiate 3M forward 3s/5s flattener hedged with a 15% risk weighted long in the 5th 3M SOFR futures contract | 08/04/23 | 08/18/23 | (7.7) |
| Initiate 2Y forward 1s/10s swap curve steepeners paired with equal risk in a 3M forward 3s/15s swap curve flattener | 08/18/23 | 08/25/23 | 4.7 |
| Sell the belly of the U4/H5/U5 3M SOFR futures butterfly (-0.43:1:-0.64 risk weighted) | 09/08/23 | 09/22/23 | 2.3 |
| Initiate 3M forward 2s/10s swap curve steepeners paired with 110% of the risk in Reds/Greens flatteners | 09/15/23 | 09/22/23 | 4.9 |
| Initiate 3Y forward 2s/10s swap curve steepeners, paired with 1Y forward 1s/5s swap curve flatteners (33% risk weighted) | 09/22/23 | 09/29/23 | 5.0 |
| Initiate 2Y forward 2s/30s swap curve steepeners paired with equal risk in a 3M forward 2s/30s swap curve flattener | 08/25/23 | 10/20/23 | (32.1) |
| Initiate 3Y forward 3s/30s swap curve steepeners paired with 63% risk in a 3M forward 5s/30s swap curve flattener | 09/08/23 | 10/20/23 | (18.3) |
| Initiate M4/Z4 SOFR futures curve steepeners paired with 55% of the risk in H4/Z5 3M SOFR futures curve flatteners | 09/22/23 | 10/20/23 | (9.9) |
| Initiate conditional exposure to a flatter 2s/10s swap yield curve in a rally using 6M expiry receiver swaptions | 09/29/23 | 11/03/23 | (9.2) |
| Initiate 3M fwd 5s/10s swap curve flatteners paired with 2Y fwd 5s/10s swap curve steepeners (50:100 risk weighted) | 10/27/23 | 11/03/23 | 4.6 |
| Initiate conditional exposure to a flatter 5s/10s swap yield curve in a rally using 3M expiry receiver swaptions | 10/27/23 | 11/03/23 | 0.8 |
| Initiate 2Y fwd 2s/5s curve flatteners paired with 25% risk in a 1st/5th SOFR futures curve flattener | 11/03/23 | 11/22/23 | 5.8 |
| Initiate 6M fwd 5s/15s curve flatteners paired with equal risk in 3Y fwd 2s/15s steepeners | 11/03/23 | 11/22/23 | 4.6 |
| Buy the belly of a 40:65 weighted Z4/Z5/Z6 3M SOFR futures butterfly | 11/03/23 | 11/22/23 | 5.6 |
| Initiate 9M fwd 1s/10s flatteners paired with a 50% risk weighted long in March 2025 3M SOFR futures | 11/09/23 | 11/22/23 | 15.8 |
| Initiate 3Mx1Y / Greens weighted flattener (1:0.8 weighted) paired with 80% risk in a 3M forward 2s/10s swap curve steepener | 01/05/24 | 01/26/24 | 2.9 |
| Initiate U5/M6 SOFR futures curve flatteners paired with 110% of the risk in Z5/U6 3M SOFR futures curve steepeners | 12/15/23 | 02/02/24 | 1.6 |
| Buy the belly of a 35:65 weighted H5/H6/Z6 3M SOFR futures butterfly | 12/15/23 | 02/02/24 | 1.9 |
| Initiate 1Yx2Y / 3Mx30Y swap yield curve steepeners paired with 65% risk in a Reds / 10Yx5Y swap yield curve flattener | 01/19/24 | 02/02/24 | 1.1 |
| Receive fixed in the belly of a 6M forward 2s/7s/30s swap butterfly (40:69 weighted) | 01/19/24 | 02/02/24 | 0.1 |
| Initiate conditional exposure to a composite flattener in a selloff by buying 3Mx2Y payer swaptions (100% risk) versus selling 3Mx5Y and 3Mx30Y payer swaptions (24% and 100% risk respectively) | 02/02/24 | 02/23/24 | 14.3 |
| Buy H5 and Z5 3M SOFR futures contracts (30:100 weighted) versus selling U4 3M SOFR futures contracts (100% risk weight) and pay-fixed in 6M forward 10Y swaps (40% risk weight) | 02/09/24 | 02/23/24 | 5.8 |
| Initiate exposure to rising term premium by selling the belly of a 35/65 weighted 3M forward 5s/10s/15s butterfly | 12/08/23 | 03/08/24 | (1.5) |
| Initiate SFRM5 / Blues flatteners paired with a 110% risk weighted 3M forward 2s/10s steepener | 03/01/24 | 03/22/24 | 3.3 |
| Initiate 3M forward 3s/20s swap curve steepeners, paired with 85% of the risk in a SFRM5 / 3Mx10Y curve flattener | 03/08/24 | 04/05/24 | 3.2 |
| Initiate 2Y forward 2s/5s swap curve steepeners paired with 40% risk in 3M forward 2s/5s flatteners | 01/26/24 | 04/12/24 | (11.4) |
| Initiate conditional exposure to a flatter 2s/5s swap yield curve in a selloff using 3M expiry payer swaptions | 03/22/24 | 04/12/24 | 5.2 |
| Initiate conditional exposure to a flatter 18M/5Y swap yield curve in a selloff using 6M expiry payer swaptions | 04/05/24 | 04/12/24 | 3.1 |
| Initiate conditional exposure to a flatter 1s/5s swap yield curve in a selloff using 3M expiry payer swaptions | 02/23/24 | 04/26/24 | (9.4) |
| Initiate 1Y forward 2s/5s swap curve flatteners, paired with weighted longs in H5 and H6 3M SOFR futures (20% and 10% respectively) | 03/22/24 | 04/26/24 | (9.5) |
| Initiate SFRM5 / 3Mx5Y flattener, hedged with a 20% risk weighted long in Reds | 04/05/24 | 04/26/24 | (5.0) |
| Initiate 5th/9th SOFR futures curve flatteners hedged with a risk weighted amount 2Y forward 2s/5s swap curve steepeners | 04/12/24 | 05/03/24 | 3.0 |
| Receive in the belly of a 0.625/1.0/0.375 weighted 3M forward 2s/7s/20s swap butterfly, with an additional 15% risk weighted long in June 2024 3M SOFR futures | 02/23/24 | 05/17/24 | 2.7 |
| Initiate 3M forward 2s/3s swap curve flatteners hedged with a 14% risk weighted long in the M4 3M SOFR futures | 02/23/24 | 05/17/24 | 0.4 |
| Initiate 3M forward 5s/15s swap curve flatteners paired with 70% risk in a 2Y forward 2s/20s swap curve steepener | 03/22/24 | 05/17/24 | 2.8 |
| Buy the belly of a 2s/5s/15s weighted swap butterfly (50:50 weighted) | 04/12/24 | 05/17/24 | 2.4 |
| Initiate 3M forward 1s/3s swap curve flatteners, hedged with a 65% risk weighted long in the 3Mx3M sector and a 25% risk weighted short in the 15Mx3M sector | 05/03/24 | 05/17/24 | 2.1 |
| Buy the belly of a U5/M6/H7 SOFR Futures butterfly (-0.37:1:-0.63 risk weighted) | 03/01/24 | 05/31/24 | (0.7) |
| Initiate a Greens/Blues steepener paired with 55% of the risk in a SFRM5 / 3Mx5Y swap curve flattener | 03/15/24 | 05/31/24 | 2.2 |
| Buy the belly of a Z5/U6/H7 3M SOFR futures butterfly (-0.33:1.0:-0.67 risk weighted) | 04/19/24 | 05/31/24 | 1.8 |
| Initiate 12Mx3M / 3Mx10Y flatteners, paired with 33% risk in a 3Mx2Y receive fixed swap | 05/17/24 | 06/06/24 | 5.7 |
| Initiate 3M fwd 3s/15s flatteners paired with 85% risk in 2Y fwd 3s/30s steepeners | 05/17/24 | 06/06/24 | 4.5 |
| Initiate 3Mx1Y / 2Yx1Y forward swap curve flatteners as a bullish proxy | 05/31/24 | 06/06/24 | 11.5 |
| Initiate 3Mx1Y / 2Yx1Y swap curve flatteners paired with 45% risk-weighted pay-fixed positions in 3Mx5Y swaps | 05/31/24 | 06/06/24 | 0.0 |
| Initiate conditional exposure to a flatter 1s/2s swap yield curve in a rally using 1Y expiry receiver swaptions | 04/05/24 | 06/14/24 | 4.0 |
| Initiate Z5/U6 SOFR futures flatteners paired with H6/Z6 SOFR futures steepeners (0.85:1 risk weighted) | 03/01/24 | 07/12/24 | 1.8 |
| Initiate conditional exposure to a steeper 10s/20s swap yield curve in a selloff using 9M expiry payer swaptions | 03/15/24 | 07/12/24 | 4.0 |
| Initiate 3M forward 10s/15s swap curve steepeners paired with 25% risk in 3M forward 3s/7s flatteners | 04/26/24 | 07/12/24 | 3.5 |
| Initiate 3M forward 10s/30s steepeners (1:1.5 risk weighted) paired with M5/Z5 3M SOFR futures flatteners | 06/07/24 | 07/12/24 | 2.9 |
| Initiate 15Mx3M / 1YX1Y forward swap curve flatteners, paired with 20% of the risk in a long in 18Mx3M and a 24% risk weighted short in 3Mx5Y forward swaps | 05/03/24 | 08/02/24 | (1.3) |
| Receive in 3Mx3Y and 3Mx5Y swaps versus paying in 3Yx1Y and 12Mx3M swaps | 06/14/24 | 08/02/24 | (8.8) |
| Initiate a synthetic 6M forward 2s/10s swap curve steepener, constructed by replacing the 2Y leg with a 6Mx3M / 18Mx3M flattener | 07/12/24 | 08/02/24 | (28.9) |
| Initiate a synthetic 3M forward 5s/30s swap curve steepener, constructed by replacing the 5Y leg with a 3Mx3M / 3Mx2Y flattener | 07/26/24 | 08/02/24 | (18.1) |
| Initiate conditional exposure to a flatter 1s/2s swap yield curve in a rally using 6M expiry receiver swaptions | 07/26/24 | 08/02/24 | (8.8) |
| Options | Entry | Exit | P/L |
| Overweight volatility in 5Y tails versus 15Y tails using 9M expiry swaptions | 07/28/23 | 08/18/23 | (7.9) |
| Sell volatility on 5-year tails paired with a pay-fixed swap overlay | 08/18/23 | 08/25/23 | 6.2 |
| Sell 6Mx30Y swaption straddles versus buying 6Mx10Y and selling 6Mx2Y straddles on a suitably weighted and delta hedged basis | 08/04/23 | 09/08/23 | 0.0 |
| Sell 9M expiry single-look YCSO straddles on the 5s/30s curve, versus buying 35% vega-weighted amount of 9Mx2Y swaption straddles | 06/02/23 | 09/08/23 | 2.3 |
| Sell volatility on 30-year tails paired with a pay-fixed swap overlay | 08/25/23 | 09/15/23 | 8.6 |
| Sell 2Yx5Y swaption straddles versus buying 10Yx10Y swaption straddles | 08/25/23 | 09/15/23 | 5.3 |
| Buy 10Yx10Y straddles | 03/17/23 | 09/22/23 | 1.9 |
| Sell 2Yx2Y swaption straddles versus buying a vega-neutral amount of 1Yx10Y swaption straddles | 08/25/23 | 09/29/23 | 3.4 |
| Buy 1Yx10Y straddles versus selling 140% of the vega risk in 1Yx5Y straddles and buying 50% of the risk in 1Yx2Y swaption straddles | 08/25/23 | 10/13/23 | 3.2 |
| Sell 2Yx30Y swaption straddles versus buying a vega-neutral amount of 10Yx10Y swaption straddles | 09/08/23 | 10/13/23 | (4.5) |
| Sell 2Yx2Y swaption straddles versus buying a vega-neutral amount of 7Yx10Y swaption straddles | 09/15/23 | 10/13/23 | 3.0 |
| Sell 6Mx30Y swaption straddles with a pay fixed swap overlay | 09/22/23 | 10/13/23 | (11.6) |
| Sell 1Yx30Y swaptions straddles versus buying a vega-neutral amount of 5Yx30Y swaption straddles, paired with a 1Yx30Y pay-fix swap | 09/22/23 | 10/13/23 | (1.5) |
| Overweight 6Mx7Y swaption volatility versus a vega-neutral amount of 1Yx10Y swaption volatility | 10/13/23 | 11/03/23 | 3.5 |
| Buy 1Yx10Y swaption straddles paired with a receive-fixed swap overlay to hedge against a decrease in implieds due to lower yields | 10/27/23 | 11/03/23 | (1.1) |
| Initiate short gamma exposure in the 6Mx30Y sector | 11/03/23 | 12/08/23 | 7.9 |
| Sell 6Mx30Y swaption straddles versus buying a vega-neutral amount of 1Yx30Y swaption straddles | 11/03/23 | 12/08/23 | 0.4 |
| Initiate long gamma exposure in the 1Yx10Y sector | 12/08/23 | 02/23/24 | (2.1) |
| Initiate long exposure to 2Yx2Y volatility with a suitably weighted short in July Fed funds futures to hedge the downside risk from a fall in Fed-easing expectations | 01/05/24 | 02/23/24 | 2.6 |
| Overweight 2Yx2Y swaption straddles versus a vega-neutral amount of 5Yx5Y swaption straddles | 01/19/24 | 02/23/24 | 3.2 |
| Overweight 6Mx10Y swaption straddles versus selling 110% of the vega risk in 1Yx10Y swaption straddles | 01/26/24 | 02/23/24 | 1.3 |
| Buy 6Mx10Y straddles | 03/01/24 | 03/08/24 | (6.6) |
| Initiate longs in 6Mx10Y swaption implied volatility, delta hedged daily | 03/15/24 | 03/22/24 | (5.1) |
| Overweight 6Mx2Y swaption straddles versus a theta-neutral amount of 6Mx5Y swaption straddles | 01/19/24 | 04/12/24 | (8.8) |
| Sell 2Yx30Y swaption volatility versus buying 50% of the vega risk in 2Yx2Y swaption volatility , and pay fixed in 2Yx 10Y swaps to neutralize the bullish bias in this trade | 02/23/24 | 04/12/24 | 1.5 |
| Buy 6Mx10Y volatility versus 6M forward 6Mx10Y volatility, synthetically constructed via suitably weighted 1Yx10Y and 6Mx10Y swaptions | 04/05/24 | 04/12/24 | 3.2 |
| Buy 2Yx5Y swaption straddles on a delta hedged basis | 04/12/24 | 04/19/24 | 1.0 |
| Sell 6Mx10Y straddles on a delta hedged basis | 04/26/24 | 05/03/24 | 3.1 |
| Sell 6Mx15Y straddles on a delta hedged basis | 05/03/24 | 05/10/24 | (1.6) |
| Sell 1Yx2Y volatility versus buying a theta neutral amount of 1Yx5Y volatility | 05/17/24 | 06/06/24 | 0.6 |
| Initiate Fronts/Green curve flatteners, paired with delta hedged long volatility positions in the 1Yx10Y swaption sector | 05/31/24 | 06/06/24 | 5.6 |
| Initiate exposure to long curve volatility by buying 6Mx2Y and 6Mx10Y straddles (41:60 vega weighted) versus selling 6Mx5Y straddles | 12/08/23 | 06/07/24 | 1.1 |
| Buy 2Yx5Y swaption straddles on a delta hedged basis, versus 6Mx1Y / 18Mx1Y flatteners | 06/07/24 | 06/14/24 | 3.6 |
| Initiate outright shorts in 3Yx30Y swaption implied volatility, but delta hedge monthly or if rates move by over 25bp in either direction since the last delta hedge | 03/08/24 | 07/12/24 | (5.0) |
| Buy 1Yx30Y volatility versus 1Y forward 1Yx30Y volatility, synthetically constructed via suitably weighted 2Yx30Y and 1Yx30Y swaptions | 03/15/24 | 07/12/24 | (2.5) |
| Buy 65% risk weighted 1Yx10Y swaption volatility versus selling 1Y forward 2Yx10Y swaption volatility, synthetically constructed via suitably weighted 1Yx10Y and 3Yx10Y swaptions | 04/12/24 | 07/12/24 | (4.4) |
| Sell 6Mx10Y swaption straddles on a delta hedged basis, paired with a short position in Greens | 06/14/24 | 07/12/24 | 2.2 |
| Buy 1Yx5Y straddles versus selling vega-neutral amount of 5Yx5Y straddles | 07/12/24 | 08/02/24 | 4.7 |
| Others | Entry | Exit | P/L |
| TU calendar spread narrowers | 8/18/2023 | 8/25/2023 | 0.5 |
| WN calendar spread wideners | 8/18/2023 | 8/25/2023 | (3.5) |
| Position for a widening in WN calendar spreads | 11/9/2023 | 11/22/2023 | 1.8 |
| Buy the USZ3/USH4 weighted calendar spread hedged with USZ3/WNZ3 Treasury futures curve flatteners | 11/9/2023 | 11/22/2023 | 0.2 |
| Position for a narrowing in FV calendar spreads | 11/9/2023 | 11/22/2023 | 0.3 |
| WN calendar spreads narrowers | 2/13/2024 | 2/23/2024 | (0.7) |
| UXY calendar spreads narrowers | 2/13/2024 | 2/23/2024 | (0.8) |
| TU calendar spreads narrowers | 2/13/2024 | 2/23/2024 | (0.3) |
| Sell the 4.75% Nov 2053 WNM4 basis, versus buying payer swaptions | 3/8/2024 | 4/12/2024 | 1.0 |
| Initiate calendar spread wideners in US Futures | 5/17/2024 | 5/28/2024 | (3.0) |
| Initiate calendar spread narrowers in UXY Futures | 5/17/2024 | 5/28/2024 | 0.4 |
| Initiate calendar spread narrowers in FV futures | 5/17/2024 | 5/28/2024 | 1.0 |
| Total number of trades | 144 | ||
| Number of winners | 95 | ||
| Hit rate | 66% |
Short-Term Fixed Income
- With still a considerable amount of uncertainty around monetary policy, short-term credit investors continue to favor bank CP/CD FRNs over fixed, with volumes now at their highest point since late January
- The recent rise in T-bill issuance over the past couple of weeks has likely contributed to the lower facility balance, though we might be approaching a floor as the uptick in net T-bill issuance stalls in early September and MMFs maintain some minimal amount of exposure to ON RRP for liquidity reasons
- We see QT as being in its endgame, with perhaps a few more months left, and project the Fed’s balance sheet to end the year at ~$7Tn, with Reserves flat at current levels, ON RRP balances slightly below $300bn, and a lower TGA
- In a complete reversal from June month-end, MMFs increased their dealer repo exposure by $205bn, with significant growth in repo exposure to FICC, UK banks, and French banks, and reduced their Fed ON RRP balances
- Current MMFs’ usage of the Fed’s ON RRP facility is highly concentrated. The top 5 and 10 individual money funds account for 44% and 62% of total ON RRP balances respectively as of July month-end. More notably, the top 2 fund families account for 66% of total ON RRP balances
- Assuming funds park 3-5% of their AUMs at the ON RRP for operational ease to meet unexpected liquidity needs, demand for ON RRP should range between $200bn and $325bn, suggesting that we are not far from the floor in terms of ON RRP balances
- Near-term catalysts: Aug flash manufacturing PMI (8/22), Aug flash services PMI (8/22), Jackson Hole Symposium (Aug 22-24), Aug Employment (9/6)
Market commentary
Treasury yields experienced heavy price action over the past two weeks, as the narrative shifted once again back towards a soft landing. In the front-end, 2-year yields witnessed a sharp increase of 19bp to 4.07%, while 10-year yields rose 10bp to 3.89%, retracing nearly all the rally witnessed so far this month. At these levels, yields have moved closer to pre-NFP. To be sure, weekly initial jobless claims fell for the second consecutive week, with the 4-week moving average dropping below this year’s peak. A closer look at the claims by state show normalization in the data for Texas and Michigan, suggesting that the the rises in July might have been technical, related to Hurricane Beryl and auto plant shutdowns respectively. Overall, the high frequency report does not suggest a major weakening in the labor market but more a gradual slowing (see US: Jobless claims moved down, M. Tasci, 8/15/24). July retail sales also exceeded expectations, with total sales up 1.0% MoM and the control category rising by 0.3%, indicating similar consumption spending as we saw in 2Q. Notably, the three-month annualized rate for the control category was 4.9%, reversing the slowdown earlier in the year (see US: July retail sales suggest no slowing in 3Q real spending, A. Reinhart, 8/15/24). Separately,the latest inflation data indicates a continued downward trend. In July, both headline and core CPI increased by 0.2% on the month, with the year-ago levels at 2.9% and 3.2%, respectively. These figures represent the slowest annual pace of inflation since 2021. With both July CPI and PPI data in hand, we foresee July core PCE to show a MoM increase of 0.122% (see US: Cooler July CPI, as expected, M. Hanson, 8/14/24).
Given the continued disinflationary process and the labor markets being looser than a year-ago, we believe there is a case for substantial Fed easing in the coming months. Our economists anticipate 125bp of cuts this year, with 50bp of easing in both September and November, followed by 25bp of reductions thereafter. However, markets have pared back on policy expectations as reflected in OIS forwards, which now indicate 95bp of cuts by year-end compared to 121bp just two weeks ago ( Figure 37).
Figure 37: Markets have pared back on policy expectations as reflected in OIS forwards, which now indicate 95bp of cuts by year-end compared to 121bp just two weeks ago
OIS-implied change in fed funds effective rate by FOMC meeting, as of 8/16/24, 8/2/24, and 1/12/24 (bp)
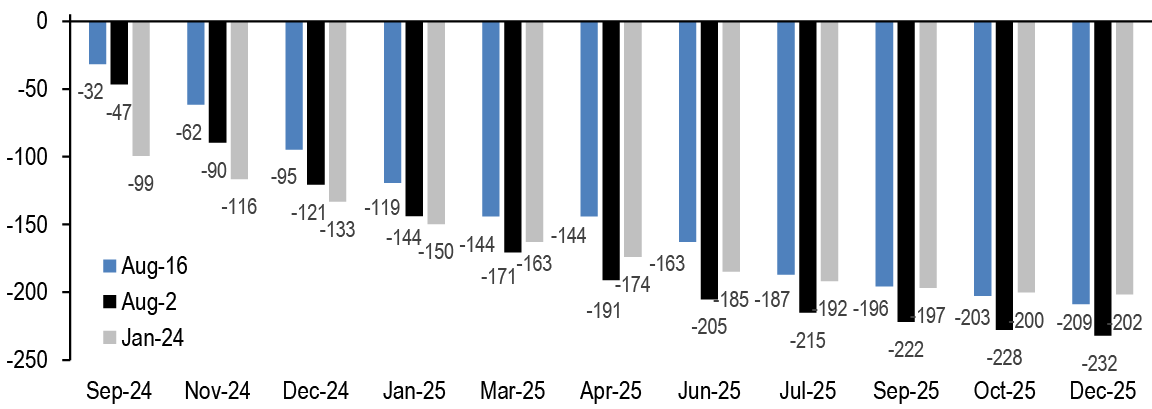
Source: J.P. Morgan
In the money markets, not much has changed over the past couple of weeks. Short term credit investors still favor bank CP/CD FRNs over fixed, with volumes now at their highest point since late January ( Figure 38). This trend makes sense given the substantial inversion of the money marekts curve (e.g., 1m1y T-bill yield spread is around -75bp), resulting in a relative all-in yield advantage in FRNs vs. fixed. Not to mention, there is still considerable uncertainty as to how the easing cycle will evolve as evidenced by the dramatic shift in Fed expectations over the past two weeks. In the near term, investors will likely continue to favor FRNs.
Elsewhere, RRP balances have trended lower, reaching $330bn on 8/16, down from the local peak at the end of July. Interestingly, RRP balances hit a low point of $287bn on 8/7, a level not seen since May 2021. The recent T-bill issuance over the past couple of weeks has likely contributed to the lower facility balance, though we might be approaching some sort of floor as the uptick in net T-bill issuance stalls in early September. Furthermore, as we discussed below, MMFs generally maintain some amount of exposure to the Fed’s ON RRP to help meet their liquidity needs that cannot be entirely met with repo or T-bills alone.
With ON RRP balances now hovering around $300bn, bank reserves sticky at $3.3tn, and repo rates steadily drifting higher in the fed funds corridor, it naturally raises the question of whether we have transitioned from an abundant reserves regime to an ample reserves regime. Two blog posts from Liberty Street Economics this week evaluate four indicators on the ampleness of reserves, including the use of an elasticity measure of the fed funds rate to reserves shock, and generally conclude that we have not hit that transition point (see here).
Taking a different approach in terms of measuring ampleness of liquidity in the market, our Interest Rate Derivative strategists adapted to the Fed’s analytical framework which is generally based on reserves and fed funds to be one based on reserves and ON RRP and broader short-term rates. That is, the ampleness of liquidity, defined as the sum of reserves and ON RRP, is best estimated by examining the response of broader short rates (such as SOFR) to quantity shocks. To that end, a look at the empirical relationship between changes in the SOFR-versus-top-of-the-band differential and percentage changes in total liquidity shows that indeed liquidity conditions have tightened.
Does that mean the end of QT? Fortunately, the tapered pace of QT, the potential for RRP balances to decline further within the $200-325bn range, and the anticipated decline in the TGA after 3Q collectively create some limited headroom for QT to continue. Thus, we see QT as being in its endgame, with perhaps a few more months left, and project the Fed’s balance sheet to end the year at ~$7Tn, with Reserves flat at current levels, ON RRP balances slightly below $300bn, and a lower TGA ( Figure 39) (see Interest Rate Derivatives).
Figure 38: Short term credit investors still favor bank CP/CD FRNs over fixed, with volumes now at their highest point since late January
Bank CP/CD volumes for 6m FRN vs. 6m fixed ($bn)
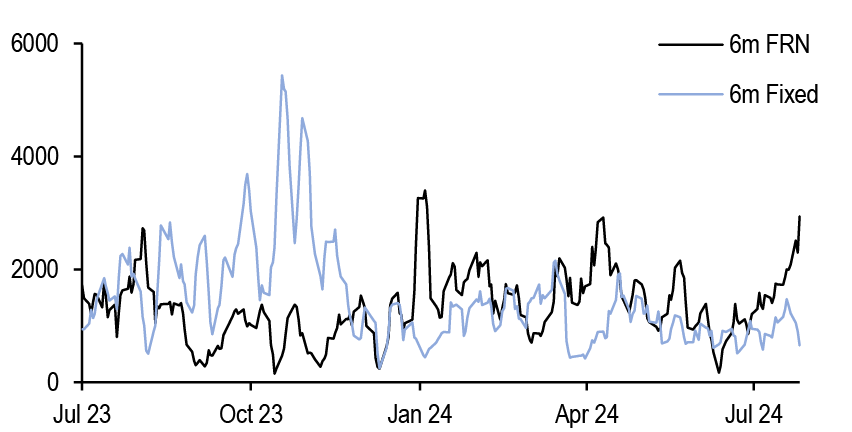
Source: DTCC, J.P. Morgan
Figure 39: We project the Fed’s balance sheet to end the year at ~$7Tn, with Reserves flat at current levels, ON RRP balances slightly below $300bn, and a lower TGA
Current* and projected values for Fed balance sheet assets, RRP, TGA, Reserves, and Commercial bank deposits through 2024, $bn
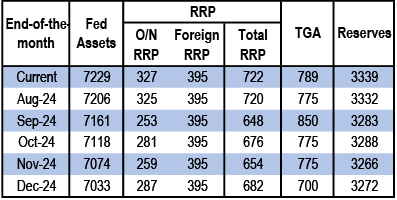
Source: J.P. Morgan., FRED, Federal Reserve H.4.1, Federal Reserve H.8
* Current as of 8/8/2024 Fed H.4. release
July MMF holdings update: MMFs and their use of Fed ON RRP
In a complete reversal from June month-end, MMFs grew their dealer repo exposure and lowered their Fed ON RRP balances at the end of July. MoM, MMFs’ dealer repo holdings increased by $205bn, driven by a surge in exposure to FICC (+$94bn), followed by UK banks (+$45bn) and French banks (+$42bn) ( Figure 40). The return in dealer activity from the latter banks is not surprising. As we previously noted, the timing of the French and UK elections likely prompted some dealers to de-risk heading into the event, and upon conclusion of those elections, they were able to loosen their balance sheets. Separately, MMFs’ dealer repo exposure to Canadian banks fell $25bn in July as it was Canadian banks’ fiscal quarter-end. We would expect this to be reversed next month.
Figure 40: MoM, MMFs’ dealer repo holdings increased by $205bn, driven by a surge in exposure to FICC (+$94bn), followed by UK banks (+$45bn) and French banks (+$42bn)
J.P. Morgan estimate of MMF repo counterparties by jurisdiction ($bn)
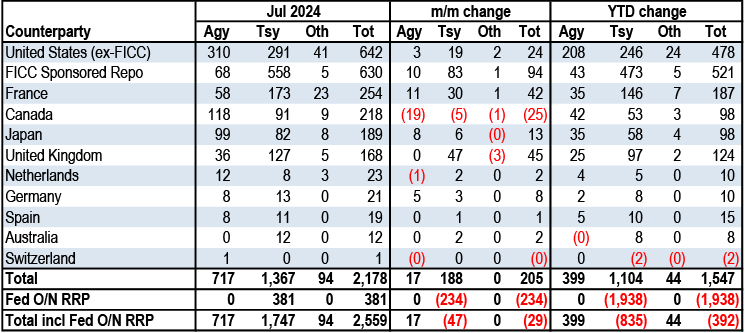
Source: Crane Data, J.P. Morgan
In light of the above, usage at the Fed’s ON RRP facility experienced a sharp MoM decline, with balances dropping to $413bn, the lowest level of usage at month-end since April 2021. Government MMFs accounted for the bulk of the decline, with their participation falling to $273bn, or just 66% of total RRP balances, while prime MMFs accounted for 26% ( Figure 41). Additionally, the number of MMF counterparties utilizing the RRP facility at the end of July was relatively low, with only 56 MMFs participating.
Figure 41: Government MMFs accounted for the bulk of the decline at the RRP, with their participation falling to $273bn, or just 66% of total balances
MMF and non-MMF RRP balances (LHS, $bn) vs. Govt MMF RRP % of total (RHS)
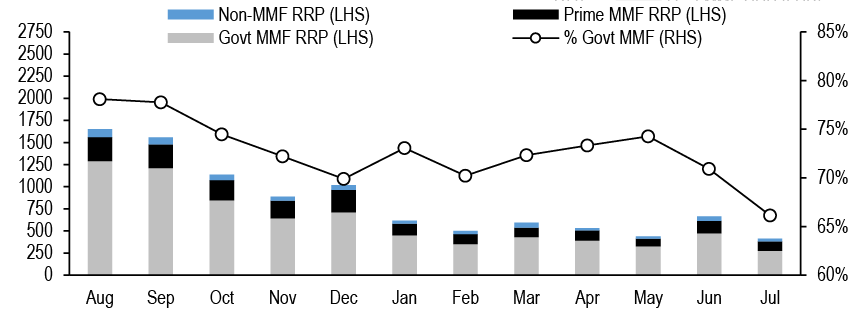
Source: Crane Data, J.P. Morgan
Even so, it is worth noting MMFs’ usage of the Fed’s ON RRP facility is currently highly concentrated. Among the MMFs that utilized the facility on July month-end, the top 5 and 10 individual money funds accounted for 44% and 62% of total ON RRP balances, respectively, with the largest placing over $70bn ( Figure 42). From a fund family perspective, the composition is even more concentrated, with the top 2 fund families comprising 66% of total ON RRP balances, which is to say portfolio allocation decisions across those two fund families could result in meaningful swings at the Fed’s ON RRP facility.
To that end, with Fed ON RRP balances hovering around $300bn, questions have emerged about whether the market is getting close to a floor. A closer look at individual MMF RRP counterparties reveals a mix of MMF types (e.g., government institutional, government retail, prime institutional, prime retail) accessing the facility, with usage ranging from <1% to 89% of fund AUMs at the end of July. To be sure, there are only two funds that dedicate more than 75% of their portfolios to ON RRP, and interestingly, those funds are prime institutional funds ( Figure 43). By and large, the vast majority of funds dedicate <25% of the portfolios to ON RRP, and within that, most dedicate <5% of the portfolios to ON RRP. If we assume that funds park 3-5% of their AUMs at the ON RRP for operational ease to meet unexpected liquidity needs, this would imply the demand for ON RRP to range between $200bn and $325bn, which suggests we are not too far off from the floor in terms of ON RRP balances.
Figure 42: On July month-end, the top 5 and 10 individual money funds accounted for 44% and 62% of total ON RRP balances respectively, with the largest placing over $70bn
MMF counterparty usage at the ON RRP ($bn)
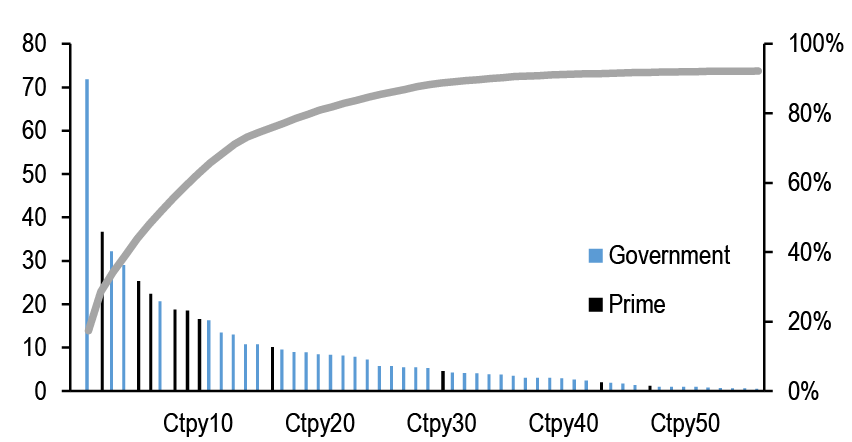
Source: Crane Data, J.P. Morgan
Figure 43: Only two funds dedicate more than 75% of their portfolios to ON RRP, and interestingly, those funds are prime institutional funds
MMF counterparty usage at the ON RRP shown as a % of fund AUMs (# of funds)
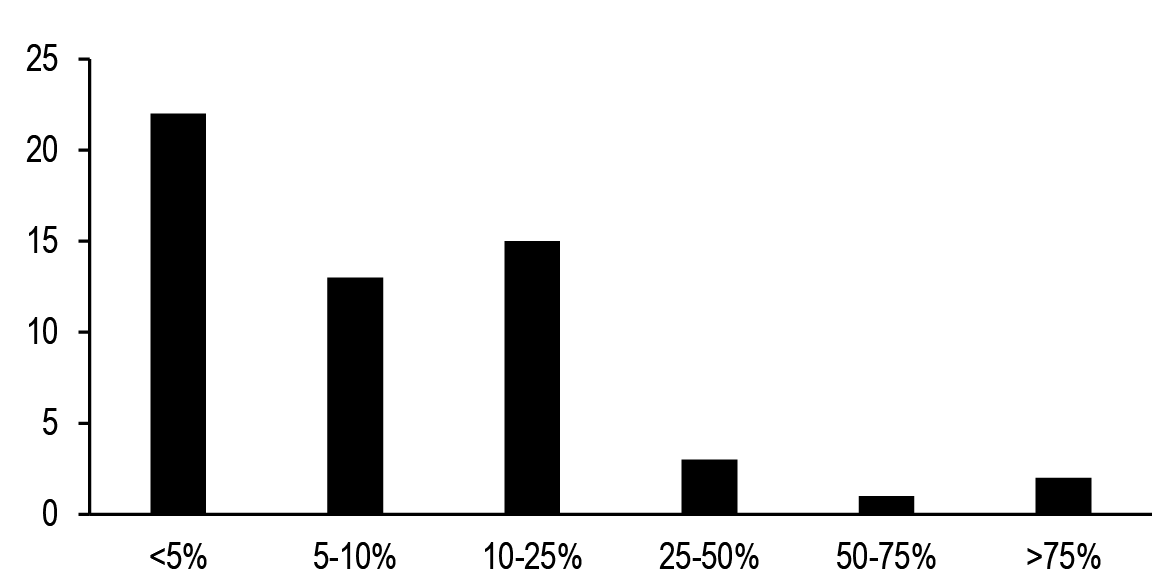
Source: Crane Data, J.P. Morgan
In total, MMF AUMs increased by $93bn to $6.5tn in July. Government MMFs experienced the bulk of the rise, increasing by $87bn MoM. From a portfolio perspective, they continued to allocate more towards T-bills, which rose by $113bn MoM ( Figure 44). Government MMFs continued to allocation more towards T-bills, which rose by $113bn MoM. This is not surprising, particularly as T-bill outstandings were in positive territory during the month, up by $150bn MoM. Meanwhile, prime funds allocated more of their holdings towards credit, with the largest increases in Eurozone and Other Yankee banks. On net, prime funds reduced their exposure to rates and agencies ( Figure 45).
Figure 44: Government MMFs continued to allocation more towards T-bills, which rose by $113bn MoM
Asset allocation breakdown of government MMFs ($bn)
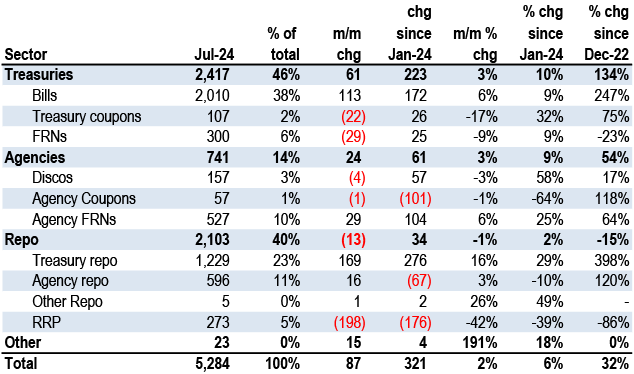
Source: Crane Data, J.P. Morgan
Figure 45: Prime funds increased their credit holdings, while reducing exposure to rates and agencies at July-end
Asset allocation breakdown of prime MMFs ($bn)
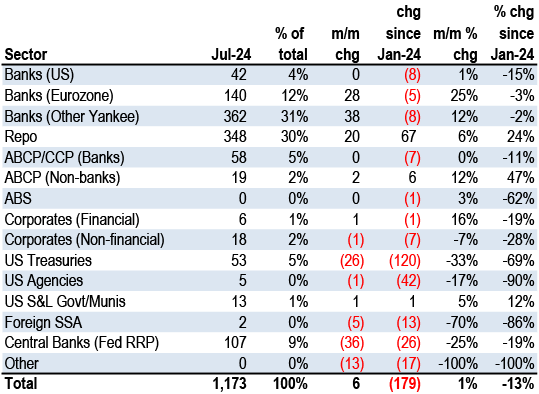
Source: Crane Data, J.P. Morgan
Nonetheless, most institutional prime funds that announced their conversion to government MMFs or liquidation of their prime funds have completed the transition, leaving only about $24bn of balances as of the end of July. As shown in Figure 46, total credit exposure among the funds that will soon convert or liquidate was just about $7bn. This is relatively small compared to the credit exposure held by the remaining universe of prime institutional and retail funds. Even with over $200bn in balances that already transitioned away from prime funds, CP/CD credit spreads have remained remarkably rangebound ( Figure 47). With the October prime MMF reform deadline rapidly approaching, it is possible that spreads could widen. However, as we have witnessed throughout this year, any spread widening will likely be limited as demand continues to outweigh supply, particularly given the amount of liquidity in the front end and a much more diversified CP/CD buyer base than in prior years.
Figure 46: Most institutional prime funds that announced their consolidation into government MMFs or liquidation of their prime funds have completed the transition, leaving only about $24bn of balances as of the end of July
Asset allocation breakdown of retail prime MMFs, institutional prime MMFs that are converting or liquidating, and remaining institutional prime MMFs, as of 7/31/24 ($bn)
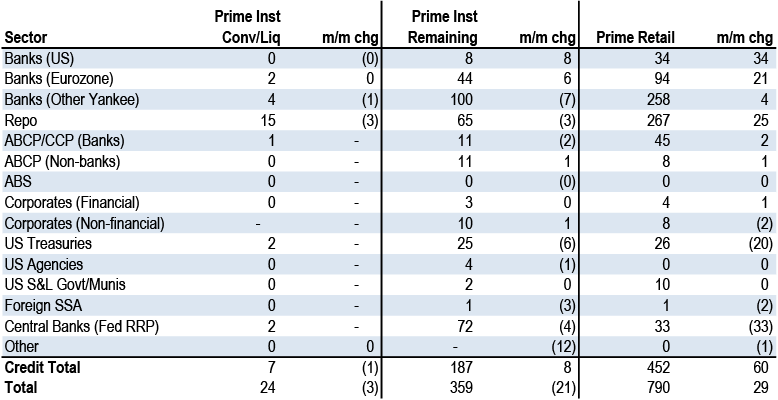
Source: Crane Data, J.P. Morgan
Figure 47: Even with over $200bn in balances that already transitioned away from prime funds, CP/CD credit spreads have remained remarkably rangebound
Bank CP/CD 6m and 1y FRN spreads (bp)
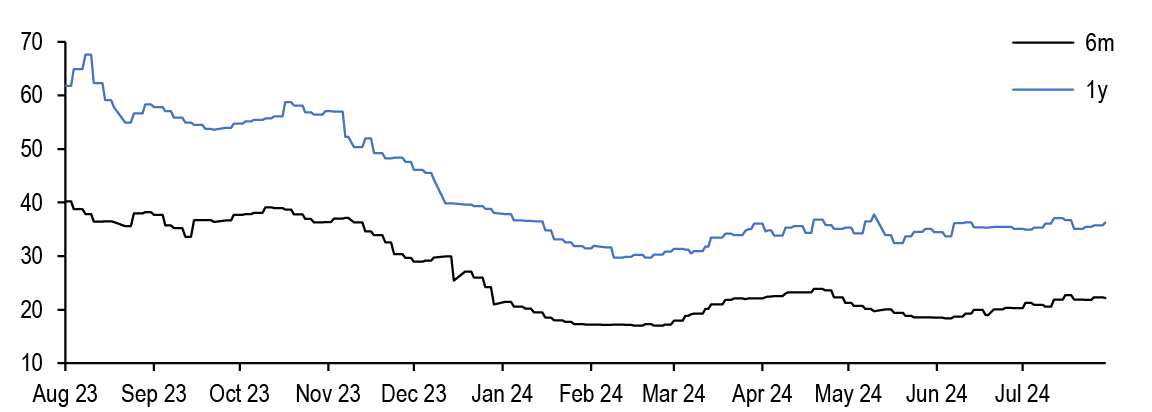
Source: J.P. Morgan
Excerpted from Short-Term Market Outlook and Strategy, Teresa Ho, August 16, 2024
Agency MBS
Watch the LTVs on your LLBs
- This week, higher coupon mortgage spreads continued to recover from their early August widening, while lower coupons edged a bit wider
- The stability of mortgages into the rally at the beginning of the month was notable and in line with the thesis held by many money managers—that if mortgages offer similar outright yields to corporates, and much less downside risk in sharp rallies, it can make sense to remain overweight. This should be a supportive of near term technicals
- Refi applications have spiked, but it remains difficult to know exactly how those applications will be apportioned on the coupon stack (and across seasoning); VA loans are already showing signs of acceleration in the Black Knight sample, and will likely pick up at locks from the first week of August flow through to closes near the end of the month
- It’s too early to glean much from the GSE daily prepay data
- LLBs and MLBs from 2023 have paid surprisingly fast over the past few months; we dig into the details and find that a greater cashout share is pulling speeds up as borrowers cashout a second time into a higher loan balance
- While this ramp effect should only be temporary, we are wary of the lower LTVs that have made their way into LLB pools, primarily from cashouts
- In the latest prepayment experience, LLBs with the lowest LTVs were more reactive to rate incentive, eroding call protection on the story
- Option cost, vega, and convexity all are tied to underlying prepayment risk, but are fundamentally different ways of attributing it; we explore how the three relate, and why the absolute maximums for each are currently occurring at different parts of the stack
- As the curve re-steepens, we should return to more ‘normal’ conditions with respect to which moneyness produces the peak values for these metrics
- We review trends in public originator Q2 2024 earnings; though many non-banks are focused on maintaining and growing capacity in anticipation of a rally, many servicers are still focused on growing their MSR holdings
- TIC data implies that foreign holdings of agency MBS rose $44.8bn in June (implying that YTD net growth was +48.8bn); we are not entirely sure what drove this large increase, but it was led by Canada followed by domiciled countries
Views
- Continue to prefer UIC conventionals, u/w 4.5s&5s
- Prefer seasoning in discounts
- Within loan bal, stick to relatively higher cuts to avoid low LTV cashouts
This week, higher coupon mortgage spreads continued to recover from their early August widening, while lower coupons edged a bit wider. In particular, lower coupon Ginnies and 15yrs were 3-5bp wider, while conventionals were just 1-2bp wider. On the margin, further concerns over bank and/or foreign portfolio reallocations may have played into some of the underperformance, though fundamentally cheaper opportunities up the stack may have just prompted some rotation as well.
We’re back on the snugger side of things, but the performance of mortgages into the flash rally was notable and in line with the thesis ascribed to by many money managers—that if mortgages offer similar outright yields to corporates, and much less downside risk in sharp rallies, it makes sense to remain overweight them. As IG has continued to retrace the 15bp widening at the start of the month, tight corporate spreads may remain a tailwind for MBS demand. Fund flows slowed a bit after the early August dislocations, but lower yields should be generally supportive of new dollars shifting to money managers.
Figure 48: Higher coupons are starting to recover from their early August widening, and lower coupons are a touch wider
Current, 1m, and 6m Treasury OAS ranges across the TBA stack in our research beta model. The black dots represent the current OAS, the blue boxes represent the 1m range, and the black lines represent the 6m range (as of 4:30PM, 8/15/2024)
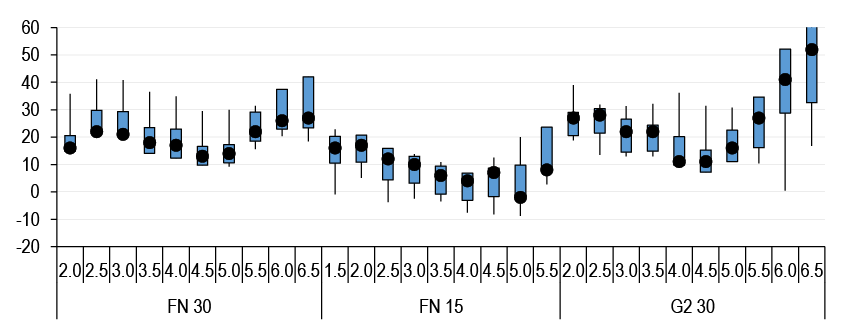
Source: J.P. Morgan
Daily prepays: This week, we didn’t produce a daily prepayment flash note because the 5 days of data we got from the GSEs weren’t enough to produce a strong signal. As Figure 49 and Figure 50 show, speeds are running perhaps a bit below last month’s pace through a very limited observation window – but not by enough that we have a high degree of confidence in the readings. In addition, it will be the daily readings from later in the month that will tell us whether August prepays (September print) might incorporate some short-lag closings that were locked at the start of the month.
Figure 49: It’s too early to read much into the GSE daily prepay data...
Daily Fannie 30yr speeds vs. business day, prepaid
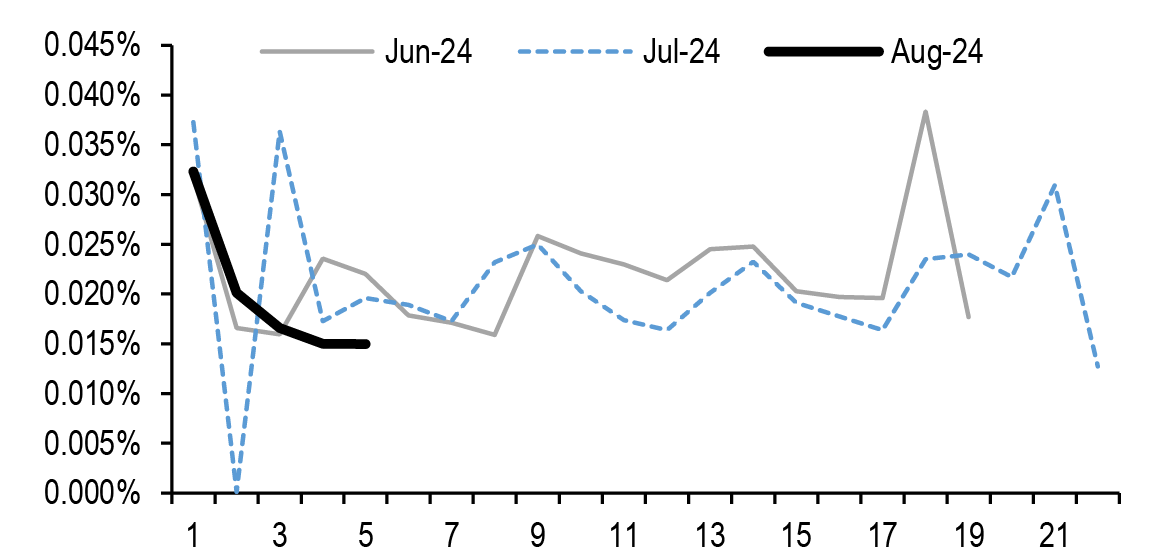
Source: J.P. Morgan, Fannie Mae
Figure 50: … since we have too few days and the latter half of the month is when refis might start to appear
Daily Freddie 30yr speeds vs. business day, prepaid
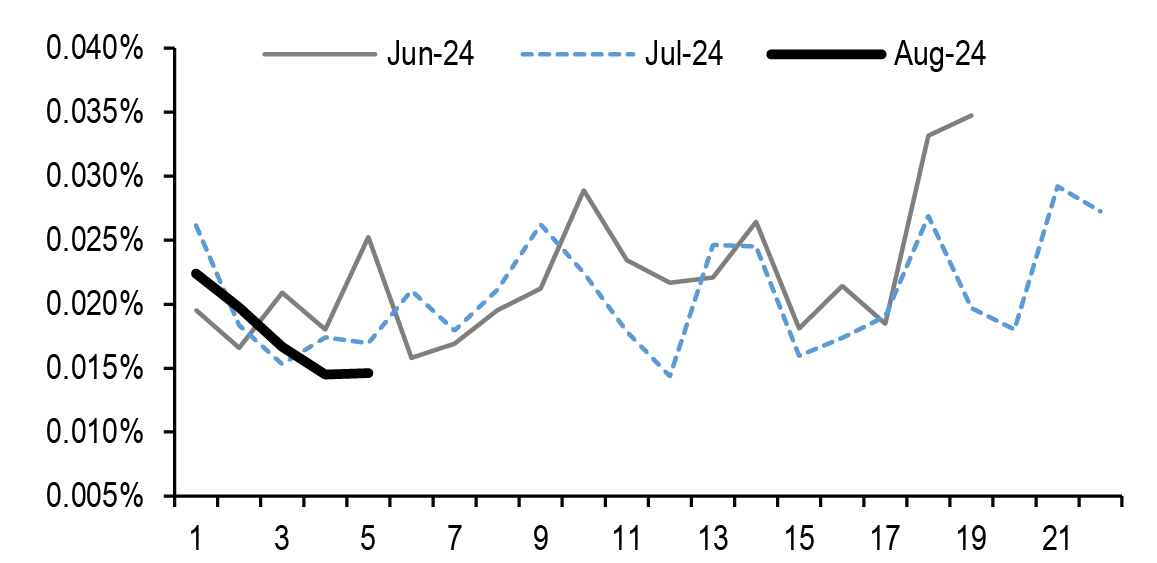
Source: J.P. Morgan, Freddie Mac
On the Ginnie side, the rapid 3-4 week lag length on many VA IRRRLs means that the Black Knight data for the last week or two of the month should start to get interesting. Those closes haven’t yet factored into the Black Knight closing data (or to our rate-agnostic projection methodologies) and already there are signs of a significant pickup in VA prepays in the higher coupons. 6s are generally tracking in line with our forecasts, though 2023 6.5s appears quite a bit faster. We’d expect fast peaks, and perhaps a re-emergence of the Ginnie mesa profile. Some of the mid-to-late 2023 issued 6.5s didn’t see low enough rates to sharply peak (i.e. mid 50s instead of 75c), and thus may still be somewhat sensitive to incentive.
Whenever there are such significant spikes in application volume data (see Figure 51 for the context of the magnitude of the spike), there is the question of how to apportion the single application total into actual prepayments. There is a loose correlation between the UPB of ramped and in-the-money VA loans and the application volume in a given week ( Figure 52). Clearly, a lot more high coupon loans have been created over the past two years, and as they ramp up and meet the Ginnie seasoning tests, for the same level of rates there should just be more applications. But the precision on this relationship is hardly airtight (see the regression in Figure 53), with a notable deviation in the first week of August. Moreover, you have to know how to apportion the speeds by coupon, and with Ginnies it gets even more complicated because the seasoning ramp is so sharp. As a result, even though the locks from the first week of August seem to have outstripped the eligible refi population, it’s hard to make a definitive statement about whether that means the peaks or post peaks (or the 6.5s or 7s) will perform worse than model expectations. There are just too many degrees of freedom. Still – signs point to fast prints ahead.
Figure 51: Application volume spike in the first week in August, though it has cooled somewhat this week
Optimal Blue VA Rate locks (indexed, left) and MBA VA Refi Index (right)
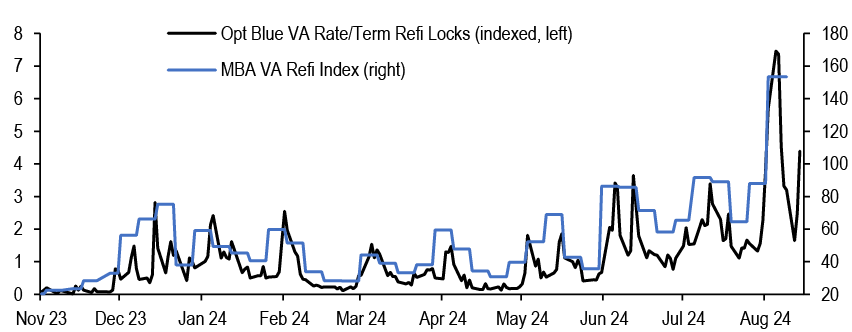
Source: J.P. Morgan, MBA, Optimal Blue (https://www2.optimalblue.com/)
Figure 52: Locks and eligible population roughly track…
Optimal Blue VA refi locks (left, indexed) and VA eligible UPB (right, $bn)
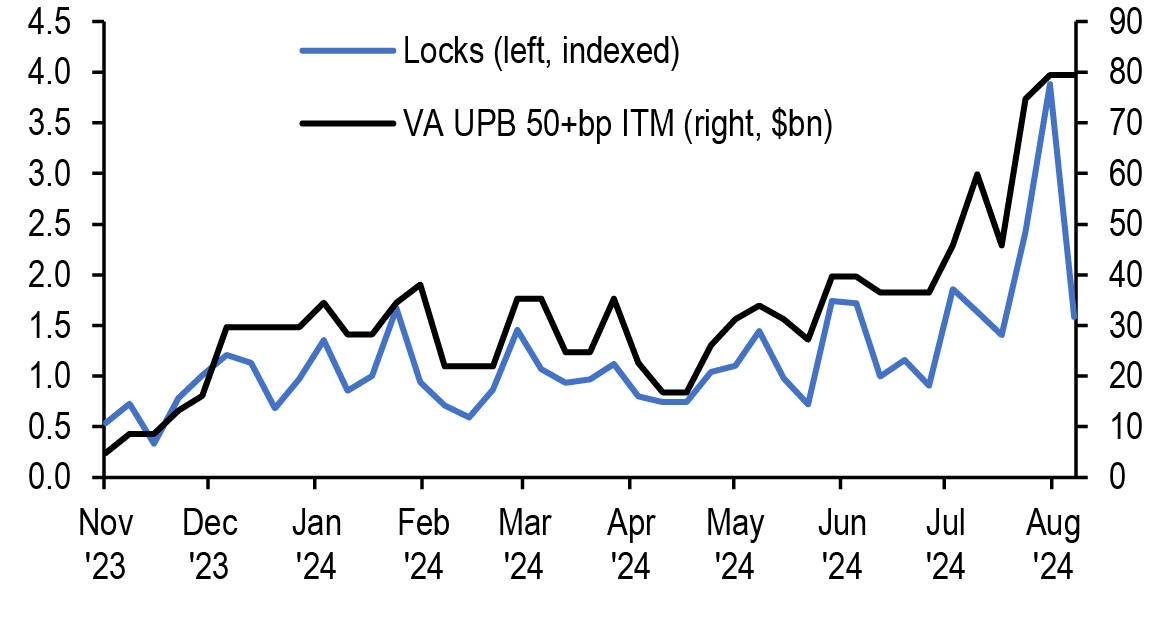
Source: J.P. Morgan, Ginnie Mae, Optimal Blue (https://www2.optimalblue.com/)
Figure 53: …but there can be significant deviations, like the high print we saw in the first week of August…
Optimal Blue VA Refi Locks (indexed) vs. VA eligible UPB ($bn)
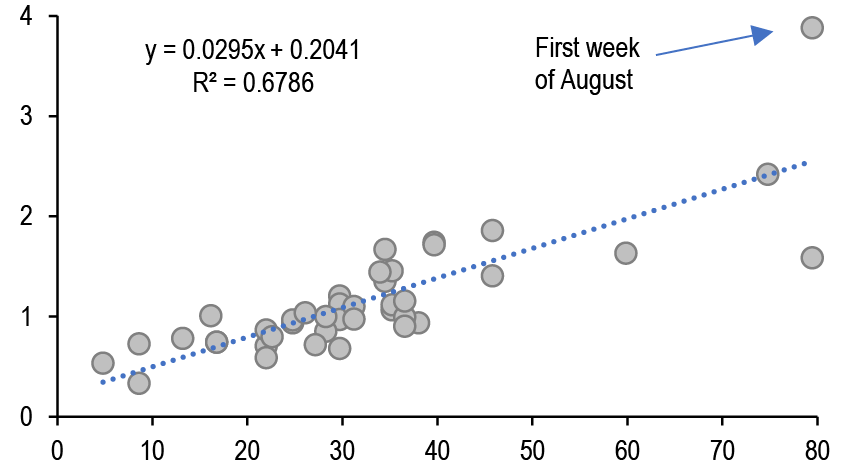
Source: J.P. Morgan, Ginnie Mae, Optimal Blue (https://www2.optimalblue.com/)
This week, we look at how LLBs and MLBs have been polluted by low LTV cashout loans; in our view, this worsens the relative appeal of the collateral, both in terms of near terms speeds and its convexity into a rally. We also examine the bond math of how option cost, convexity, and vega relate (i.e. why doesn’t the same coupon have the absolute maximum for all three across the stack?). Finally, we review mortgage originator earnings; there was a general focus on adding MSR and being ready for potential refi events.
What’s up with high speeds in low loan balance?
For many years, the stability of LLB/MLB prepayments were up there in life’s certainties, but that assumption has been challenged in recent months by some odd behavior out of the 2023 vintage. In this piece, we’ll take a close look at the story and how it has evolved during the run up in home prices since 2020. These small loans have for a while now been a combination of buyers with large downpayments plus those who own outright using a cashout for liquidity. This latter group has shot up as a share of originations in the current logjammed purchase market. In our view, these faster speeds are a temporary shift upward in the baseline, but the growing cashout share is worrisome since they carry such low LTVs. In the latest prepayment episode, LLBs with low LTVs were more reactive to rate incentive. Investors should prefer LLBs/MLBs with lower cashout shares, particularly up in coupon, to avoid a near term hit to carry and generally underweight the collateral.
Recent speeds (and what’s causing them)
Figure 54 shows the 2024 prepayment prints for 2023 vintage 6.5s by spec story along with non-spec. After ramping up for the first few months, LLBs printed as high as 14c in May, and roughly tied with MLBs and nonspec in the July report. Now, while its possible to imagine nonspec having some incentive in that coupon, the lower WAC and origination costs on the LLB/MLBs mean that these borrowers are unlikely to be refinancing to get into a lower rate. Also note we’ll be referring to these stories rather interchangeably in this write-up; we did argue a year ago that they might as well be combined given their similarity in profile and small origination volumes.
Figure 54: LLBs/MLBs are paying surprisingly fast in 2023 6.5s
1m CPR for UMBS 30yr 2023 6.5s by spec story

Source: J.P. Morgan, Fannie Mae , Freddie Mac
Expanding the scope of the speeds we’re looking at for the 2023 vintage helps to explain it. Even below 6.5s, as you look at lower size tiers, speeds incrementally go up ( Figure 55) and are quite flat across coupons for LLBs/MLBs. There’s also a noticeable increase in cashout share along with smaller loan sizes.
Figure 55: The fast July speeds in LLBs/MLBs hold true across coupons, particularly in comparison to nonspec and higher loan bal cuts
For UMBS 30yr 2023 loans, July 2024 CPR by coupon and spec type, along with cashout %
| 2023 Vintage | July 1m CPR by coupon | Cashout % by coupon | ||||||||
| By spec type | 5.0 | 5.5 | 6.0 | 6.5 | 7.0 | 5.0 | 5.5 | 6.0 | 6.5 | 7.0 |
| LLB | 10.7 | 13.8 | 13.7 | 13.7 | 18.4 | 22 | 25 | 33 | 35 | 43 |
| MLB | 11.8 | 10.9 | 10 | 14.3 | 12.6 | 19 | 23 | 29 | 32 | 40 |
| 125k Max | 5.8 | 11.4 | 11.6 | 11.8 | 18.2 | 17 | 19 | 23 | 26 | 29 |
| HLB | 8.4 | 9.2 | 10.6 | 11.2 | 14.3 | 16 | 18 | 22 | 25 | 27 |
| 175k Max | 7.8 | 9.3 | 9.6 | 8.9 | 14.1 | 15 | 15 | 19 | 21 | 22 |
| 200k Max | 9.6 | 7.4 | 8.4 | 9.9 | 16.6 | 13 | 13 | 15 | 17 | 18 |
| 225k Max | 5.9 | 8.1 | 8.8 | 10.2 | 12 | 12 | 11 | 13 | 15 | 17 |
| 250k Max | 6.3 | 7.7 | 7.1 | 9.1 | 16.9 | 10 | 10 | 10 | 12 | 13 |
| 275k Max | 5.9 | 5.3 | 6.4 | 9.6 | 14.9 | 8 | 7 | 8 | 9 | 10 |
| 300k Max | 4.8 | 5 | 6.4 | 9.4 | 9.7 | 8 | 6 | 7 | 6 | 7 |
| Nonspec | 5.5 | 6.2 | 8 | 13.8 | 24.9 | 5 | 5 | 6 | 7 | 11 |
Source: J.P. Morgan
Returning to just the 2023 6.5s, we can split the latest month of speeds by the loan’s purpose. Most are cashout/purchase, and as Figure 56 shows, the faster speeds for LLB/MLBs are being driven by the cashout loans prepaying at nearly 20c. This, along with their greater presence in pools these days, is leading to the mid-teen prints that look so unusual for out-of-the-money LLBs. We also show curtailments, since they are typically stronger in lower loan size, but they aren’t contributing as much to the recent discrepancy. Figure 57 displays how LLB/MLB cashout loans have prepaid equal to or faster than nonspec for coupons lower down the stack. One should keep in mind that very few cashouts are making it into nonspec pools, to the order of 5-7% on 5s-6.5s against 20-35% for LLBs and MLBs.
Figure 56: An increased cashout share and fast cashout prepays is driving the increase in LLB/MLB overall speeds…
2023 6.5 July 1m CPR, curtailments, and purpose share, split by original loan purpose of the loan and spec type
| 2023 6.5s | Spec | All | Cashout | Purchase | Rate/Term |
| 1m CPR | LLB | 13.7 | 17.1 | 10.9 | 22.7 |
| MLB | 14.3 | 20.4 | 11.3 | 10.4 | |
| Nonspec | 13.8 | 20.6 | 13.2 | 16.8 | |
| 1m Curtailments | LLB | 1.7 | 1.6 | 1.9 | 1.4 |
| MLB | 2.4 | 1.4 | 2.8 | 2.7 | |
| Nonspec | 1.7 | 1.4 | 1.8 | 0.7 | |
| Share % | LLB | 35% | 60% | 5% | |
| MLB | 32% | 64% | 4% | ||
| Nonspec | 7% | 90% | 3% |
Source: J.P. Morgan, Fannie Mae, Freddie Mac
Figure 57: …and that trend can be seen across coupons issued in 2023
July CPR for UMBS 30yr 2023 6.5s cashout loans by spec type and coupon
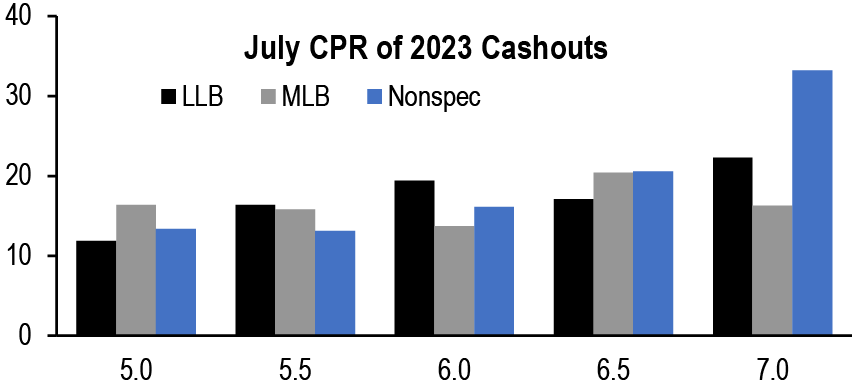
Source: J.P. Morgan, Fannie Mae, Freddie Mac
So where are all these small loans rushing off to? We can use the Black Knight loan-to-loan transition data to get some answers. Focusing on just cashout loans, and 6-7 WAC, we can see that the main differentiation between MLBs and non-specs has been a much greater share of cashouts for the smaller loans ( Figure 58 and Figure 59). Turnover and curtailments show little difference between MLBs and nonspecs.
Figure 58: MLB cashout loan prepays have been driven by additional cashouts…
Prepayments by reason (excluding rate-term) for 2023 originated MLBcashout loans with 6-7% WACs
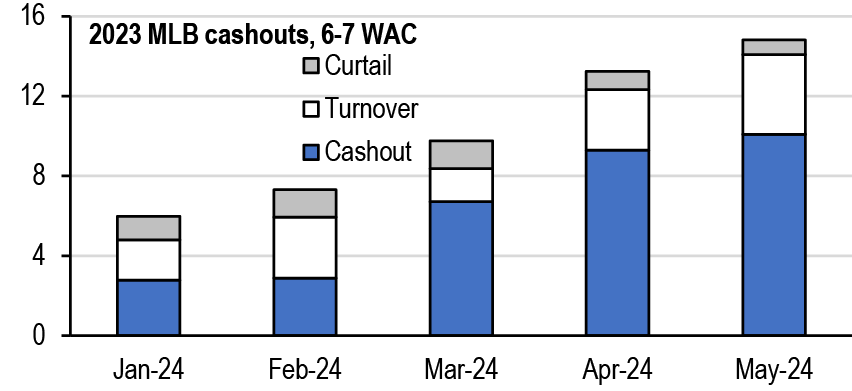
Source: J.P. Morgan, Fannie Mae, Freddie Mac
Figure 59: …which are not nearly as large a factor in >$250k cashout loans
Prepayments by reason (excluding rate-term) for 2023 originated >=$250kcashout loans with 6-7% WACs
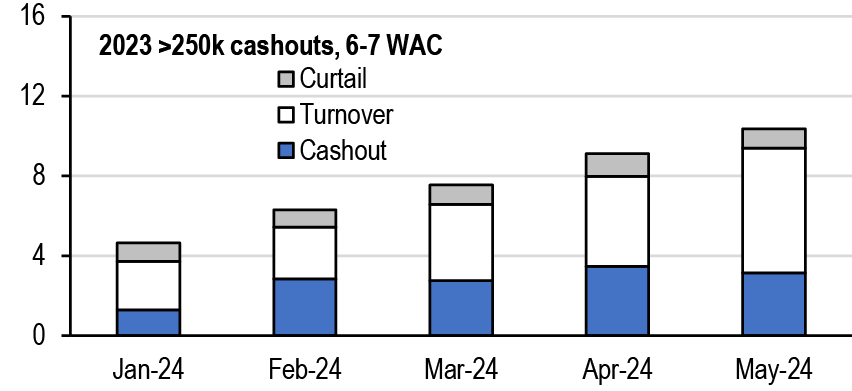
Source: J.P. Morgan, Fannie Mae, Freddie Mac
Phrased another way, “serial cash-outs” are more likely for LLBs/MLBs. A borrower might have taken out $100k of equity in 2023 for a home remodel or college tuition, and then turns around and takes out some more in 2024. This can be a cagey approach for handling large lumpy payments over a period of years; the borrower avoids paying interest on the full balance right away which hopefully makes up for origination costs. It could also be tempting at a time when rates are historically high and the borrower could potentially get a lower overall rate on the next cashout (even if it hasn’t panned out so far in 2024).
Looking at the 2023 loans that were originally purchase, there is a slight amount of cashout activity (~1c) for MLBs versus almost nothing for >250k loans ( Figure 60 and Figure 61). This also makes sense from the context of the borrower’s decision at the time of the first loan. Either they could have put less down (and not needed to cash-out a year later) or they were already fully levered on a cheaper house, leaving little room for cashouts a year later. It’s possible that the cashouts that do happen come from borrower’s unexpectedly needing more liquidity within this short time window.
Figure 60: When restricted to just purchase loans, MLBs show only a slight amount of prepayments for the purpose of cashing out in 2024…
Prepayments by reason (excluding rate-term) for 2023 originated MLBpurchase loans with 6-7% WACs
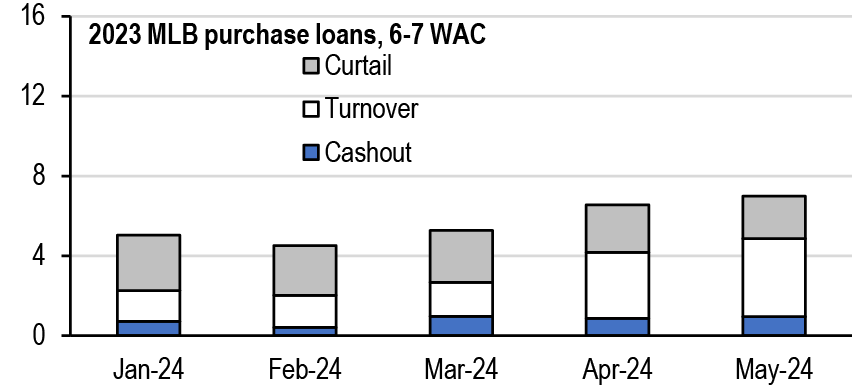
Source: J.P. Morgan, Fannie Mae, Freddie Mac
Figure 61: …though turnover and curtailments are even lower for larger loans
Prepayments by reason (excluding rate-term) for 2023 originated >=$250kpurchase loans with 6-7% WACs
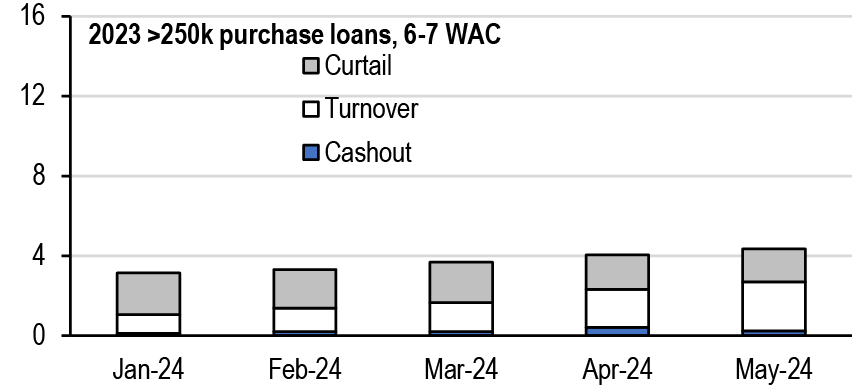
Source: J.P. Morgan, Fannie Mae, Freddie Mac
What has changed with LLB borrower after the sell-off?
As hinted at above, composition is a major part of the story. Taking a stroll down memory lane, cashout share was roughly equal between LLBs and nonspec from 2014 to 2017 ( Figure 62). At that point, the gap started to open up, with LLBs more likely to be the result of cashouts as home values (and loan sizes) crept upward. They re-aligned during the 2020-2021 refi wave as plenty of borrowers opportunistically cashed out while grabbing lower rates across the loan size spectrum. The subsequent sell-off caused the largest rift yet, with nonspec cashouts nearly nonexistent while they make up a third of LLBs. This can be seen as a migration of the purpose behind LLBs as the loan limit cap of $85k dwindles in comparison to the median home price. A greater share of them overtime should come from borrowers accessing equity on a previously paid off home rather than for purchase.
We would also mention that on a coupon level, the overall greater amount of primary rate dispersion plus the additional cash-out LLPAs leads them to be extra concentrated on the high-end of the coupon range. We illustrate this in Figure 63 by looking at the cashout% of the highest (and lowest) coupon of LLB issued in each month with at least 10% of the overall balance. Lately that has meant 6.5s and 7s in the mid-forties range against the average of a third and the lowest coupon (5.5s) in the mid-twenties.
Figure 62: The cashout share of LLBs/MLBs has fundamentally disconnected from nonspec pools…
Share of cashout loans by spec type
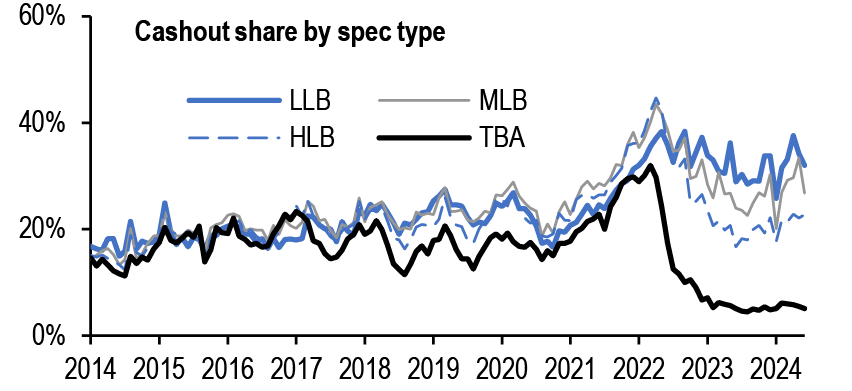
Source: J.P. Morgan, Freddie Mac
Figure 63: …and the greater degree of dispersion in primary rates, combined with cashout LLPAs, has increased the cashout% of high coupons
Cashout loans % of LLBs based on coupon (lowest/highest with >10% bal)
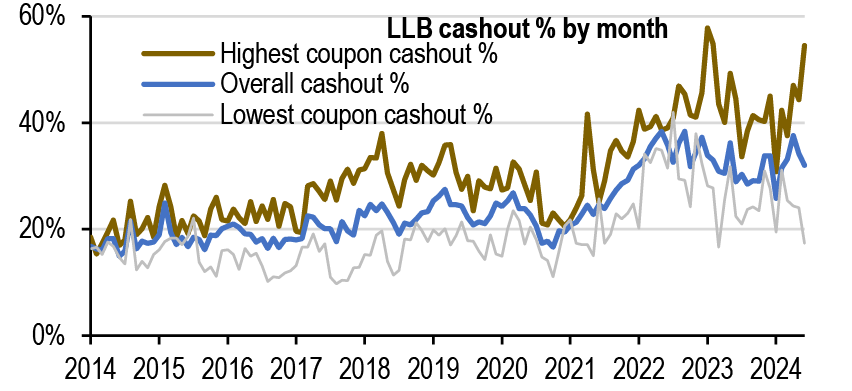
Source: J.P. Morgan, Freddie Mac
Looking across the most relevant loan characteristics, the other main change that stands out over the years is the drop in LTV ( Figure 64). This is the expected side-effect of a static loan balance cap and rising home values; there just aren’t many places anymore where an LLB-sized loan is going to be more than 70LTV. This is important to speeds later and we would note that even while the average has gone from 70 to 56 (‘18 to ‘24), the purchase loans have only gone from 76 to 66 while the cashouts have dropped from 56 to 40. The investor % within LLBs has remained a steady 20%. Some of that is just pooling dynamics; investor loans are more likely to be cut out into separate pools at higher loan sizes.
On the originator side, Rocket has been the most prolific seller within <=$110k cashouts, and their overall share has risen markedly since sell-off ( Figure 65). The share of the 2nd/3rd sellers has remained mostly in the 3-5% range with a rotating cast of sellers and a general migration towards nonbanks. Beyond mirroring the general change in the originator landscape, this trend could hint towards Rocket doing an effective job of reaching owners with paid-off houses and steering them towards a small cash-out rather than another product for tapping home-equity. That would also establish a relationship for the “next” cash-out as the borrower has more liquidity needs come up a year later.
Figure 64: Issuance stats on LLBs versus Nonspec over the years, showing the rise in cashouts and the drop in LTVs
| All Loans | LLB | Nonspec | ||||||||||
| Orig Bal | WAC | LTV | DTI | Inv % | Cashout % | Orig Bal | WAC | LTV | DTI | Inv % | Cashout % | |
| 2015 | 4.3 | 4.33 | 69 | 32 | 19 | 19 | 192.6 | 4.09 | 77 | 35 | 5 | 18 |
| 2016 | 4.1 | 4.19 | 71 | 33 | 20 | 19 | 231.2 | 3.88 | 76 | 35 | 5 | 19 |
| 2017 | 4.4 | 4.47 | 71 | 33 | 20 | 20 | 191.8 | 4.20 | 78 | 36 | 6 | 19 |
| 2018 | 4.1 | 4.94 | 70 | 34 | 21 | 22 | 166.1 | 4.63 | 79 | 37 | 4 | 16 |
| 2019 | 4.2 | 4.82 | 69 | 34 | 23 | 24 | 242.9 | 4.18 | 77 | 36 | 2 | 17 |
| 2020 | 3.7 | 3.80 | 67 | 33 | 21 | 22 | 538.3 | 3.19 | 73 | 34 | 1 | 17 |
| 2021 | 4.2 | 3.29 | 63 | 32 | 19 | 25 | 655.4 | 2.96 | 73 | 34 | 1 | 23 |
| 2022 | 2.4 | 4.80 | 61 | 34 | 23 | 35 | 310.0 | 4.33 | 77 | 37 | 3 | 22 |
| 2023 | 1.7 | 6.92 | 59 | 34 | 20 | 31 | 158.2 | 6.60 | 80 | 39 | 1 | 5 |
| 2024 | 1.0 | 7.10 | 56 | 34 | 20 | 32 | 95.5 | 6.89 | 79 | 39 | 1 | 5 |
Source: J.P. Morgan, Freddie Mac
Figure 65: The largest sellers of LLB/MLB cashouts by year
| All UMBS 30yr LLB/MLB Cashout Loans | ||||||
| Issue Year | Top seller | 1st % | Second seller | 2nd % | Third seller | 3rd % |
| 2019 | Rocket | 13% | Chase | 9% | Wells | 8% |
| 2020 | Rocket | 10% | Chase | 5% | Wells | 4% |
| 2021 | Rocket | 17% | Wells | 3% | UWM | 3% |
| 2022 | Rocket | 18% | Wells | 6% | Loan Depot | 5% |
| 2023 | Rocket | 25% | Chase | 6% | Loan Depot | 5% |
| 2024 | Rocket | 32% | UWM | 5% | Royal United | 4% |
Source: J.P. Morgan, Fannie Mae, Freddie Mac
We can glean one final bit of information on the changing LLB/MLB borrower from the HMDA dataset. It includes granular income data, which isn’t available in the agency disclosures, providing a more detailed look at the borrower. Figure 66 shows income by loan purpose from 2018 to 2023. While purchase income was steady before the sell-off and has by necessity risen to match the higher interest costs today, the most remarkable change has happened in cashouts. LLB cashout borrowers had incomes in the $50k range in 2018, down to almost $40k during the 2021 refi frenzy, and that level has now soared to almost $80k. Figure 67 shows how this surge is notable in absolute terms for both LLBs and MLBs and exceeds higher loan size buckets. This income data helps highlight how there are some fundamental differences with the LLB borrower today versus before the 2022 selloff.
Figure 66: For LLBs, cashout incomes soared in 2022/2023, well above the change in purchase loans
Borrower income ($k) for GSE loans <$85k in size by loan purpose, yearly
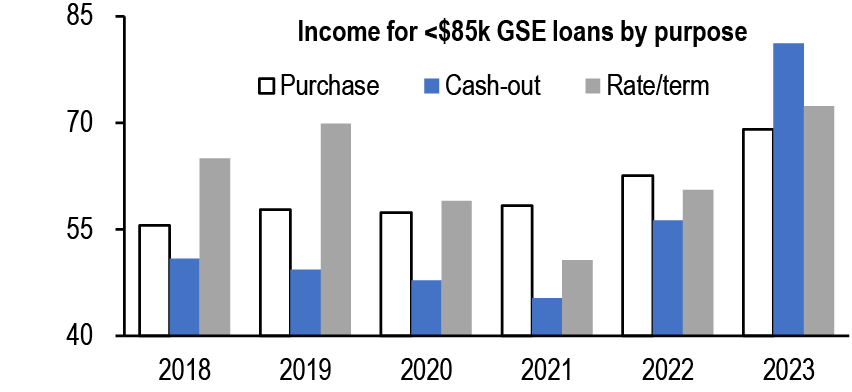
Source: J.P. Morgan, HMDA
Figure 67: The surge in LLB/MLB incomes on cashouts is impressive even in absolute terms relative to other loan size categories
For cashout loans, change in income ($k) since 2018 by size of loan
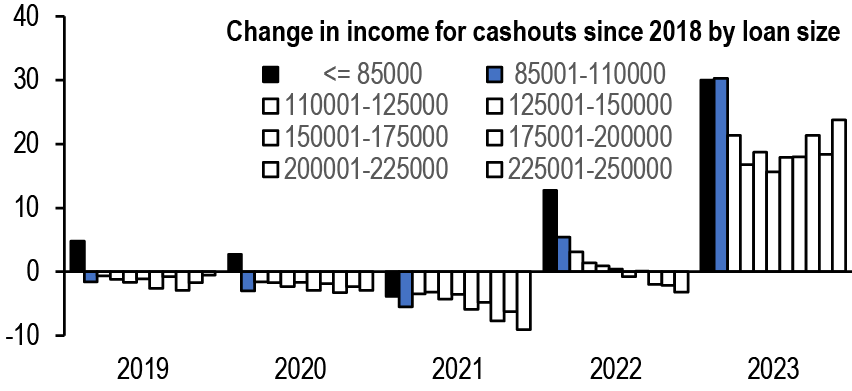
Source: J.P. Morgan, HMDA
What does it all mean for LLB speeds (and reactivity) going forward?
Starting with the baseline level of speeds, we think the recent high prints in LLBs/MLBs are more of a ramp effect than a long-term change. The boost in speeds (above and beyond the normal curtailments and cashouts of LLBs) is coming almost entirely from sequential cashouts. The first cashout up to $85k or $110k requires a substantial amount of equity (or more likely a paid off home) to make it worthwhile. This amount of cash is likely being used for a large remodeling or expense like college, and if more cash is needed, it will be sooner rather than later with these needs. It wouldn’t be surprising if borrowers are planning their next draw in advance and treating sequential cashouts as a HELOC alternative. The below aging curve for all LLBs by year of observation that shows just how unusual 2024 has been, and how cashout speeds have trended lower in many past years. The exceptions are more rate driven refis from 2020 and 2021.Figure 68: The unusual nature of the 2024 LLB cashout ramp stands out against previous years…
1m CPR on LLBs by loan age, for owner-occupied cashouts, observed yearly since 2015
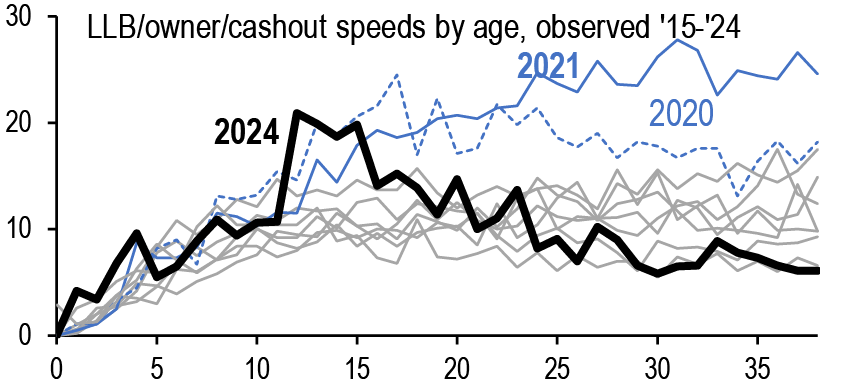
Source: J.P. Morgan, Freddie Mac
Figure 69: …and for more seasoned LLBs, the greatest differentiator seems to be LTV, which matters with the low LTV cashouts being made currently
1m CPR versus incentive for LLB loans by current LTV, 18-36 WALA, observed 2019-2022
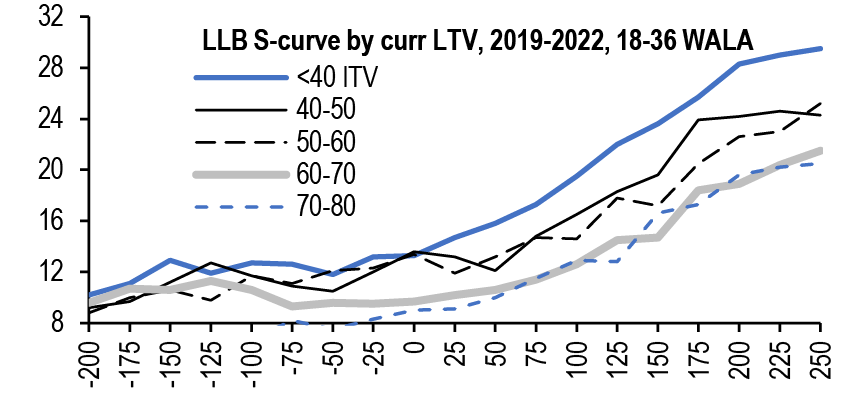
Source: J.P. Morgan, Freddie Mac
On the convexity side, we would first highlight that regardless of loan purpose or borrower, the cold hard economics behind the call protection of LLBs/MLBs remain true. As we wrote about recently, origination costs have enough of a fixed component that the payback period is significantly longer for these smaller loans at an equal rate incentive to a larger loan. When looking at s-curves, we didn’t notice that cashouts were much reactive than purchase loans after this ramp period. Figure 68
However, there does seem to be a significant connection between rate sensitivity and current LTV. Figure 69 shows how lower LTV LLBs were noticeably faster than higher LTV, particularly when moving to 50 and below. This matters today because of the bifurcation in LTVs on new issuance; cashouts as a whole are now starting at 40LTV while purchase (which have also dropped) are closer to 65LTV. So into a rally, It is possible that those lower LTV cashouts will drop out of the pool at a quick rate, and moreso than a model looking at just the blended LTV might expect.
The remaining wildcard is the nature of the borrower. Today’s LLBs have a much greater share of cashouts from borrowers with incomes relatively high to the size of the loan. On one hand, these borrowers could be more financial savvy, and more ready to pounce on a refi opportunity when presented a reasonable payback period. On the other hand, they could view the potential refi savings as a less meaningful share of their overall cashflow.
As a result of this analysis, our first recommendation would be to seek out new issue LLBs/MLBs with relatively lower cashout components. With even 5s in these stories trading at a premium, it is desirable to avoid the quicker than expected ramp from sequential cashouts. We also are wary of the greater share of low LTV loans in these pools generally and what that has meant for prepays into rallies.
Option cost, vega, and convexity—understanding why the metrics peak at different points on the stack
Mortgage brainteaser: why is option cost highest for 5.5s and 6s, convexity worst for 5s and 5.5s, and vega most negative for 4.5s and 5s? On any given day, the coupons may shift a bit, but we get the same general question from time to time. The metrics seem like they should all be tied to the prepayment option that the investor is short to the borrower, and thus the bonds that are most exposed to prepayment risk should fare ‘worst’ in all three categories. Vega and option cost are actually quite closely linked (it just takes a spread duration transformation), while OAC is related more loosely to the other two.
Option cost and vega should be closely linked, given that implied vols are a key driver of option cost; they don’t need to be precisely on top of one another, given that curve slope also is a key factor in estimating option cost (in addition to the level of vol), but they should be close. However, option cost is quoted in spread terms, while vega is quoted in price change per change in vol. We need to translate that vega into spread terms to make the comparison more direct, as shown in Figure 70. Since spread durations currently increase in magnitude as one moves down the stack, applying this transformation effectively shifts the ‘peak’ vol impact up the stack, at least as quoted in spread terms. As a result, the relationship between option cost and vega becomes much tighter ( Figure 71).
Figure 70: Vega needs to be divided by spread duration to be more comparable to option cost …
FN 30yr option cost, OAC, vega and spread duration as of 8/7/2024
| FN 30yr | Opt Cost | OAC | Vega | Sprd dur | Vega / Sprd dur |
| 2.0 | 14 | 0.29 | -0.033 | 7.1 | -0.005 |
| 2.5 | 20 | 0.02 | -0.041 | 6.8 | -0.006 |
| 3.0 | 27 | -0.16 | -0.048 | 6.5 | -0.007 |
| 3.5 | 38 | -0.63 | -0.056 | 6.1 | -0.009 |
| 4.0 | 51 | -0.85 | -0.060 | 5.6 | -0.011 |
| 4.5 | 65 | -1.33 | -0.062 | 5.1 | -0.012 |
| 5.0 | 86 | -2.46 | -0.064 | 4.5 | -0.014 |
| 5.5 | 107 | -2.35 | -0.057 | 3.6 | -0.016 |
| 6.0 | 105 | -1.67 | -0.046 | 2.9 | -0.016 |
| 6.5 | 76 | -0.92 | -0.035 | 2.4 | -0.015 |
| 7.0 | 47 | -0.21 | -0.023 | 2.0 | -0.011 |
Source: J.P. Morgan
Figure 71: … after this transformation, the relationship between vega and option cost is much clearer
FN 30yr vega and vega/spread duration vs. option cost, 8/7/2024
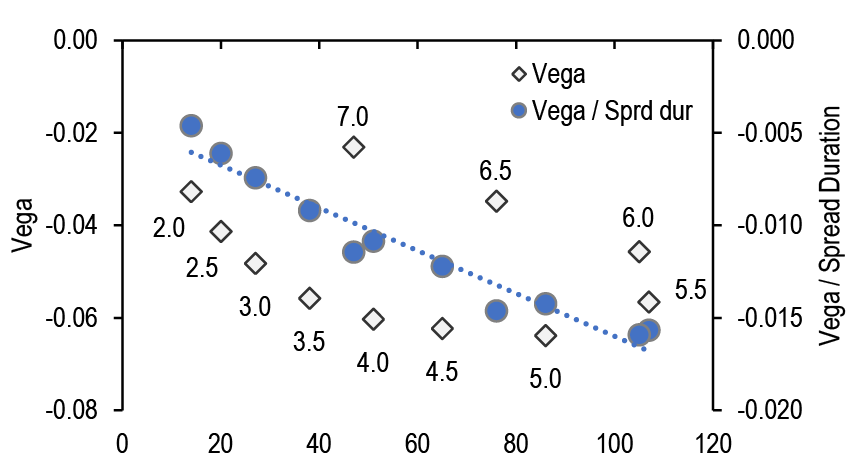
Source: J.P. Morgan
Convexity, on the other hand, isn’t going to lend itself to such a simple conversion. The change in duration is typically largest in absolute magnitude (equivalently, most negative) for MBS at the steepest part of the s-curve (usually those around 50bp in-the-money). When forward primary mortgage rates are very different from today’s, the bonds that are currently at the steepest part of the s-curve may not be the same as those on that part of the curve in the future. For example, with today’s inverted s-curve, bonds that are somewhat out-of-the-money will become more at-the-money in the future, and thus may have a worse convexity ( Figure 72). In contrast, with a steeper curve (and for most of the last three decades, the curve has been positively sloped), bonds that are at-the-money today become out-of-the-money in the future.
Figure 72: The most convex point on the stack was typically 50bp above the current coupon when the curve was steep – but that’s not been the case for the past two years
OAC by relative moneyness (vs. the current coupon)
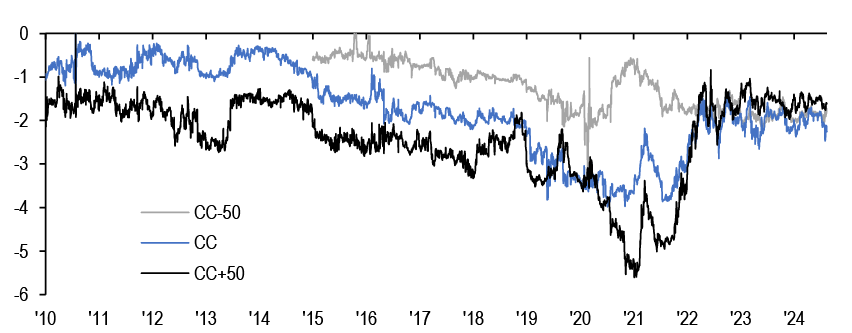
Source: J.P. Morgan
In addition, the magnitude of convexity is partly tied to the magnitude of duration; a peak convexity bond with a longer OAD, all else equal, typically models with an OAC of larger absolute magnitude. The inverted curve also shortens durations up the stack, which means that the expected change in duration for a move in rates is smaller. In Figure 73 and Figure 74, we show how the relationship between option cost and OAC is improved with the introduction of OAD as another explanatory variable (the second chart is shown as a rearrangement of the regression: OAC = a*option cost +b*OAD + c, or OAC-b*OAD=a*option cost +c). This helps to explain why the level of OAC is not at its most negative (vs. a long time series), but option cost is near the historical maximum.
Figure 73: OAC and option cost haven’t correlated particularly well over time …
Current coupon OAC vs option cost, 2010-now
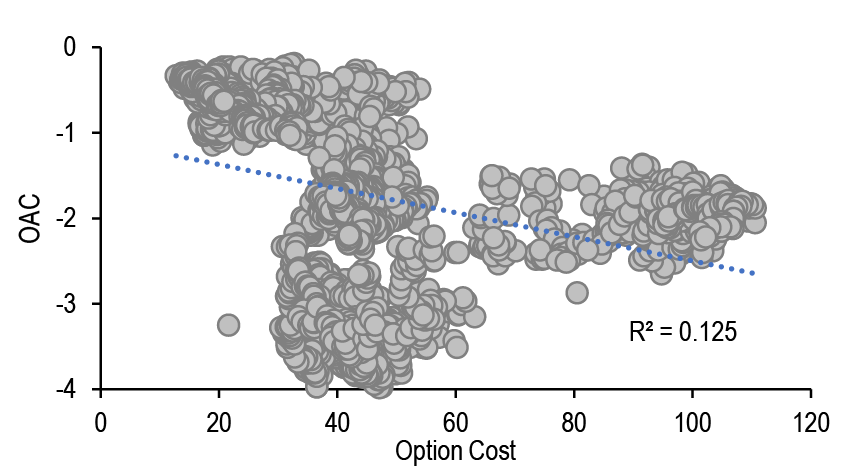
Source: J.P. Morgan
Figure 74: … but after adjusting for the level of OAD, the relationship is tighter
Rearranged regression of OAC vs OAD & option cost, 2010-now
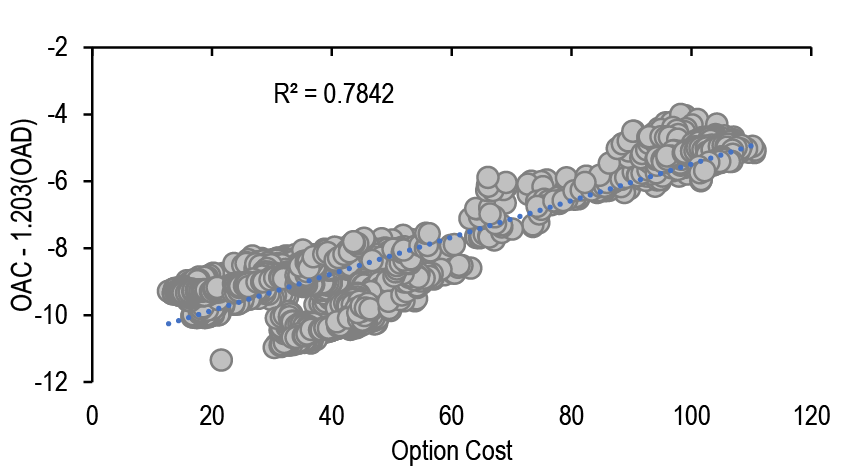
Source: J.P. Morgan
Hopefully this helps clear up some of these differences. As the curve resteepens, we should return to a more ‘normal’ relationship between the metrics. Until then, suffice it to say that there’s still plenty of exposure to prepayment risk in mortgages, but one’s choice of measurement of that risk is important when making the comparison to other market environments.
Public non-bank originator roundup: 2024Q2
With most public originators having reported for Q2, we review trends in the non-bank origination space this quarter, and how these trends have evolved from Q1 (see our discussion of Q1 non-bank earnings here).
Unlike the previous quarter, originator gain-on-sale margins were generally flat to slightly narrower in Q2 ( Figure 75). In earnings call transcripts, many originators are focusing on maintaining or increasing capacity in anticipation of a rally and a more robust origination market ( Figure 76).
Figure 75: Gain-on-sale margins were relatively unchanged in Q2 2024
Gain-on-sale margins reported by various originators. Note that the absolute levels are not perfectly comparable as some include MSR value and margin may be reported differently depending on channel, %
| 2019 | 2020 | 2021 | 2022 | 2023 | 2024 | |||||||||||||||||
| Q1 | Q2 | Q3 | Q4 | Q1 | Q2 | Q3 | Q4 | Q1 | Q2 | Q3 | Q4 | Q1 | Q2 | Q3 | Q4 | Q1 | Q2 | Q3 | Q4 | Q1 | Q2 | |
| Rocket | 2.6% | 3.2% | 3.3% | 3.2% | 3.3% | 5.2% | 4.5% | 4.4% | 3.7% | 2.8% | 3.1% | 2.8% | 3.0% | 2.9% | 2.7% | 2.2% | 2.4% | 2.7% | 2.8% | 2.7% | 3.1% | 3.0% |
| Flagstar (NYCB) | 0.7% | 0.9% | 1.2% | 1.2% | 0.8% | 2.2% | 2.3% | 1.9% | 1.8% | 1.4% | 1.5% | 1.0% | 0.6% | 0.4% | 0.7% | 0.6% | 0.8% | 0.6% | 0.6% | 0.3% | 0.5% | |
| UWM | 1.0% | 2.4% | 3.2% | 3.1% | 2.2% | 0.8% | 0.9% | 0.8% | 1.0% | 1.0% | 0.5% | 0.5% | 0.9% | 0.9% | 1.0% | 0.9% | 1.1% | 1.1% | ||||
| Loan Depot | 3.7% | 2.4% | 3.5% | 5.4% | 5.0% | 3.4% | 2.7% | 2.3% | 2.8% | 2.2% | 2.0% | 1.2% | 1.8% | 1.5% | 2.4% | 2.8% | 2.7% | 2.4% | 2.8% | 3.1% | ||
| Mr. Cooper | 2.2% | 2.3% | 4.6% | 3.1% | 2.6% | 2.4% | 2.1% | 2.1% | 2.1% | 2.7% | 2.4% | 2.6% | 2.0% | 2.3% | 2.1% | 2.1% | 2.0% | 2.5% | 2.0% | |||
| Pennymac | 1.0% | 1.2% | 1.2% | 1.6% | 3.1% | 2.4% | 2.2% | 1.8% | 1.5% | 1.7% | 1.1% | 1.0% | 1.0% | 1.0% | 0.6% | 0.5% | 0.6% | 0.6% | 0.6% | 0.7% | 0.6% | |
| Rithm | 1.4% | 1.6% | 2.0% | 2.9% | 1.3% | 1.4% | 1.3% | 1.3% | 1.7% | 1.5% | 2.0% | 1.7% | 1.8% | 1.6% | 1.3% | 1.3% | 1.2% | 1.3% | 1.1% | |||
| Guild | 4.2% | 5.6% | 5.6% | 4.4% | 4.6% | 4.1% | 4.0% | 3.5% | 4.0% | 3.6% | 3.5% | 3.3% | 3.4% | 3.1% | 3.8% | 3.4% | 3.6% | 3.3% | ||||
| P/SS | 110 | 112 | 124 | 114 | 134 | 166 | 164 | 141 | 127 | 121 | 121 | 114 | 110 | 120 | 122 | 119 | 123 | 127 | 122 | 125 | 121 | 118 |
Source: J.P. Morgan, company filings
Figure 76: Selected quotes from public originators’ 2024Q2 earnings presentations (capacity)
Gain-on-sale margins reported by various originators. Note that the absolute levels are not perfectly comparable as some include MSR value and margin may be reported differently depending on channel, %
| Capacity | |
| UWM | "We're still hiring, but we're not hiring extremely high numbers because we've got our team, we've got our technology, we've got our systems, and we feel really good about where we're at." |
| "With our upgraded workflow automation, our capital markets team can now complete MSR audits in half the time. This enhancement allows us to onboard MSR portfolios more quickly, efficiently and accurately, which is essential as we expand our portfolio" | |
| Mr. Cooper | "We have been adding staff we hired close to 100 LOs in the second quarter. So we're carrying a little bit of extra capacity now and we don't know exactly when it's going to happen, but when it does, we'll be ready." |
| Pennymac | "We have worked for the last three years to continue to become more and more efficient. And we did -- in our Consumer Direct channel, one of the main reasons we came out with our closed and second product was to keep capacity in place for our Consumer Direct channel if rates were to pivot down. Similarly, we've been very, very active in modeling out what we would need in certain interest rate environments while maintaining excess capacity ... but we don't take 30 to 60 days to seize on an opportunity." |
| "We have three large classes of LOs already in the queue. They're going to be up and trained and ready to go ... even if rates stay where they are, we believe there's value there given the high note rates servicing that we have and given the fact that you can't really start to refinance those loans until they're [six months seasoned]." | |
| "So we're already increasing the LO capacity. But I think even more importantly, our modeling and our ability to add capacity and fulfillment is ... very tried and true ... especially for correspondent, but also for Broker Direct and Consumer Direct, we can add or reduce capacity very, very quickly and very, very efficiently." | |
| "And so I think, I'm very confident that we're not going to be in the position we were back in 2020 where we got to bring on more physical capacity in terms of space and we've got to go out and try to hire 100 LOs tomorrow and -- we are ready to go and we've started that process." | |
| Rithm | "I'm probably less constructive on origination gains than others doing this for a long period of time. I do think if you got into a so-called COVID like scenario, you know, if you're going to play that and you think that the refi market will pick up, then it could become a capacity issue where you're able to drive more outside origination gains." |
| Loan Depot | "'[O]ver the last six months, we have been gradually increasing the number of LOs ... some through automation, some through staffing levels ... we're kind of leaning into the anticipation that the market will continue to rebound and rates will moderate ... so we believe that we have the capacity to pick up incremental volume" |
Source: J.P. Morgan, company earnings call transcripts
While UWM is still biased to shedding their MSR portfolio, servicers such as Rocket and Pennymac are focused on maintaining the size of their MSR portfolios and taking advantage of higher recapture rates into a rally ( Figure 77). Other servicers, such as Mr. Cooper and Rithm, are less focused on a potential origination market and are still primarily focused on growing their MSR portfolios; in fact, Mr. Cooper is so focused on growing their MSR portfolio that they are slated to acquire all of Flagstar’s MSR holdings in the fourth quarter.
Figure 77: Selected quotes from public originators’ 2024Q1 earnings presentations (MSR)
Gain-on-sale margins reported by various originators. Note that the absolute levels are not perfectly comparable as some include MSR value and margin may be reported differently depending on channel, %
| MSR | |
| UWM | "And so MSR write-downs will be massive, origination volumes and gain on sale will go up ... nobody controls the MSR write-ups and write-downs. We never take credit when it goes up. We don't want to take credit when it goes down. We want to focus on origination. And we're not that far away from those numbers." |
| "We're opportunistic with everything with selling MSRs. We're not really focused on it. We had a strategy coming in this year ... to de-risk ... sell MSRs in the first three to six months of the year and prepare for scale, technology, operationally. And it's playing out how we expected. And so I'm not saying we won't sell any more MSRs because people call us all the time to try to buy them." | |
| Rocket | "In the second quarter, we acquired five MSR portfolios, adding 67,000 new clients and approximately $21 billion in unpaid principal balance. The loans in these acquired MSRs have a blended, weighted average coupon higher than our current portfolio, opening up a range of products and services for these new clients." |
| "So it's no surprise that when [borrowers are] ready to buy their next home, lower their mortgage rate or tap into their home's equity, they come back to Rocket at a rate 3x higher than the industry average. Our servicing and origination businesses work together, creating a powerful cycle of attracting new clients, organically creating new MSRs and keeping them for their next mortgage. This cycle creates lifelong clients and multiplies future origination and profitability growth." | |
| "We're going to keep growing our servicing portfolio" | |
| Mr. Cooper | "We help Flagstar solve for their balance sheet goals by selling their MSR asset at a fair price to a credible partner in a single, quick, low-risk transaction. We also help Flagstar simplify its operations by taking on their existing subservicing business as well as providing servicing for some of their own loans." |
| "[In] our fourth quarter 2022 call, we highlighted a cycle-wide opportunity to acquire MSRs and suggested pools would trade at extremely attractive yields. If you go back and look at our slides or read the transcript, you'll see we pointed to financial pressure on originators and regulatory capital considerations for banks as the drivers of this dislocation ... we moved swiftly and decisively to capitalize on the opportunity and now you see the results ... we are the fundamental best buyers of MSRs." | |
| "Over the last two years, we found some of the best OAS yields on deep out-of-the-money collateral and you've heard us comment on the high-quality, stable cash flow those pools will provide us for years to come. But that's not all we've been buying. As you can see, today, 18% of the portfolio has coupons of 6% or higher. This is a big change from where we were in 2022 when only 3% of the portfolio is in that bucket. The MSR we're acquiring from Flagstar has a similar distribution of coupons. On a pro forma basis, we'll have $132 billion of mortgages with coupons above 6%, which again points to the opportunity to scale up originations in 2025." | |
| "[In] recent quarters, we retained a larger servicing strip from securitized pools above the 25 basis-point contractual minimum to optimize capital market execution." | |
| " ... our MSR delinquencies declined to 1.0%, which is a new record low. This is a function of thoughtful portfolio construction, which you can see in the rising FICO scores and declining LTV ratios for our customers as well as our ongoing loss mitigation efforts evident in a 34% year-over-year increase in loan modifications and workouts, which is a very important part of our mission to keep the dream of home ownership alive. The Flagstar MSR has a similar high-quality credit profile and will not materially affect these results." | |
| PennyMac | "[C]ould be better for us over the long term, continue to build up a higher proportion of mortgage loans in those higher note rates, especially in our Servicing portfolio where we are efficient at recapturing them. And then that provides greater benefit for us when rates eventually do decline ... So I think either way we're positioned to perform really well. I think probably the best overall outcome is if rates stay a bit higher for longer and we continue to accumulate, but we have sort of meaningful opportunity either way." |
| Rithm | "We added $56 billion in owned MSRs and $98 billion in third-party MSR servicing, growing our MSR portfolio 28% quarter-over-quarter and third-party servicing 92% quarter-over-quarter. We also completed the transition of all 800-plus thousand SLS loans onto our servicing platform, which we believe to be the first in the industry to move so many loans in such a short period of time, while still minimizing homeowner disruptions and maximizing cost and expense management." |
| "Yeah, I'm worried about MSRs. I'm more worried about how we hedge them in MSR marks. I don't think you're going to have a huge refinancing market right now. We're not seeing that. We're not seeing a lot of turnover in our portfolio. I think when you look at the housing market, home prices, you know, yesterday there was some more home price data that was released. Home prices are continued increase, although activity levels are down ... So I do think something needs to give, but I don't see a robust origination market." | |
| "But when you look and you think about some of the best in the business, whether they be at the wholesale side, whether it be at the correspondence side and we're pretty large players in the correspondence side. I think in general the market's going to remain extremely competitive on the origination side. And the main thing for us to do is to try to keep our customers and keep the cash flow from the MSR side." |
Source: J.P. Morgan, company earnings call transcripts
Even without the Flagstar portfolio, Mr. Cooper has acquired the most servicing of any servicer this year, with a significant portion actually coming from UWM ( Figure 78 & Figure 79).
Figure 78: UWM has still been selling a sizeable portion of its MSR holdings in Q2 …
2024 YTD cumulative transfers from the top 5 “transfer-from” servicers this year by factor date, $bn
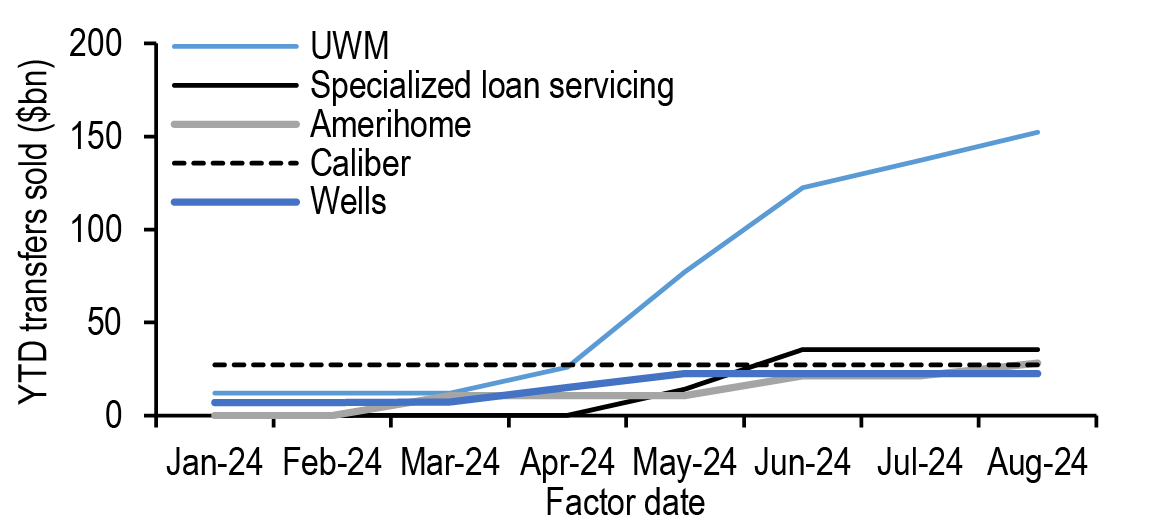
Source: J.P. Morgan, Fannie Mae, Freddie Mac, Ginnie Mae
Figure 79: … while Mr. Cooper and Lakeview have been growing their MSR portfolios
2024 YTD cumulative transfers to the top 5 “transfer-to” servicers this year by factor date, $bn
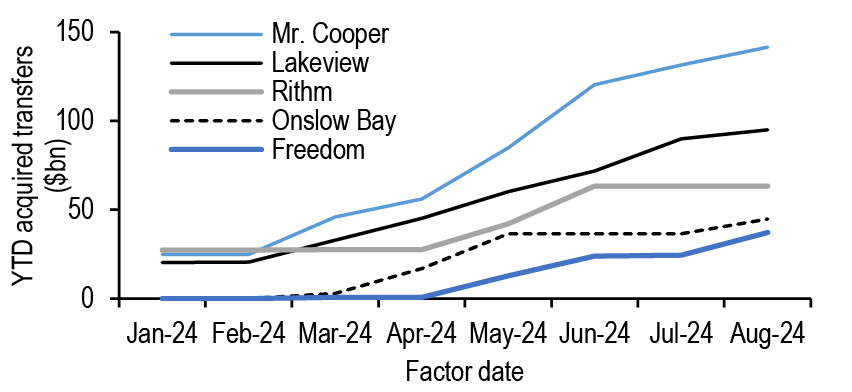
Source: J.P. Morgan, Fannie Mae, Freddie Mac, Ginnie Mae
Week in Review
- MBA Weekly Survey: For the week ending August 9, the purchase application index rose 1.69% w/w and was 7.6% lower than year ago levels, while the refinance index rose 34.5% w/w and was 55.3% higher than the 3-month trailing level (daycount-adjusted, not seasonally-adjusted) ( Figure 63 & Figure 64).
- Freddie Enhanced Primary Survey: For the week prior to August 15, 2024, 30-year conventional conforming fixed-rate mortgages averaged 6.49%, up 2bp from the previous week ( Figure 65)
- Primary dealer specified pool positions rose to $437.8bn (+$4.8bn w/w) as-of close trading July 31. Including TBA positions of -$378.0bn, dealers were long $59.8bn (-$0.3bn w/w) pass-throughs. Other agency MBS holdings fell $0.6bn to $30.4bn.
- Fixed-rate agency gross and net issuances were $95.9bn and $19.0bn, respectively, in July. August gross supply currently stands at $67.8bn ( Figure 66).
- ICI Total Bond Long-term Mutual Fund and ETF Weekly Flows: Inflows were +$5.0bn for the week of August 7, and +$49.4bn for the month leading up to August 7 ( Figure 67).
- Our OAS optimized portfolio favors FNCL 1.5s & 5.5s, FNCI 1.5-3s, and G2 2s & 5.5-6.5s, while reducing exposure to FNCL 2-3s & 4-5s & 6.5s, and G2 2.5-3.5s & 4.5-5s. Our optimized portfolio achieves an OAS of 36 with an OAD of 5.00 versus the index’s OAS of 33 with OAD of 5.05. Cohort weights are limited to 40% redistributions in our optimized portfolio, while duration cannot change by more than 1 year and convexity can be no worse than the index ( Figure 68 & Figure 69).
Figure 80: MBA Purchase Index, calendar year overlay with daycount adjustments
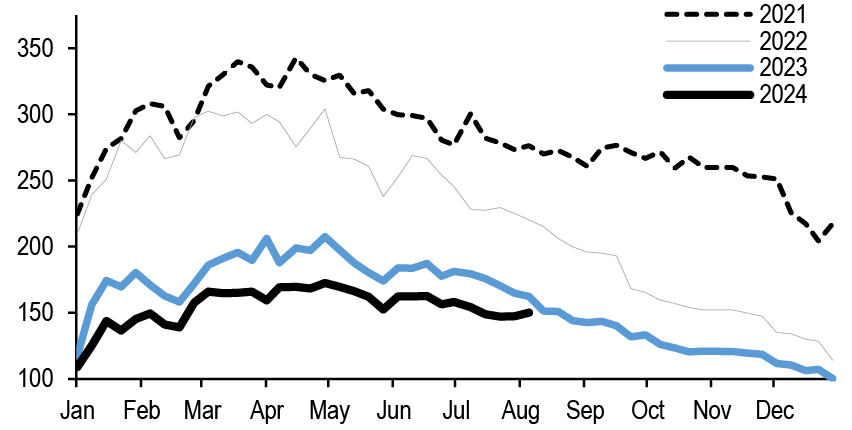
Source: J.P. Morgan, MBA
Figure 81: MBA Refi Indices, seasonally adjusted
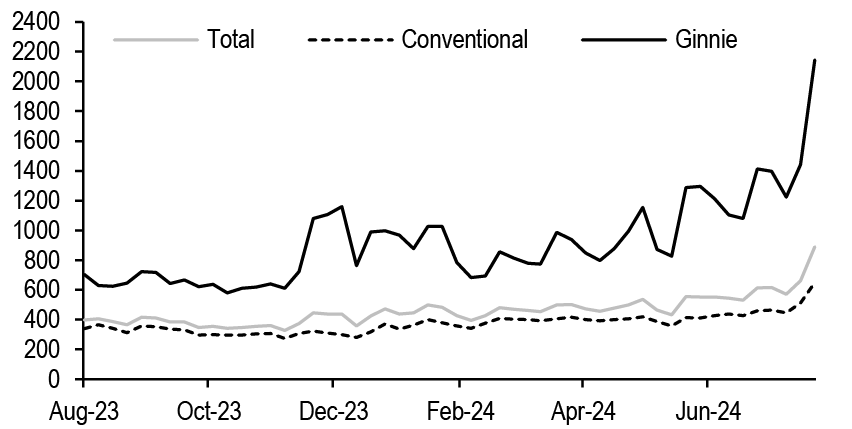
Source: J.P. Morgan, MBA
Figure 82: Primary mortgage rates, %
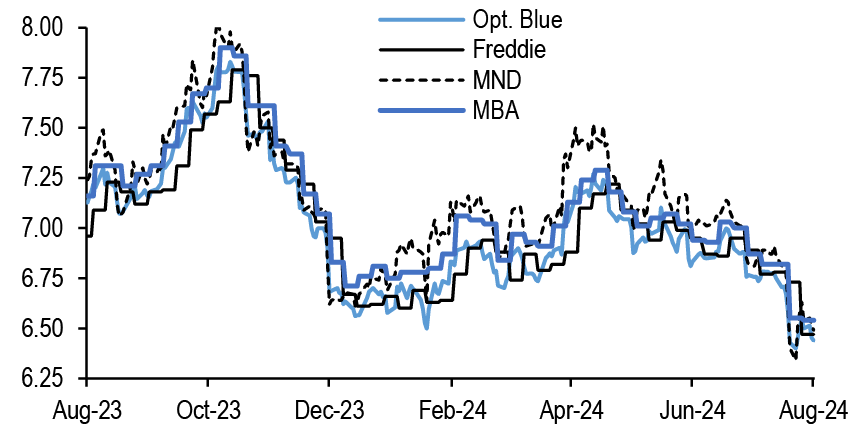
Source: J.P. Morgan, Optimal Blue, Freddie Mac, Mortgage News Daily, MBA
Figure 83: Gross and net fixed-rate MBS monthly issuance, $bn
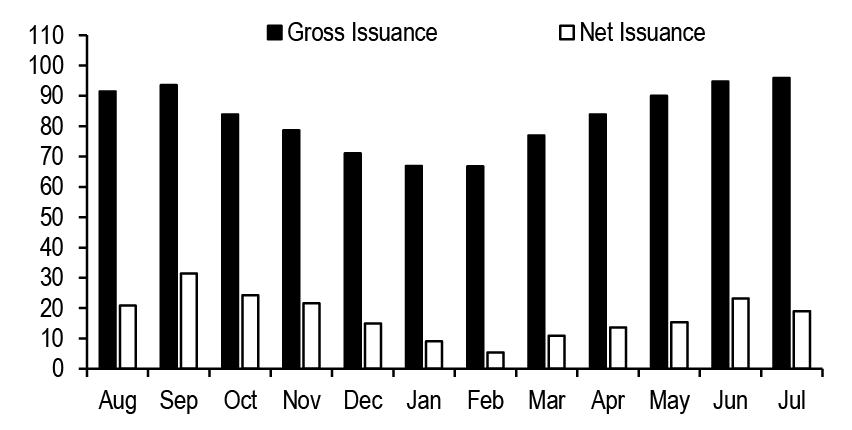
Source: J.P. Morgan
Figure 84: ICI Total Bond Long-term Mutual Fund and ETF Weekly Flows, $bn
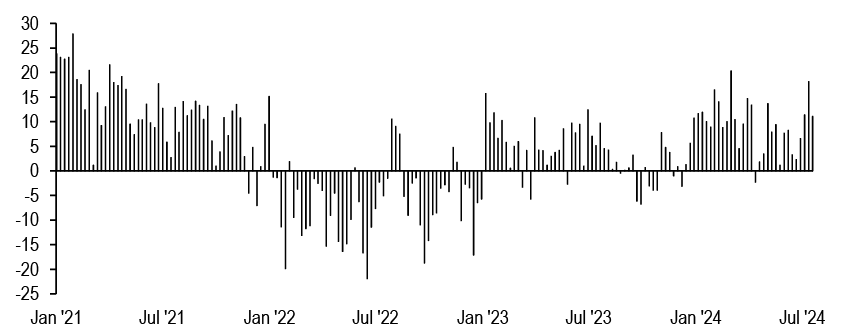
Source: J.P. Morgan, ICI
RMBS Credit Commentary
Rising CES prepayment speeds
- Our rates strategists expect the 10yr to be 3.5% by 24Q4. Along with declines in the 2yr (3.2% 24Q4) and 5yr (3.1% 24Q4) rates, mortgage rates could be at, or marginally below, 6% by the end of the year
- If realized, this will improve affordability and potentially thaw a frozen housing market. However, we do not think this becomes a massive driver of higher home prices as supply and demand potentially rise commensurately
- Our home price forecast for the remainder of the year is benign, only expecting another 1.5% of growth over the next 6 months
- Closed-end second (CES) lien prepayment speeds have been picking up. Speeds have increased in seasoned 2023 vintage deals from low to high 10c
- The recent pickup in CES speeds is likely due to borrowers either paying off the loan in cash or refinancing just the second lien
- The CES loan balance is small but paying off the loan in cash is likely still challenging for a typical GSE borrower. Additionally, partial curtailment rates in CES loans are low at less than 2c
- Borrowers refinancing just the second lien makes more sense as CES rates have come down since last year. In 2023, CES loans were originated at 10-11% note rates. CES rates are closer to mid-9% this year
- Rates are lower due to significantly better private label execution. Loan bids continue to stay competitive as pools trade at steep premiums. However, given recent higher prepayment prints, market expectations of CES speeds will have to recalibrate
Figure 85: RMBS credit issuance to date...

Source: J.P. Morgan, Bloomberg Finance L.P.
Figure 86: ...and spreads
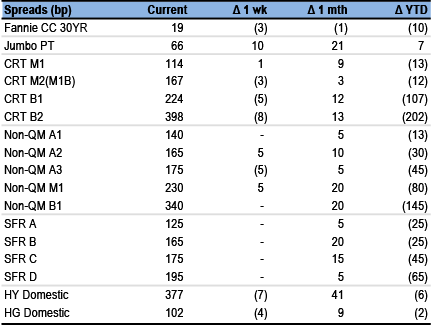
Source: J.P. Morgan
Note: Includes our on-the-run indices. Jumbo is TOAS, non-QM and SFR are spread to treasuries. CRT is SOFR DM@10CPR. HG/HY are spread to treasuries.
Market Commentary - Are we there yet? Long anticipated FED cuts are pending...
The latest CPI print gave the market what it wanted, albeit some may have expected an even softer number. Regardless, our economists continue to believe that we will see a 50bp Fed cut in September. However, the market is assigning a lower probability to that happening. For example, on August 8th, the market was pricing in a 45bp cut versus a 32bp cut as of August 15th. As the short end of the curve declines, clearly short, floating rate financing and leverage benefit. However, what about mortgage rates? Currently, our rates strategists expect the 10yr to be 3.5% by 24Q4. Along with declines in the 2yr (3.2% 24Q4) and 5yr (3.1% 24Q4), this would mean mortgage rates could be at, or marginally below, 6% by the end of 2024. If realized, this will improve affordability and potentially thaw a frozen housing market. However, we do not think this becomes a massive driver of higher home prices as waiting sellers will be met with eager buyers. In other words, supply and demand potentially rise commensurately. Our home price forecast for the remainder of the year is benign, as we only expect another 1.5% of growth over the next 6 months (year-to-date HPI is +4%).
What does this all mean for relative value in the non-agency space? At the top of the capital structure, higher coupons (5.5-6.5s) do not look like they will have a ton of refinancing pressures for the rest of the year. Spreads should hold pretty firm. Lower coupons should benefit from even a modest pick-up in turnover. In credit, home prices remain supportive, but spreads are very tight. We look for more sideways moves in the second half. Any VIX-spike-induced widening in broader credit should be viewed as an opportunity in mortgage credit.
CES speeds pick up
Closed-end second (CES) lien prepayment speeds have been picking up. Speeds have increased in seasoned 2023 vintage deals from low to high 10c ( Figure 87). Some deals paid even faster. For example, the first two Rocket deals issued in 2023 paid 31c and 22c in June, respectively. Speeds saw a decline in July but were still faster compared to a couple of months ago. Since Freddie’s announcement earlier this year, prepayment speeds of CES loans have been a topic du jour, particularly as loan pools continue to trade at steep premiums.
Figure 87: Closed-end second (CES) lien prepayment speeds have been picking up
1m CPR for CES securitizations

Source: J.P. Morgan, CoreLogic
Rocket and Spring EQ are the two largest originators of securitized CES loans ( Figure 88). Rocket has securitized $3.8bn, while Spring EQ has done $1.4bn of loans. Rocket has its own private-label shelf (RCKT), but its loans have also appeared across other issuers. Spring EQ loans have been primarily securitized by Saluda Grade, but the originator was acquired by Cerberus at the end of 2023. Spring EQ tends to have lower FICO, higher CLTV, and marginally higher loan balance compared to the Rocket production ( Figure 89). Recent Rocket transactions also have a higher share of QM loans. The share of QM loans has been increasing in securitizations. As a reminder, CES loans are QM if the rate is within APOR + 3.5% for $78k-plus loans and within APOR + 6.5% for loans less than $78k. Freddie will purchase only QM CES loans.
Figure 88: Rocket and Spring EQ are the two largest originators of securitized CES loans
Original balance ($bn) of CES loans in securitizations by originator and loan vintage
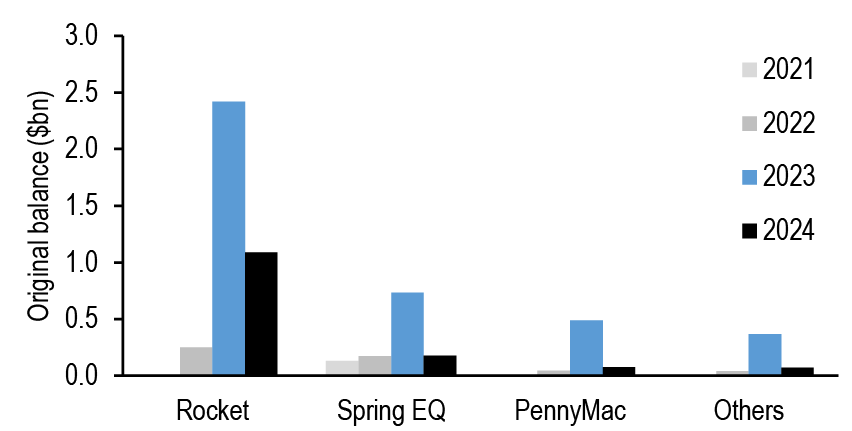
Source: J.P. Morgan, CoreLogic
Figure 89: Spring EQ tends to have lower FICO, higher CLTV, and marginally higher loan balance compared to the Rocket production
Characteristics of CES loans in securitizations by originator

Source: J.P. Morgan, CoreLogic
Prepayment speeds have been increasing across all CES originators. Figure 90 and Figure 91show prepayment speeds for 2022 and 2023 vintage securitized CES loans broken out by the originator. In the 2022 vintage, Rocket speeds picked up versus Spring EQ over the last two months. The pickup in the 2022 vintage drove faster speeds in a couple of RCKT deals issued in early 2023. In the 2023 vintage, Rocket was faster in June, but it converged to other originators in July.
Figure 90: In the 2022 vintage, Rocket speeds picked up versus Spring EQ over the last two months
1m CPR for 2022vintage CES loans broken out by originator
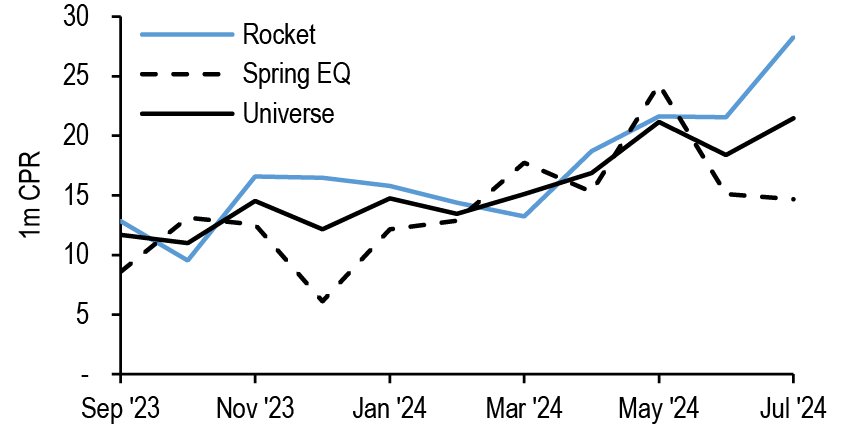
Source: J.P. Morgan, CoreLogic
Figure 91: In the 2023 vintage, Rocket was faster in June but it converged to other originators in July
1m CPR for 2023vintage CES loans broken out by originator
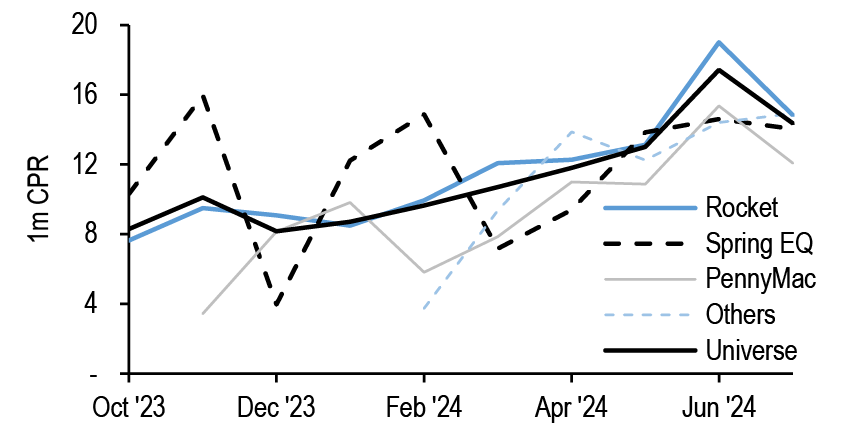
Source: J.P. Morgan, CoreLogic
We think that most of the recent pickup in CES speeds is driven by originators refinancing just CES loans, and it is unlikely that borrowers are consolidating into a cash-out loan. CES speeds have been in the mid to high teens. Meanwhile, first lien borrowers who got a second lien in 2023 have been prepaying in the mid-single digits ( Figure 92). Prepayments for first lien loans with a second lien have been driven by turnover rates. Compare this to first lien borrowers who got a second lien in 2019. Most of the peak speeds in 2021 were due to borrowers refinancing both liens into a cash-out loan. This, along with the absolute level of prepays, shows that borrowers today are not consolidating two liens into a cash-out loan.
Figure 92: First lien borrowers who got a second lien in 2023 have been prepaying in the mid-single digits
1m CPR broken into turnover, cash-out and rate/term refi components for first lien GSE loans with a second lien originated in 2023
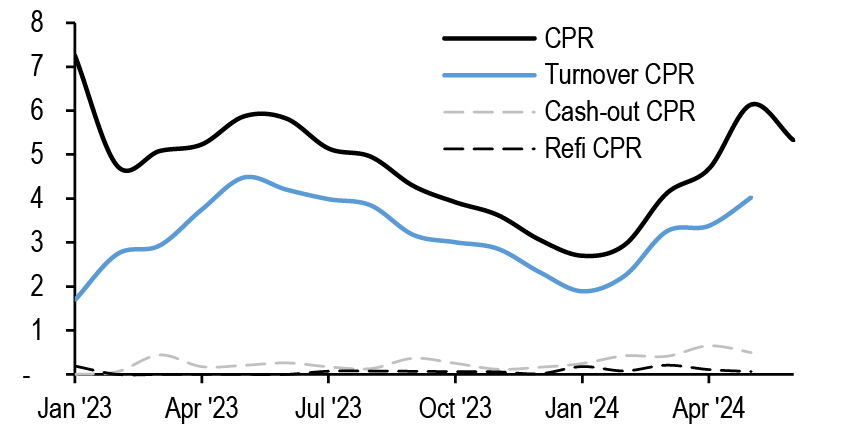
Source: J.P. Morgan, Black Knight
Figure 93: Compare this to first lien borrowers who got a second lien in 2019. Most of peak speeds in 2021 were due to borrowers refinancing both liens into a cash-out loan
1m CPR broken into turnover, cash-out and rate/term refi components for first lien GSE loans with a second lien originated in 2019
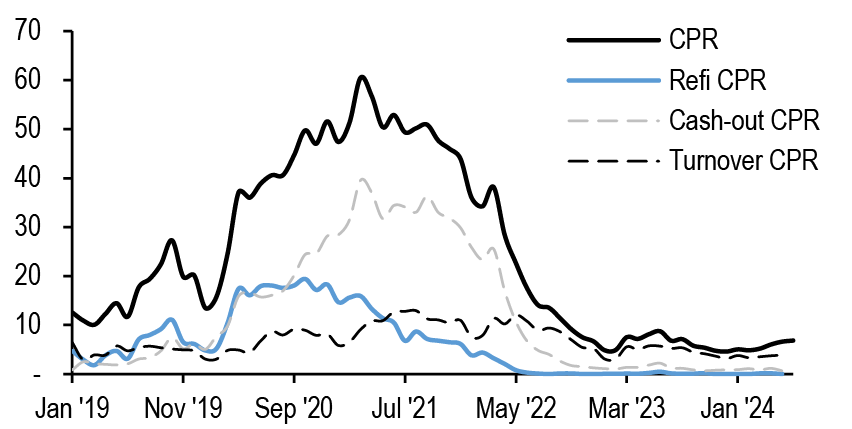
Source: J.P. Morgan, Black Knight
Hence, the recent pickup in CES speeds is due to borrowers either paying off the loan in cash or refinancing just the second lien. It is difficult to come up with an argument for the former. The CES loan balance is small, but paying off the loan in cash is likely still challenging for a typical GSE borrower. Additionally, partial curtailment rates in CES loans are low at less than 2c ( Figure 94). Higher curtailment rates would have been an indicator of borrowers’ financial strength.
Borrowers refinancing just the second lien makes more sense as CES rates have come down since last year. In 2023, CES loans were originated at 10-11% note rates. CES rates are closer to mid-9% this year; although, there still remains a noticeable spread among different originators. Rates are lower due to significantly better private label execution. Loan bids continue to stay competitive as pools trade at steep premiums. However, given recent higher prepayment prints, market expectations of CES speeds will have to recalibrate. Historical data, of course, is limited as we rely on only the past 2 years of performance. Furthermore, consolidating both liens is unlikely to be economical anytime soon, even with the first Fed cut expected in a month’s time. However, as Freddie enters the CES market and more originators offer the product, CES rates will decline, leading to faster prints for the early borrowers of second liens ( Figure 95).
Figure 94: Partial curtailment rates in CES loans are low at less than 2c
1m CPR and CCR for 2023 vintage CES loans in securitizations
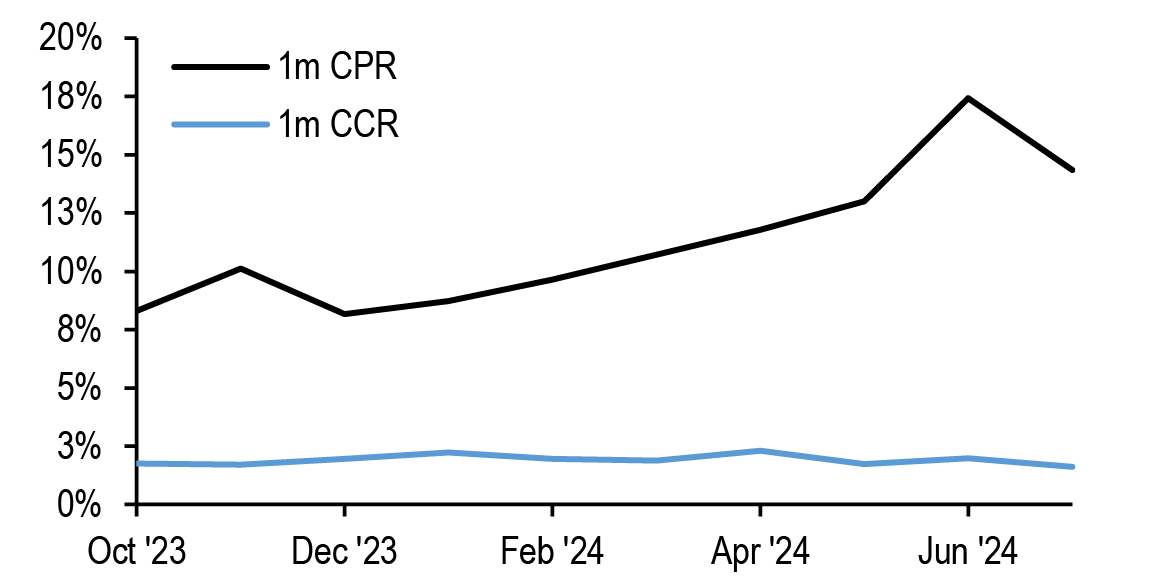
Source: J.P. Morgan, CoreLogic
Figure 95: As Freddie enters the CES market and more originators offer the product, CES rates will likely decline, leading to faster prints for the early borrowers of second liens
S-curves for 6-24 WALA CES loans in Black Knight’s home equity database broken out by the observation year

Source: J.P. Morgan, Black Knight
CMBS Weekly
Higher office delinquencies in July and more CRE CLO mods and buyouts
- CMBS spread movements were mixed over the past week but, over the past two weeks, on-the-run conduit CMBS spreads widened by 4-11bp across the stack, with AS bonds underperforming both within the stack and relative to similar-duration single-A corporates
- Our outlook on the economy remains one of slowing growth that avoids a recession. In light of this view, we believe that upper IG mezz bonds have sold off too much and now appear cheap compared to similar duration single-A corporates
- Agency CMBS spreads have also widened over the past two weeks. Relative to current coupon mortgage OAS and ZVs, 5-year benchmark Agency CMBS is leaning cheap
- The refi success rate for conduit CMBS loans scheduled to mature in 2024 (excluding defeased loans) was 64% through the July remit period. This is aligned with our view coming into the year where we projected that the refi success rate for 2024 would be biased towards the higher end of the 50%-66% range
- During the July 2024 remit period, the serious delinquency rate (60d+ including NP matured and FC/REO) for private label CMBS reached 4.74%, representing a 20bp increase from the prior month. Office loans were the marginal driver of the increase in the private label CMBS serious delinquency rate. In July, the serious delinquency rate for office loans increased by 100bp to 7.6%
- We have continued to see elevated levels of DLQ buyouts and loan modifications in the CRE CLO market through the first seven months of the year. At the current pace, the total volume of DLQ buyouts in 2024 will far surpass levels seen in 2023. CRE CLO loan modifications have already exceeded the total for 2023
- In July, we estimate that there were about $527mn in reinvestments throughout the entire CRE CLO market, representing the highest volume since October 2023. This increase was driven by two Arbor deals
Figure 96: CMBS spread summary
| This Week | Change | |||
| 1w | 1m | YTD | ||
| Conduit New Issue (UST) | ||||
| 5yr Super-Senior LCF AAA | 114 | 1 | N/A | N/A |
| 10yr Super-Senior LCF AAA | 103 | 0 | 3 | -22 |
| 10yr AS | 164 | 1 | 22 | -31 |
| 10yr AA | 193 | -3 | 23 | -40 |
| 10yr A | 241 | -7 | 30 | -124 |
| Pre-COVID BBB- | 607 | -11 | 20 | -236 |
| 10yr BBB- | 623 | -11 | 23 | -255 |
| 10yr XA | 138 | -3 | 4 | -87 |
| Agency CMBS (UST) | ||||
| Freddie K A1 (10yr) | 52 | -2 | 4 | -6 |
| Freddie K A2 (10yr) | 53 | -1 | 2 | -7 |
| Freddie K Floater (10yr) | 63 | 0 | 5 | -7 |
| Freddie K X1 | 140 | 0 | 0 | -40 |
| Freddie K X3 | 350 | 0 | 0 | -75 |
| FRESB A5H | 120 | 0 | 5 | -5 |
| FRESB A10F | 83 | 0 | 2 | -12 |
| FNA DUS 10/9.5 TBA | 57 | -1 | 3 | -10 |
| FNA DUS SARM | 65 | 0 | 2 | -8 |
| GNR Project Loan (3.5yr) | 130 | 0 | -5 | -25 |
Source: J.P. Morgan
Figure 97: Summary of CMBS issuance and dealer holdings
| YTD Issuance ($bn) | 2024 | 2023 | % Diff. |
| Conduit | 26.3 | 12.5 | 111% |
| SASB | 43.1 | 9.6 | 351% |
| CRE CLO | 4.9 | 3.6 | 35% |
| Other | 0.3 | 1.0 | -73% |
| Total Private Label | 74.5 | 26.6 | 181% |
| Freddie K | 17.7 | 19.1 | -7% |
| Freddie Multi PC | 9.0 | 9.3 | -4% |
| FRESB | 0.8 | 1.1 | -32% |
| Fannie MBS | 24.1 | 31.2 | -23% |
| GNR PL | 5.9 | 6.0 | -3% |
| Freddie Other | 2.2 | 0.8 | 173% |
| Agency CMBS | 59.7 | 67.6 | -12% |
| Total CMBS | 134.2 | 94.2 | 43% |
| YTD Issuance ($bn) | 2024 | 2023 | % Diff. |
| Private Label Fixed | 37.1 | 19.4 | 91% |
| Private Label Floating | 37.4 | 8.1 | 362% |
| Agency Fixed | 56.0 | 60.7 | -8% |
| Agency Floating | 3.9 | 9.3 | -58% |
| Dealer Holdings ($bn) | 8/7/24 | 7/31/24 | 7/10/24 |
| Private Label | 5.33 | 5.62 | 6.22 |
| Agency CMBS | 13.83 | 13.52 | 14.06 |
Source: J.P. Morgan, Commercial Mortgage Alert, Federal Reserve Bank of New York, Fannie DUS Disclose
Note: Dealer holdings reported with a 1-week lag
Weekly market snapshot
Market commentary - after a modest selloff, some better relative value emerges in CMBS
CMBS spread movements were mixed over the past week but, over the past two weeks, on-the-run conduit CMBS spreads widened by 4-11 basis points across the stack, with AS bonds underperforming both within the stack and relative to similar-duration single-A corporates ( Figure 98). Our outlook on the economy remains one of slowing growth that avoids a recession. In light of this view, we believe that upper IG mezz bonds have sold off too much and now appear cheap compared to similar duration single-A corporates ( Figure 99).
Figure 98: CMBS spread movements were mixed over the past week but are modestly wider over the past two weeks
Spreads to Treasuries (bp)
| 8/14/2024 | w/w chg. | 2w chg. | |
| 5yr Conduit CMBS LCF AAA | 115 | 0 | 4 |
| 10yr Conduit CMBS LCF AAA | 105 | 0 | 4 |
| 10yr Conduit CMBS AS | 169 | 4 | 11 |
| 10yr Conduit CMBS AA | 197 | -2 | 9 |
| 10yr Conduit CMBS A | 245 | -7 | 7 |
| 10yr Conduit CMBS BBB- | 628 | -11 | 5 |
| 7-10yr Single-A Corporates (JULI ex-EM) | 105 | -6 | 4 |
| 7-10yr REIT Single-A | 107 | -2 | 5 |
| 7-10yr REIT BBB | 146 | -3 | 3 |
| High Yield BB Corporates | 239 | -4 | 16 |
| High Yield Single-B Corporates | 393 | -7 | 34 |
| High Yield CCC Corporates | 880 | -14 | 46 |
| HY CRE REITs | 422 | -1 | 32 |
| 10yr Freddie K A2 | 53 | -1 | 3 |
| 10/9.5 Fannie DUS | 57 | -1 | 4 |
| FRESB A10F (5CPR) | 83 | 0 | 2 |
| 7-10yr AA Corporates (JULI ex-EM) | 70 | -6 | 2 |
| FN 30yr 2% Tsy OAS | 22 | 0 | -2 |
| 5yr Freddie K A2 | 50 | 0 | 5 |
| 5/4.5 Fannie DUS | 56 | -1 | 4 |
| FN 30yr 5% Tsy OAS | 19 | -2 | 2 |
| FN 30yr 5% Tsy ZV | 113 | 7 | 14 |
Source: J.P. Morgan
Figure 99: Conduit AS bonds look attractive to similar duration single-A corporates
10yr conduit CMBS AS spreads (actual) versus modeled spread and difference between actual and modeled spreads (residual), bp
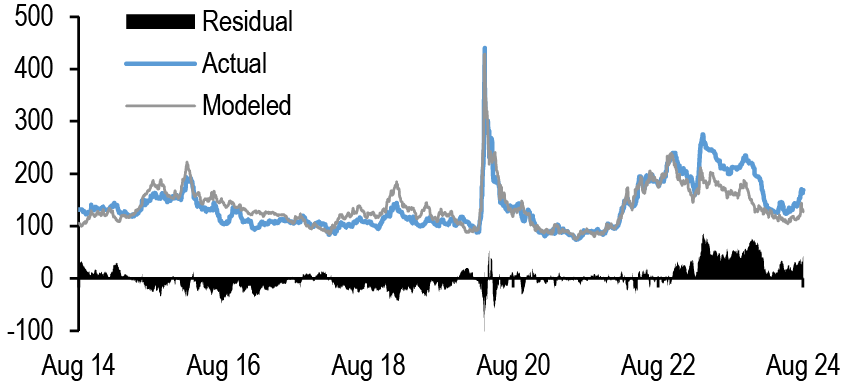
Source: J.P. MorganNote: Modeled spreads linearly regresses 10yr conduit CMBS AS spreads against 7-10yr single-A corporate spreads over the last 10 years. R2 = 73.5%, SE = 23bp.
Agency CMBS spreads have also widened over the past two weeks. Two weeks ago, we highlighted that Fannie DUS 5/4.5s appeared cheap compared to 30-year FN 5s OAS. However, this comparison may not be entirely fair, as some mortgage relative value investors might also consider ZVs when evaluating the relative value of mortgages to Agency CMBS ( Figure 100). To address this, we can perform a simple two-variable linear regression of Agency CMBS against mortgage OAS and ZVs. This regression indicates that 5-year benchmark Agency CMBS is leaning cheap ( Figure 101).
Figure 100: Mortgage relative value investors may consider ZVs as well when considering Agency CMBS
Spreads to Treasuries (bp)
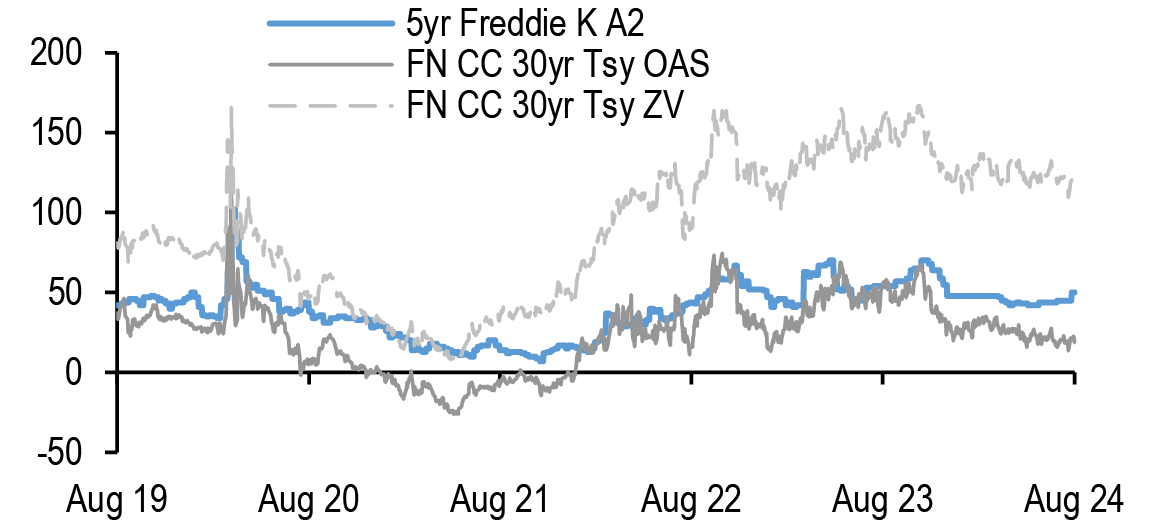
Source: J.P. Morgan
Figure 101: A two-variable regression comparing Agency CMBS to current coupon mortgage OAS and ZVs indicate Agency CMBS is leaning cheap
5yr Freddie K A2 (actual) versus modeled spread and difference between actual and modeled spreads (residual), bp
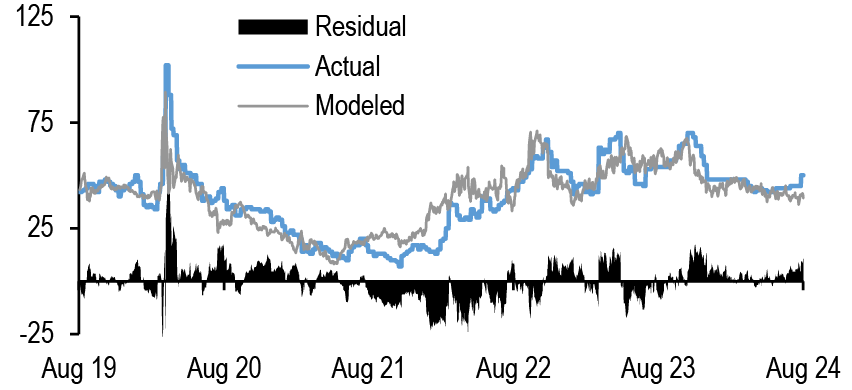
Source: J.P. MorganNote: Modeled spreads linearly regresses 5yr Freddie K A2 spreads against current coupon FNMA 30yr Treasury OAS and current coupon FNMA 30yr Treasury ZV spreads over the last 5 years. R2 = 72.4%, SE = 8.7bp.
Ratings Tracker
Figure 102: Summary of deals with ratings action
Summary of CMBS deals with ratings actions (upgrades and downgrades), August 2, 2024 to August 15, 2024
| Deal Name | Deal Type | CMBX | Upgrade (+) / Downgrade (-) | # of Bonds w/ Ratings Changes | Senior Most Bond w/ Ratings Changes | Notches | Rating Agency |
| BANK 2019-BN18 | Conduit | 13 | - | 2 | B- | 2 | Fitch |
| BANK 2019-BN19 | Conduit | 13 | - | 8 | AAA | 1-5 | Fitch |
| BBCMS 2017-C1 | Conduit | N/A | - | 6 | BB | 2-3 | DBRS Morningstar |
| BBCMS 2019-C4 | Conduit | 13 | - | 6 | BBB- | 2 | KBRA |
| BBUBS 2012-TFT | Other | N/A | - | 4 | AAA | 1-5 | KBRA |
| BMARK 2020-B18 | Conduit | N/A | - | 3 | BB- | 2-3 | Fitch |
| BMARK 2020-B19 | Conduit | N/A | - | 4 | BB- | 2-5 | Fitch |
| BSREP 2021-DC | SASB | N/A | - | 5 | A | 1-2 | KBRA |
| BX 2020-VKNG | SASB | N/A | + | 2 | AA | 1-2 | Fitch |
| CGCMT 2013-GC17 | Conduit | 7 | - | 3 | BBB- | 6-8 | KBRA |
| CGCMT 2014-GC25 | Conduit | 8 | - | 8 | A- | 2-8 | KBRA |
| CGCMT 2015-GC27 | Conduit | N/A | - | 3 | B | 3-6 | DBRS Morningstar |
| CGCMT 2016-P5 | Conduit | 10 | - | 4 | A | 1-2 | KBRA |
| COMM 2013-CR13 | Conduit | 7 | - | 4 | A- | 3-5 | KBRA |
| COMM 2014-CR15 | Conduit | N/A | - | 7 | A2 | 1-4 | Moody's |
| COMM 2015-CR22 | Conduit | N/A | - | 6 | BBB- | 2-3 | KBRA |
| COMM 2019-521F | SASB | N/A | - | 5 | A+ | 1-5 | S&P |
| CSMC 2021-ADV | SASB | N/A | - | 6 | AAA | 2-6 | KBRA |
| GCT 2021-GCT | SASB | N/A | - | 3 | Caa3 | 2-5 | Moody's |
| GFCM 2003-1 | Conduit | N/A | - | 1 | B3 | 2 | Moody's |
| GSMS 2015-GS1 | Conduit | 9 | - | 7 | AA- | 2-6 | KBRA |
| GSMS 2018-RIRI | SASB | N/A | - | 4 | BB+ | 7-8 | S&P |
| GSMS 2018-RIVR | SASB | N/A | - | 4 | BB+ | 7-8 | S&P |
| GSMS 2019-GC40 | Conduit | N/A | - | 9 | AAL | 1-9 | DBRS Morningstar |
| HMH 2017-NSS | SASB | N/A | - | 4 | A | 1-8 | S&P |
| JPMBB 2014-C24 | Conduit | 8 | - | 5 | BB- | 3-6 | KBRA |
| JPMCC 2012-C6 | Conduit | 6 | - | 4 | Caa2 | 1-5 | Moody's |
| JPMCC 2016-JP3 | Conduit | N/A | - | 7 | Aa2 | 2-3 | Moody's |
| JPMCC 2017-JP7 | Conduit | N/A | - | 6 | Aa3 | 1-4 | Moody's |
| JPMCC 2020-LOOP | SASB | N/A | - | 6 | A2 | 1-3 | Moody's |
| MSBAM 2013-C9 | Conduit | N/A | - | 2 | Ba2 | 1-2 | Moody's |
| MSBAM 2016-C28 | Conduit | N/A | - | 4 | Aa1 | 1-3 | Moody's |
| MSBAM 2016-C29 | Conduit | N/A | - | 7 | BBB | 4-6 | DBRS Morningstar |
| MSC 2015-MS1 | Conduit | N/A | - | 3 | BBB- | 2 | KBRA |
| NCMS 2019-NEMA | SASB | N/A | - | 5 | Aa2 | 3-4 | Moody's |
| WFCM 2013-LC12 | Conduit | 7 | - | 1 | B3 | 1 | Moody's |
| WFCM 2015-C30 | Conduit | 9 | - | 1 | BBB- | 2 | Fitch |
| WFCM 2015-NXS2 | Conduit | 9 | - | 8 | AA- | 3-11 | KBRA |
| WFCM 2015-NXS4 | Conduit | N/A | - | 7 | BBB | 3-6 | KBRA |
| WFCM 2015-SG1 | Conduit | 9 | - | 1 | BB- | 3 | Fitch |
| WFCM 2016-BNK1 | Conduit | 10 | - | 7 | A- | 3-6 | KBRA |
| WFCM 2017-C39 | Conduit | N/A | - | 5 | A | 1-6 | KBRA |
| WFRBS 2012-C10 | Conduit | 6 | - | 1 | Ba2 | 1 | Moody's |
| WFRBS 2014-C20 | Conduit | N/A | - | 2 | A- | 5-6 | KBRA |
| WFRBS 2014-C22 | Conduit | 8 | - | 7 | A2 | 2-8 | Moody's |
Source: J.P. Morgan, Bloomberg Finance L.P.
Figure 103: CMBS ratings downgrades to upgrades ratio since March 2021
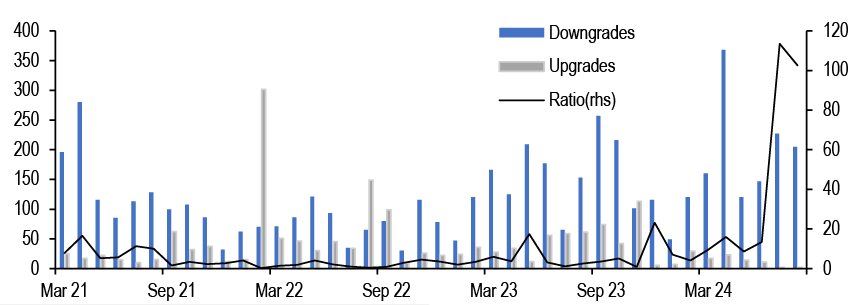
Source: J.P. Morgan, Bloomberg Finance L.P.
Primary Markets
Figure 104: Summary of recently priced deals
Summary of CMBS deals that have priced between August 2, 2024 to August 15, 2024
| Deal Name | Pricing Date | Deal Type | Deal Size ($mn) | Pricing Spread |
| BRSP 2024-FL2 | 8/2/2024 | CRE CLO | $675 | A: TSOFR+205 AS: TSOFR+245 B: TSOFR+300 C: TSOFR+360 D: TSOFR+490 E: TSOFR+660 |
| AG 2024-NLP | 8/6/2024 | Floating-rate SASB | $508 | A: TSOFR+227 B: TSOFR+301 C: TSOFR+406 |
| FS 2024-HULA | 8/6/2024 | Floating-rate SASB | $400 | A: TSOFR+187 B: TSOFR+215 C: TSOFR+250 D: TSOFR+300 E: TSOFR+350 |
| FREMF 2024-K526 | 8/7/2024 | Freddie K | $765 | A1: TSOFR+60 A2: J+51 |
| BOCA 2024-BOCA | 8/7/2024 | Floating-rate SASB | $1,000 | A: TSOFR+198 B: TSOFR+240 C: TSOFR+290 D: TSOFR+370 E: TSOFR+450 |
| BAMLL 2024-BHP | 8/8/2024 | Floating-rate SASB | $387 | A: TSOFR+235 B: TSOFR+290 C: TSOFR+360 D: TSOFR+450 |
| FMMV M071 | 8/8/2024 | Freddie Tax-Exempt | $198 | A: TSOFR+30 |
| BBCMS 2024-C28 | 8/8/2024 | Conduit CMBS | $805 | A1: J+95 A3: J+151 A4: J+104 A5: J+106 AS: J+150 B: J+195 C: J+235 |
| LOEWS 2024-MIA | 8/13/2024 | Floating-rate SASB | $1,000 | A: J+150 B: J+200 C: J+250 |
| BMARK 2024-V9 | 8/14/2024 | Conduit CMBS | $892 | A1: J+97 A3: J+123 AS: J+170 B: J+210 C: J+280 D: J+425 |
| HYT 2024-RGCY | 8/15/2024 | Floating-rate SASB | $620 | A: TSOFR+190 B: TSOFR+240 C: TSOFR+290 D: TSOFR+350 |
Source: J.P. Morgan, Bloomberg Finance L.P.
July 2024 remit review - office loans continue to push delinquencies higher
Refi success rates
The refi success rate for conduit CMBS loans scheduled to mature in 2024 (excluding defeased loans) was 64% through the July remit period ( Figure 105). This is aligned with our view coming into the year where we projected that the refi success rate for 2024 would be biased towards the higher end of the 50%-66% range. The refi success rate for conduit CMBS has been trending upwards in recent months. The low refi success rate is primarily due to office loans, with conduit office loans at a 34% refi success rate ( Figure 106). Similarly, the SASB and CRE CLO sectors also show historically low refi success rates for loans maturing this year, although this is largely due to high levels of extensions.
Figure 105: The refi success rate for conduit CMBS loans scheduled to mature in 2024 is 64% in July
Refinance success rates by CMBS product type by original maturity year and monthly breakout of refi success rates for 2024. as of July 2024
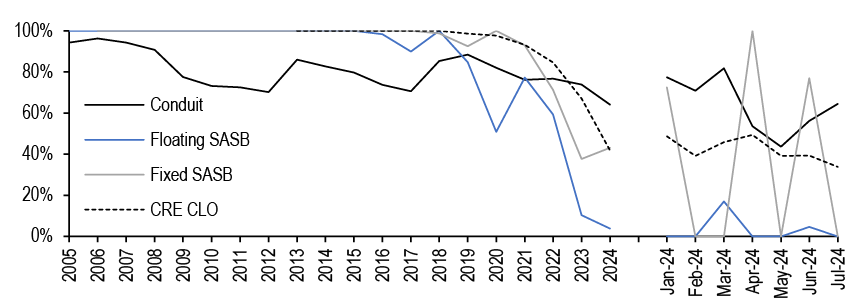
Source: J.P. Morgan, Trepp
Figure 106: Office loans continue to be the main laggard with regard to refi success rates
Refinance success rates for conduit CMBS loans by product type, as of July 2024
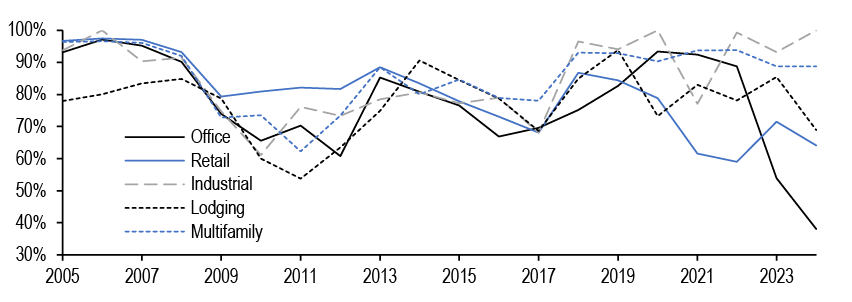
Source: J.P. Morgan, Trepp
Delinquencies, special servicing, and modifications
During the July 2024 remit period, the serious delinquency rate (60d+ including NP matured and FC/REO) for private label CMBS reached 4.74%, representing a 20bp increase from the prior month ( Figure 107). Additionally, the loan modification and foreclosure rate experienced slight increases reaching 10.5% and 2.4%, respectively. Meanwhile, the special servicing rate for private label CMBS remained flat at 7.4%. By private label CMBS product type, conduit CMBS experienced the largest month-over-month increase in serious delinquencies. In July, the serious delinquency rate for conduit CMBS increased by 30bp to 5.3% ( Figure 108). The serious delinquency rate for SASB and CRE CLOs increased slightly to 4% and 4.3%, respectively. As for agency CMBS, the serious delinquency rates for both Freddie K and FRESB remained relatively flat over the month at 0.4% and 2.7%.
Figure 107: The serious delinquency, loan modification, and foreclosure rate all increased in July for private label CMBS loans
60d+ delinquency rate (including NP matured and FC/REO), modification rate, modification rate excluding temporary forbearance, special servicing, and foreclosure rate for private label CMBS, as of July 2024
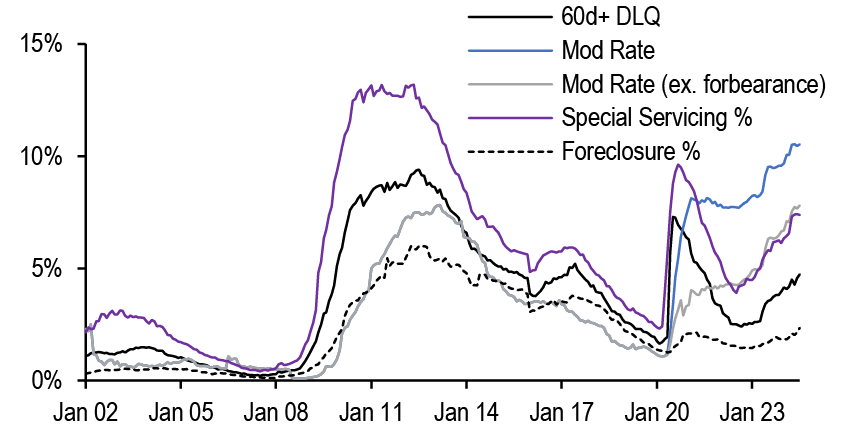
Source: J.P. Morgan, Trepp
Figure 108: Conduit CMBS loans experienced the largest month-over-month increase in July, reaching to 5.3%
60d+ delinquency rate (including NP matured and FC/REO) by CMBS product type, as of July 2024
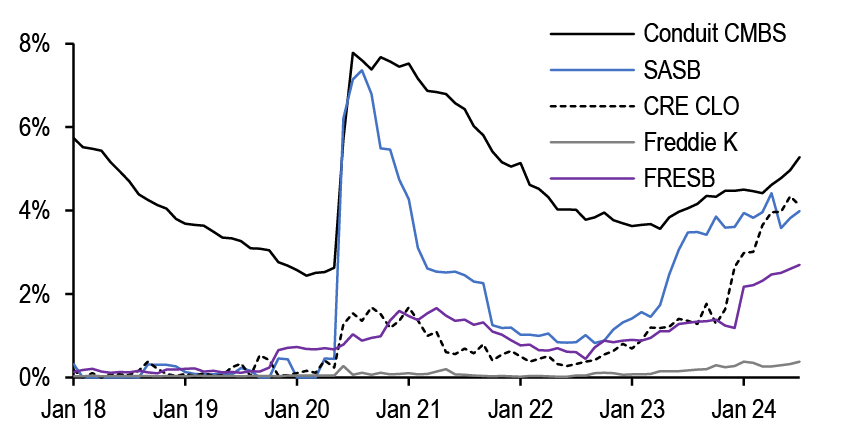
Source: J.P. Morgan, Trepp
When reviewing July’s remit data by property type, it is apparent that office loans were the marginal driver of the increase in the private label CMBS serious delinquency rate. In July, the serious delinquency rate for office loans increased by 100bp to 7.6%, while the serious delinquency rate for all other major property types was either flat or fell slightly ( Figure 109). This increase was largely the result of maturity defaults as the current rate and credit environment have continued to challenge office property owners' ability to successfully refinance. In the conduit CMBS space, an additional $1.3bn of outstanding balance across 36 office loans became seriously delinquent in July. On the SASB side, the largest office loan to become delinquent was 230 Park Avenue, which is securitized in MSC 2021-230P ($670mn). Despite being in a prime area of New York City, across the street from Grand Central Station, the property entered special servicing in November 2023, claiming that a maturity default was imminent. Contributing to the property’s underperformance have been increased operating expenses and higher borrowing costs. As of the most recent special servicer commentary, the loan has been granted a 90-day forbearance period to provide the property owner with time to consider converting some portion of the property, possibly to residential apartments. We will continue to follow the eventual outcome of the loan, especially considering that the property owner has seemingly opted against or is unable to exercise the first of three embedded 1-year extension options.
Figure 109: The marginal driver for the increase in serious delinquencies last month were office loans
60d+ delinquency rate (including NP matured and FC/REO) by property type, as of July 2024
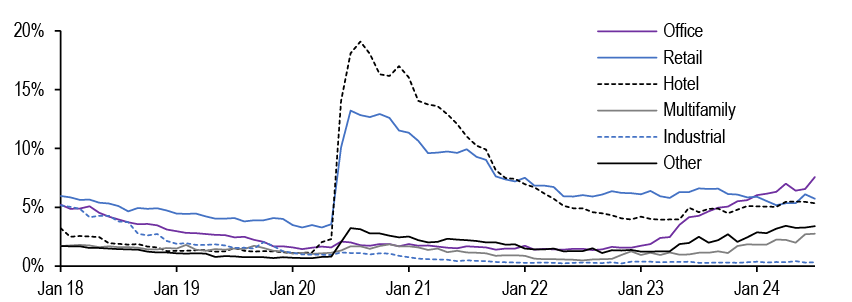
Source: J.P. Morgan, Trepp
More CRE CLO mods and buyouts
The CRE CLO market has faced heightened stress since the second half of last year as increased interest rates have resulted in significantly higher borrowing costs and stifled new loan origination. The serious delinquency rate in the CRE CLO market has now reached 4.3%, discussed above, and is likely to continue increasing through the rest of the year. Earlier this year, we released a 3-part series (here, here, and here) discussing the different tools currently being used by CRE CLO managers to deal with this heightened stress and to manage the deleveraging of their CRE CLO vehicles. As discussed in the series, DLQ buyouts and loan modifications are two of the most widely used tools by CRE CLO managers. As highlighted in Figure 110, we have continued to see elevated levels of DLQ buyouts and loan modifications in the CRE CLO market through the first seven months of the year. As of July 2024, the 3-month average volume of DLQ buyouts was about $120mn, which is well above historical norms. The total outstanding balance of modified loans reached $15.6bn in July, representing the highest level on record.
Figure 110: DLQ buyouts and loan modifications have remained elevated through the July remit period. Additionally, we noticed a spike in reinvestments in July
3-month average of managed CRE CLO loan payoffs, reinvestments, total cash, cumulative modified loan balance, and delinquent payoffs ($bn), as of July 2024

Source: J.P. Morgan, Trepp
In total, we estimate that CRE CLO managers have executed about $1bn of DLQ buyouts through the first seven months of the year ( Figure 111). Our methodology for estimating total DLQ buyouts can be found here. To put in context the volume of DLQ buyouts we’ve already seen this year, we estimated that $1.3bn of delinquent loans were bought out of CRE CLOs in all of 2023. At the current pace, the total volume of DLQ buyouts in 2024 will far surpass levels seen in 2023. Nearly 90% of all buyouts to occur this year have been from the 2021 and 2022 vintages as some of these deals are still in their reinvestment periods and these two vintages account for 80% of the total CRE CLO market. Similarly, $6bn of CRE CLO loans have been modified in 2024, already exceeding the total for 2023 ( Figure 112). These modifications indicate a commitment from both lenders and borrowers to the continued performance of the loans, often providing additional time for asset performance improvement and a better interest rate environment. Our economists forecast that the Fed will cut rates by 50bp in both September and November, then 25bp in every meeting thereafter. If this materializes, next year’s rate environment should allow for more refinancings and new loan originations. Consequently, we expect DLQ buyouts and loan modification volumes to decrease in 2025.
Figure 111: DLQ buyouts in 2024 will likely exceed 2023 levels
Balance of CRE CLO DLQ buyouts split by vintage ($bn), as of July 2024
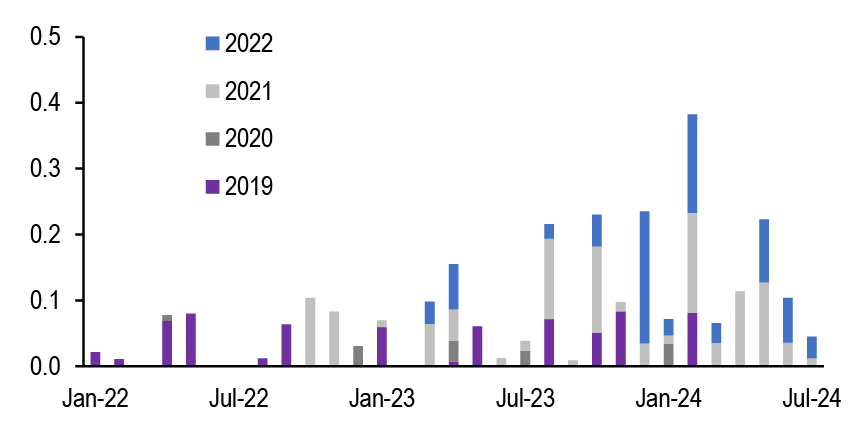
Source: J.P. Morgan, Trepp
Figure 112: Loan modifications in 2024 have already surpassed 2023 levels
Balance of modified CRE CLO loans excluding benchmark transition modifications by vintage ($bn), as of July 2024
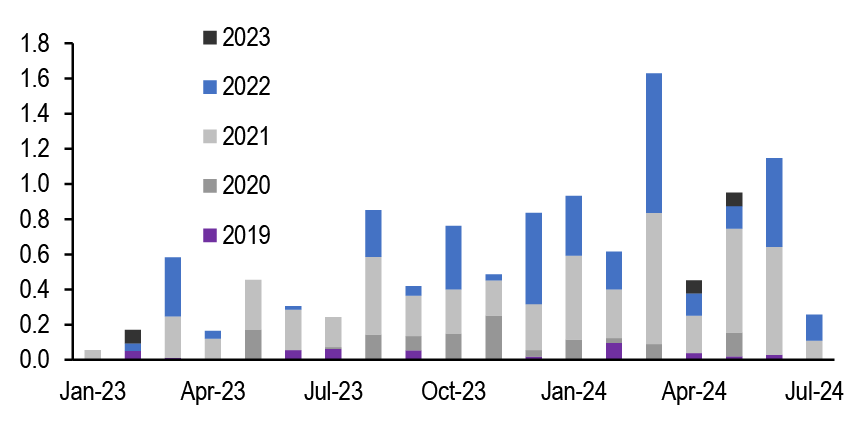
Source: J.P. Morgan, Trepp
Each manager implements its own strategy to maximize the performance of their CRE CLOs, depending on investment objectives and available resources. In Figure 113, we summarize the different strategies used by the top 15 CRE CLO managers by lifetime issuance (excluding reinvestment loans). There is clear differentiation in preferences: some managers prefer DLQ buyouts, while others favor loan modifications. Since the start of 2024, Arbor has engaged more in DLQ buyouts and loan modifications than any other CRE CLO manager. As highlighted in Figure 113, we estimate that Arbor has executed about $327mn in DLQ buyouts and over $2.6bn in loan modifications. Arbor’s increased activity in both buyouts and modifications demonstrates their commitment to maintaining the leverage in their outstanding CRE CLO vehicles.
Figure 113: Arbor Reality has engaged in more DLQ buyouts and loan modifications than any other CRE CLO manager this year
Lifetime CRE CLO manager DLQ buyouts and loan modifications, as of July 2024
| CRE CLO Manager | Original Balance ($mn) | Outstanding Balance ($mn) | 30d+ DLQ | 60d+ DLQ | Lifetime DLQ Buyouts ($mn) | Lifetime Loan Mods ($mn) | DLQ Buyouts 2024 YTD ($mn) | Loan Mods 2024 YTD ($mn) | Lifetime Liquidations ($mn) | Lifetime Losses ($mn) | Lifetime DLQ Buyouts (% of orig) | Lifetime Loan Mods (% of orig) |
| MF1 REIT | 14,864 | 12,143 | 2.5% | 2.0% | 115 | 2,200 | 34 | 44 | 99 | 0.0 | 0.8% | 14.8% |
| Arbor Realty | 11,607 | 6,663 | 3.9% | 1.3% | 724 | 3,750 | 382 | 2,623 | 14 | 0.0 | 6.2% | 32.3% |
| Benefit Street Partners | 8,187 | 4,162 | 5.6% | 5.6% | 190 | 1,389 | 21 | 291 | 38 | 0.0 | 2.3% | 17.0% |
| Bridge | 7,829 | 4,140 | 0.8% | 0.0% | 235 | 86 | 124 | 35 | 0 | 0.0 | 3.0% | 1.1% |
| Ready Capital | 7,388 | 4,777 | 9.8% | 7.5% | 42 | 552 | 23 | 535 | 56 | 0.3 | 0.6% | 7.5% |
| LoanCore Capital | 4,385 | 3,309 | 3.2% | 1.0% | 991 | 81 | 214 | 32 | 32 | 0.0 | 22.6% | 1.9% |
| Prime Finance | 7,844 | 3,333 | 0.0% | 0.0% | 54 | 162 | 0 | 111 | 17 | 0.0 | 0.7% | 2.1% |
| Argentic | 6,440 | 3,509 | 3.8% | 2.9% | 88 | 131 | 22 | 65 | 7 | 0.0 | 1.4% | 2.0% |
| TPG | 5,488 | 2,265 | 5.4% | 5.4% | 231 | 511 | 0 | 210 | 86 | 0.0 | 4.2% | 9.3% |
| FS Rialto | 5,175 | 5,031 | 9.7% | 9.7% | 93 | 1,093 | 69 | 1,030 | 0 | 0.0 | 1.8% | 21.1% |
| Blackstone | 4,500 | 2,969 | 0.0% | 0.0% | 0 | 1,125 | 0 | 697 | 0 | 0.0 | 0.0% | 25.0% |
| Varde | 3,650 | 1,620 | 15.2% | 15.2% | 70 | 688 | 0 | 31 | 0 | 0.0 | 1.9% | 18.8% |
| Starwood | 3,375 | 2,564 | 4.8% | 0.0% | 131 | 518 | 81 | 460 | 0 | 0.0 | 3.9% | 15.4% |
| KKR | 3,300 | 2,299 | 0.0% | 0.0% | 0 | 250 | 0 | 315 | 0 | 0.0 | 0.0% | 7.6% |
| Granite Point | 3,188 | 1,194 | 11.1% | 11.1% | 45 | 724 | 0 | 22 | 24 | 0.0 | 1.4% | 22.7% |
| Greystone | 2,944 | 1,894 | 8.1% | 8.1% | 89 | 35 | 22 | 0 | 0 | 0.0 | 3.0% | 1.2% |
Source: J.P. Morgan, Trepp
The aggregate level of reinvestments in the CRE CLO market had been relatively low in recent months due to the lack of new origination volumes and most outstanding managed CRE CLOs being outside their reinvestment period. However, in July, we estimate that there were about $527mn in reinvestments throughout the entire CRE CLO market, representing the highest volume since October 2023. This increase was driven by two Arbor deals, ARCLO 2021-FL4 and ARCLO 2022-FL1, which accounted for 90% of all reinvestment volumes. Arbor called its ARCLO 2021-FL2 deal back in June 2024, which had about $700mn outstanding across 32 performing loans. In July, 17 of these loans, totaling about $470mn in outstanding balance, were reinvested into ARCLO 2021-FL4 and ARCLO 2022-FL1. Based on the limited data available, minor changes were made to the loan balance and gross margin of just 9 of these loans before reinvestment ( Figure 114). The bottom half of Figure 114 shows the 15 loans that have not been reinvested as of the July remit period. It will be interesting to see if any or all of these loans are eventually reinvested into Arbor’s outstanding CRE CLO vehicles.
Figure 114: Arbor has reinvested 17 of the loans originally in ARCLO 2021-FL2 into two of its outstanding CRE CLO vehicles, ARCLO 2021-FL4 and ARCLO 2022-FL1
Original Balance and gross margin for outstanding loans that were securitized in ARCLO 2021-FL2 as of the May 2024 remit period
| Loan Name | Reinvested Deal | Outstanding Bal. in ARCLO 2021-FL2 ($mn) | Balance in Reinvested deal ($mn) | Gross Margin in ARCLO 2021-FL2 | Gross Margin in Reinvested deal | Diff. in Balance ($mn) | Diff. in Gross Margin |
| Maplewood Apartments | ARCLO 2021-FL4 | 9.30 | 9.30 | 4.00% | 4.00% | 0.00 | 0.00% |
| Residence at Midtown | ARCLO 2021-FL4 | 26.90 | 26.90 | 3.50% | 3.50% | 0.00 | 0.00% |
| ParkCrest Landings | ARCLO 2021-FL4 | 35.61 | 35.61 | 3.80% | 3.80% | 0.00 | 0.00% |
| Vello Valley | ARCLO 2021-FL4 | 52.00 | 52.00 | 4.50% | 4.70% | 0.00 | 0.20% |
| Country Place Apartments | ARCLO 2021-FL4 | 14.25 | 13.15 | 3.75% | 3.60% | -1.10 | -0.15% |
| Summerwind and Briar Cove | ARCLO 2021-FL4 | 25.44 | 25.44 | 4.38% | 4.38% | 0.00 | 0.00% |
| Summit at Champions | ARCLO 2021-FL4 | 19.75 | 18.40 | 5.00% | 4.80% | -1.35 | -0.20% |
| Holly Oaks | ARCLO 2021-FL4 | 13.67 | 13.67 | 3.50% | 3.50% | 0.00 | 0.00% |
| Park Place | ARCLO 2021-FL4 | 16.80 | 15.89 | 3.88% | 3.65% | -0.91 | -0.23% |
| Village at Pioneer Park | ARCLO 2021-FL4 | 29.46 | 28.08 | 3.65% | 3.60% | -1.38 | -0.05% |
| Cottage Cove Apartments | ARCLO 2021-FL4 | 59.00 | 54.65 | 3.00% | 3.00% | -4.35 | 0.00% |
| Diplomat Tower | ARCLO 2022-FL1 | 59.00 | 52.03 | 3.50% | 3.50% | -6.97 | 0.00% |
| Glennwood Apartments | ARCLO 2022-FL1 | 11.00 | 11.00 | 3.50% | 4.00% | 0.00 | 0.50% |
| 2 East Oak Street | ARCLO 2022-FL1 | 48.50 | 46.12 | 2.73% | 2.65% | -2.39 | -0.08% |
| Arbors at North Hills | ARCLO 2022-FL1 | 31.71 | 29.37 | 3.35% | 3.55% | -2.35 | 0.20% |
| Stafford Oaks Apartments | ARCLO 2022-FL1 | 15.85 | 15.85 | 3.50% | 3.50% | 0.00 | 0.00% |
| Delmar-Savoy Apartments | ARCLO 2022-FL1 | 2.73 | 2.72 | 4.25% | 4.20% | -0.01 | -0.05% |
| Parc at 505 | N/A | 22.81 | N/A | 4.00% | N/A | N/A | N/A |
| Canyon Club | N/A | 17.90 | N/A | 4.00% | N/A | N/A | N/A |
| The Woodlands | N/A | 13.44 | N/A | 3.50% | N/A | N/A | N/A |
| Highland Apartments | N/A | 16.46 | N/A | 3.50% | N/A | N/A | N/A |
| Tesoro at 12 | N/A | 24.16 | N/A | 3.50% | N/A | N/A | N/A |
| Miramar | N/A | 8.30 | N/A | 3.45% | N/A | N/A | N/A |
| The Edge at Oakland | N/A | 28.40 | N/A | 4.00% | N/A | N/A | N/A |
| Highlands Apartments | N/A | 2.74 | N/A | 3.50% | N/A | N/A | N/A |
| Majestic Gardens | N/A | 3.05 | N/A | 8.00% | N/A | N/A | N/A |
| North Crossings | N/A | 13.40 | N/A | 4.15% | N/A | N/A | N/A |
| 910 Apartments | N/A | 30.05 | N/A | 4.60% | N/A | N/A | N/A |
| Bellaire Apartments | N/A | 7.05 | N/A | 3.75% | N/A | N/A | N/A |
| Westfield Ridge Apartments | N/A | 7.60 | N/A | 3.55% | N/A | N/A | N/A |
| Reserve at West Hills | N/A | 16.57 | N/A | 3.35% | N/A | N/A | N/A |
| Diamond Green | N/A | 17.01 | N/A | 3.50% | N/A | N/A | N/A |
Source: J.P. Morgan, Trepp , Intex
Weekly Tracker
Figure 115: Delinquency rate
Conduit CMBS 30-day+ delinquency rate including FC/REO and NP matured (%)
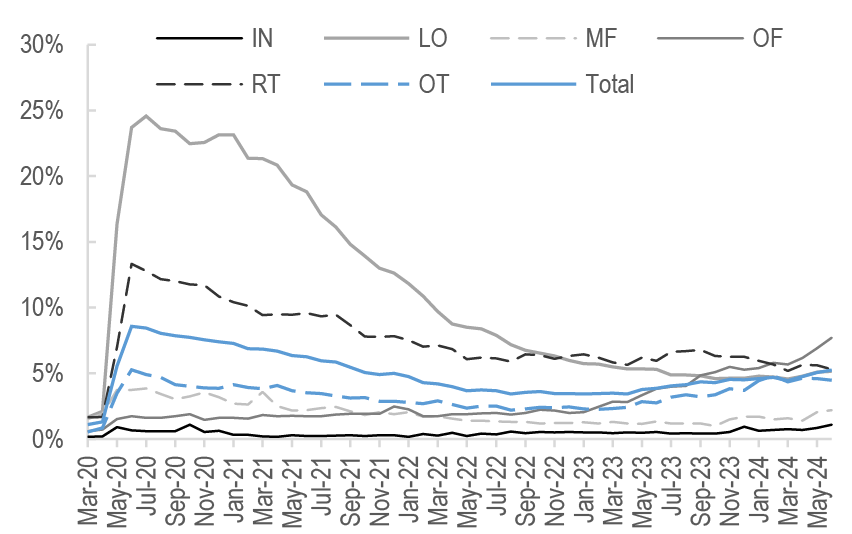
Source: J.P. Morgan, Trepp
Figure 116: Delinquency cure rates
Conduit CMBS 30 day+ delinquency to performing transition rates (%)
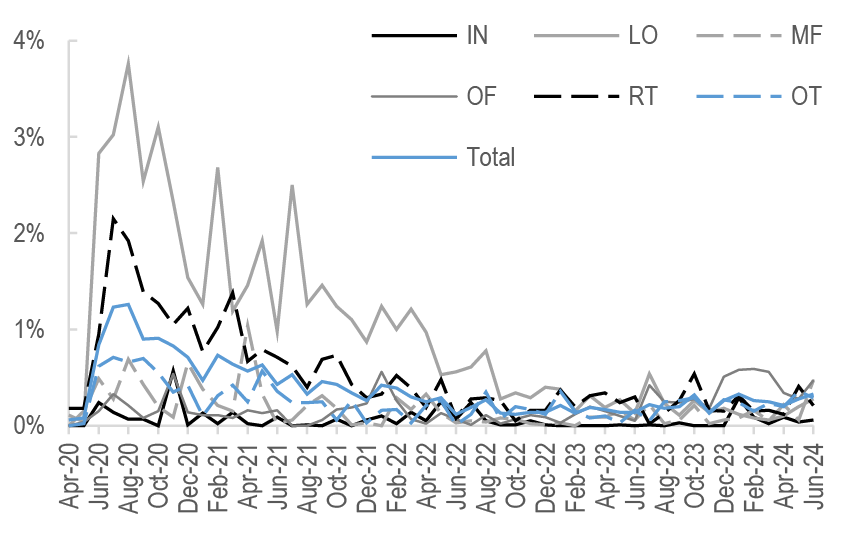
Source: J.P. Morgan, Trepp
Figure 117: Specially serviced rate
Conduit CMBS percentage of loans in special servicing (%)
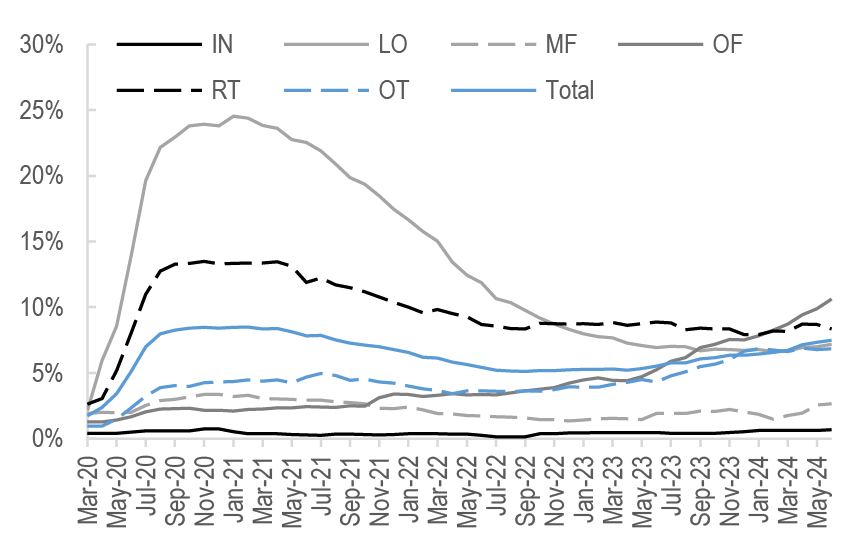
Source: J.P. Morgan, Trepp
Figure 118: Office RTTO indexed to pre-pandemic levels
Kastle System Back to Work Barometer, weekly
Source: Kastle Systems, Bloomberg Finance L.P.
Cross Sector Spreads
| Current | Changes | 5yr Trailing | Percentile Rank | ||||||||
| Product | Tranche / Bucket | 8/15/24 | -1w | -1m | -1y | Min | Max | 3yr | 5yr | 7yr | |
| Conduit CMBS | 3yr AAA | 95 | 0 | 5 | -42 | 26 | 463 | 33.3% | 53.6% | 66.8% | |
| Treasury Spread (bp) | 5yr AAA | 143 | 0 | 7 | -43 | 47 | 461 | 59.3% | 71.1% | 78.9% | |
| 5yr LCF AAA | 114 | 1 | 7 | N/A | 96 | 120 | 90.8% | 90.8% | 90.8% | ||
| 10yr LCF AAA | 103 | 0 | 4 | -33 | 59 | 340 | 34.4% | 54.6% | 66.1% | ||
| 10yr AS | 164 | 1 | 24 | -40 | 74 | 440 | 39.6% | 58.5% | 70.3% | ||
| 10yr AA | 193 | -3 | 25 | -62 | 90 | 565 | 38.4% | 55.8% | 68.4% | ||
| 10yr A | 241 | -7 | 33 | -192 | 123 | 756 | 30.9% | 47.1% | 62.0% | ||
| 10yr BBB- | 623 | -11 | 28 | -308 | 263 | 1354 | 38.0% | 55.1% | 60.2% | ||
| XA | 138 | -3 | 5 | -152 | 90 | 535 | 19.4% | 32.9% | 49.6% | ||
| Freddie K | 7yr A2 | 47 | -1 | 7 | N/A | 6 | 100 | 53.6% | 70.3% | 78.2% | |
| Treasury Spread (bp) | 10yr A2 | 52 | 0 | 1 | N/A | 10 | 110 | 62.3% | 75.8% | 81.8% | |
| 2020 Vintage B | 153 | 0 | 3 | -55 | 109 | 441 | N/A | N/A | N/A | ||
| 2020 Vintage C | 173 | 1 | 6 | -69 | 158 | 593 | N/A | N/A | N/A | ||
| X1 | 140 | 0 | 15 | N/A | 50 | 400 | 15.2% | 32.4% | 50.7% | ||
| X3 | 350 | 0 | 15 | N/A | 225 | 695 | 23.8% | 36.7% | 54.9% | ||
| SOFR Floater (DM) | 63 | 0 | 20 | N/A | 19 | 90 | 55.0% | 63.6% | 63.6% | ||
| FRESB | A5H (5yr Hybrid ARM) | 119 | -1 | 20 | N/A | 2 | 131 | 79.5% | 87.9% | 90.7% | |
| Treasury Spread (bp) | A10F (10yr Fixed Rate) | 81 | 0 | 7 | N/A | 16 | 126 | 49.0% | 66.8% | 74.6% | |
| Fannie DUS | 7/6.5 TBA | 54 | -2 | 8 | N/A | 7 | 110 | 58.9% | 72.7% | 81.2% | |
| Treasury Spread (bp) | 10/9.5 TBA | 56 | 0 | 2 | N/A | 14 | 135 | 58.9% | 71.9% | 76.8% | |
| SOFR SARM (DM) | 65 | 0 | 17 | N/A | 22 | 95 | 51.7% | 64.7% | 65.2% | ||
| Fannie ACES | 7yr A2 | 50 | -1 | 8 | N/A | 7 | 102 | 54.3% | 70.6% | 78.9% | |
| Treasury Spread (bp) | 10yr A2 | 54 | 0 | 2 | N/A | 12 | 120 | 62.9% | 77.0% | 82.1% | |
| GNR Project Loans | 3.5yr | 129 | 1 | 16 | N/A | 60 | 169 | 37.7% | 63.3% | 73.7% | |
| Treasury Spread (bp) | 7.5yr | 148 | 0 | 0 | N/A | 69 | 202 | 31.1% | 59.0% | 70.9% | |
| 12yr | 145 | 1 | -11 | N/A | 80 | 237 | 30.5% | 59.0% | 70.6% | ||
| Production Coupon | FN/FR 30yr PC (OAS) | 13 | -6 | -2 | -37 | -35 | 115 | 15.5% | 38.3% | 27.5% | |
| FN/FR 30yr PC (ZV) | 101 | -16 | -10 | -38 | -2 | 173 | 28.4% | 56.3% | 68.8% | ||
| ABS | 3yr AAA Credit Card | 50 | 0 | 2 | 0 | 12 | 207 | 56.0% | 67.6% | 76.5% | |
| Treasury Spread (bp) | 3yr AAA Prime Auto | 72 | 0 | 8 | -6 | 15 | 207 | 60.7% | 72.0% | 79.7% | |
| 3yr BBB Subprime Auto | 175 | 0 | 25 | -40 | 72 | 566 | 38.0% | 54.0% | 67.4% | ||
| CLO | AAA | 139 | 0 | 11 | -32 | 101 | 408 | 29.3% | 44.4% | 59.4% | |
| Discount Margin | BBB | 369 | -10 | 2 | -94 | 323 | 972 | 20.1% | 30.6% | 45.4% | |
| BB | 788 | -8 | 13 | -136 | 693 | 1,756 | 30.9% | 41.5% | 57.8% | ||
| JULI (ex-EM) | 3-5yr | 96 | -5 | 8 | -21 | 58 | 407 | 30.9% | 44.7% | 51.6% | |
| Treasury Spread (bp) | 5-7yr | 106 | -3 | 9 | -21 | 71 | 372 | 32.3% | 44.7% | 38.4% | |
| 7-10yr | 120 | -5 | 8 | -29 | 87 | 368 | 29.1% | 42.5% | 36.9% | ||
| 7-10yr A | 105 | -5 | 7 | -25 | 68 | 316 | 29.4% | 45.5% | 50.6% | ||
| 7-10yr REITs | 134 | -3 | 7 | -46 | 98 | 350 | 28.0% | 41.2% | 34.9% | ||
| High Yield | Domestic HY | 377 | 2 | 41 | -36 | 317 | 1,139 | 20.9% | 14.3% | 12.2% | |
| Spread to Worst (bp) | Energy | 295 | 5 | 45 | -36 | 234 | 2,395 | 18.0% | 10.8% | 7.7% | |
| Swap Spreads | 3yr | 5 | 0 | -2 | -7 | -5 | 24 | 3.5% | 3.5% | 3.5% | |
| (bp) | 5yr | -1 | 1 | 0 | -7 | -7 | 15 | 5.6% | 5.6% | 5.6% | |
| 10yr | -16 | 1 | -1 | -17 | -17 | 11 | 1.4% | 1.4% | 1.4% | ||
Cross Sector Spreads (continued)
| Current | Changes | 5yr Trailing | Percentile Rank | ||||||||
| Product | Tranche / Bucket | 8/15/24 | -1w | -1m | -1y | Min | Max | 3yr | 5yr | 7yr | |
| CMBX (bp) | AAA17 | 88 | -1 | 10 | N/A | 74 | 92 | 87.9% | 87.9% | 87.9% | |
| AAA16 | 81 | -1 | 7 | -17 | 70 | 119 | 34.8% | 34.8% | 34.8% | ||
| AAA15 | 78 | -2 | 8 | -16 | 60 | 115 | 38.1% | 38.1% | 38.1% | ||
| AAA14 | 74 | -2 | 7 | -16 | 45 | 109 | 47.4% | 57.6% | 57.6% | ||
| AAA13 | 69 | -2 | 6 | -17 | 42 | 167 | 48.5% | 62.3% | 62.3% | ||
| AAA12 | 65 | -1 | 5 | -16 | 37 | 162 | 50.0% | 66.0% | 70.7% | ||
| AAA11 | 61 | -1 | 6 | -15 | 32 | 146 | 51.8% | 68.7% | 73.4% | ||
| AAA10 | 59 | -2 | 5 | -12 | 26 | 141 | 56.3% | 71.9% | 78.5% | ||
| AAA9 | 51 | -9 | -2 | -15 | 21 | 127 | 42.6% | 63.7% | 72.6% | ||
| AAA8 | 51 | -43 | 1 | -10 | 18 | 117 | 50.7% | 68.6% | 77.6% | ||
| AAA7 | 0 | 0 | 0 | -51 | 0 | 107 | 10.4% | 6.8% | 2.3% | ||
| BBB-17 | 501 | -11 | 17 | N/A | 482 | 583 | 38.6% | 38.6% | 38.6% | ||
| BBB-16 | 594 | -11 | 20 | -164 | 558 | 879 | 25.1% | 25.1% | 25.1% | ||
| BBB-15 | 619 | -16 | 24 | -175 | 375 | 922 | 43.1% | 43.1% | 43.1% | ||
| BBB-14 | 786 | -14 | 22 | -59 | 320 | 985 | 69.9% | 75.8% | 75.8% | ||
| BBB-13 | 905 | -3 | 39 | -32 | 339 | 1,151 | 70.2% | 79.1% | 79.1% | ||
| BBB-12 | 960 | -14 | 37 | -91 | 309 | 1,282 | 67.1% | 79.1% | 82.0% | ||
| BBB-11 | 782 | -12 | 38 | -198 | 302 | 1,174 | 61.6% | 72.6% | 80.0% | ||
| BBB-10 | 1,309 | -16 | 45 | -90 | 297 | 1,819 | 67.3% | 80.4% | 86.0% | ||
| BBB-9 | 1,966 | -9 | 175 | 451 | 301 | 2,005 | 99.0% | 99.4% | 99.6% | ||
| CDX (bp) | 5yr IG | 58 | 0 | 8 | -12 | 44 | 152 | 31.1% | 45.2% | 40.9% | |
| 5yr HY | 361 | -2 | 40 | -85 | 267 | 882 | 34.0% | 46.5% | 56.4% | ||
Asset-backed Securities
August 16, 2024
- BB subprime auto ABS spreads have recovered, fully erasing the previous week's widening
- We review ABS auto loan level data with a focus on new/used origination trends by credit score bands, as well as delinquency/loss metrics for super-prime, prime and non-prime borrowers
- The data show early signs of improved affordability on this year’s originations with APRs starting to plateau and decrease, loan terms extending once again, and monthly payment amounts continuing to fall
- We continue to see stabilization of credit trends for nonprime and modest deterioration for recent prime auto loan originations
- Recent recovery rates on auto loan ABS pools have normalized to long term historical levels as used car values are expected to stabilize in the year ahead with limited supply
ABS spreads recovering this week from market hiccup
The tone in the ABS market improved this week with spreads settling back down following the previous week’s volatility. Demand picked back up after the credit spread widening, particularly in higher yielding segments. Our indicative BBB subprime auto ABS spreads (3-year), for example, tightened by 10bp to Treasury +165bp this week after widening by 25bp last week, while the BB spread narrowed 30bp this week, fully erasing last week’s widening. Spreads on cash surrogate ABS sectors stood unchanged to slightly tighter from last week. This reactive function of ABS spreads to broader market volatility has been consistent in recent years, wherein lower tier credits show higher beta versus comparable unsecured corporates ( Figure 119). While that habit may be hard to break, particularly if economic data turns weaker-than-expected for consumer, it offers buying opportunity for ABS across the credit spectrum against the base case of no recession in the year ahead. Consumer ABS collateral performance trends remain positive with minimal deterioration, as expected (more on auto loan and credit card metrics in the next sections). Meanwhile, the rest of August seems to lean towards the conventional summer doldrums, but vacation breaks will not last long, as the September calendar is already filling up and will be further punctuated by the widely expected first rate cut of the policy cycle.
Figure 119: Indicative ABS spreads versus comparable corporate credits
bp
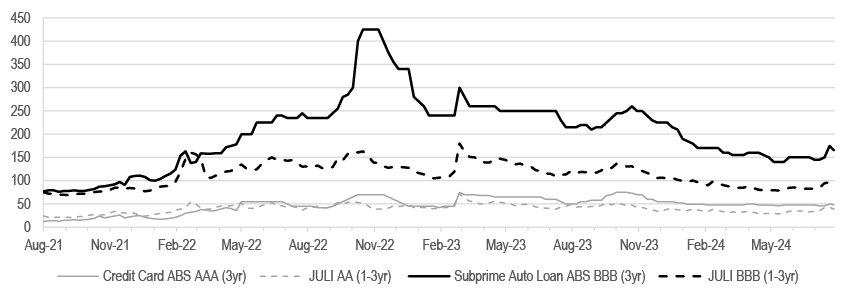
Source: J.P. Morgan
Auto ABS pools showing early signs of improving loan originations
We review auto loan ABS pool origination and performance trends using ABS-EE loan tapes (for SEC-registered transactions), focusing on APR, term and monthly payment metrics for new and used vehicle loans, as well as delinquencies and losses across FICO credit bands. Overall for these securitized auto loans in aggregate, we note that affordability seems to be returning in 2024 as seen in the collateral APRs that have levelled off and/or started to decline this year, loan terms that are extending once again after shortening previously in 2022 and 2023, and monthly payments that continue to fall. Furthermore, delinquencies and losses across auto loan ABS credit bands have only deteriorated very modestly on the prime side and is no worse on subprime for recent originations. In addition, the recent recovery rates on auto loan ABS pools have normalized to long term historical trends as used car values are expected to stabilize in the year ahead with limited supply. We note that our “Auto ABS Loan Tape Rewind” Excel data supplement report to this commentary was published earlier today.
Figure 120: 600-619 auto loan 30+ delinquencies by loan age (months) and origination vintage (year) in nonprime auto ABS
% current balance
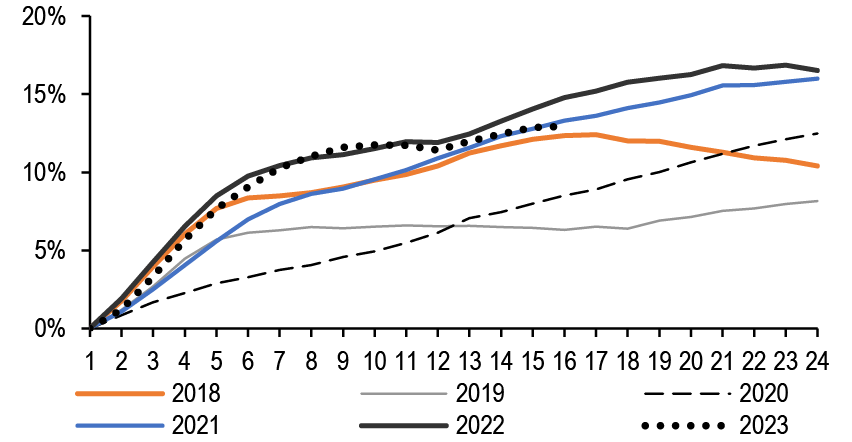
Source: J.P. Morgan, form ABS-EE via 1010data
Figure 121: 600-619 auto loan cumulative net losses by loan age (months) and origination vintage (year) in nonprime auto ABS
% original balance
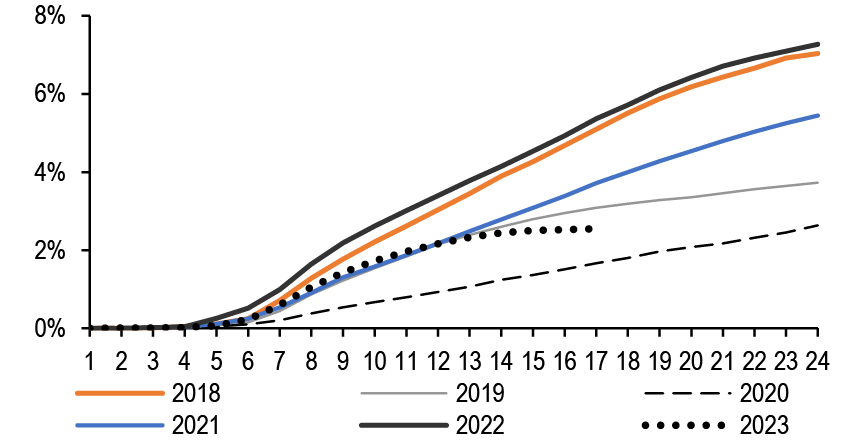
Source: J.P. Morgan, form ABS-EE via 1010data
Starting with credit trends, we continue to see stabilization for nonprime auto loan ABS pools, with delinquencies and losses for 2023 originations tracking lower than 2022 ( Figure 120 and Figure 121), even as prime pools continue to see an uptick in arrears. We attribute the recent underperformance to compounded effects of inflation on household and consumer expenses, along with FICO drift/inflation, catching up with even higher quality borrowers. Nonprime borrowers experienced significantly more immediate impact from inflation. Lenders also pulled back notably on lower credit originations for their ABS pools. Taking a closer look at the prime auto loan ABS pool by finer credit score bands, we note that the super prime cohort (>720), which accounts for bulk of captive and bank auto loan ABS pools, is still largely insulated, while the lower prime bands saw the modest uptick in delinquency. For example, on the 660-719 credit score band, 30+ delinquency tracked 1.1% at loan age 6 months for 2023 originations, slightly higher compared to 0.9% for 2022 ( Figure 122). However, on the 720-779 band there is no discernible difference for delinquency ramps across 2022 and 2023 ( Figure 123). We note that there is still limited seasoning across 2023 vintages, as loans originated in 2H23 are currently only 6-12 months seasoned, and the trends could evolve in subsequent months. Given the more default conscious nature of the prime segments with the borrower juggling through payments to avoid default, these arrears have not translated to elevated losses ( Figure 124 and Figure 125). In our base case scenario, factoring decent labor market conditions and unemployment forecasts from our economists (pointing to 4.5%-4.6% through 2025), we do not expect a significant deterioration in curing trends and/or outsized uptick in loss ramps for prime vintages.
Figure 122: 30+ delinquencies on 700-719 loans in prime auto loan ABS by loan age and vintage
% of current balance
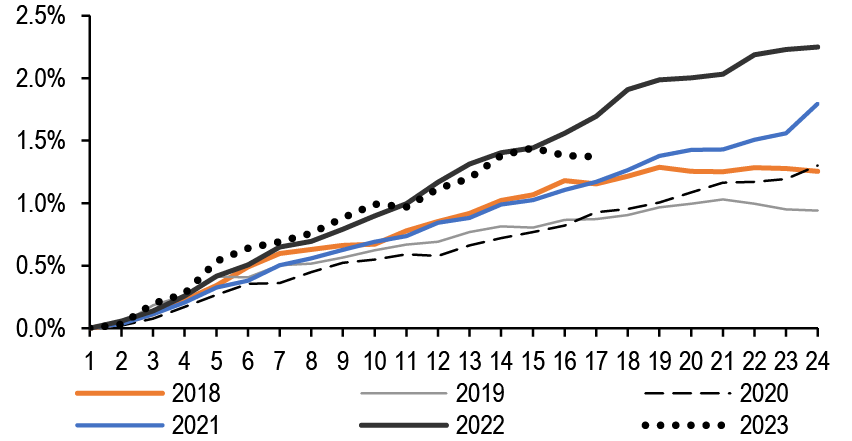
Source: J.P. Morgan, form ABS-EE via 1010data
Figure 123: 30+ delinquencies on 720-779 loans in prime auto loan ABS by loan age and vintage
% of current balance
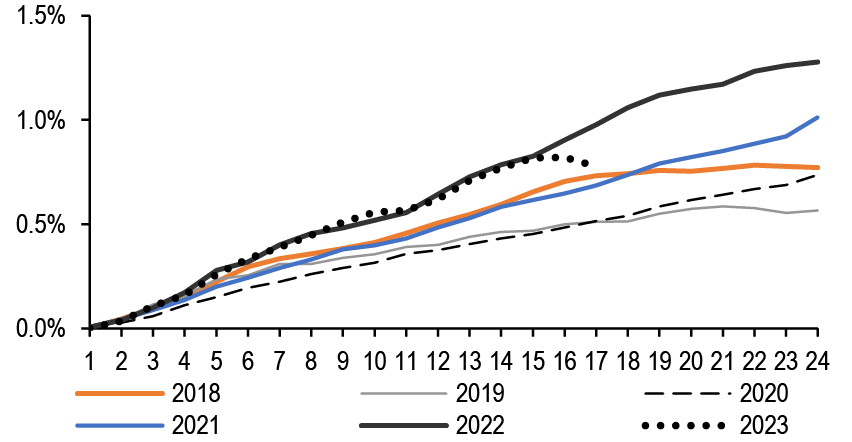
Source: J.P. Morgan, form ABS-EE via 1010data
Figure 124: Cumulative net losses on 700-719 loans in prime auto loan ABS by loan age and vintage
% of original balance
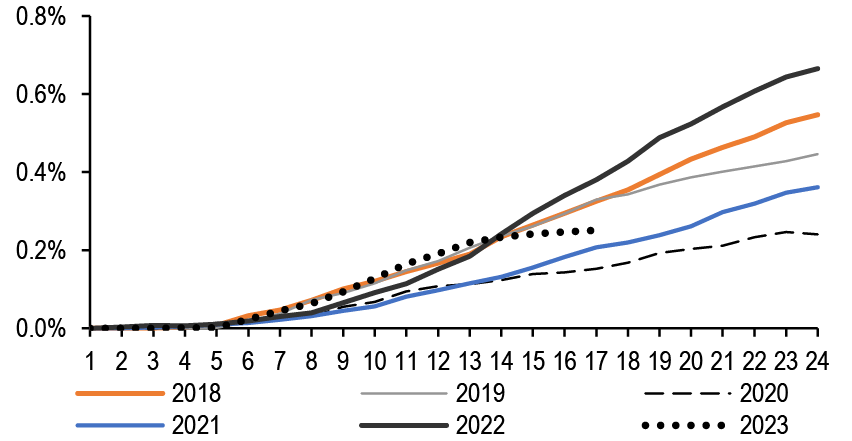
Source: J.P. Morgan, form ABS-EE via 1010data
Figure 125: Cumulative net losses on 720-779 loans in prime auto loan ABS by loan age and vintage
% of original balance
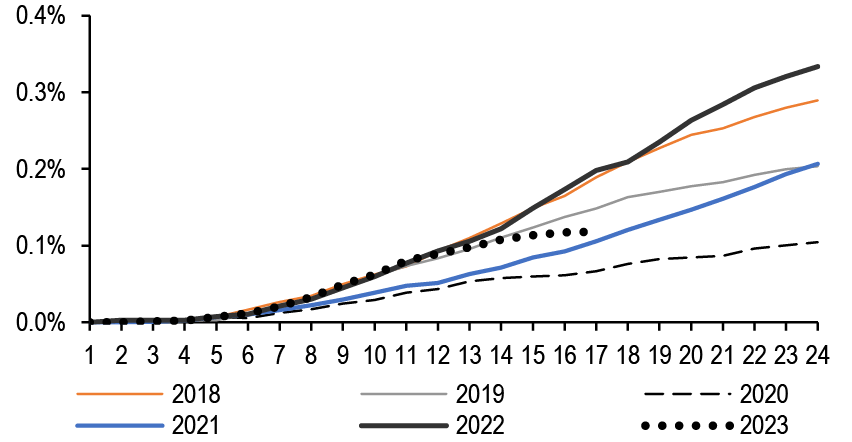
Source: J.P. Morgan, form ABS-EE via 1010data
Next, we examine origination trends through APR, term and monthly payment rates. We note that the underlying data set for public SEC-registered auto loan ABS transactions is dominated by prime issuers with pools that are about 75% prime originations from 1Q17 through 2Q23. The SEC-registered non-prime auto loan ABS cohort is limited to the SDART (Santander), AMCAR (GM Financial), DRIVE (Santander) and WOSAT (World Omni) programs, with recent additions from EART (Exeter), BLAST (Bridgecrest) and select CRVNA (Carvana) transactions. Additionally, despite the heavy auto loan ABS supply year-to-date, there is still limited data for 2024 loan originations given the average 9-10 months of seasoning for prime auto loans and 4-5 months for non-prime from loan origination to securitization. As such the endpoints across our exhibits reflect higher nonprime concentration as well as mostly Carvana originations (which are typically only 1-2 month seasoned at securitization) on the prime side for this year’s origination cohort. On auto loan ABS pools, in line with the macro supply chain disruptions and high car prices through the pandemic cycle, share of new vehicles as % of originations declined from 66% pre-pandemic to 62% in 2020 and tracked about 57% for 2023 originations. Within the newest origination cohort, >720 still accounts for about 70% of total new auto loan originations ( Figure 126). On the used front, about a third of the originations are attributable to the 541-600 credit score band and an additional third to the 601-660 segment, with just 4% from >720 borrowers ( Figure 127).
Figure 126: Distribution of new vehicle loans by credit score bands and origination quarters in public auto loan ABS pools since 2017
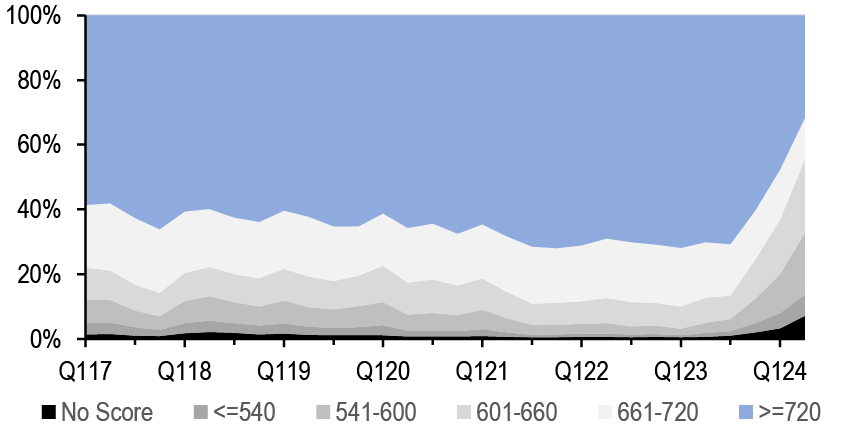
Source: J.P. Morgan, form ABS-EE via 1010data
Figure 127: Distribution of used vehicle loans by credit score bands and origination quarters in public auto loan ABS pools since 2017
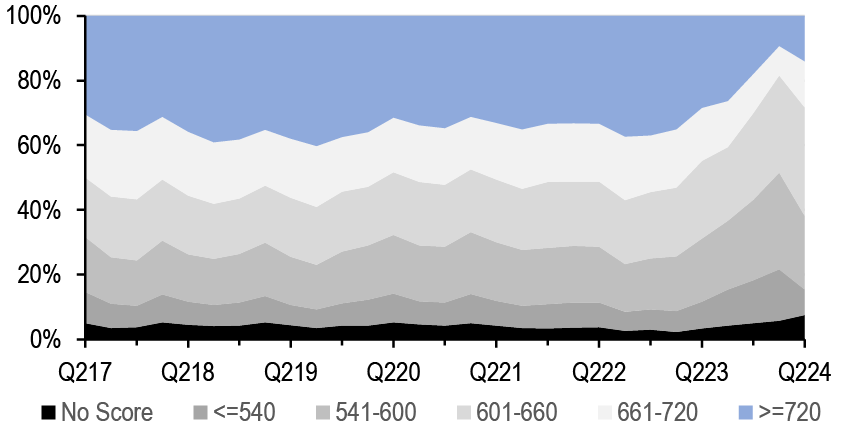
Source: J.P. Morgan, form ABS-EE via 1010data
On the loan APR (collateral WAC), we note that the rate and risk repricing (tighter underwriting ) are both clearly visible in the used segment as well as within the lower prime categories on the new side. For instance, within the new cohort for >720 FICO, the average APRs tracked 3.2%, 4.0% and 5.2% for 2021, 2022 and 2023 originations, compared to 4.5%, 5.8% and 7.5% for the 661-720 band over the same periods, respectively ( Figure 128). On the used side, the APRs in the 601-660 band increased sequentially from 13.2% in 2021 to 14.4% in 2022 and 18.0% in 2023 ( Figure 129). Although varied by credit score bands, on aggregate used originations have seen more longer loan term loans compared to the new cohort. For example, used loan term averaged 68.2 months for 2020 originations compared to 69.9 on 2023 ( Figure 130). For 2023 originations in the new segment, loan terms tracked 72, 73, 73, 71 and 65 months across <=540, 541-600, 601-660, 661-720 and >720 credit score bands, respectively, largely consistent with prior years ( Figure 131). The uptick at the tail ends is attributed to low origination volumes and longer loan terms from Carvana and Exeter pools. The combined impact of higher rates and higher car prices has resulted in higher monthly scheduled loan payment (total principal & interest payment), only partially offset by longer loan terms. This trend is consistent across used and new segments, with higher increases in scheduled monthly payments noted for new and higher credit score borrowers, illustrating the outsized increase in car prices compared to APR upticks (i.e. higher original loan amount contributing more to the increase in monthly payments versus higher APRs). For context, within the new cohort, average monthly payment for >720 credit score band tracked $1,037 for 2023 originations, about 41% higher than pre-pandemic 2019 level of $730 ( Figure 132), while the same credit score band >720 saw monthly payments increase 35% from $592 to $797 over the same time period on the used front ( Figure 133). For super-prime borrowers, the return of incentives from captive lenders is expected to improve drive sales once again. Our auto credit research analysts noted for July that industry incentive spending was up to $3,398 per vehicle, up approximately 58% y/y, but still at a sizable gap to the 2019 pre-pandemic average of $3,823.
Figure 128: Average APRs for new vehicle loans by credit score bands and origination quarters in public auto loan ABS pools since 2017
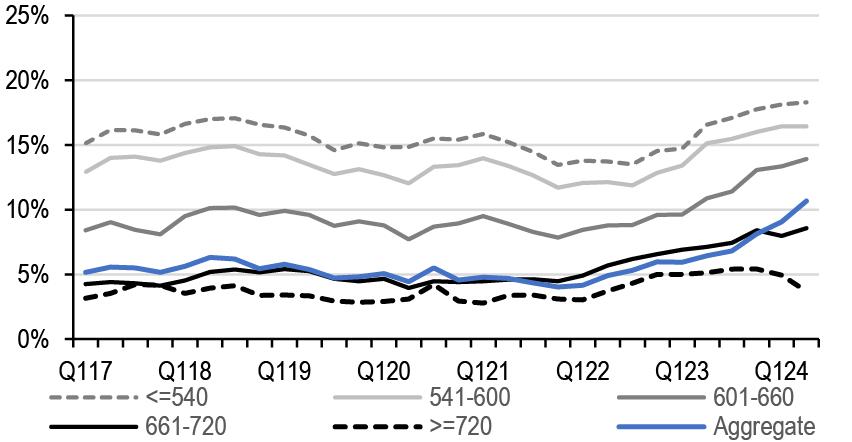
Source: J.P. Morgan, form ABS-EE via 1010data
Figure 129: Average APRs for used vehicle loans by credit score bands and origination quarters in public auto loan ABS pools since 2017
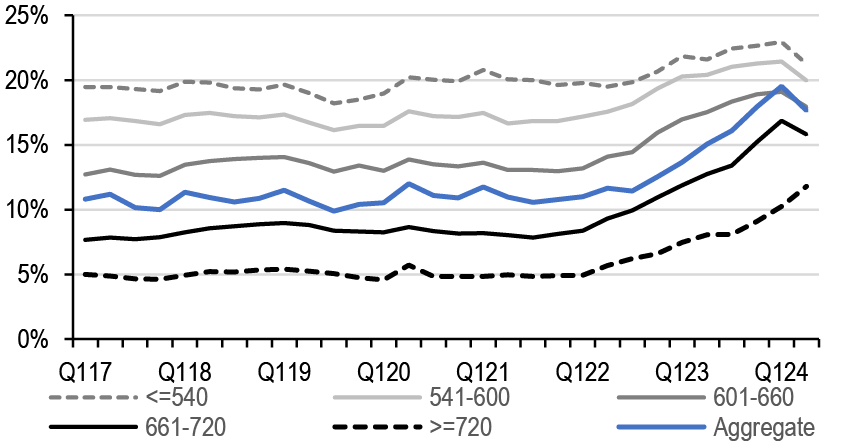
Source: J.P. Morgan, form ABS-EE via 1010data
Figure 130: Original terms for new vehicle loans by credit score bands and origination quarters in public auto loan ABS pools since 2017
Weighted average original loan terms (months)
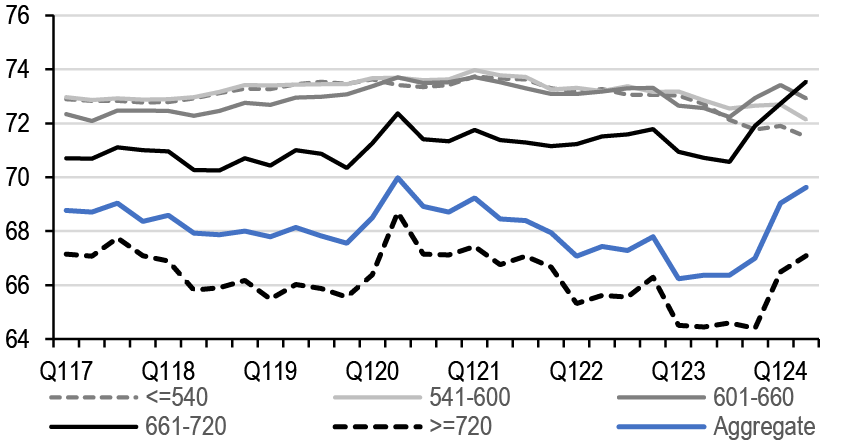
Source: J.P. Morgan, form ABS-EE via 1010data
Figure 131: Original terms for used vehicle loans by credit score bands and origination quarters in public auto loan ABS pools since 2017
Weighted average original loan terms (months)
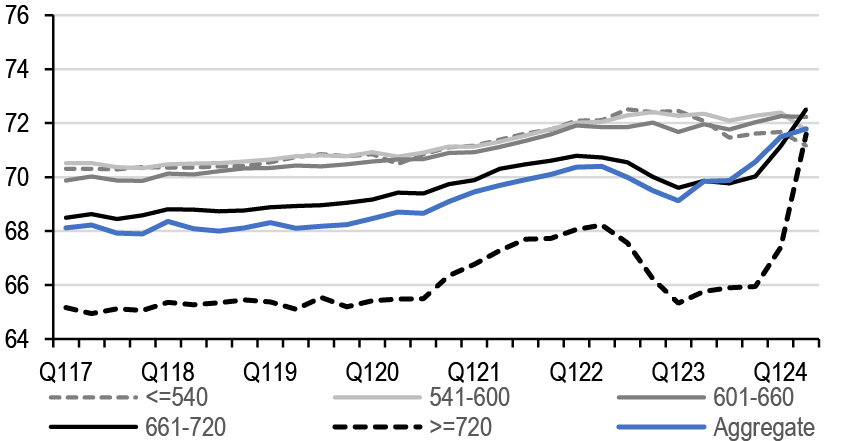
Source: J.P. Morgan, form ABS-EE via 1010data
Figure 132: Monthly scheduled payment for new vehicle loans by credit score bands and origination quarters in public auto loan ABS pools since 2017
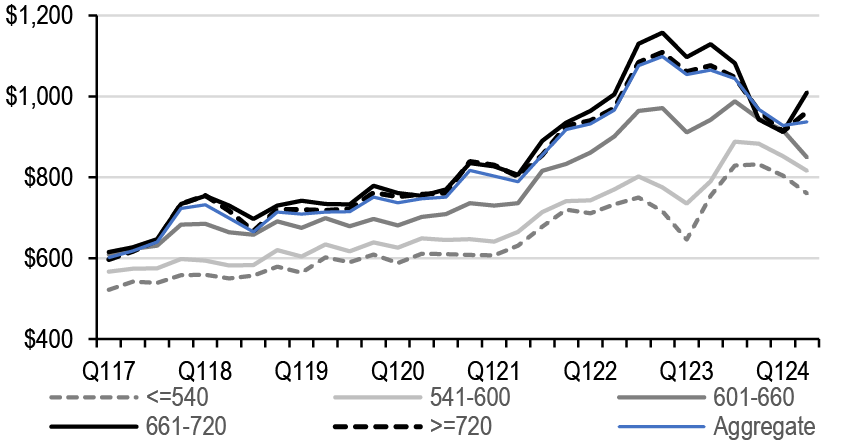
Source: J.P. Morgan, form ABS-EE via 1010data
Figure 133: Monthly scheduled payment for used vehicle loans by credit score bands and origination quarters in public auto loan ABS pools since 2017
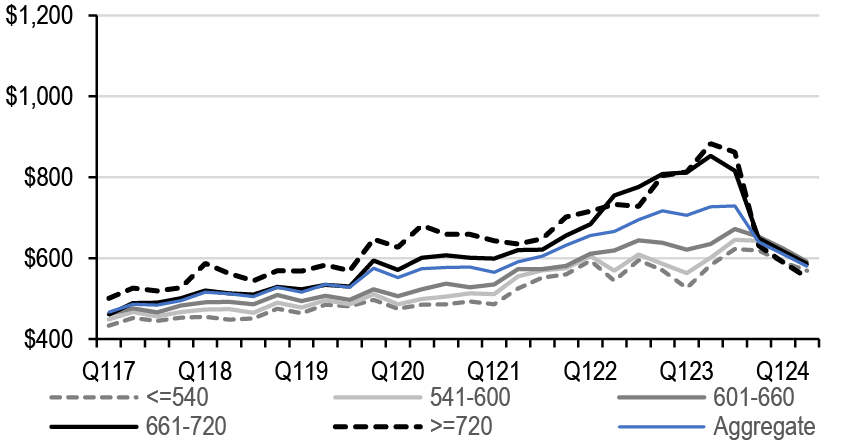
Source: J.P. Morgan, form ABS-EE via 1010data
At the JP Morgan Automotive Conference1 (August 7th and 8th), senior leaders and industry experts noted a more modest decline in used car values, with consensus pointing to firmer second-half pricing compared to the first half of 2024. This outlook reflects the declining supply of off-lease units in the year ahead and into 2025 ( Figure 134). For context, the retail lease share of retail sales had declined to 17.3% in 2022 (monthly average), compared to 24.1% in 2021 and 28.1% in 2020 ( Figure 135). The primary driver for this decrease was the supply shortage, coupled with lower OEM incentives as well as consumers buying out expired leases then. Subsequently, the expected off-lease volume has also dropped. Additionally, softer economic conditions for consumers should support demand and provide technical support for used cars from an affordability perspective compared to new vehicles. Cox Automotive noted that the +2.6% month-over-month uptick in the Manheim Used Vehicle Value Index in July was primarily a correction of above-normal pricing declines in the prior three months and the increase also partly reflects the impact of declining off-lease supply. It was highlighted that lease maturities are likely to decline by approximately 1 million units on an annualized basis over the next 18 months. Cox also noted that July price fluctuations were driven by a shift in buying behavior by larger dealer groups that ramped up auction purchases to offset the off-lease supply crunch. This trend is evidenced by three-year-old vehicles registering the most pronounced pricing increases in July, as off-lease vehicles typically account for about 10% of franchise dealer used car sales. Going forward, Cox expects used vehicle pricing to exhibit normal seasonality throughout the remainder of the year. The tightness in off-lease supply is likely to impose a floor on valuations over the near term, albeit with potential downside risk stemming from any acceleration in new vehicle production, higher automaker incentive levels, or another bout of rental car company de-fleeting (such as was seen with EVs in the first half of the year). Separately, Ally Financial previously noted in its 2Q24 earnings presentation that management expects full-year used vehicle prices to be down 5%, with 3% realized year-to-date and an additional 2% decline expected in the second half of 2024.
Figure 134: Off-lease volume estimates
000 units
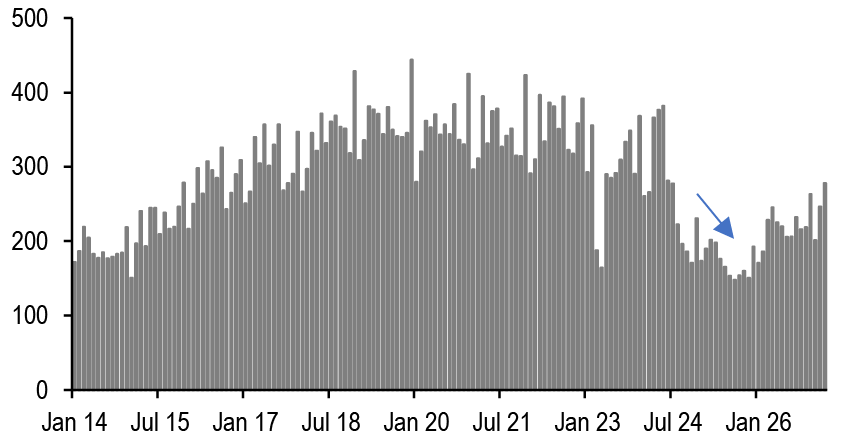
Source: J.P. Morgan, Bureau of Transportation Statistics
Figure 135: Lease share of retail auto sales
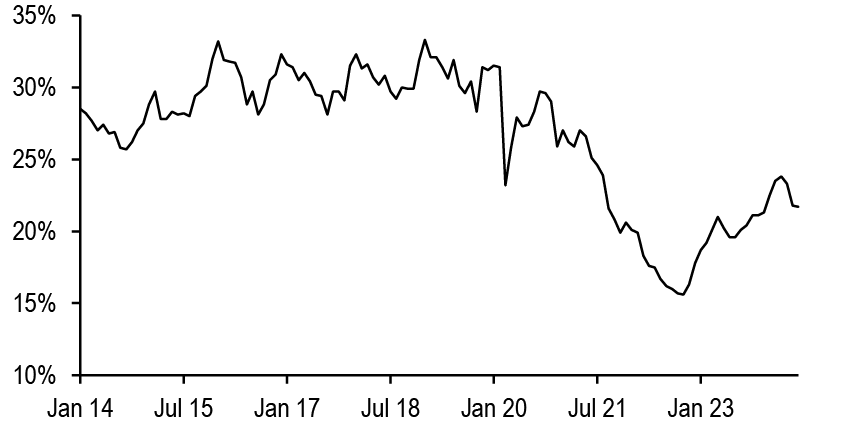
Source: J.P. Morgan, Cox Automotive
We note that, in line with the used vehicle trends, 2021 recovery rates had averaged 74.3% for new vehicles and 59.2% for used vehicles, significantly higher compared to the monthly pre-pandemic average recovery rates (through 2019) of 45.2% and 41.1%, respectively. We are now seeing a more normalized recovery rate environment, with the first half of 2024 tracking at 59.5% for new vehicles and 44.8% for used vehicles ( Figure 136). Based on the aforementioned comments from the conference, we do not expect a significant deviation from current recovery trends. Rating agencies have also adjusted their base case recovery rate assumptions amidst the slowing used vehicle market, which had seen record highs in prior years. For instance, KBRA, for CRVNA 2024-N2, lowered its recovery rate assumption to 37.5% from 40.0% for CRVNA 2024-N1, and 45.0% for CRVNA 2023-N1 in the first half of 2023. On the other side of the credit spectrum, for prime auto captive pools, which are largely comprised of new vehicles and have significantly lower charge-off rates (and lower sensitivity in terms of dollar amount to recovery rates), recovery rate assumptions have been consistent at 50%.
Figure 136: Recovery rates for new and used segments of auto loan ABS pools versus the Manheim Used Vehicle Value Index
Recovery rate (left axis)
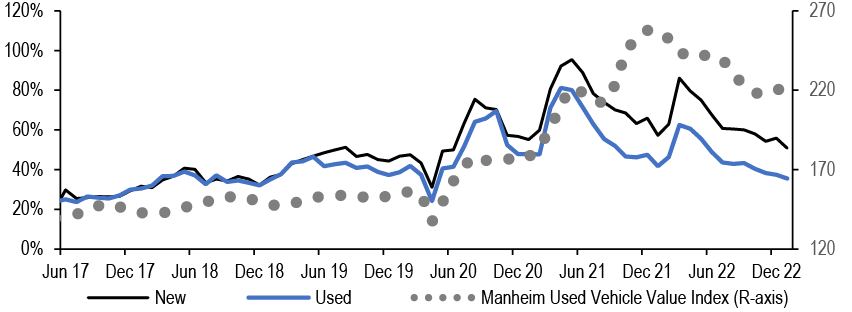
Source: J.P. Morgan, ABS-EE via 1010data, Manheim
Note: Base year January 1997 = 100 for Manheim Used Vehicle Value Index
Week in review
9 ABS transactions totaling $8.1bn across whole business, auto fleet, auto lease, prime and non-prime auto priced this week. This brings 2024 year-to-date ABS supply to $219.5bn, versus $171.8bn over the same period last year. August supply currently stands at $13.5bn versus $23bn over August 2023. On the forward calendar, there are 3 deals totaling $1.6bn currently in pre-marketing. Spreads were mostly firm to tighter over the past week following some widening after the previous weeks’ market volatility. Our indicative benchmark spreads held firm for private credit student loan ABS and tightened 5-10bp for MPL, 2-5bp across the capital stack for credit card, 5-30bp for non-prime auto and 0-5bp for prime auto.
July credit card ABS data releases thus far from various issuers have been solid as expected. Total delinquencies across CHAIT, COMET, DCENT, BACCT were flat to 3bp higher than June, with the bulk of that increase in 60+/90+. CCCIT stood out as an exception in July with an 8bp increase in delinquencies, of which 4bp came from the 31-60 bucket. All of these five bankcard ABS issuers continue to see high payment rates above their historical levels. CHAIT’s principal payment rate of 50.37% for July, compared to 36.03% five years ago. DCENT’s reported payment rate was 29.01% for July versus 23.63% five years ago. Excess spreads remain at very healthy levels, with higher yields offsetting higher charge-offs. For example, CCCIT charge-offs in July increased to 2.59% from 2.47% in June, but excess spread also increased to 14.07% from 13.60% as yield increased to 22.75% from 22.15%. On aggregate, we expect bankcard ABS will continue to see strong credit trends in the year ahead with very minor deterioration in charge-offs in line with anticipated deteriorations in the unemployment rate. J.P. Morgan economists currently expect the unemployment rate to increase to 4.5% by 4Q24, and reach a high of 4.6% in 2Q25. Such weakness will put very little dent in the extremely healthy levels of excess spread currently available across credit card ABS.
Data appendix
Figure 137: ABS supply
$bn
| 2020 | 2021 | 2022 | 2023 | 2023 YTD | 2024 YTD | |
| Credit Cards | 4 | 17 | 32 | 23 | 13.1 | 15.6 |
| Bank/Charge | 4 | 17 | 30 | 21 | 11.8 | 13.1 |
| Retail | 0 | 0 | 2 | 2 | 1.4 | 2.5 |
| Autos | 98 | 132 | 110 | 146 | 98.5 | 119.2 |
| Prime Loan | 46 | 50 | 50 | 73 | 50.0 | 56.0 |
| Non-prime Loan | 28 | 43 | 33 | 34 | 23.5 | 29.3 |
| Lease | 19 | 27 | 16 | 23 | 14.5 | 21.1 |
| Fleet & other | 6 | 13 | 11 | 16 | 10.6 | 12.8 |
| Student Loans | 17 | 26 | 7 | 7 | 4.3 | 7.2 |
| FFELP | 5 | 8 | 0 | 0 | 0.0 | 0.0 |
| Private Credit | 12 | 18 | 7 | 7 | 4.3 | 7.2 |
| Equipment | 13 | 19 | 22 | 21 | 13.2 | 19.5 |
| Floorplan | 4 | 1 | 1 | 4 | 3.6 | 4.9 |
| Unsecured Consumer | 9 | 17 | 16 | 14 | 9.3 | 11.4 |
| MPL | 4 | 8 | 9 | 8 | 5.2 | 4.4 |
| Branch & other | 5 | 9 | 7 | 7 | 4.1 | 7.0 |
| Miscellaneous | 34 | 55 | 56 | 41 | 29.7 | 41.7 |
| Total ABS | 179 | 267 | 244 | 256 | 171.8 | 219.5 |
| % 144A | 57% | 61% | 50% | 56% | 56% | 61% |
| % Floating-rate | 4% | 5% | 4% | 7% | 6% | 9% |
Source: J.P. Morgan.
Figure 138: Other ABS supply
$bn
| 2020 | 2021 | 2022 | 2023 | 2023 YTD | 2024 YTD | |
| Franchise/Whole Bus. | 4.8 | 13.7 | 6.6 | 1.7 | 0.8 | 7.1 |
| Data Center | 2.6 | 6.2 | 1.0 | 5.9 | 3.7 | 4.8 |
| Device Payment | 4.4 | 3.1 | 5.3 | 4.5 | 3.0 | 4.5 |
| Fiber | 0.2 | 1.3 | 1.2 | 4.0 | 4.0 | 3.7 |
| Stranded Ast | 2.3 | 21.2 | 7.8 | 2.6 | 3.5 | |
| Solar | 2.7 | 3.2 | 4.0 | 4.2 | 6.2 | 3.5 |
| Timeshare | 1.9 | 2.4 | 2.6 | 2.5 | 1.6 | 2.4 |
| Insurance | 2.2 | 1.1 | 2.3 | 2.4 | 1.9 | 2.2 |
| Aircraft | 2.6 | 8.5 | 1.1 | 0.7 | 1.7 | |
| Containers | 7.3 | 5.6 | 0.8 | 0.3 | 0.3 | 1.7 |
| SBL | 0.4 | 1.0 | 1.7 | 1.1 | 0.7 | 0.8 |
| Railcar | 0.5 | 2.8 | 0.9 | 0.2 | 0.6 | |
| Trade Rec. | 0.3 | 0.5 | ||||
| Healthcare | 0.4 | 0.4 | 0.4 | 0.2 | 0.5 | |
| Taxes | 0.5 | 0.1 | 0.3 | 0.4 | 0.3 | |
| PACE | 0.3 | 0.8 | 0.5 | 0.7 | 0.6 | 0.3 |
| Miscellaneous | 4.0 | 2.3 | 6.3 | 4.1 | 3.7 | 3.8 |
| Total Other ABS | 34.4 | 55.2 | 56.0 | 40.8 | 29.7 | 41.7 |
Source: J.P. Morgan.
Figure 139: ABS spread performance
bp
| Benchmark | Current | 1-week | 10-week | |||
| 8/15/2024 | Change | Avg | Min | Max | ||
| Credit Card - Fixed Rate | ||||||
| 2-yr AAA | Treasury | 47 | 0 | 44 | 42 | 47 |
| 3-yr AAA | Treasury | 50 | 0 | 48 | 46 | 50 |
| 5-yr AAA | Treasury | 57 | 0 | 54 | 51 | 57 |
| 10-yr AAA | Treasury | 82 | 0 | 79 | 76 | 82 |
| B-Piece (5-yr) | Treasury | 88 | 0 | 84 | 81 | 88 |
| C-Piece (5-yr) | Treasury | 135 | 0 | 129 | 125 | 135 |
| Credit Card - Floating Rate | ||||||
| 2-yr AAA | SOFR | 48 | 0 | 44 | 43 | 48 |
| 3-yr AAA | SOFR | 58 | 0 | 54 | 53 | 58 |
| 5-yr AAA | SOFR | 83 | 0 | 79 | 78 | 83 |
| 10-yr AAA | SOFR | 113 | 0 | 109 | 108 | 113 |
| B-Piece (5-yr) | SOFR | 108 | 0 | 112 | 108 | 113 |
| C-Piece (5-yr) | SOFR | 158 | 0 | 158 | 158 | 158 |
| Auto - Prime | ||||||
| 1-yr AAA | Treasury | 45 | 0 | 40 | 36 | 45 |
| 2-yr AAA | Treasury | 62 | 0 | 56 | 52 | 62 |
| 3-yr AAA | Treasury | 72 | 0 | 65 | 62 | 72 |
| 3-yr AA | Treasury | 100 | 0 | 92 | 80 | 100 |
| Student Loans (FFELP) | ||||||
| 3-yr AAA | SOFR | 95 | 0 | 93 | 90 | 95 |
| 7-yr AAA | SOFR | 112 | 0 | 111 | 110 | 112 |
| Private Credit Student Loan | ||||||
| 3-yr AAA | SOFR | 115 | 0 | 105 | 100 | 115 |
| Unsecured Consumer MPL | ||||||
| 1-yr AAA | Treasury | 95 | 0 | 81 | 75 | 95 |
| 3-yr AA | Treasury | 150 | 0 | 132 | 125 | 150 |
| 3-4yr A | Treasury | 190 | 0 | 173 | 170 | 190 |
| 3-4yr BBB | Treasury | 275 | 0 | 248 | 240 | 275 |
| 3-4yr BB | Treasury | 500 | 0 | 469 | 460 | 500 |
| Auto - Subprime | ||||||
| 1-yr AAA | Treasury | 65 | 0 | 61 | 55 | 65 |
| 2-yr AAA | Treasury | 85 | 0 | 76 | 65 | 85 |
| 3-yr AA | Treasury | 105 | 0 | 92 | 85 | 105 |
| 3-yr A | Treasury | 130 | 0 | 114 | 105 | 130 |
| 3-yr BBB | Treasury | 175 | 0 | 151 | 140 | 175 |
| 3-yr BB | Treasury | 380 | 0 | 348 | 335 | 380 |
Source: J.P. Morgan.
Figure 140: Fixed-rate AAA ABS (3-year) spreads to Treasury
bp
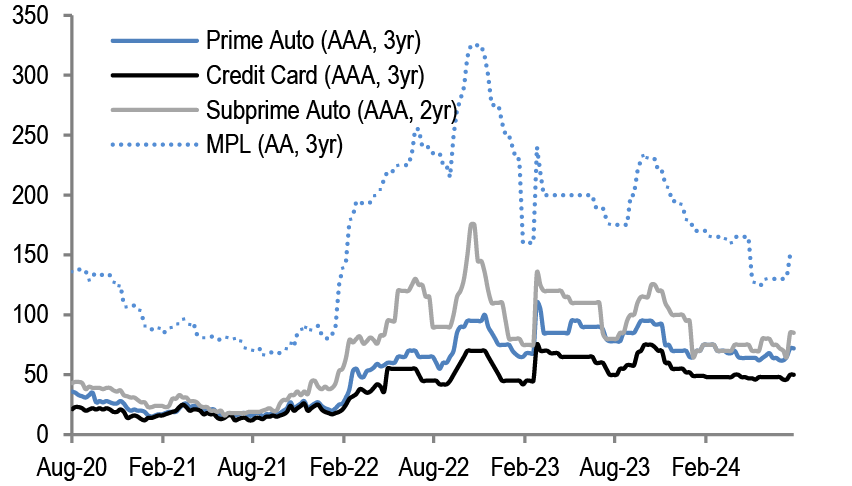
Source: J.P. Morgan.
Figure 141: Floating-rate AAA ABS (3-year) spreads to SOFR
bp
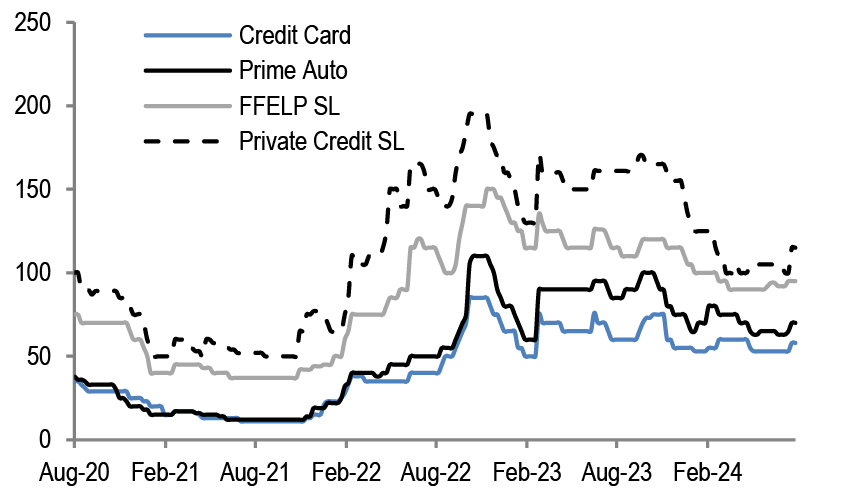
Source: J.P. Morgan. Note: Spreads to LIBOR till June 29, 2023 and to SOFR since then.
Figure 142: AAA cross sector spreads (3-year) to Treasury/SOFR
bp
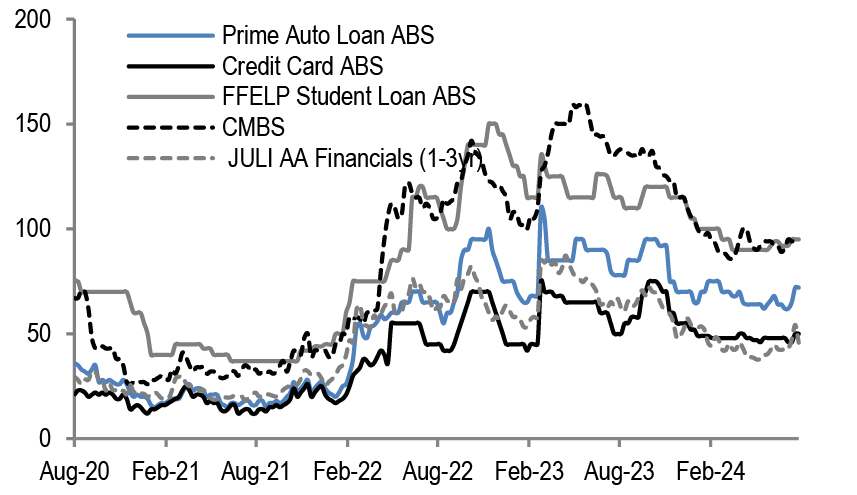
Source: J.P. Morgan. Note: FFELP Student Loan ABS spread to LIBOR till June 29, 2023 an to SOFR since then.
Figure 143: BBB subprime auto ABS (3-year) and MPL unsecured consumer ABS (3-4year) vs. BBB financials to Treasury
bp
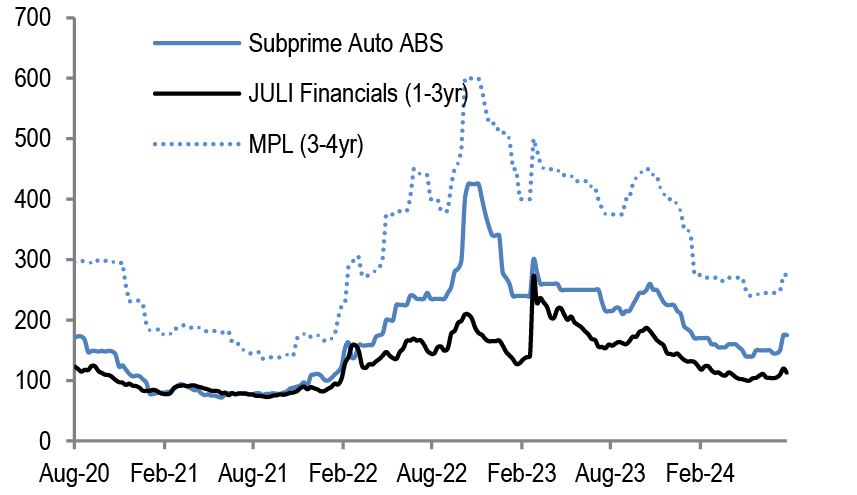
Source: J.P. Morgan.
Figure 144: ABS secondary trading weekly TRACE volume
$bn
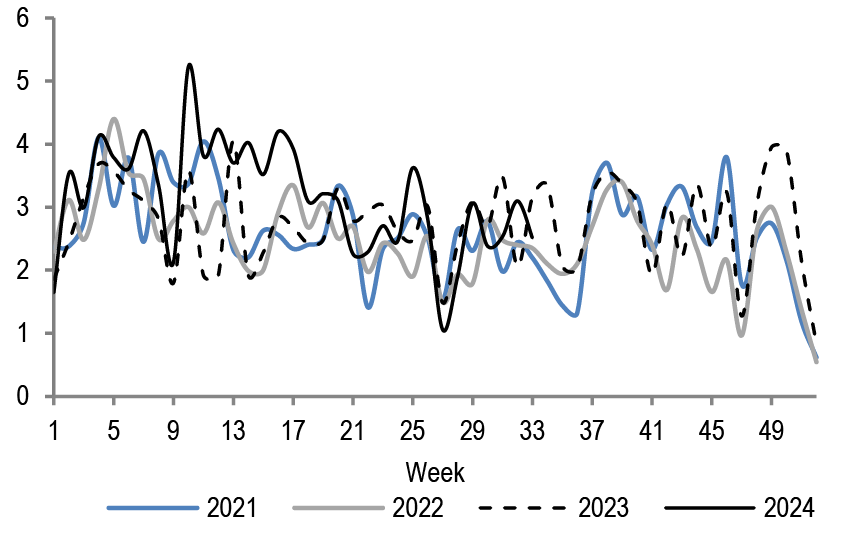
Source: J.P. Morgan, TRACE
High Yield
- High-yield bond yields collapsed to a low since August 2022 over the past week amid a Goldilocks narrative of growth without inflation. Real-time indicators of US GDP growth have improved since the weak payroll report (retail sales, claims, ISM services), and the inflation data has moderated enough to warrant a Fed rate cut in September. Meanwhile, 2Q earnings are meeting elevated consensus (HY Earnings Tracker). And amidst improving sentiment, capital market activity rose to a 3-month high (11 deals for $9.4bn). HY bond yields and spreads declined 13bp and 15bp over the past week to 7.65% and 369bp, respectively, which are 6bp lower and 6bp higher in August. And high-yield bond spreads of 369bp are well inside last week’s wide of 424bp, whereas yields (7.65%) too are 35bp below last week’s high. And tightening 48bp, 52bp, 55bp off the wide, BB, B, and CCC spreads are now wider by 1bp, 16bp, and 42bp in August, respectively. The HY index is up +0.58% in August which boosts 2024’s gain to +5.45%.
- Rising $0.12 w/w, leveraged loan prices have now recouped two-thirds August’s decline (-$0.23 MTD) and the % of loans trading above Par has recovered to 34%. Retail outflows also moderated week-over-week after producing the 4th largest weekly withdrawal on record (-$670mn vs -$3.1bn), and capital markets produced the lightest issuance over the past week of 2024 (12 deals for $5.1bn). Leveraged loan yields and spreads (to maturity) decreased 11bp and 4bp over the past week to 8.06% and 465bp, which are 11bp lower and 4bp higher in August, respectively. And leveraged loans are up +0.2% in August which has YTD gains at +5.5%.
- We provided an update on Private Credit activity here. Direct lending volume rose to a multi-year high in July ($30.8bn, +14% m/m) amid elevated refinancing (34%) and a 10-month high for LBO activity ($11.7bn). For reference, July PC activity was 42% above 1H24’s pace and July’s rise in direct LBO activity coincided with a rise in syndicated LBO loan volume ($8bn) to a 30-month high. And $161bn of private credit volume in 2024 consists of $50bn of direct LBO activity. Meanwhile, the median coupon for PC was flat m/m (-125bp YoY) at a low of S+525bp for the 3.5yr time series as pricing continues to realign with rallying syndicated markets. At a $98.5 OID, note the YTM (10.8%) was 253bp, 189bp, and 110bp wide to LL, B-, and B-rated loans. Note the 110bp gap between B3 loans and newly originated PC deals (+16bp m/m) was 188bp at YE23 and has averaged 91bp over the past 18 months. Also notable, PC’s median leverage in July increased 0.9x to a 2-year high 5.3x.Meanwhile, increased competition between private and syndicated markets has fueled $23.7bn of BSL deals refinanced into PC and $23.2bn of direct into syndicated loans YTD. More deals shifted to syndicated from private markets in July ($4.8bn vs $1.4bn) after seeing the pendulum shift in favor of private during 2Q ($17.8bn PC to takeout BSL vs $4.7bn BSL to takeout PC). While leveraged loans outstanding has stabilized in 2024 (-$3bn YTD), the issuer count has continued to decline (-81 YTD) which translates into growth in the average LL issuer size.
Credit Strategy Weekly Update
High-yield bond yields collapsed to a low since August 2022 over the past week amid a Goldilocks narrative of growth without inflation. The real-time indicators of US GDP growth have improved since the weak payroll report (retail sales, claims, ISM services), and the inflation data has moderated enough to warrant a Fed rate cut in September. With the VIX sliding to 15, the only question now is whether it will start with a 50bp cut (JPM forecast) or a more modest 25bp cut. The deciding factor for this will depend on how big a bounce back the August payroll report on September 6th delivers. Meanwhile, 2Q earnings are meeting elevated consensus (High Yield Earnings Tracker) and are proving supportive of investors wading back in. And amidst a sharp improvement in sentiment, capital market activity improved to a 3-month high. High-yield bond yields and spreads declined 13bp and 15bp over the past week to 7.65% and 369bp, respectively, which are 6bp lower and 6bp higher in August.And high-yield bond spreads of 369bp are now well inside last week’s wide of 424bp, whereas yields (7.65%) too are 35bp below last week’s high. Yields are now at a low since August 2022. And tightening 48bp, 52bp, 55bp off the wide, BB, B, and CCC spreads are now wider by 1bp, 16bp, and 42bp in August, respectively.
HY Spreads are 55bp below last week’s high alongside a collapse in the VIX to 15
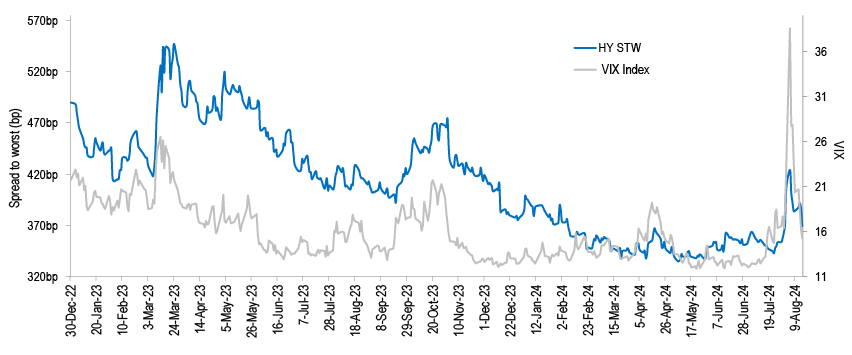
Source: J.P. Morgan.
The HY index is up +0.58% in August with CCCs (+0.43%) underperforming Single Bs (+0.46%) and BBs (+0.68%). And from a sectoral basis there is dispersion with Telecom (+3.34%) outperforming and Media (-0.48%) and Autos (-0.32%) lagging. By rating, BB bond yields are now 6.23% (-11bp w/w), B yields are 7.56% (-12bp w/w) and CCC yields are 13.12% (+17bp w/w). And BB spreads are now 228bp (-11bp w/w, -11bp YTD), B spreads are 360bp (-12bp w/w, -7bp YTD), and CCC spreads are 917bp (+4bp w/w, +45bp YTD).HY/IG spreads of 270bp (-7bp w/w, -2bp YTD) are now 6bp below their 12M average, while BBB/BB spreads of 105bp (-3bp w/w, -3bp YTD) are 7bp below the 12M average and 18bp above their low since April 2019. Andthe HY index is providing a +5.45% gain in 2024 with CCCs (+8.05%) outperforming Single Bs (+5.15%) and BBs (+4.91%). Industries outperforming year-to-date include Healthcare (+8.94%) and Autos (+8.26%) and underperforming are Cable/Sat. (-0.13%) and Media (+1.02%). Meanwhile, 11 deals priced this week totaling a 12-week high $9.35bn which increased August high-yield issuance to $17.8bn ($6.2bn ex-refi). HY new-issue volume totaling $202.8bn ($44.3bn non-refi) year-to-date compares with $109.8bn ($40.2bn ex-refi) of issuance YTD23.
BB, B, and CCC spreads are now wider by 1bp, 16bp, and 42bp in August, respectively

Source: J.P. Morgan.; S&P/IHS Markit
Leveraged loan prices have now recouped two-thirds August’s decline (-$0.23 MTD) as sentiment responds favorably to abating growth concerns. Retail outflows also moderated week-over-week after producing the fourth largest weekly withdrawal on record ($670mn vs $3.1bn), and capital markets produced the lightest issuance over the past week of 2024.Loan prices increased $0.12 over the past week to $96.83 with Ba1/Ba2/Ba3 prices rising $0.05 to $99.67, B1 prices increasing $0.08 to $99.05, B2 prices increasing $0.10 to $98.30, B3 prices rising $0.19 to $95.69, and Caa1/Caa2/Caa3 prices increasing $0.97 to $79.50. Leveraged loan yields and spreads (to maturity) decreased 11bp and 4bp over the past week to 8.06% and 465bp, which are 11bp lower and 4bp higher in August, respectively. And the yield-to-maturity for the leveraged loan index of 8.17% is now 51bp above the HY bond index (7.65%), which is comparable to an average 73bp above over the past year. Meanwhile, the sub-$80, $80-$89.99, $90-$94.99, $95-$97.99, $98-$98.99, $99-$99.99, and $100+ buckets for Loans are now at 2.91%, 4.02%, 5.30%, 8.63%, 7.10%, 38.01%, and 34.02%—the % of leveraged loans trading above Par is 30% below its high in mid-May. The LeveragedLoan index is providing a gain of +0.15% in August which is underperforming bonds by 42bp for a fourth consecutive month. The Leveraged Loan index is providing a +5.48% gain in 2024.YTD, Moody’s rated BB, B1, B2, B3, and CCC-rated loans are returning +4.94%, +5.41%, +5.02%, +5.83%, and +9.65%, respectively. Industries outperforming year-to-date include Telecom (+7.48%) and Utility (+7.42%) and underperforming are Broadcasting (+0.96%) and Cable/Sat. (+3.08%). Meanwhile, CLO volume totals $27.1bn in August ($8.4bn ex-refi/resets) and totals $120.3bn ($270.9bn gross) YTD. And twelve deals priced this week for a YTD low $5.1bn which has August issuance at $23.7bn ($7.8bn ex refi/repricing). As such, year-to-date, institutional loan issuance totals $809bn which includes $432bn of repricing (53%), $285bn of refinancing (35%), and $92bn of non-refi/repricing (12%).
The % of loans trading above par has recovered to 34%
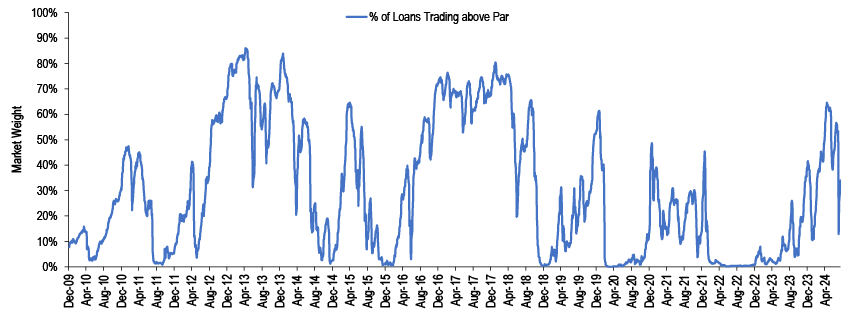
Source: J.P. Morgan.; S&P/IHS Markit
Leveraged loans are underperforming high-yield bonds for a fourth consecutive month in August
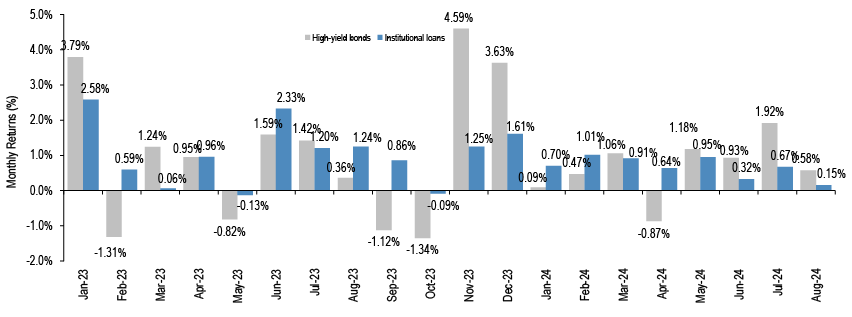
Source: J.P. Morgan.
This report was excerpted from, Credit Strategy Weekly Update, Nelson Jantzen, August 16th, 2024
CLO
Investor FAQ
- We’ve had significant client interest following recent notes including the Outlook (here), Equity Timing (here), and Spread Forecast Revision (here). We summarize some of the questions, thank readers for their interest, and wish you a restful summer.
- Why did you change your spread forecast? We widened our base case CLO T1 AAA new issue spread forecast to 150bp (from 130bp prior) and introduced a 175-200bp recession case. The implied base case moves are modest (+15 /+25bp for US / Euro). JPM expects the Fed to cut 50bp at both the September and November meetings followed by 25bp cuts at every meeting thereafter. Historically, the start of Fed easing cycles coincided with negative performance for risky assets. It’s also logical to expect weaker demand for floaters. For context, Loan funds had the largest outflow since January 2019 (here) and we estimate CLO ETFs experienced outflows in the last week’s volatility ( Figure 145). More broadly, our FX strategists believe that 75% of carry trades have been unwound, but the clock is ticking for the G10 carry trade (here).
- The “hot” CLO market. Clients observe people movement as activity and AUM grow. We discussed our FY24 global gross issuance forecast of ~$370bn, about half of which is $180bn US refi/reset (~$370bn includes Euro in USD equivalent). We’d avoid over-generalization, but while many clients see upside to call activity, they also anticipate slowing new issuance relative to 1H and expect that FY24 total global gross will not exceed the record ~$425bn in 2021.
- What are people buying? Investors have been trying to avoid above-par with more appetite for par-priced new issue and wider spreads (term curve). CLO BWIC volumes are down y/y relative to US Credit trading volumes which are up in other credit markets (here). Some investors see value in Mezz as in for those who need to fund liabilities in a high interest rate environment. CLO Equity attracts questions around longer-term value, if more so from managers; conversely, new debt investor due diligence is very much cognizant that spreads are fairly tight now.
- My Kingdom for a Leveraged Loan. CLO managers are mentioning challenges with warehouse and/or ramp. Some tell us they are situationally turning down upsize requests or pushing out a transaction that was planned for this year into 25Q1/later. Managers seem to think it is unlikely there will be a significant revival in M&A and LBO activity this year, citing not just high rates but also US election uncertainty, though there is potential for a pickup when some of these event risks pass.
- Et tu, Private Credit? Some investors who were active in Private Credit/Middle Market are pausing as the basis tightens to BSL. Notably, the AAA basis has been ~25-30bp for PCLO to T1 BSL over the past few months and can be as wide as ~50-100bp in more stressed markets (see our March 15th note). There is, however, continued focus on the PCLO space and lot’s of discussion of the continued fungibility of public/private issuers as debt capital markets remain open and liquid.
What are investors saying?
J.P. Morgan CLO Strategy has had a significant amount of client feedback following publications including the MY24 Outlook (here), Equity Timing (here), and Spread Forecast Revision (here). We summarize some of the questions, thank readers for the steadfast interest, and wish you a restful summer.
Why did you change your spread forecast?
We widened our CLO T1 AAA new issue spread forecast to 150bp (from 130bp prior) and introduced a 175-200bp recession case. While we did not seem to receive as much pushback from clients as in April (when we had lowered our then-current target to 130bp) the implied moves from the 8/6 report are pretty modest, or circa 15-25bp for US and Euro, as we think valuations need only modest additional risk premia assuming volatility/uncertainty but US growth continues. JPM expects the Fed to cut 50bp at both the September and November meetings followed by 25bp cuts at every meeting thereafter. Historically, the start of Fed easing cycles coincided with negative performance for risky assets. It’s also logical to expect weaker demand for floaters. The largest loan fund outflow since January 2019 also implies loans are even more reliant on CLO demand, posing risks to the feedback loop between the two markets (here). We estimate CLO ETFs experienced a total of -$241mm withdrawals last week during the pickup in leveraged carry unwind ( Figure 145). More broadly, our FX strategists believe that 75% of carry trades have been unwound, but the clock is ticking for the G10 carry trade (here).
Figure 145: CLO ETFs experienced outflows recently
$mm
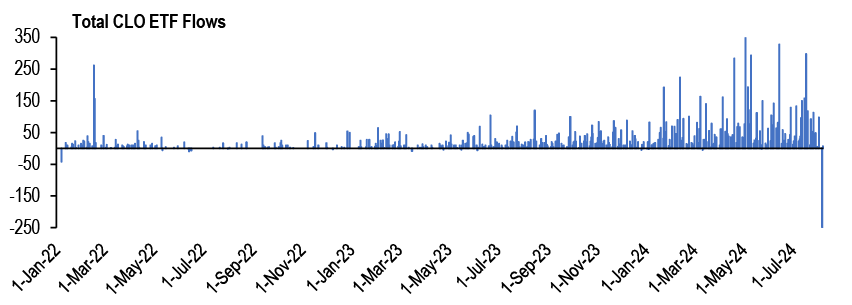
Source: J.P. Morgan, Bloomberg Finance, L.P. Based on daily sum of 10 US CLO ETFs’ fund flows.
The “hot” CLO Market
Clients tell us they see people movement around the market this year to ensure business resourcing as market activity, liquidity, and AUM grow. We also discussed our FY24 global gross issuance forecast of $370bn, about half of which is $180bn US refi/reset. By and large, clients feel the various forecasts may end up modestly under-predicting FY24, especially on call activity, and especially on resets. However, they anticipate a slight slowdown in new issuance relative to 1H and expect that FY24 total global gross will not exceed the record ~$425bn in 2021.
On balance, given the recent economic data and our expectations that T1 US CLO AAA Primary spreads could widen out to 150bp, it’s possible that refi/reset activity may not remain quite as strong. There is $140bn of deal notional, or 16% of the universe, coming out of non-call period in 2024, of which $109bn has a AAA margin that is wider than 130bp, suggesting that this cohort is currently in-the-money. Of this $109bn, there is only $48bn that has a AAA margin wider than 150bp. Moreover, $67bn of deal notional is exiting reinvestment in 2024, of which $51bn has a AAA margin wider than 130bp and is able to reset to extend and capture lower funding costs, but only $9bn is wider than 150bp. Given our view that spreads will widen to 150bp by by year-end, some widening will make it less favorable to reset/refinance the liabilities over the course of the year.
Table 1: What US BSL CLOs are “in-the-money” by reinvest year?
| US BSL CLOs ($bn) | Reinvest Year | ||||
| AAA Margin | 2023 and Earlier | 2024 | 2025 | 2026 | 2027 and Later |
| <120 | 24.4 | 3.9 | 1.6 | 0.0 | 0.0 |
| 120-130 | 66.1 | 12.6 | 5.3 | 9.7 | 0.8 |
| 130-140 | 54.1 | 32.3 | 7.6 | 63.7 | 49.5 |
| 140-150 | 29.0 | 9.6 | 6.6 | 133.9 | 75.7 |
| 150-160 | 7.2 | 3.6 | 8.5 | 16.2 | 80.4 |
| 160-170 | 1.4 | 1.7 | 4.1 | 6.4 | 28.5 |
| 170-180 | 0.5 | 3.5 | 2.0 | 1.6 | 27.1 |
| >=180 | 1.1 | 0.0 | 0.3 | 12.5 | 80.2 |
| Total | 183.8 | 67.2 | 36.0 | 244.1 | 342.3 |
| Total % of Total Deal Notional | 21.0% | 7.7% | 4.1% | 28.0% | 39.2% |
| Total >130bp | 93.3 | 50.7 | 29.1 | 234.4 | 341.5 |
| Total >130bp % of Total Deal Notional | 10.7% | 5.8% | 3.3% | 26.8% | 39.1% |
| Total >150bp | 10.2 | 8.8 | 14.9 | 36.7 | 216.3 |
| Total >150bp % of Total Deal Notional | 1.2% | 1.0% | 1.7% | 4.2% | 24.8% |
Source: J.P. Morgan, INTEX. Based on 1,942 Largest AAA CLOIE tranches.
Where is the value?
Investors tell us they’re trying to avoid tight-spread/above-par tranches as best they can, which means more appetite for par-priced new issue that also comes with wider spreads given the term curve. This would seem consistent with our own observation that CLO secondary BWIC volumes are down this year relative to broader US Credit secondary trading volumes (see here). Some investors believe there is more value in Mezz than in Seniors especially those who need to fund liabilities in a high interest rate environment. CLO Equity continues to attract many questions/interest around themes such as longer-term value at current tight liability spreads, if more so from managers than from investors. Conversely, newer debt investor due diligence is very cognizant that spreads are near post-GFC tights.
My Kingdom for a Leveraged Loan
This is not new, but many CLO managers are mentioning growing challenges with warehousing and/or ramp times. Some managers tell us they are situationally turning down upsize requests from their debt investors or pushing out a transaction that was planned for this year into 25Q1/later. Managers seemed to think it is unlikely there will be a significant revival in M&A and LBO activity this year citing not just high rates but also US election uncertainty, though there is potential for a pickup when some of these event risks pass.
Et tu, Private Credit?
Some investors who were active in Private Credit/Middle Market are pausing as the spread basis tightens to regular-way/BSL CLOs. For example, the AAA basis compressed to around 25-30bp for PCLO to T1 BSL over the past few months, but this basis can be as wide as ~50-100bp in more stressed market environments (see our March 15th publication for historical basis). There is, however, continued focus on the PCLO space and lot’s of discussion of the continued fungibility of public/private issuers as capital markets remain open and liquid.
Municipal Markets Weekly
Value in long TX PSF 4s, Muni total return/fund flows/rating activity during Fed easing cycles
- This week’s benign inflation reports should keep the Fed on track to ease in September, with August employment expected to inform the outcome.
- July state unemployment data rates rose m/m in 29 states, four at a faster pace than the nation. Y/Y, rates are up in 43 states, five at a faster pace than the nation. Ten states now have rates above 4.5%, up from eight in June. Details within.
- Markets are pricing in a less dovish path than our forecast, but our rates team remain patient before adding duration given long investor positioning. Policy is more restrictive than at any point in the last 30 years, pointing toward a deeper easing cycle, but financial conditions are easy and financial stress is low, making the case for a slower pace of cuts. They hold 5s/30s steepeners as a low-beta long with a better carry profile ahead of the first cut.
- Generally cheaper market levels and mid-August reinvestment are supportive of market performance next week, but market reception for yet another +$10bn te supply week will hinge on rate vol and resulting ETF flows. Looking beyond August, we see continued opportunities to buy bonds in the fall, given the prospect of weaker election-related municipal market technicals.
- Issuance is set to pick back up next week, to $11.7bn, or 1.3x the trailing 5yr average for the equivalent week. Expected tax-exempt supply of $11.0bn is back above the $10bn mark, where it has been in every non-Fed and non-CPI week since May, and 1.5x the average, while taxable issuance of just $645mn would be 35% the average.
- LSEG Lipper reported municipal fund inflows for the 7th consecutive week, totaling +$529mn (+$296mn open-end funds/+$233mn ETFs). With almost all funds reporting, flows for July are tracking around+$6.6bn (+$3.5bn open-end funds/+$3.2bn ETFs), bringing YTD inflows to +$18.4bn (+$12.4bn open-end funds/+$6.0bn ETFs).
- Discount 20Yr AAA TX PSF 4s offer value vs. generic AA 4s and an opportunity to add higher beta assets in advance of a declining rate environment. Given our belief that an easing cycle is in the offing, we recommend this high-quality, but still volatile structure.
- Generally speaking, municipal bonds had strong annual returns during most easing cycles, except for the brief easing cycle in 1998 and the financial crisis in 2008.
- HY munis have historically underperformed IG munis in easing cycles. However, HY posted far stronger returns in the later stages of the easing cycles.
- We estimate the average ten-year cumulative default rate for the rated municipal market is very low at only 0.2%, compared to 8.0% for global corporates, 10.9% for U.S. corporates, and 7.3% for sovereign markets, based on the average of the latest reported rating agency statistics.
- This week we drill down deeper into sub-sectors of the municipal market to uncover particular strength/weakness in past downturns. Our analysis suggests that heightened credit scrutiny of all credits may be beneficial in periods of economic stress and in the years following.
- We are not suggesting that investors avoid sectors of the market which have experienced a greater number of downgrades over time. Instead, investors with dedicated credit resources may lean into more idiosyncratic sectors as a means of performance differentiation, by positioning solid spread sector credits.
The spate of tax exempt issuance is expected to persist, with market reception shifting on rate volatility and the related impact on ETF flows. We see highlight value in long PSF 4s and provide historical context for heightened ratings risk herein
Next week, tax-exempt supply returns to the $10bn+ pace we have seen in every non-Fed and non-CPI week since May, against a backdrop of broadly supportive fund flows (7 consecutive inflow weeks), somewhat better dealer positions (although still heavy), and mid-August reinvestment to spend. On net, with the expectation of persistent supply pressure and continued rate volatility, day-to-day and week-to-week market conditions are expected to be highly dependent on ETF flows (driven by rate volatility) and the level of reinvestment capital. Looking beyond August, we see continued opportunities to buy bonds in the fall, given the prospect of weaker election-related municipal market technicals.
Figure 146: Investors will continue to allocate mid-August reinvestment next week, which should be supportive of performance given some stability in the UST market
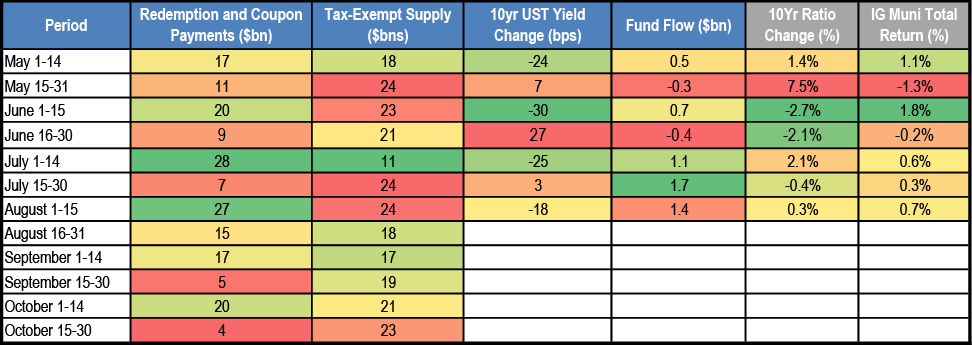
Source: Refinitiv, LSEG Lipper, Bloomberg Finance L.P., J.P. Morgan. Note: The above does not include reinvestment capital from current calls.
Through Thursday, tax-exempt bidwanteds were indicative of a well-funded investor, with week-to-date offerings down 11% from the trailing 5-week average. Bonds on offer were lower by 6-9% in 0-10yrs and by 11-18% in 10yrs and longer on the curve. Tax-exempt secondary going away business was 6% below the week-to-date mark, reflecting both fewer bonds to choose from and investor confidence that there will be ample new issue supply in the coming months to put capital to work. Purchases were down the most in 0-5yrs (-13%) and 20yrs+ (-7%).
Including today’s moves, HG muni yields on the week are down by 6-5bps in 2-5yrs, and up by 1-1bp in 10-30yrs, outperforming Treasuries by 7-2bps in 2-5yrs, but underperforming by 6-9bps in the 10-30yr spots on the curve.
Figure 147: WTD, HG muni yields are down by 3-3bps in 2-5yrs, and up by 1-1bp in 10-30yrs, outperforming Treasuries by 8-3bps in 2-5yrs, respectively, but underperforming by 3bps in 10yr and 30yr spots on the curve
WTD yield change, bps

Source: Refinitiv, ICE, J.P. Morgan
Yield and Spread Charts
In July, AAA HG muni yields ended the month down by 26-14-2-4bps in 2-5-10-30yrs, underperforming Treasuries by 12-19-22-9bps in the 2-5-10-30yrs, respectively. MTD AAA HG muni yields are lower by 27-21-11-9bps in 2-5-10-30yrs, but lag Treasuries by 0-2-10-11bps in 2-5-10-30yrs, respectively. Absolute yields continue to look attractive in the context of the trading range over the past three years and our longer-term projections for lower rates this year.
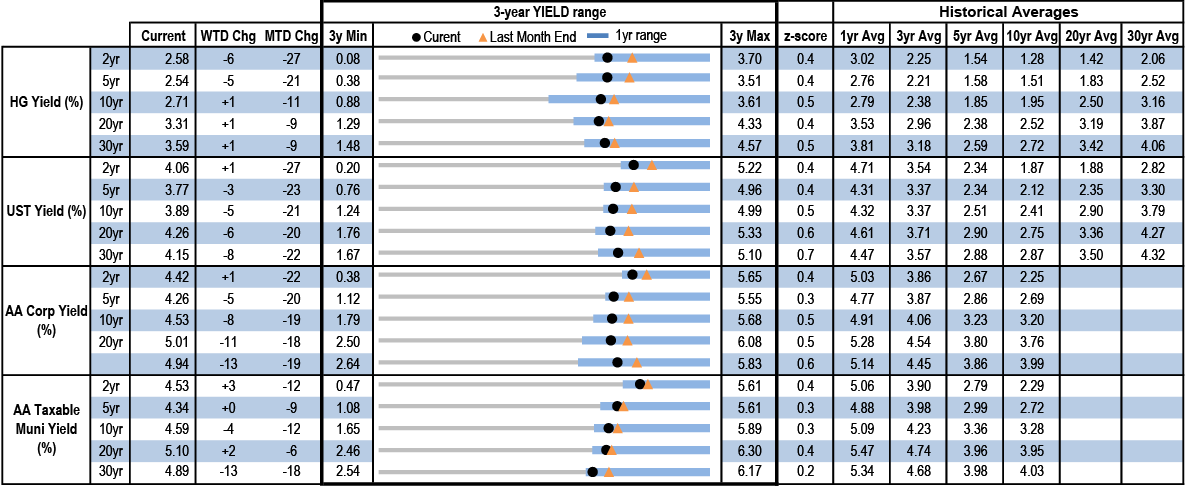
Source: Refinitiv, ICE, J.P. Morgan. Note: HG muni and UST yields as of 3pm 8/16/2024, other data as of 8/15/2024
In July, 5-10-30yr IG municipal ratios cheapened by 2-3%, save for the 2yr spot, which was flat. MTD ratios are up by 1-22ppts in 10-30yrs, while lower by 1-2ppts in 2-5yrs spots thus far this month. While we expect cheaper ratios in the fall, current relationships suggest transactional levels across the curve, and value is still most apparent in the longest portion of the tax-exempt market, with ratios on 30yr AA tax-exempts closest to the cheaper end of the range versus taxable municipals.
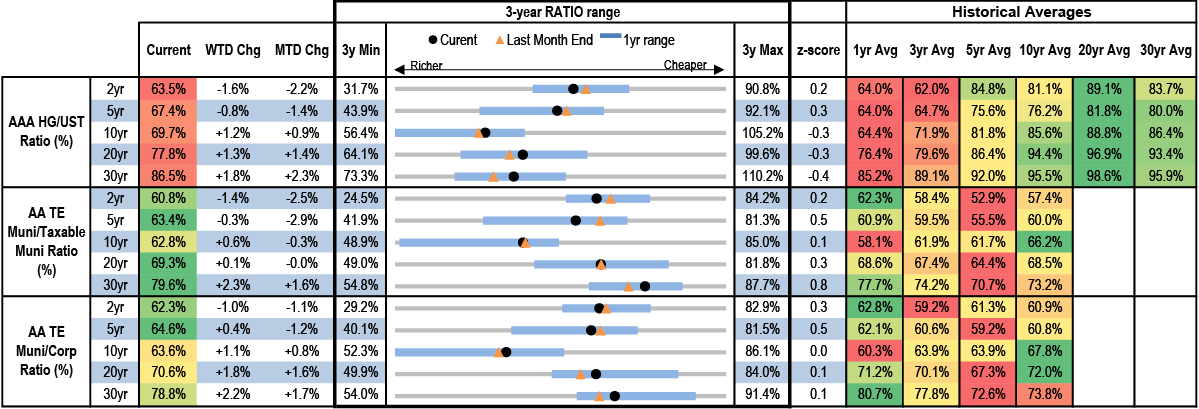
Source: Refinitiv, ICE, J.P. Morgan. Note: conditional formatting is based on current value and historical averages. Red indicates rich and green indicates cheapNote: HG/UST ratios as of 3pm 8/16/2024, other data as of 8/15/2024
Based on a 21% tax rate, the taxable equivalent yield for 30yr AA 4% tax-exempts provides38bps of spread pickup over similar structure corporates. 30yr AA taxable munis also only offer modest spread versus similar structure US Corporates.
Figure 148: Based on a 21% tax rate, the taxable equivalent yield for 30yr AA 4% tax-exempts provides a pick-up over similar structure corporates
Yield, %

Spread, bps

Source: ICE, J.P. Morgan
Note: As of 8/15/2024
Taxable municipal market spreads to corporates have narrowed considerably in 2024. 30yr AA taxable and A rated taxable munis offer modest spread versus similar structure US Corporates. The yield on 30yr AA taxable municipals (4.89%) has rallied since October but remains high relative to most periods over the past ten years.
Figure 149: The yield on 30yr AA taxable municipals has rallied since October, but remains high relative to most periods over the past ten years
Yield, %

Spread, bps

Source: ICE, J.P. Morgan
Note: As of 8/15/2024
This week’s benign inflation reports should keep the Fed on track to begin easing at its upcoming September meeting; the August payrolls report likely to determine how much
The section below contains excerpts from J.P. Morgan’s Daily Economic Briefings (latest here) and our economists’ commentary linked herein.
This week’s release of the July CPI report was broadly in line with expectations for a further cooling in inflation, which keeps the Fed on track to begin easing at its upcoming September meeting(Cooler July CPI, as expected, Michael Hanson, 8/14/24). The question now is whether it will start with a 50bp cut (JPM forecast) or a more modest 25bp cut. The deciding factor for this will likely depend on how big a bounceback the August payroll report delivers. Job gains in the 160-200k range will likely erase much of the fear invoked by the July labor report, while something in the low-100s will likely tip the risk balance toward growth and deliver a larger cut.
Tuesday’s July PPI release was also benign, with the headline up just 0.1% and core unchanged. The year-ago rate in core PPI is now just 2.4%oya, down from 3% in June. The core increase was greater when excluding the volatile trade service component, but the 1.3%m/m fall in trade services suggests an encouraging fading of firms’ pricing power (Disinflationary trend returns with July PPI, Michael Hanson, 8/13/24). This point was corroborated by the NFIB survey, which showed a further move down in the share of small businesses planning to raise prices. The NFIB’s headline measure of small business optimism jumped to its highest point since early 2022.
Meanwhile, an upward surprise to July retail sales suggests continued solid momentum for real consumer spending at the start of 3Q despite signs of normalization in the labor market. Total nominal retail sales increased 1.0% on the month, with sales of the important control group up 0.3% after a large 0.9% increase in June (July retail sales suggest no slowing in 3Q real spending, Abiel Reinhart, 8/15/24). Based on the retail data as well as a reported decline in utilities in this week’s IP report (total IP fell 0.6% in July, with manufacturing slipping 0.3%), our early expectation is that real PCE rose 0.2-0.3%m/m in July, and is on track for 3Q growth near the 2.3% pace from last quarter.
We also received US import prices data this week, which were a touch firmer than expected in July, with both the headline index and index that excludes imported fuels prices rising 0.1% on the month. The year-ago inflation rates for both series ticked up a tenth last month, to 1.7% for headline and 1.2% for the ex-fuels measure. Import prices for consumer goods (ex. autos) dipped 0.1% in July, but the year-ago pace accelerated to 0.7%. Goods prices continue to deflate in the US consumer price baskets, but some upward pressure from import prices should offset some of that deflationary pressure in coming months (July import prices firm slightly, Michael Hanson, 8/15/24).
In terms of the labor market, initial jobless claims declined by 7k to 227k for the week ending August 10, bringing the 4-week moving average down from its peak for the year. Continuing claims—which had seen a more concerning recent rise—fell by 7k to 1,864,000 for the week ending August 3. This week’s report does not suggest a major weakening in the labor market but rather a gradual slowing (Jobless claims moved down, Murat Tasci, 8/15/24).
The view from our rates team: Markets are pricing in a less dovish path than our forecast, but our rates team remain patient before adding duration given long investor positioning. Policy is more restrictive than at any point in the last 30 years, pointing toward a deeper easing cycle, but financial conditions are easy and financial stress is low, making the case for a slower pace of cuts. They hold 5s/30s steepeners as a low-beta long with a better carry profile ahead of the first cut.
Unemployment rates rose m/m in 29 states in July, four at a faster pace than the nation. Y/Y, rates are up in 43 states, five at a faster pace than the nation. Ten states now have rates above 4.5%, up from eight in June
Recall, the U.S. unemployment rate jumped 0.2%-point to 4.3% in July (+0.8% y/y), leading our economists to add 75bps of projected rate cuts to their forecast for 2024 (to 125bps on the year), and shift to serial (vs. quarterly prior) cuts at each FOMC meeting thereafter. State-level unemployment data for the month was released by the BLS today: m/m, unemployment rates rose in 29 states, four at a faster pace than the nation: MA, MI, MN and SC each rose 0.3%-point. On a year-over-year basis, unemployment rates increased in 43 states in July, five at a faster pace than the nation: RI (+1.8%), SC and OH (+1.1% each), WA (+1.0%), and MD (+0.9%). Ten states now have rates above 4.5%, up from eight in June: OH and RI are the new joiners ( Figure 150). Three states (CA, IL, NV) and DC have rates above 5.0%; this is unchanged from June.
Figure 150: Y/Y, unemployment rates rose in 43 states in July, five at a faster pace than the nation
July 2024 prelim state unemployment rate (%) (left axis); change in unemployment rate (%), oya (right axis). Sorted in descending order of % oya change.
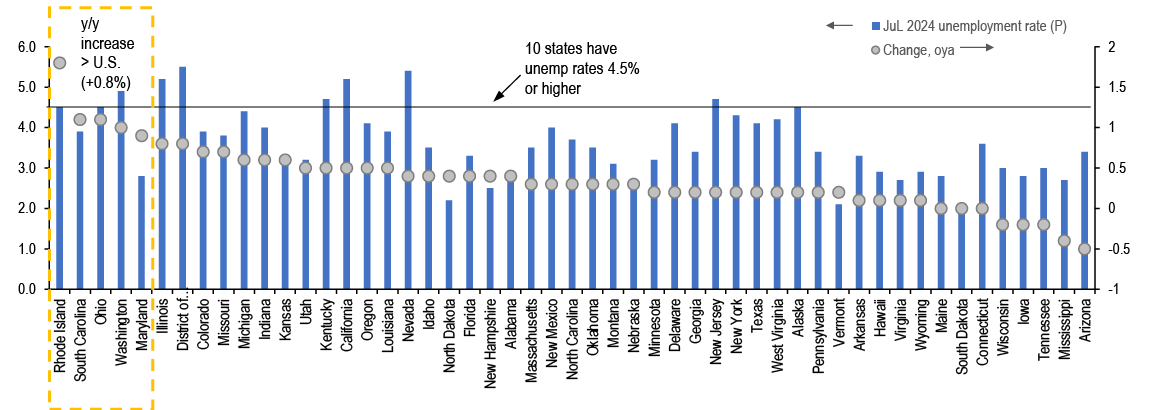
Source: U.S. Bureau of Labor Statistics, J.P. Morgan
Note: July 2024 data is preliminary.
Tax-exempt supply is set to pick back up next week, to $11bn, or 1.5x the trailing 5yr average for the equivalent week
Issuance is set to pick back up next week, to $11.7bn, or 1.3x the trailing 5yr average for the equivalent week. Expected tax-exempt supply of $11.0bn is back above the $10bn mark, where it has been in every non-Fed and non-CPI week since May, and 1.5x the average, while taxable issuance of just $645mn would be 35% the average.
The calendar is expected to be headlined by a $1.8bn deal for New York City ($1.5bn negotiated / $300mn competitive). BayCare Health System is also expected to bring a $1bn+ sale next week.
Figure 151: Historical and forecast weekly municipal issuance
Weekly Issuance, $bn’s
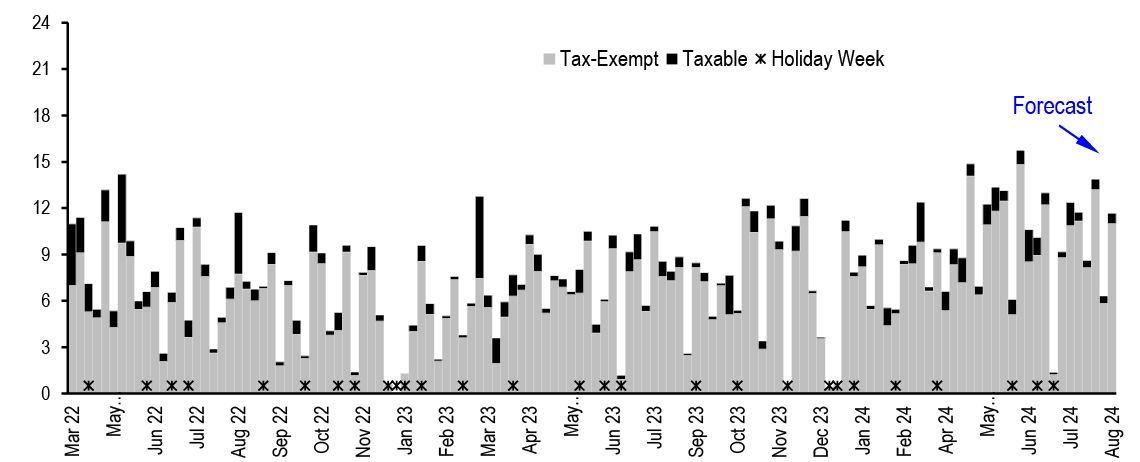
Source: IPREO, Bloomberg Finance L.P., J.P. Morgan
LSEG Lipper reported municipal fund inflows for a 7th consecutive week
LSEG Lipper reported municipal fund inflows for the 7th consecutive week, totaling +$529mn for the weekly period ending August 14th (+$296mn open-end funds/+$233mn ETFs). Inflows were driven by Long Term funds (+$576mn). In terms of credit quality, inflows were equally split between High Yield funds (+$231mn) and Investment Grade funds (+$298mn).
| Weekly Only Reporters | Fund Flows ($mn) | ||
| Week ended August 14, 2024 | Total | Open-end Funds | ETF Funds |
| All term muni | 529 | 296 | 233 |
| Investment Grade | 298 | 68 | 230 |
| High Yield | 231 | 228 | 3 |
| Long Term (10yr+) | 576 | 391 | 185 |
| Intermediate (5-10yr) | 6 | (45) | 52 |
| Short / Intermediate (3-5yr) | (35) | (35) | 0 |
| Short (1-3yr) | (18) | (15) | (3) |
| National funds | 567 | 328 | 239 |
| New York | (7) | (10) | 3 |
| California | 3 | 13 | (11) |
| Tax-exempt money market | (806) | ||
| Taxable money market | 15,441 | ||
| Taxable Fixed Income | 4,041 | (2,069) | 6,110 |
| US & Global Equity | (8,233) | (4,386) | (3,847) |
Source: LSEG Lipper Global Fund Flows, J.P. Morgan. Note: Figures shown on this table are weekly reporters only. Data refreshed on 8/15/24, 2pm read.
With almost all funds reporting, July flows are tracking at +$6.6bn (+$3.5bn open-end funds/+$3.2bn ETFs), bringing year-to-date inflows to +$18.4bn (+$12.4bn open-end funds/+$6.0bn ETFs). Please see our Municipal Weekly Fund Flows Update for additional detail.
| Weekly and Monthly Reporters | July Monthly Flow $mn | YTD Flow $mn | ||||
| Combined | Open End Mutual Fund | ETF | Combined | Open End Mutual Fund | ETF | |
| All term muni | 6,649 | 3,464 | 3,185 | 18,369 | 12,361 | 6,008 |
| Investment Grade | 4,806 | 1,687 | 3,120 | 8,432 | 2,448 | 5,984 |
| High Yield | 1,843 | 1,778 | 66 | 9,937 | 9,913 | 25 |
| Long Term (10yr+) | 5,072 | 2,590 | 2,482 | 21,272 | 16,593 | 4,679 |
| Intermediate (5-10yr) | 1,364 | 999 | 365 | 1,901 | 447 | 1,454 |
| Short / Intermediate (3-5yr) | 69 | 63 | 7 | (1,996) | (1,497) | (499) |
| Short (1-3yr) | 144 | (188) | 332 | (2,807) | (3,182) | 375 |
| National funds | 6,314 | 3,260 | 3,054 | 17,580 | 12,141 | 5,439 |
| New York | 31 | 15 | 16 | 199 | 92 | 108 |
| California | 370 | 255 | 116 | 1,639 | 1,178 | 461 |
Source: LSEG Lipper Global Fund Flows, J.P. Morgan. Note: Figures shown on this table are combination of weekly and monthly reporters. Figures are as reported on 8/15/24 at 2pm, and will evolve as more month-end data is reported.
Discount 20Yr AAA TX PSF 4s offer value vs. generic AA 4s, and an opportunity to add higher beta assets in advance of a declining rate environment
Long dated AAA rated Texas Permanent School Fund (PSF) backed bonds are trading at a spread to comparable generic AA rated bonds. This is the case for both 5% and 4% coupon bonds in the longer portions of the curve. In 30yrs, TX PSFs 5s are currently spread at 35bps to the HG, with 4s trading at a 60bps spread.
For investors who want to take advantage of the spread, but are looking for a lower volatility and maximum liquidity, we believe the long PSF 5s with a dollar price of ~$108 has value. This structure however, also has the lower performance potential versus 4s, based on the last sustained market rally in 2021, as evidenced in their max dollar price of $128.5 (+18%), reached during the 2021 inflow cycle. Moving out on the risk-reward curve, 30yr 4s, with a dollar price of ~$97, have lesser liquidity than the 5s, but offer 25bps more spread, and the 4% bonds have higher performance potential, when we look back through the 2021 inflow cycle and their max price of $118 (+22%).
Moving in on the curve, but higher in terms of risk-reward, 20yr 4% coupon TX PSF bonds have a current discount dollar price of ~$98, and offer 15bps of spread vs. generic AA 4s, and higher performance potential than 4s or 5s in 30yrs, given a max price of $122 (+24%) during the sustained inflow cycle in 2021. Naturally, given our belief that an easing cycle is in the offing, we believe this high-quality, but still volatile structure. This may be particularly interesting for investors who are looking to add duration versus the their benchmark or peers.
Figure 152: 20yr 4% coupon TX PSF bonds have a current discount dollar price of ~$98, and offer 15bps of spread vs generic AA 4s, and higher performance potential than 4s and 5s in 30yrs, given a max price of $122 (+24%) during the sustained inflow cycle in 2021
Spread to HG, bps (left) and PSF supply, $mn (right)
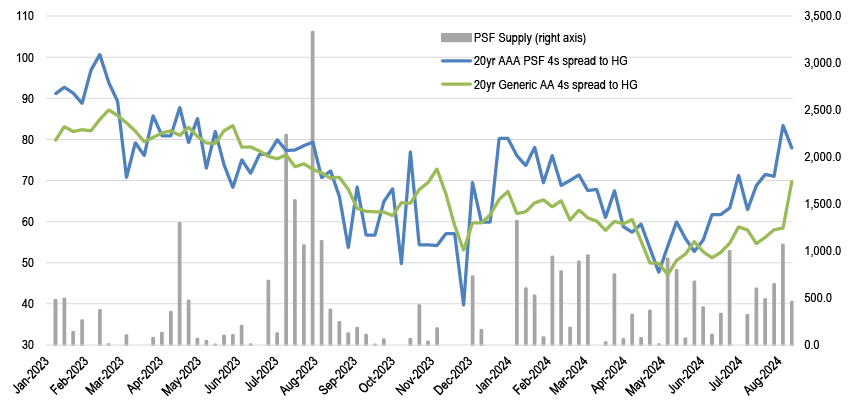
Source: MSRB, ICE, J.P. Morgan.
Figure 153: Currently, 20yr AAA PSF 4s are trading at a discount and ~$1.8 lower vs. 20yr AA generic 4s. Given our belief that an easing cycle is in the offing, we like this high-quality, but still volatile structure
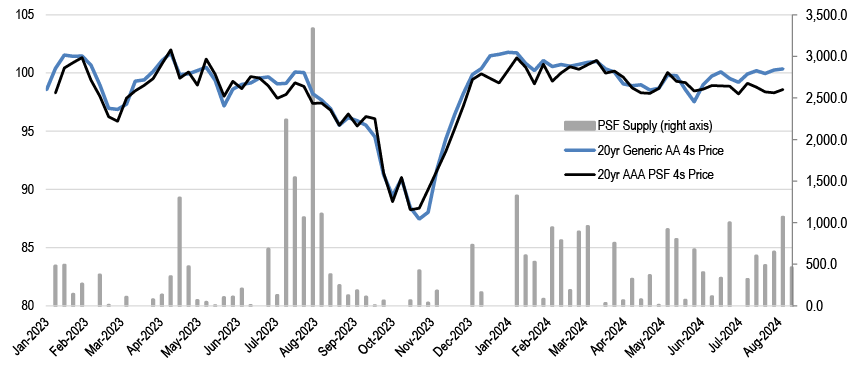
Source: MSRB, ICE, J.P. Morgan.
IG munis generally had solid performance during Fed easing cycles, while HY munis have typically underperformed IG, and recovered later
As we approach an expected easing in September and our economists significantly front-loaded expected Fed easing with a projected 50bp cut in September, following the weak July jobs report (Weak jobs to prompt strong Fed action, Michael Feroli). In this section we will explore how municipal bonds performed from a total return and fund flow perspective during past easing cycles.
The index return illustrated in the exhibits below, show one-year forward returns from the date indicated on the x-axis. We show the one-year forward return, as it better represents the future performance of purchases at a given point in the Fed cycle.
Since 1988, as illustrated in Figure 154, there have been a total of six Fed easing cycles. In the charts below, these easing cycles are indicated by grey shading, and the blue bars depict one-year forward total returns for Bloomberg’s Municipal Bond Index. The orange shading denotes recessions, which occurred in varying intensity in 4 of the 6 easing cycles.
Generally speaking, municipal bonds had strong annual returns during most easing cycles, with the exception of two, 1998 and the financial crisis in 2008. In 1998, the one-year forward return was negative as rates rose just after the easing cycle as the Fed resumed tightening. During the 2008 episode, there were five months with negative one-year forward returns due to the Global Financial Crisis (GFC). However, as the Fed accelerated the pace of easing, municipal bonds posted a strong recovery.
This conclusion is consistent with our observation of fund flows during Fed easing cycles. As we discussed in 8/2/2024 publication, we found that municipal mutual funds experienced sustained inflows in all six of the last easing cycles, dating back to 1992. Easing cycles that were reversed in relative short order such as in 1992, 1995, and 1998, saw relatively low inflows as a proportion of AUM at 13%, while periods where the funds rate held lower for longer (2007, 2019) saw higher average inflows as a proportion of AUM at 25%.
Figure 154: Generally speaking, IG municipal bonds had strong annual returns during most easing cycles
Fed funds rate and forward one year return of Bloomberg’s IG muni index since 1988

Source: Bloomberg Finance L.P., J.P. Morgan.
Next, we apply the same methodology of calculating one-year forward returns over Fed easing cycle, using Bloomberg’s HY Muni Index. Given that we capture HY index data beginning in 1995, we are only able to provide the HY data analysis over five Fed easing cycles. Comparing HY muni performance to IG muni performance during each easing cycle, we found that HY usually underperformed IG and experienced negative returns for a longer duration. However, during the later stages of the easing cycle, HY municipals posted much stronger returns compared to IGs ( Figure 156).
Figure 155: HY underperformed IG and negative return took longer than IGs, while during the later stage of easing cycle, HY munis posted much stronger returns over IGs
Fed funds rate and forward one year return of HY muni index since 1988

Source: Bloomberg Finance L.P., J.P. Morgan.
The table in Figure 156, shows the average one-year forward return over easing periods represented in the charts above. For IG munis, the forward return was only negative (slightly) in one (1998) of the six easing cycles. As we mentioned earlier, this negative return was largely driven by the subsequent tightening cycle in 1999. On average, IG munis had a one-year forward return of 4.9% during the past six easing cycles.
For HY munis, returns were lower than those of IG munis during each easing cycle, except for the one in 1998. On average, HY munis had a one-year forward return of 1.5% during the past five easing cycles. However, we do note that the rebound of HY munis, usually starting in the later stages of easing cycles, was far stronger than IG munis.
Figure 156: On average, IG munis had a one-year forward return of 4.9% during the past six easing cycles. HY munis had a one-year forward return of 1.5% during the past five easing cycles. However, we do note that the rebound of HY munis, usually starting in the later stages of easing cycles, was far stronger than IG munis
| Easing Periods | IG Muni Avg 1yr Forward Return (%) | HY Muni Avg 1yr Forward Return (%) |
| May 1989 - Sep 1992 | 10.10% | |
| Jun 1995 - Jan 1996 | 5.50% | 4.70% |
| Aug 1998 - Nov 1998 | -0.80% | 0.60% |
| Dec 2000 - Jun 2003 | 6.10% | 5.90% |
| Aug 2007 - Dec 2008 | 4.50% | -7.80% |
| Jul 2019 - Mar 2020 | 4.10% | 3.90% |
| Average | 4.92% | 1.46% |
Source: Bloomberg Finance L.P., J.P. Morgan.
Muni downgrades naturally exceeded upgrades during the two most recent recessions. What happened at the sector level?
Investors know that municipal credit quality has generally exhibited resilience and stability through economic cycles. It is also understood that rating activity turns more negative in periods marked by and following recessions (see Municipal Markets Weekly, 3/11/22). This week we drill down deeper into sub-sectors of the municipal market to uncover particular strength/weakness in past downturns. Investors may consider this data before shifting sector allocations in light of increasing concerns over the probability of recession. The key takeaway: net negative rating activity was broad-based across major municipal sub-sectors during and following the Great Recession.
For broader historical context: we estimate the average ten-year cumulative default rate for the rated municipal market is very low at only 0.2%, compared to 8.0% for global corporates, 10.9% for U.S. corporates, and 7.3% for sovereign markets, based on the average of the latest reported statistics from three rating agencies (save for U.S. corps, which is only broken out by one). While municipal default rates are higher in speculative grade credits, at 6.6% (vs. 0.1% for IG), this portion of our market is very small. For example, only ~1.4% of all municipal credits in Moody’s universe were rated below Baa3 at YE22, compared to 46% of global corporate credits. Further, default rates for municipals compare favorably to corporates and sovereign entities across all rating buckets ( Figure 157).
Figure 157: Rated municipal defaults are rare and default rates compare favorably to corporates and sovereign issuers
Default rate for 10yr time horizon, % (time periods vary, see footnote for detail)
| Municipals | Moody's | S&P | Fitch | Average | U.S. Corporates | S&P | Global Corporates | Moody's | S&P | Fitch | Average | Sovereign | Moody's | S&P | Fitch | Average | ||||||
| AAA | 0.0% | 0.0% | 0.0% | 0.0% | AAA | 0.8% | AAA | 0.1% | 0.7% | 1.3% | 0.7% | AAA | 0.0% | 0.0% | 0.0% | 0.0% | ||||||
| AA | 0.0% | 0.0% | 0.0% | 0.0% | AA | 1.0% | AA | 0.7% | 0.7% | 0.1% | 0.5% | AA | 0.7% | 0.0% | 0.0% | 0.2% | ||||||
| A | 0.1% | 0.1% | 0.1% | 0.1% | A | 1.6% | A | 1.9% | 1.1% | 1.2% | 1.4% | A | 3.5% | 4.0% | 3.1% | 3.5% | ||||||
| BBB | 1.0% | 0.7% | 1.1% | 1.0% | BBB | 3.9% | BBB | 3.3% | 2.9% | 2.4% | 2.9% | BBB | 3.5% | 2.8% | 2.5% | 2.9% | ||||||
| BB | 3.3% | 3.8% | 5.2% | 4.1% | BB | 13.1% | BB | 15.4% | 10.7% | 7.3% | 11.1% | BB | 11.7% | 6.1% | 5.0% | 7.6% | ||||||
| B | 16.6% | 10.8% | 3.2% | 10.2% | B | 24.3% | B | 34.0% | 22.2% | 13.6% | 23.3% | B | 28.4% | 16.3% | 19.5% | 21.4% | ||||||
| CCC-C | 23.6% | 36.3% | 14.6% | 24.9% | CCC-C | 55.9% | CCC-C | 47.8% | 50.6% | 42.0% | 46.8% | CCC-C | 53.3% | 41.9% | 37.5% | 44.2% | ||||||
| Investment Grade | 0.1% | 0.2% | 0.2% | 0.1% | Investment Grade | 2.4% | Investment Grade | 2.1% | 1.7% | 1.5% | 1.8% | Investment Grade | 1.9% | 1.7% | 1.4% | 1.7% | ||||||
| Speculative Grade | 6.8% | 7.3% | 5.7% | 6.6% | Speculative Grade | 22.2% | Speculative Grade | 30.3% | 19.3% | 12.1% | 20.6% | Speculative Grade | 24.4% | 13.7% | 12.8% | 16.9% | ||||||
| All Rated | 0.2% | 0.2% | 0.3% | 0.2% | All Rated | 10.9% | All Rated | 11.2% | 8.7% | 4.0% | 8.0% | All Rated | 10.3% | 6.0% | 5.6% | 7.3% |
Source: Moody’s Investors Services, S&P, Fitch, J.P.Morgan.
Default study horizons: S&P: Muni 1986-2023, US Corp 1981-2023, Global corp 1981-2023, Sovereign 1993-2023.
Fitch: Muni 1999-2023, Global corp 1990-2023, Sovereign 1995-2023.
Moody’s: Muni 1970-2022, Global corp 1983-2023, Sovereign 1983-2023.
While municipal defaults are relatively rare, downgrade risk may be more top of mind for investors, particularly during recession and post-recession periods. For example, recall Moody’s rating activity turned net negative (ie downgrades exceeded upgrades) in 1Q09, and remained biased negative for 22 successive quarters, through 3Q14.And in 2020, downgrades exceeded upgrades in 2Q20 and 4Q20 (flat in 3Q20), before rebounding in 1Q21 (see green boxes in Figure 158). On an annual basis, downgrades exceeded upgrades in 2009 through 2014, and in 2020.
Figure 158: Moody’s rating activity inflected downward during the past two recessions

Source: Moody’s, J.P. Morgan. Gray shaded area indicates recessionary period. Note: 1Q17 local GO methodology revision led to one-time spike in upgrades.
The following analysis is based on individual rating actions reported by Moody’s over 2005 through 1Q24, by sub-sector. We present the results in two exhibits; Figure 159: Upgrade/downgrade ratios by sector, since 2005 shows the upgrade/downgrade ratio for 20 major sub-sectors, sorted in order of the number of total rating actions over the period. An upgrade/downgrade ratio below 1.0x indicates downgrades exceeded upgrades. Certain sectors in certain years saw either (a) no rating changes at all (0/0), or (b) only upgrades. We manually set (a) cells to 1.0x, and (b) cells value ratios are capped at the the top sector ratio alternative sub-sector ratio of the given year. Green/yellow/red shaded cells represent the best/middle/worst performing sectors in any given year, among the 20 sectors in our sample. The last row (‘All Muni Sectors’) is conditionally formatted separately across the years provided, to give context for the market’s rating performance on an annual basis.
The primary observations from Figure 14:
- Ratings actions were greatly impacted by the Great Recession. Beginning in 2009 and running through 2014 , average annual ratios were below 1.0x, indicating that the number of downgraded credits exceeded the number of upgraded credits
- Upgrades exceeded downgrades for Muni Utility Districts (MUD), Counties, Special Districts, and W&S in 15 of the 20 periods shown; Cities were net positive in 12 of 20 of the periods presented.
- Upgrades rarely exceeded downgrades in the health-care sector, and Higher Education sectors also showed downgrades exceeding upgrades on average, over the periods shown.
We are not suggesting that investors avoid sectors of the market which have experienced a greater number of downgrades over time. Investors with dedicated credit resources may lean into more idiosyncratic sectors as a means of performance differentiation, by positioning solid credits that reflect heightened spreads based on the broader risks presented in the sector.
More broadly, this data suggests that heightened credit scrutiny of all credits may be beneficial in periods of economic stress and in the years following. Currently, the municipal market is still enjoying a long period where upgrades are exceeding downgrades, now at 13 (S&P) and 14 (Moody’s) straight quarters, as of 2Q24. And as discussed in our Mid-Year Outlook, it is hard to see the overall strong positive ratings momentum of the past 3yrs changing direction in 2H24 (although sector-specific weakness appears unlikely to abate).
Figure 159: Upgrade/downgrade ratios by sector, since 2005
Upgrade/downgrade ratio by count
| Sector | 2005 | 2006 | 2007 | 2008 | 2009 | 2010 | 2011 | 2012 | 2013 | 2014 | 2015 | 2016 | 2017 | 2018 | 2019 | 2020 | 2021 | 2022 | 2023 | 1Q24 | Avg |
| School | 6.2 | 7.1 | 12.5 | 5.6 | 1.6 | 0.8 | 0.2 | 0.3 | 0.2 | 0.5 | 0.6 | 0.9 | 1.5 | 0.9 | 1.5 | 0.7 | 2.4 | 2.1 | 3.0 | 3.1 | 2.6 |
| City | 3.3 | 3.9 | 6.8 | 4.7 | 0.9 | 0.3 | 0.1 | 0.2 | 0.2 | 0.6 | 1.2 | 1.0 | 1.9 | 1.0 | 3.1 | 1.7 | 5.3 | 4.0 | 6.8 | 5.0 | 2.6 |
| County | 5.4 | 18.0 | 13.8 | 4.5 | 0.5 | 0.7 | 0.1 | 0.3 | 0.4 | 1.5 | 2.1 | 4.6 | 3.8 | 2.6 | 4.5 | 3.2 | 8.8 | 6.0 | 6.4 | 5.0 | 4.6 |
| Health | 1.1 | 0.8 | 0.8 | 0.5 | 0.4 | 0.9 | 0.7 | 0.9 | 0.7 | 0.6 | 0.6 | 0.6 | 0.3 | 0.4 | 0.4 | 0.2 | 2.0 | 0.6 | 0.4 | 0.5 | 0.7 |
| Housing | 0.2 | 0.4 | 0.7 | 0.3 | 0.1 | 0.1 | 1.0 | 0.2 | 0.3 | 0.8 | 2.8 | 3.0 | 5.8 | 10.0 | 6.0 | 10.0 | 8.8 | 0.8 | 1.5 | 0.0 | 2.6 |
| Sp. Dist | 20.0 | 3.9 | 6.7 | 3.2 | 4.3 | 1.5 | 0.3 | 0.3 | 0.3 | 0.9 | 1.3 | 0.7 | 4.7 | 1.1 | 3.7 | 1.3 | 2.7 | 1.3 | 3.3 | 1.2 | 3.1 |
| Higher Ed - Priv | 1.0 | 1.9 | 3.7 | 1.1 | 0.1 | 0.2 | 0.3 | 0.1 | 0.6 | 0.6 | 0.1 | 0.2 | 0.8 | 0.6 | 0.2 | 0.0 | 0.6 | 0.8 | 0.1 | 0.2 | 0.7 |
| Wtr&Sew | 7.5 | 17.0 | 13.8 | 6.5 | 1.4 | 0.4 | 0.2 | 0.6 | 1.0 | 0.3 | 3.6 | 4.3 | 4.0 | 2.0 | 3.0 | 18.0 | 2.0 | 5.0 | 4.7 | 0.5 | 4.8 |
| State | 1.6 | 5.0 | 5.3 | 4.0 | 0.9 | 1.5 | 0.1 | 0.1 | 0.2 | 0.3 | 0.3 | 0.3 | 0.3 | 1.6 | 4.3 | 0.0 | 2.3 | 17.0 | 14.0 | 0.8 | 3.0 |
| Higher Ed - Pub | 2.3 | 0.6 | 2.8 | 2.8 | 0.9 | 0.3 | 0.8 | 0.1 | 0.0 | 0.4 | 0.1 | 0.3 | 0.1 | 0.1 | 0.4 | 0.0 | 0.4 | 5.3 | 1.3 | 0.0 | 0.9 |
| MUD | 20.0 | 18.0 | 13.8 | 1.0 | 1.0 | 0.5 | 1.0 | 0.7 | 0.5 | 6.0 | 5.0 | 15.0 | 4.0 | 7.7 | 9.0 | 18.0 | 8.8 | 20.0 | 14.0 | 5.0 | 8.4 |
| Town | 2.5 | 1.5 | 13.8 | 1.3 | 4.3 | 0.3 | 0.2 | 0.6 | 0.3 | 2.2 | 2.7 | 20.0 | 1.2 | 5.0 | 1.8 | 0.5 | 12.0 | 20.0 | 14.0 | 1.0 | 5.3 |
| Rec | 1.0 | 1.0 | 1.0 | 1.0 | 1.0 | 0.3 | 0.0 | 0.0 | 0.2 | 0.1 | 2.5 | 3.7 | 4.3 | 10.0 | 1.3 | 18.0 | 8.8 | 20.0 | 8.0 | 5.0 | 4.4 |
| Water | 11.0 | 18.0 | 13.8 | 5.6 | 0.8 | 0.6 | 0.2 | 0.1 | 0.2 | 1.0 | 0.9 | 1.6 | 1.9 | 3.5 | 8.0 | 2.8 | 5.5 | 20.0 | 14.0 | 5.0 | 5.7 |
| CCD | 3.3 | 5.0 | 13.8 | 5.6 | 4.0 | 1.5 | 0.3 | 1.0 | 0.1 | 0.4 | 0.6 | 0.1 | 2.3 | 0.7 | 2.2 | 0.6 | 1.6 | 1.5 | 2.3 | 5.0 | 2.6 |
| Sewer | 3.0 | 7.0 | 13.8 | 5.6 | 0.8 | 0.1 | 0.0 | 0.0 | 0.5 | 0.3 | 1.0 | 3.0 | 3.3 | 7.5 | 9.0 | 4.5 | 1.0 | 2.0 | 1.3 | 1.0 | 3.2 |
| Airport | 2.5 | 3.7 | 15.0 | 5.6 | 0.3 | 0.3 | 0.2 | 0.3 | 0.2 | 0.5 | 4.5 | 7.0 | 5.5 | 8.0 | 9.0 | 0.3 | 8.8 | 20.0 | 14.0 | 5.0 | 5.5 |
| Electric | 20.0 | 18.0 | 13.8 | 5.6 | 0.5 | 0.9 | 0.2 | 0.4 | 0.1 | 0.5 | 1.0 | 0.8 | 0.4 | 0.7 | 1.0 | 2.0 | 8.8 | 2.5 | 14.0 | 1.0 | 4.6 |
| Transit | 2.0 | 2.0 | 4.0 | 5.6 | 4.0 | 0.8 | 0.1 | 0.1 | 0.3 | 0.1 | 4.0 | 6.0 | 0.7 | 1.0 | 9.0 | 0.0 | 8.8 | 2.0 | 14.0 | 1.0 | 3.3 |
| Village | 2.7 | 18.0 | 13.8 | 3.0 | 1.0 | 0.1 | 0.7 | 0.4 | 0.3 | 1.5 | 1.0 | 0.8 | 0.6 | 1.0 | 2.0 | 0.5 | 0.0 | 20.0 | 14.0 | 1.0 | 4.1 |
| All Muni Sectors | 2.8 | 3.0 | 4.5 | 2.4 | 0.7 | 0.5 | 0.2 | 0.2 | 0.3 | 0.6 | 1.1 | 1.2 | 1.7 | 1.1 | 2.0 | 1.0 | 2.7 | 2.8 | 3.6 | 2.3 | 1.7 |
Source: Moody’s, J.P. Morgan
Figure 160 shows the net rating change across sector in terms of par-value of rated debt (ie rated debt upgraded less rated debt downgraded). Note that sub-sectors vary widely by size (in terms of the number of the rated universe of credits and debt outstanding), and not all sectors are represented in our exhibits.
When looking at the health-care sector on a par value of debt upgraded versus downgraded, we observe a that downgraded par value only exceeds the amount upgraded in 9 of 16 periods below. This result is far better than when strictly observing the ratio on a per credit basis. This difference is supportive of our preference for larger, diversified systems. Recall, FY23 financial results varied widely by healthcare issuers, according to rating agency reports published this spring. In 2023, downgrades were seen across provider types but biased towards stand-alone credits (36) vs. systems (21). Downgrades were most prevalent in credits rated BBB+ prior to the time of action (11), followed by A and A+ (8 each). Covenant violations increased in 2022 and 2023, with the majority of breaches from providers rated BBB or below. Looking forward, while many providers are on a path to recovery, negative outlooks remain near a historical peak, and covenant violations are likely to continue for already weaker-positioned issuers, according to S&P. As a result, we favor: larger, diversified systems in demographically favorable regions, with good market position and balance sheet strength (Mid-Year Outlook).
Figure 160: Moody’s net rating change across sector, in terms of debt affected ($bn)
Moody’s rated debt upgraded less rated debt downgraded ($bn)
| Moody's rated debt upgraded less rated debt downgraded ($bn) | ||||||||||||||||
| Sector | 2005 | 2006 | 2007 | 2008 | 2009 | 2010 | 2011 | 2012 | 2013 | 2014 | 2015 | 2016 | 2017 | 2018 | 2019 | 2020 |
| State | 104 | 15 | -10 | 9 | -160 | -43 | -87 | -121 | -46 | 34 | -54 | -38 | -130 | 23 | 109 | -63 |
| City | 5 | 10 | 54 | 6 | -8 | -25 | -10 | -17 | -14 | -14 | -16 | -3 | 3 | 7 | 48 | -41 |
| Health | 8 | 12 | 4 | 4 | -7 | 5 | 0 | -10 | -10 | -3 | -10 | -6 | -14 | 0 | -9 | -18 |
| School | 18 | 13 | 23 | 11 | 0 | 1 | -17 | -18 | -14 | -4 | -8 | -1 | 6 | 7 | 5 | -6 |
| Transit | 0 | 1 | -2 | 0 | -2 | 9 | -4 | -9 | -3 | -12 | 26 | 5 | -6 | 0 | 3 | -49 |
| County | 4 | 8 | 10 | 0 | -8 | -8 | -10 | -9 | -15 | 1 | -1 | 10 | 12 | 10 | 3 | 0 |
| Airport | -1 | 7 | 6 | 11 | -4 | -4 | -1 | -30 | -12 | 1 | 5 | 7 | 11 | 8 | 3 | 1 |
| Toll Fac | 6 | 0 | 0 | -2 | 0 | -1 | -5 | -7 | -9 | 0 | 13 | 12 | 5 | 6 | 7 | 3 |
| Electric | 3 | 13 | 0 | 0 | 0 | 0 | -14 | -8 | -18 | -1 | 3 | 7 | -8 | -10 | 1 | -1 |
| Higher Ed - Pub | 3 | -1 | 13 | 1 | 1 | -1 | -1 | -3 | -5 | -21 | -1 | -2 | 0 | -3 | -1 | -3 |
| Wtr&Sew | 5 | 3 | 6 | 2 | -1 | -1 | -4 | -6 | 2 | -4 | 3 | 4 | 1 | -1 | 0 | 4 |
| Water | 1 | 2 | 1 | 0 | 0 | -2 | -3 | -4 | -6 | 0 | 27 | 2 | 1 | 3 | 0 | 0 |
| Housing | 0 | 1 | 0 | -1 | -19 | -9 | 0 | -1 | -1 | 0 | 7 | 4 | 3 | 1 | 2 | 1 |
| Higher Ed - Priv | 0 | 2 | 4 | 2 | -3 | -2 | -1 | -1 | 0 | -3 | -2 | 1 | 3 | 1 | -3 | -2 |
| Other | 12 | 9 | 23 | 10 | -5 | -24 | -23 | -17 | -17 | -3 | -43 | 25 | 12 | 5 | 5 | 1 |
| All Muni Sectors | 168 | 98 | 131 | 53 | -216 | -104 | -180 | -261 | -167 | -29 | -51 | 26 | -101 | 57 | 173 | -173 |
Source: Moody’s, J.P. Morgan
Note: Rating activity in 2021 and beyond include non-rated debt, ratings activity in 2020 and earlier, reflect only Moody’s rated debt. Red shading indicates debt downgraded exceeded the amount upgraded, green shading indicates debt upgraded exceeded the amount downgraded.
This week’s BAB ERP activity
In 2024 alone, we have identified 40 unique issuers that have either called BABs (25 issuers, affecting $11.0bn of debt), posted conditional calls (7 issuers, set to impact $1.6bn of debt), or announced that they are considering financing plans in this regard (12 issuers, potentially impacting $6.5bn of debt). Totaling YTD calls and notices of potential redemptions, BAB ERP activity would total $19.1bn for the year. Please note that this list is constantly evolving.
Figure 161: BAB ERP tracker
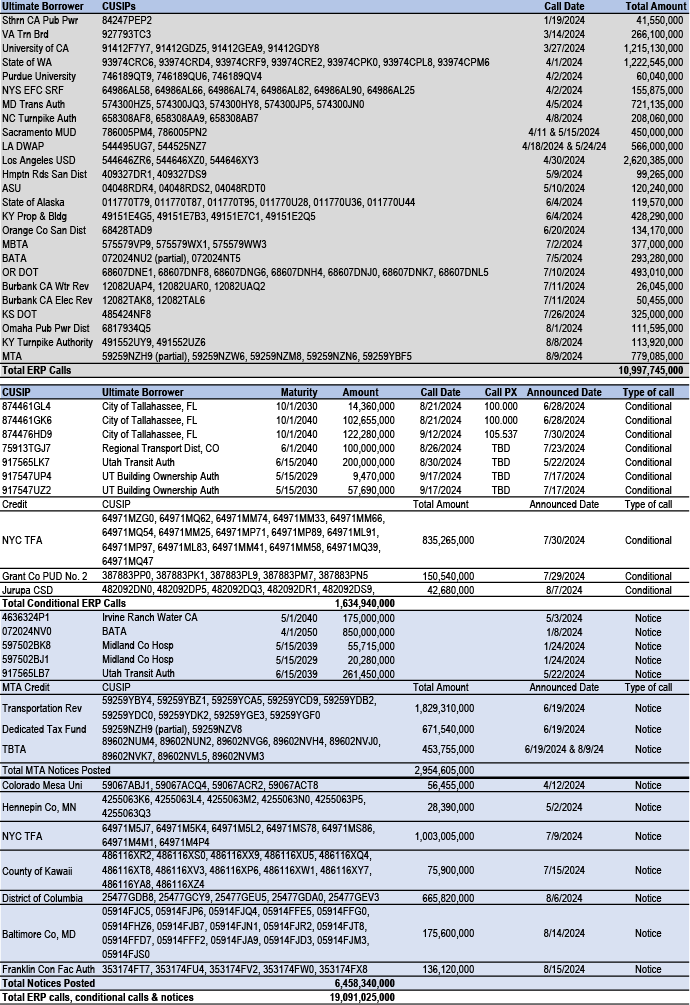
Source: EMMA, J.P. Morgan
Markets at a glance
Figure 162: YTD, muni yields across the HG curve are up by 6-26-43-17bps in 2-5-10-30yrs
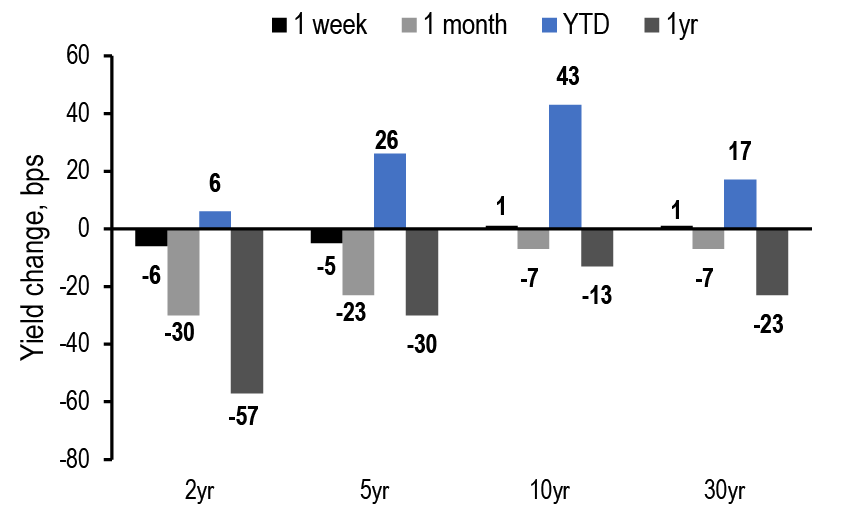
Source: Refinitiv, J.P. Morgan. Note: As of 8/16/24
Figure 163: We project a 10yr municipal high-grade yield of 2.10% by YE24
| 3Q24 | 4Q24 | 1Q25 | 2Q25 | ||
| Treasury | 8/16/2024 | Forecast | Forecast | Forecast | Forecast |
| 2yr | 4.06 | 3.60 | 3.20 | 2.75 | 2.35 |
| 5yr | 3.77 | 3.40 | 3.10 | 2.75 | 2.45 |
| 10yr | 3.89 | 3.75 | 3.50 | 3.30 | 3.15 |
| 30yr | 4.15 | 4.10 | 3.90 | 3.80 | 3.70 |
| AAA Tax-exempt | |||||
| 2yr | 2.58 | 2.35 | 1.95 | 1.75 | 1.40 |
| 5yr | 2.54 | 2.30 | 1.90 | 1.75 | 1.50 |
| 10yr | 2.82 | 2.60 | 2.10 | 2.05 | 1.90 |
| 30yr | 3.57 | 3.55 | 3.10 | 3.05 | 2.90 |
| AAA / TSY Ratios | |||||
| 2yr | 64% | 65% | 61% | 64% | 60% |
| 5yr | 67% | 68% | 61% | 64% | 61% |
| 10yr | 69% | 69% | 60% | 62% | 60% |
| 30yr | 86% | 87% | 79% | 80% | 78% |
Source: Refinitiv, J.P. Morgan
Figure 164: Gross and net supply
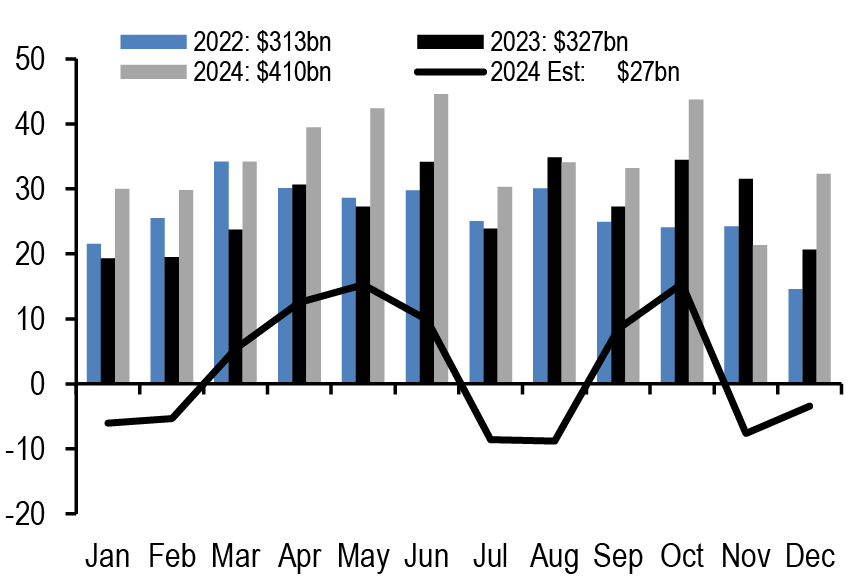
Figure 165: Tax-exempt AA Muni/Corp ratios
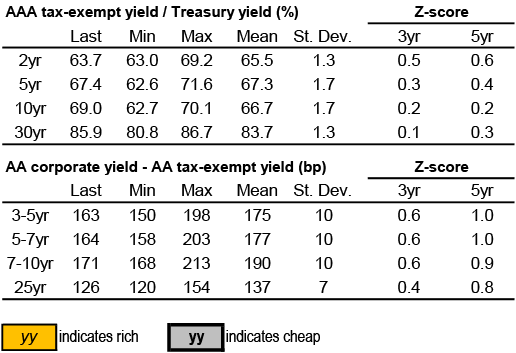
Source: Refinitiv, J.P. MorganNote: Values over last 3 months displayed, as of 08/15/24
YTD Issuance and Trading Trends
Figure 166: 10-20yr maturities have accounted for just under 40% of YTD issuance, in line with historical average
Proportion of issuance, %
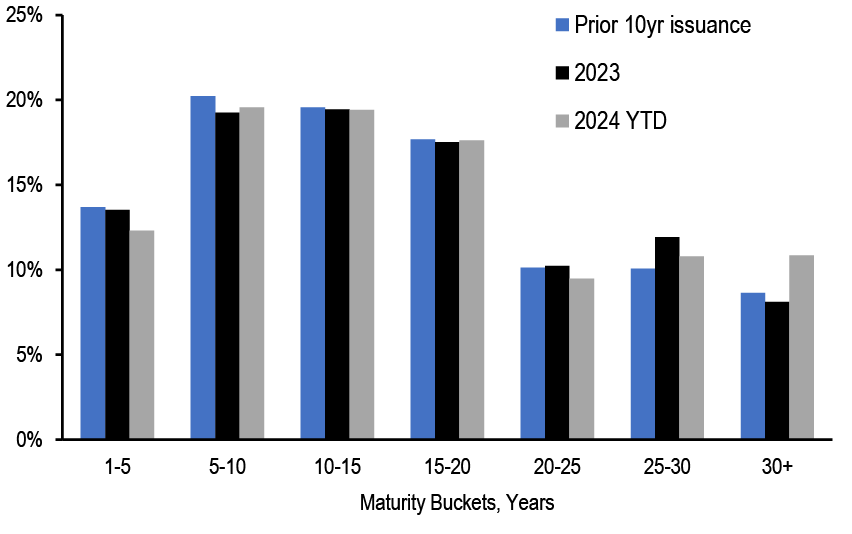
Figure 167: 66% of YTD issuance has been in 5-5.25% coupon bonds
Proportion of issuance, %
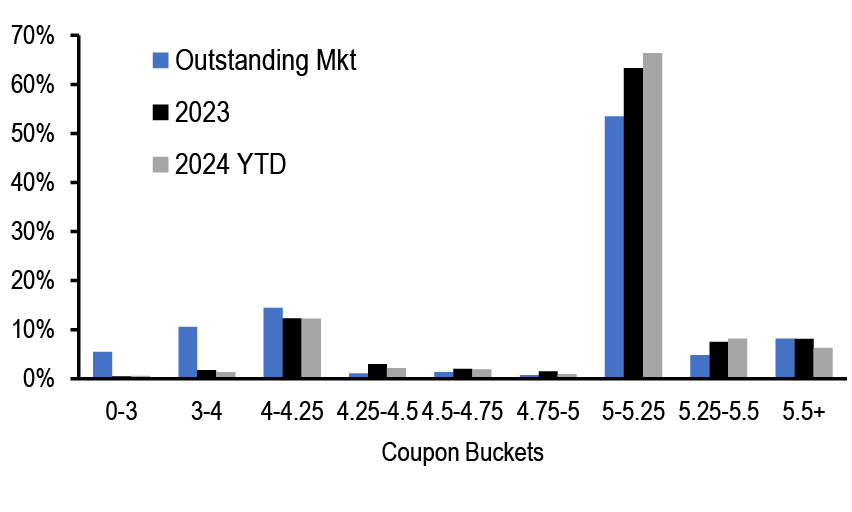
Figure 168: New money deals have accounted for 61% of issuance so far this year
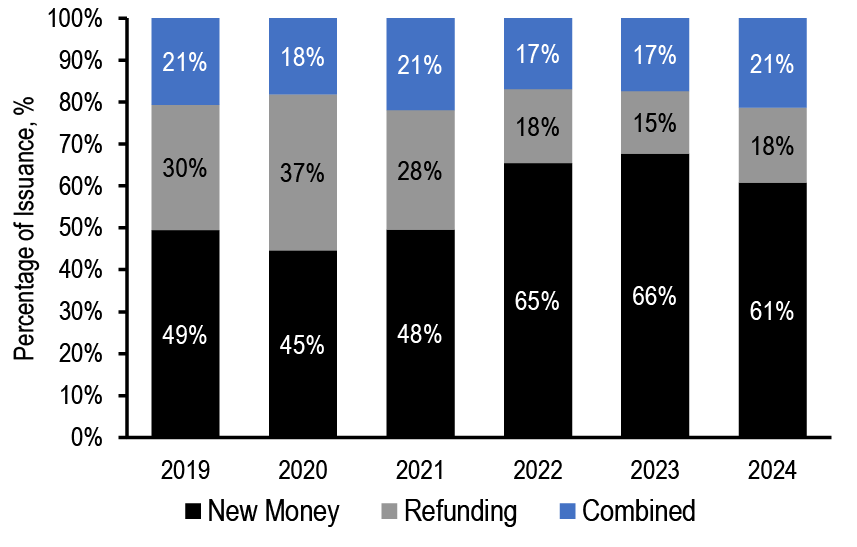
Source: Bloomberg Finance L.P., J.P. Morgan
Note: Long term bonds only
Figure 169: 5%-5.25% coupon bonds have accounted for the majority of YTD trading volume
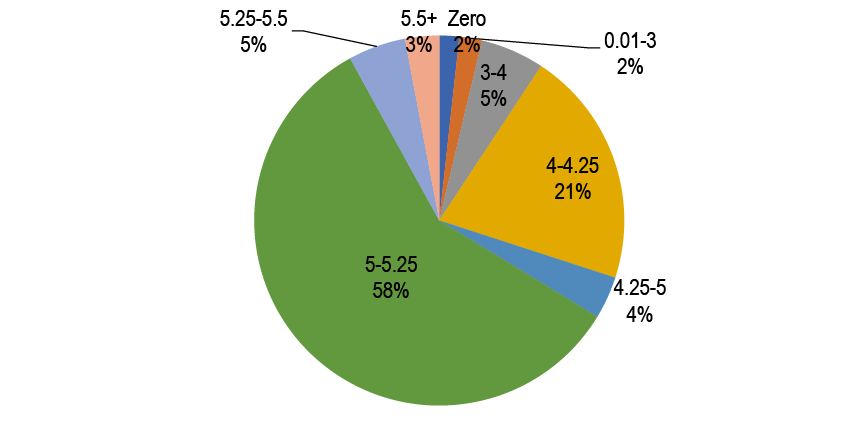
Source: MSRB, ICE, J.P. Morgan
Note: Long term, fixed coupon, tax-exempt bonds
YTD total return and curve spreads
Figure 170: YTD total returns

Figure 171: The 2s/30s curve is 1.7 sigma above its one year average
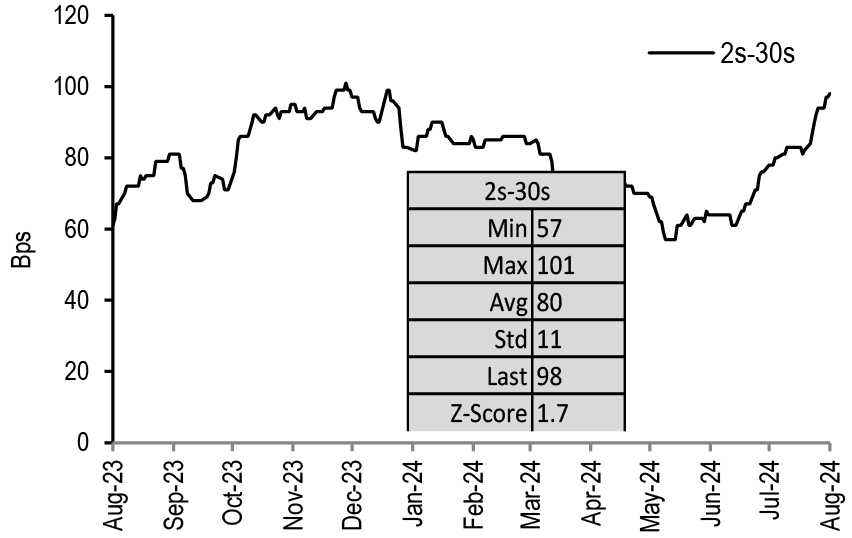
Figure 172: The 10s/30s curve is 1.2 sigma below its one year average
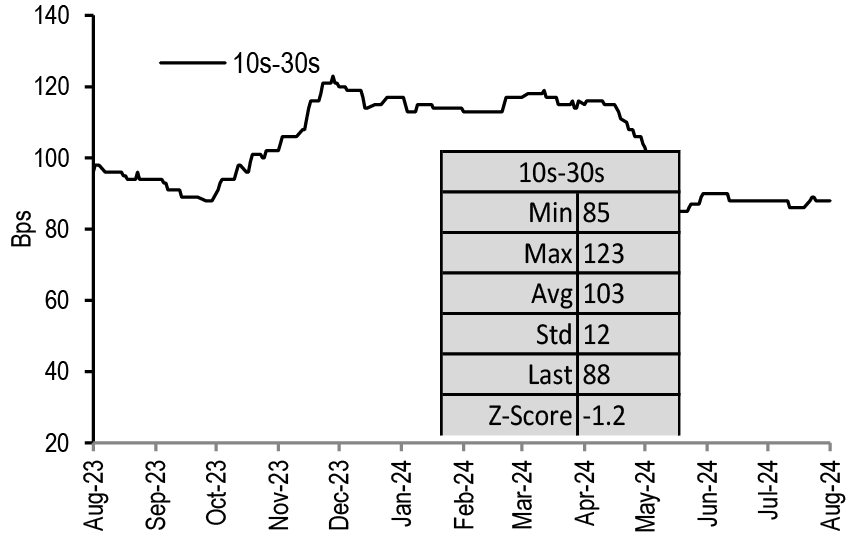
Figure 173: The 5s/10s curve is 2.7 sigma above its one year average
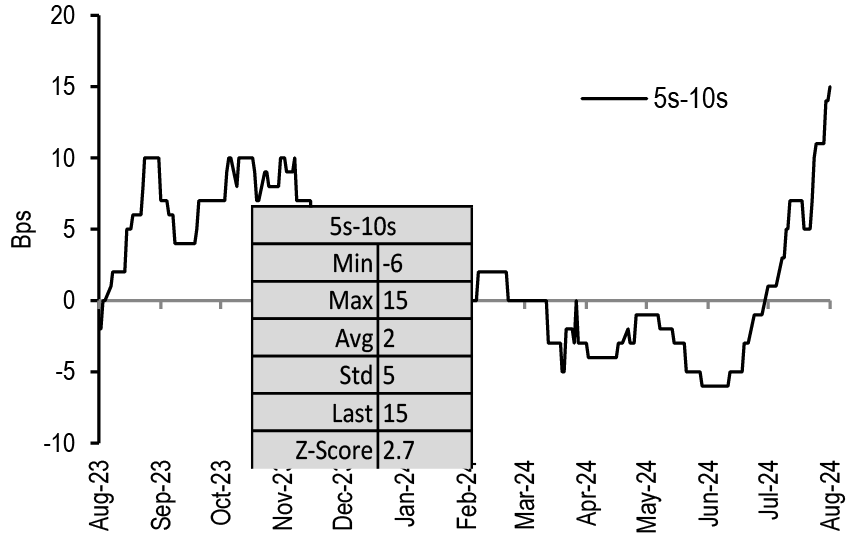
Source: Refinitiv Lipper, Bloomberg Finance L.P., J.P. Morgan. Note: As of 08/15/24
Figure 174: The 10s/20s curve is 1.5 sigma below its one year average
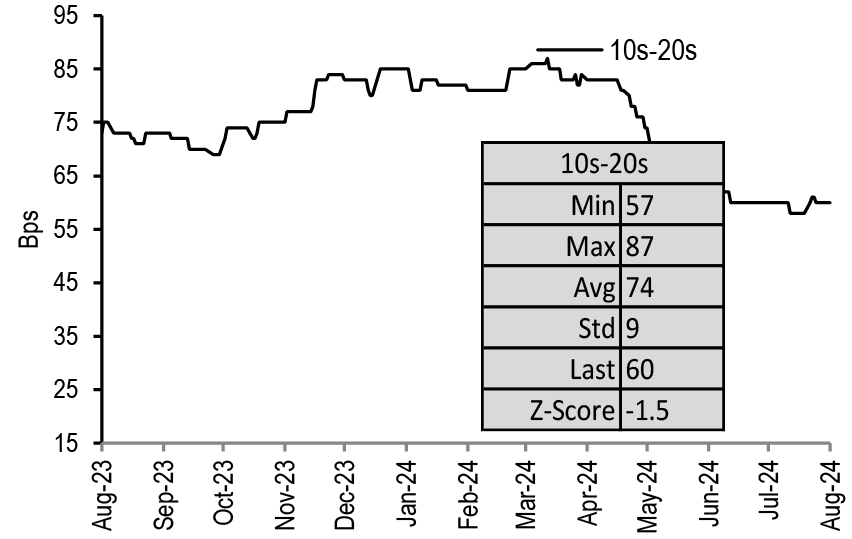
Total return by state and sector
Figure 175: The average YTD total return for Bloomberg municipal bond indices by state is 1.5%

Figure 176: Year-to-date, the broader municipal market has returned 1.18%
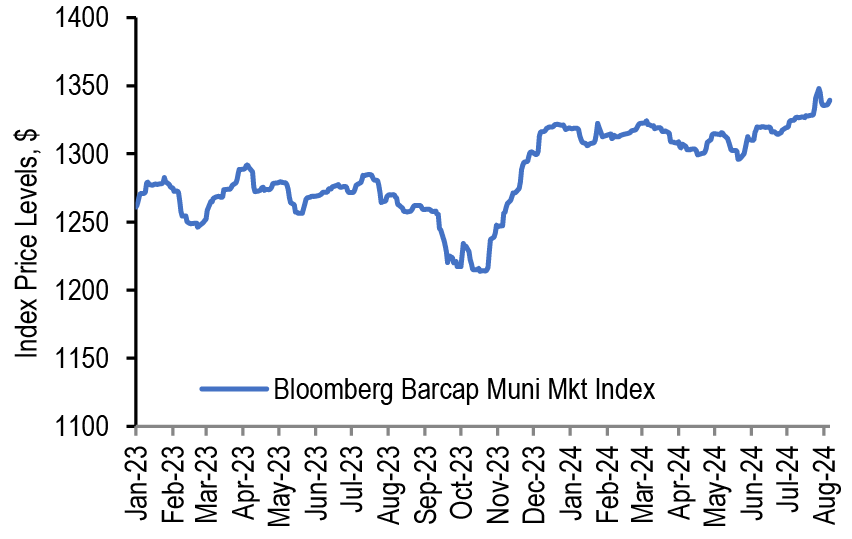
Figure 177: The Bloomberg muni index has returned 1.70 in the last three months
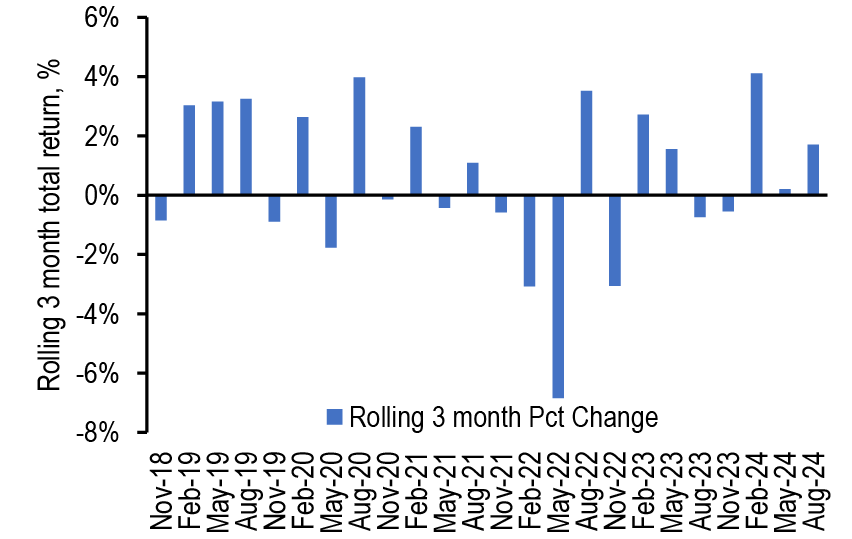
Figure 178: On a YTD basis, the HY muni index has outperformed
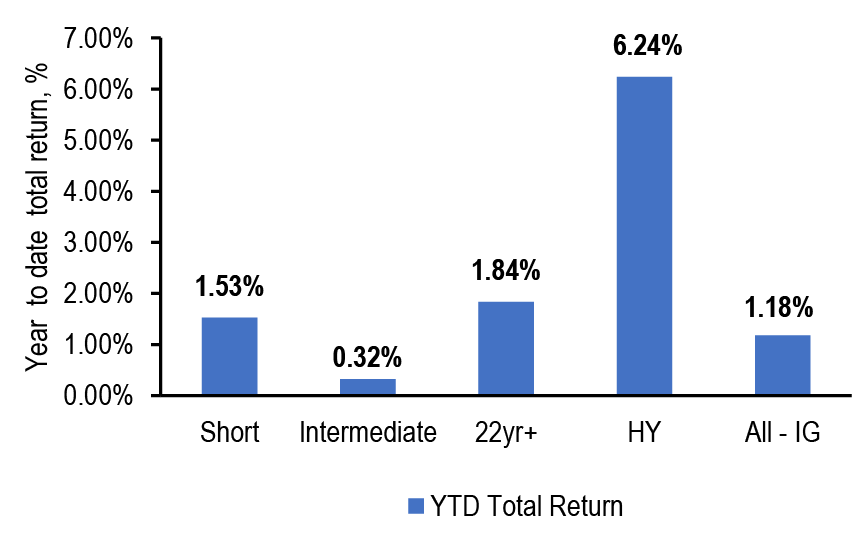
Source: Bloomberg Finance L.P., J.P. Morgan, as of 08/15/24. Note: Total return calculated as the percentage change in index levels. Bloomberg Municipal bond total return indices used
Figure 179: YTD returns turned positive by sector
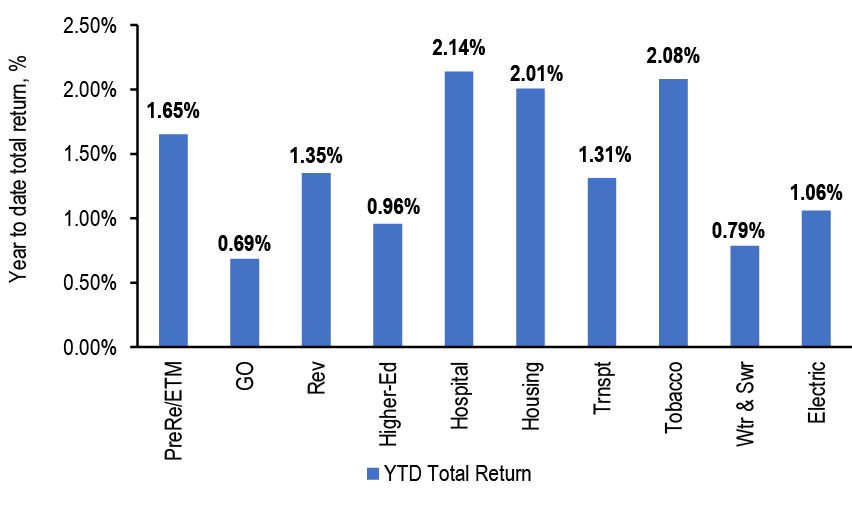
Glossary of Publication Topics
Sector Overviews
- Airports: 04/13/2018, 04/20/2018, 09/06/2019, 05/15/2020,06/11/2021, 01/10/2022, 02/11/2022, 08/19/2022, 07/28/2023
- Bond Insurance: 03/18/2016, 6/23/2017, 10/27/2017
- Charter Schools: 01/25/13, 03/15/24, 03/22/24
- Double-Barreled Bonds: 05/13/2016, 6/24/2016, 05/13/2022
- Energy: 01/29/2016, 02/05/2016, 02/19/2016, 04/23/2021, 02/11/2022
- Environmental, Social, Governance (ESG) Bonds:06/01/2018, 10/22/2021
- Gas prepay: 3/10/2017, 06/07/2019, 3/10/2023, 3/24/2023
- Housing: 1/20/2017, 10/20/2017, 07/26/2019, 08/02/2019, 12/10/2021,5/3/2024
- Healthcare: 04/29/2016, 1/27/2017, 3/03/2017, 1/19/2018, 1/28/2019, 2/1/2019, 01/24/2020, 10/16/2020, 01/22/2021, 08/27/2021, 06/03/2022, 06/10/2022, 9/23/2022, 4/28/2023, 01/19/2024
- Higher Ed: 5/19/2017, 9/14/2018, 07/24/2020, 07/16/2021, 08/05/2022, 04/05/24
- High/Enhanced Yield: 9/8/2017, 9/15/2017, 7/27/2018, 8/03/2018, 05/08/2020, 05/15/2020, 06/05/2020, 06/12/2020, 08/28/2020
- Local Government Credit: 4/07/2017, 11/10/2017, 06/18/2021, 10/29/2021, 11/04/2022
- Low beta/defensive: 08/25/2017
- Office: 04/14/2023, 05/12/2023, 07/07/23, 03/11/24
- Pensions: 11/03/2017, 10/12/2018, 10/19/2018, 10/26/2018, 04/05/2019, 04/17/2019, 08/16/2019, 08/23/2019, 10/18/2019, 07/30/2021, 11/05/2021, 10/28/2022, 09/29/23
- Pre-refunded bonds: 1/29/2018
- Primary and secondary (K-12) education: 11/02/2018
- Public Power/Electric: 2/09/2018, 02/19/2021, 07/09/2021, 03/18/2022
- U.S. Ports: 04/15/2016, 05/20/2016, 11/18/2016, 04/06/2018, 10/15/2021
- Secured Credits: 08/07/2015, 09/18/2015, 09/25/2015
- Special Tax Bonds: 05/01/2015, 07/31/2015, 09/25/2015, 01/29/2016, 5/5/2017, 09/29/2017, 5/18/2018, 04/26/2019, 05/03/2019, 01/31/2020, 05/20/2022
- States: 11/13/2020, 2/5/2021, 09/24/2021, 02/25/2022, 03/04/2022, 07/08/2022
- SIFMA/Floating Rate notes: 03/15/2016, 08/26/2016, 3/31/2017, 4/28/2017, 04/13/2018, 9/14/2018, 02/20/2019, 04/26/2019
- Taxable bonds: 5/11/2018, 12/14/2018, 03/29/2019, 05/31/2019, 09/27/2019, 04/03/2020, 07/10/2020, 07/24/2020, 08/14/2020, 08/21/2020, 10/16/2020, 10/23/2020, 08/06/2021, 10/22/2021, 11/12/2021, 04/08/2022, 06/03/2022, 07/29/2022, 08/05/2022
- Toll Roads: 9/16/2016, 5/12/2017, 09/15/2017, 07/10/2020, 07/15/2022
- Tobacco: 11/20/2015, 12/15/2017, 7/27/2018, 03/29/2019, 05/07/2021, 08/19/2022, 08/26/2022, 5/10/24, 5/17/24
- Water & Sewer: 05/06/2016, 6/24/2016, 02/02/2018, 12/17/2021, 7/14/23, 5/31/24
Specific Credits
- Assured Guaranty: 03/18/2016, 6/23/2017, 10/27/2017
- National Public Finance Guarantee Corporation: 6/23/2017, 10/27/2017
- Chicago & related credits: 9/23/2016, 2/10/2017, 04/13/2018, 10/25/2019, 02/07/2020, 06/12/2020, 10/23/2020, 02/19/2021, 10/01/2021, 05/13/2022, 10/14/22
- Detroit: 05/14/2021
- Dallas/Fort Worth & related credits: 6/02/2017, 08/04/2017, 04/13/2018
- Houston & related credits: 02/19/2016, 6/02/2017, 08/04/2017, 09/01/2017
- New York City & related credits: 03/31/2015, 6/17/2016, 9/9/2016, 8/17/2018, 08/23/2019, 06/12/2020, 05/21/2021, 04/08/2022, 04/22/2022, 05/20/2022, 01/20/2023
- Puerto Rico: 3/17/2017, 5/5/2017, 5/12/2017, 6/02/2017, 09/22/2017, 5/04/2018, 9/7/2018, 02/22/2019, 04/26/2019, 05/10/2019, 05/17/2019, 02/21/2020, 03/05/2021, 04/30/2021, 01/28/2022, 02/04/2022, 03/11/2022, 03/18/2022, 03/31/2023, 07/28/2023
- Santee Cooper / MEAG / Westinghouse Bankruptcy: 3/17/2017, 3/24/2017, 3/31/2017, 9/21/2018, 9/28/2018
- State of Alaska: 07/28/2017, 06/15/2018
- State of California & locals: 03/02/2018, 03/09/2018, 06/08/2018, 02/05/2021, 04/29/2022, 05/06/2022, 01/27/2023
- State of Connecticut & locals: 8/18/2017, 5/18/2018, 10/4/2019, 05/01/2020
- State of Illinois & related credits: 9/29/2017, 7/13/2018, 1/11/2019, 03/01/2019, 05/31/2019, 07/26/2019, 02/28/2020, 05/01/2020, 02/19/2021, 05/20/2022
- State of New York: 5/16/2014, 09/29/2017, 2/8/2019, 02/10/2023
- State of New Jersey & locals: 6/17/2016, 8/05/2016, 3/24/2017, 3/31/2017, 4/27/2018, 5/04/2018, 03/15/2019, 05/01/2020, 05/21/2021, 06/04/2021
- State of Pennsylvania: 7/15/2016
- State of Texas & locals: 08/04/2017, 08/16/2019, 03/12/2021, 03/19/2021, 02/03/2023
- State of Wisconsin & locals: 03/15/2015, 9/30/2016
- U.S. Virgin Islands & Guam: 07/15/2016, 07/29/2016, 2/24/2017
Defaults/Distressed Munis
- Chapter 9/Distressed locals: 10/31/2014, 11/21/2014, 06/30/2015, 07/08/2016, 04/26/2019, 01/31/2020, 02/07/2020
- Defaults: 11/20/2015, 06/24/2016, 07/08/2016, 08/26/2016, 8/24/2018, 04/23/2020, 07/24/2020, 09/24/2021, 02/11/2022, 03/11/2022, 07/29/2022, 01/6/2023, 01/05/24
- GO Security/Statutory Lien: 10/2/2015, 11/4/2016
Tax Policy
- AMT: 03/16/2018, 5/18/2018, 10/19/2018, 06/14/2019, 04/01/2022, 05/20/2022, 12/9/2022, 07/28/2023, 02/02/2024
- De minimis: 03/02/2018, 06/14/2019, 03/25/2022, 05/06/2022, 05/13/2022
- State and local tax (SALT) deduction cap: 1/26/2018, 7/6/2018,4/16/2021, 10/22/2021, 02/09/24
- Tax swapping: 1/24/2014, 10/28/2016, 2/09/2018, 10/12/2018, 11/15/2019
- Tax reform: 2/28/2014, 12/16/2016, 4/28/2017, 5/05/2017, 6/16/2017, 09/29/2017, 10/272017, 11/03/2017, 11/10/2017, 1/26/2018
Other Federal Public Policy
- BABs: 02/23/24, 03/01/24,06/21/24
- COVID-19: 03/06/2020, 03/13/2020, 03/20/2020, 03/27/2020, 04/03/2020, 04/17/2020, 06/26/2020, 07/31/2020, 01/08/2021, 02/26/2021, 09/17/2021
- CARES Act: 04/03/2020, 01/21/2022
- American Rescue Plan: 03/26/2021, 04/09/2021, 05/21/2021, 01/21/2022
- Inflation Reduction Act: 08/05/2022, 08/19/2022, 08/26/2022
- Infrastructure spending: 04/09/2021, 05/14/2021, 07/16/2021, 08/06/2021, 09/17/2021, 01/21/2022
- Fed facilities/Municipal Liquidity Facility: 8/11/2020
- Regulatory reform/High-Quality Liquid Assets: 04/01/2016, 07/14/2017, 03/09/2018, 8/24/2018
- Health-care reform/Medicaid funding: 3/10/2017, 3/17/2017, 3/24/2017, 6/23/2017, 07/28/2017, 11/22/2017
- Trade war and tariffs: 04/06/2018, 06/07/2019
Periodic Updates
- 2024 election: 6/7/24
- Coupon performance: 04/08/2016, 9/21/2018, 03/15/2019, 06/14/2019, 06/28/2019, 10/18/2019, 08/20/2021, 04/01/2022, 08/26/2022, 09/09/2022
- Federal Reserve Flow of Funds: 01/10/2020, 03/27/2020, 06/26/2020, 09/25/2020, 12/11/2020, 06/18/2021, 09/24/2021, 12/17/2021, 03/18/2022, 06/10/2022, 09/16/2022, 12/16/2022 , 12/15/2023, 03/15/24
- Make-Whole Call: 04/22/2016, 07/12/2019
- Outflow cycle: 10/29/2021, 11/05/2021, 03/11/2022, 04/01/2022, 04/29/2022, 05/06/2022, 05/13/2022, 09/16/2022
- Short call bonds: 08/28/2015, 12/11/2015, 03/04/2016, 3/3/2017, 3/10/2017, 08/04/2017, 03/26/2021, 10/01/2021, 06/10/2022
- Taxable advance refunding: 09/13/2019, 10/25/2019, 10/16/2020, 10/01/2021
- Total Return & Performance: 05/13/2016, 06/10/2016, 5/19/2017, 07/07/2017, 11/10/2017, 02/23/2018, 1/4/2019, 01/10/2022, 04/08/2022
- Sovereign Government Relative Value: 09/09/2016, 01/19/2018, 8/17/2018
- State and Local revenues: 04/13/2018, 9/21/2018, 1/11/2019, 05/17/2019, 06/21/2019, 09/20/2019, 01/10/2020, 04/17/2020, 09/11/2020, 09/18/2020, 11/13/2020, 01/29/2921, 06/18/2021, 11/12/2021, 03/25/2022, 09/09/2022, 11/10/22, 2/24/2023, 02/23/24,06/12/24
- Appropriation debt: 8/19/2016, 01/26/2024
Municipal Market Outlook
Weekly Updates
- Economic and policy updates
- Next week’s supply, fund flows
- Comparisons versus Corporates, Treasuries, and Global Sovereigns
- Full year gross, net-supply estimates, and interest rate forecast
Emerging Markets
- In EM fixed income, we are MW GBI-EM local rates, CEMBI and EMBIGD.
- EM bond flows were -$1.4bn (-0.36% of weekly AUM, down from -$1.0bn)
EM credit spreads tightened across the board over the last week. EMBIGD at 400bo tightened by 11bp while CEMBI did so by7bp to settle at 230bp. GBI-EM yields closed at 6.25%. Overall retail outflows accelerated to -$1.4bn this week (from -$1.0bn). Outflows were distributed across hard and local currency funds; hard currency fund outflows decreased moderately to -$697mn this week (from -$760mn), while local currency fund outflows increased to -$703mn (from -$257mn). ETF outflows modestly declined to -$535mn (from -$629mn), while non-ETF outflows grew to -$865mn (from -$388mn). Within local currency, EM ex-China saw outflows of -$558mn (from -$209mn), and China-focused funds outflows of -$145mn (from -$48mn). On the hard currency side, AsiaXJ funds saw outflows of -$269mn (from -$263mn), while “broad” EM funds saw outflows of -$428mn (from -$497mn).
CEE Rates: Less bang for your buck
Following the fast and sharp rally in CEE yields, the bullish CEE rates thesis is once again in question. While we believe the overall environment remains supportive for EM duration, we think the primary challenge for CEE rates is now valuations. Broadly, front-end swaps and long-end bonds in CEE now adequately price the cross-currents of a more dovish Fed and ECB, growth that is bending but not breaking, and domestic disinflation that is starting to lose steam. To be sure, some bullish opportunities remain, but we believe these are confined to select long-end CEE swaps and bonds. We see no value in receiving CEE front-ends, where more prohibitive negative carry/roll and already low terminal rate pricing are significant hurdles.
We think front-end CEE swaps will struggle to move lower unless global/domestic data deteriorates further. We take profit on PLN 2y1y IRS receivers (entry: 4.30%, exit: 3.63%, total return: +67bp) and hold PLN 9x12 FRA payers (entry: 5.39%, current: 4.84%, target: 5.45%, review: 4.60%, total return: -39bp) entered on 19 July to fade the pricing of near-term NBP cuts. Given the current balance of growth, inflation and DM central bank pricing, we think CEE policy rates in 2-3y time are priced to perfection in Czechia (at 3.10%) and Poland (at 3.50%) and only modestly high in Hungary (at 5.30-5.50%). Over shorter horizons, we think market pricing of NBP cuts has gone too far. Accordingly, we convert PLN FRA-IRS flatteners (receive 2y1y, pay 9x12 FRA) into outright 9x12 FRA payers, with the market too readily dismissing the near-term hawkish rhetoric of the NBP, in our view.
Long-end CEE swaps offer more opportunities for medium-term constructive views, particularly in Hungary, where premia is elevated and curves are steep. We hold HUF 5y5y IRS receivers (entry: 6.76%, current: 6.36%, target: 6.10%, review: 7.15%, total return: +47bp) entered on 04 April. Longer-dated CEE swap receivers are partly a view on some convergence back to the “old” CEE and partly a view that we are in a bullish global duration environment where lower core rates will bring CEE rates lower. Within this view, we identify pockets of cheapness through metrics such as relative valuations, inflation premia pricing and curve shapes. Hungary rates score best on these metrics. We hold 5y5y HUF IRS receivers following the recent retracement and amid a relatively bullish near-term forint outlook. Long-end CZK swaps remain on our radar too, but we prefer long-end CZK bonds.
CEE bond valuations are now broadly fair to modestly rich after the latest moves, despite lagging the swaps rally; CZGBs are the exception. We take profit on our long-standing OW in POLGBs and move MW, while holding OW CZGBs in the GBI-EM Model Portfolio. For the most part, CEE bond yields now fully price forward-looking forecasts on our models, limiting scope for further bond rallies unless domestic inflation collapses or growth data starts looking more recessionary. Notably, POLGBs now screen rich on our bottom-up models (having flagged cheap this year) and POLGB valuations versus HGBs are increasingly unattractive. This prompts us to take profit on our OW POLGBs entered in June 2023 and move MW. In contrast, CZGBs remain fundamentally cheap and supported by reduced competition from core rates, an outlook for now only modest koruna weakness and some positioning reduction. We stay OW CZGBs having recently re-entered longs.
For further detail, see CEE Rates: Less bang for your buck, A. Christovova & M. Harrison, August 14, 2024
EM Quick Take: Thailand: Political (& Fiscal) Uncertainty
Given heightened uncertainty around the fiscal outlook, we elect to close out of our THB 2s10s NDOIS steepener (entry date: 09-May-24, entry: +50bp, exit: +36bp, total return: -18bp), and stay MW THAIGBs in the GBI-EM Model Portfolio. We have long held concerns over the fiscal outlook in Thailand given the digital wallet scheme has been expected to materially increase the FY25 deficit, add to public/debt GDP concerns, and potentially spill over to the bond market via increased local market supply. We previously took profits on our outright THB 10y payers (see here) and also on our UW THAIGB stance in the GBI-EM Model Portfolio (see here) on the premise that the external outlook was more conductive to a lower rates backdrop, but held onto a THB 2s10s steepener as a more beta neutral expression of local fiscal concerns. However, with the fiscal outlook now much less clear and risks of both a delay to the FY25 budget and roll out of the digital wallet scheme, we elect to close out of this position, and look to potentially re-engage if/when more clarity around the outlook around spending comes out later in the year. Historically, we would note that the curve does tend to steepen around the onset of BoT cutting cycles, and while any fiscal spending delay would likely bring this prospect forward, the market is now already pricing in close to three 25bp rate cuts from the central bank over the next 12-24 months, hence the ability for the curve to meaningfully bull steepen in the forward space would be limited this time around, in our view.
For further detail, seeEM Quick Take: Thailand: Political (& Fiscal) Uncertainty, S. Kelly & A. Sandilya, August 14, 2024
EM Corporate Default Monitor
EM Corporates had seen a few defaults and distressed exchanges recently, but with no surprises. Market level EM HY corporate default rate picked up to 2.8% YTD, while CEMBI BD HY went up to 1.2%. The new additions to YTD tally have been within our expectations but frontloaded and we expect a cleaner slate for 2H24. The universe of distressed EM corporate bonds has continued to decline, reflecting default candidates coming off the ledger at a faster rate than additions of new potential default candidates. As such, the share of Latin America and Middle East & Africa bonds trading at distressed levels now stands below US HY, which is one of the factors supporting our view that EM credit cycle is more advanced than DM. We continue to see below historical average default rate for EM corporates this year.
Regionally, Asia’s market level default rate rose to 4.1%, which is not that far away from our full-year forecast of 4.5%. That being said, we do not expect the final year-end tally to materially exceed this forecast. One variable remains the magnitude of repeat defaults in the China property market. The sector is still under pressure and many of the 2021-2023 distressed exchanges were incomplete/not sufficiently comprehensive to prevent repeat credit events, a trend we had highlighted in the past reports. This driver can be a variable for our Asia default rate. Elsewhere, Latin America, at 3.2% is tracking the second highest default rate by region but has a material buffer for defaults from now to year-end to reach our projected 4.6% 2024 figure. In EM Europe and Middle East & Africa, we continue to track more modest YTD default rates of 0.5% and 0.6%, respectively, against forecasts of 2.0% and 0.6%.
For further detail, seeEM Corporate Default Monitor, A. Meyers et al., August 15, 2024
Forecast & Analytics
Interest rate forecast
| Actual | 1m ahead | 3Q24 | 4Q24 | 1Q25 | 2Q25 | |
| 16-Aug | 16-Sep | 30-Sep | 31-Dec | 31-Mar | 30-Jun | |
| Rates (%) | ||||||
| Effective funds rate | 5.33 | 5.35 | 4.85 | 4.10 | 3.60 | 3.10 |
| SOFR | 5.35 | 5.35 | 4.85 | 4.10 | 3.60 | 3.10 |
| 2-yr Treasury | 4.07 | 4.00 | 3.60 | 3.20 | 2.75 | 2.35 |
| 3-yr Treasury | 3.87 | 3.80 | 3.45 | 3.05 | 2.60 | 2.25 |
| 5-yr Treasury | 3.77 | 3.75 | 3.40 | 3.10 | 2.75 | 2.45 |
| 7-yr Treasury | 3.81 | 3.80 | 3.45 | 3.20 | 2.85 | 2.55 |
| 10-yr Treasury | 3.89 | 3.85 | 3.75 | 3.50 | 3.30 | 3.15 |
| 20-yr Treasury | 4.26 | 4.25 | 4.15 | 3.95 | 3.75 | 3.60 |
| 30-yr Treasury | 4.15 | 4.15 | 4.10 | 3.90 | 3.80 | 3.70 |
| Spreads (bp) | ||||||
| Fed funds/2yr | -126 | -135 | -125 | -90 | -85 | -75 |
| 2s/10s | -17 | -15 | 15 | 30 | 55 | 80 |
| 2s/5s | -30 | -25 | -20 | -10 | 0 | 10 |
| 5s/10s | 12 | 10 | 35 | 40 | 55 | 70 |
| 5s/30s | 38 | 40 | 70 | 80 | 105 | 125 |
| 10s/30s | 26 | 30 | 35 | 40 | 50 | 55 |
Source: J.P. Morgan
Swap spread forecast*
| Actual | YE24 | |
| 16-Aug-24 | 31-Dec-24 | |
| SOFR Swap Spread (bp) | ||
| 2-year SOFR swap spread (bp) | -18 | -6 |
| 5-year SOFR swap spread (bp) | -29 | -22 |
| 10-year SOFR swap spread (bp) | -44 | -37 |
| 30-year SOFR swap spread (bp) | -80 | -79 |
* Forecast uses matched-maturity spreads
Source: J.P. Morgan
TIPS real yield & breakeven forecast
| Actual | 3Q24 | 4Q24 | 1Q25 | 2Q25 | |
| 16-Aug-24 | 30-Sep-24 | 31-Dec-24 | 31-Mar-25 | 30-Jun-25 | |
| Breakevens (bp) | |||||
| 5Y | 198 | 195 | 200 | 200 | 200 |
| 10Y | 210 | 205 | 200 | 210 | 210 |
| 30Y | 211 | 210 | 210 | 210 | 215 |
| Real yields (%) | |||||
| 5Y | 1.79 | 1.45 | 1.10 | 0.75 | 0.45 |
| 10Y | 1.80 | 1.70 | 1.50 | 1.20 | 1.05 |
| 30Y | 2.05 | 2.00 | 1.80 | 1.70 | 1.55 |
| Curves (bp) | |||||
| 5s/10s BE | 11 | 10 | 0 | 10 | 10 |
| 10s/30s BE | 2 | 5 | 10 | 0 | 5 |
| 5s/10s yld | 0 | 25 | 40 | 45 | 60 |
| 10s/30s yld | 25 | 30 | 30 | 50 | 50 |
Source: J.P. Morgan
Economic forecast
| %ch q/q, saar, unless otherwise noted | ||||||||||
| 23Q4 | 24Q1 | 24Q2 | 24Q3 | 24Q4 | 25Q1 | 25Q2 | 2023* | 2024* | 2025* | |
| Gross Domestic Product | ||||||||||
| Real GDP | 2.1 | 4.9 | 3.4 | 1.4 | 2.8 | 1.3 | 1.0 | 3.1 | 1.6 | 1.9 |
| Final Sales | 2.1 | 3.6 | 3.9 | 1.8 | 2.0 | 1.5 | 0.9 | 3.5 | 1.6 | 1.8 |
| Domestic Final Sales | 2.0 | 3.5 | 3.6 | 2.4 | 2.7 | 1.9 | 1.3 | 3.2 | 2.1 | 1.9 |
| Business Investment | 7.4 | 1.4 | 3.7 | 4.4 | 5.2 | 2.1 | 3.4 | 4.6 | 3.8 | 4.6 |
| Net Trade (% contribution to GDP) | 0.0 | 0.0 | 0.3 | -0.7 | -0.7 | -0.4 | -0.4 | 0.3 | -0.5 | -0.1 |
| Inventories (% contribution to GDP) | 0.0 | 1.3 | -0.5 | -0.4 | 0.8 | -0.3 | 0.1 | -0.4 | 0.1 | 0.1 |
| Prices and Labor Cost | ||||||||||
| Consumer Price Index | 3.0 | 3.4 | 2.7 | 3.8 | 2.8 | 1.3 | 2.5 | 3.2 | 2.6 | 2.3 |
| Core | 4.7 | 3.0 | 3.4 | 4.2 | 3.2 | 1.9 | 2.5 | 4.0 | 3.0 | 2.4 |
| Employment Cost Index | 4.1 | 4.1 | 3.8 | 4.8 | 3.7 | 3.0 | 2.8 | 4.2 | 3.6 | 2.9 |
| Unemployment Rate (%, sa) | 3.6 | 3.7 | 3.7 | 3.8 | 4.0 | 4.3 | 4.5 | - | - | - |
| * Q4/Q4 change | ||||||||||
Source: J.P. Morgan
Financial markets forecast
| Credit Spread | Current | YE24 |
| 10-year SOFR swap spread (bp) † | -44 | -37 |
| FNMA 30yr 6% Front Tsy OAS (bp) | 24 | 25 |
| 10yr conduit CMBS LCF AAA † | 103 | 95 |
| 3-year AAA card ABS to Treasuries (bp) | 50 | 40 |
| JULI spread to Treasuries (bp) | 111 | 110 |
| High Yield Index | 368 | 380 |
| Emerging Market Index | 400 | 400 |
| Local currency: GBI-EM yield (%) | 6.25% | 5.58% |
cont.
| Current | YE24 | |
| S&P 500 (level)† | 5554 | 4200 |
| Brent ($/bbl) | 80 | 83 |
| Gold ($/oz) | 2508 | 2300 |
| EUR/USD | 1.10 | 1.05 |
| USD/JPY | 148 | 146 |
† Mid-year forecasts only
Source: J.P. Morgan
Gross fixed-rate product supply*

Treasury client survey

Source: J.P. Morgan
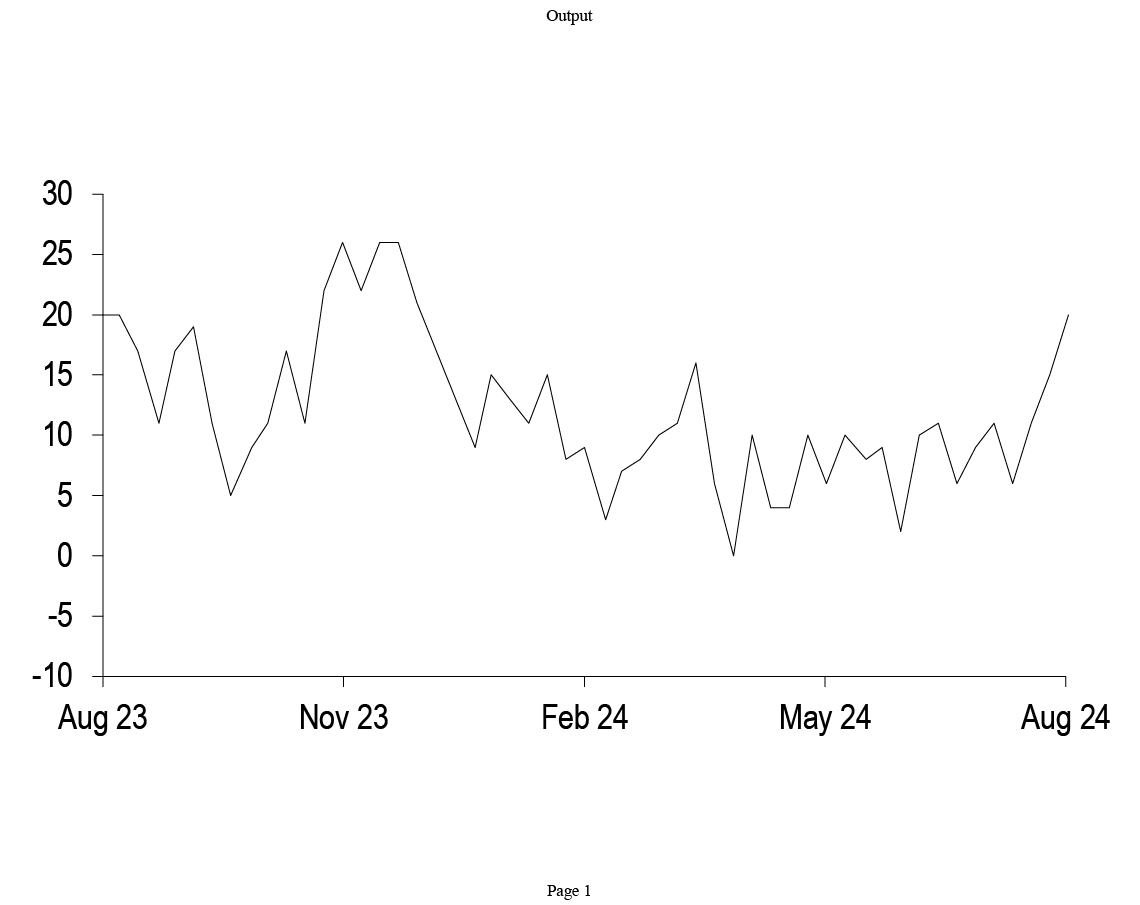
Source: J.P. Morgan
Treasury net issuance forecast
J.P. Morgan projection of net Treasury issuance to private investors, Federal Reserve purchases of Treasuries, and expected change in Treasuries held by private investors; $bn
| Year | Net privately-held borrowing | Fed secondary market purchases | Net change in privately-held debt | |||
| Bills | Coupons | Bills | Coupons | Bills | Coupons | |
| CY 2019 | 77 | 1133 | 169 | 77 | -92 | 1056 |
| CY 2020 | 2547 | 1752 | 157 | 2184 | 2390 | -432 |
| CY 2021 | -1195 | 2898 | 0 | 957 | -1195 | 1942 |
| CY 2022 | -37 | 1638 | 0 | 75 | -37 | 1563 |
| CY 2023 | 2047 | 1107 | 0 | 0 | 2047 | 1107 |
| CY 2024 | 400 | 1909 | 0 | 0 | 400 | 1909 |
Source: J.P. Morgan, US Treasury, Federal Reserve Bank of New York
T-bill weekly net issuance
Weekly net issuance of T-bills, historical and JPM projections; $bn
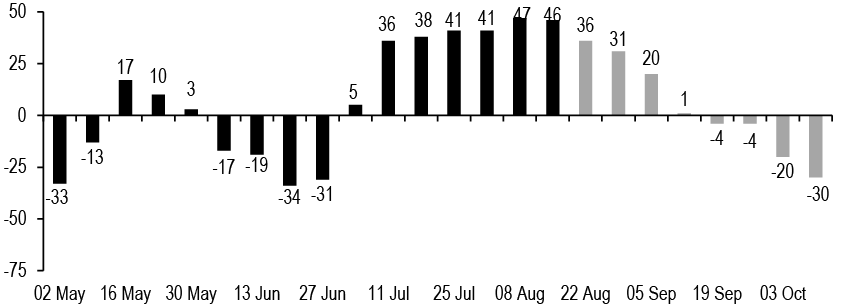
Source: J.P. Morgan
Dealer inventories
Primary dealer positions in Treasuries*, with 5-year statistics; $bn
| Maturity | Last | 1w chg | 5y avg | 5y min | 5y max | 5y z-score |
| T-bills | 89 | 29 | 53 | -4 | 119 | 1.4 |
| <2y | 24 | -2 | 33 | -17 | 96 | -0.4 |
| 2-3y | 14 | 2 | 5 | -14 | 18 | 1.6 |
| 3-6y | 78 | 5 | 29 | -2 | 78 | 2.9 |
| 6-7y | 23 | -2 | 13 | -4 | 29 | 1.6 |
| 7-11y | 32 | 10 | 4 | -10 | 32 | 3.5 |
| >11y | 48 | 0 | 46 | 27 | 62 | 0.3 |
| 11-21y | 29 | 2 | ||||
| >21y | 35 | 3 | ||||
| TIPS | 24 | 2 | 13 | 1 | 25 | 2.0 |
| FRNS | 27 | 0 | 7 | -14 | 29 | 2.9 |
| Total | 361 | 45 | 203 | 76 | 361 | 2.7 |
Source: Federal Reserve Board of New York
*Latest data as of 8/7/2024
Investor position technical indicators
Current value of various position indicators* versus 1 month ago; 1-year z-score
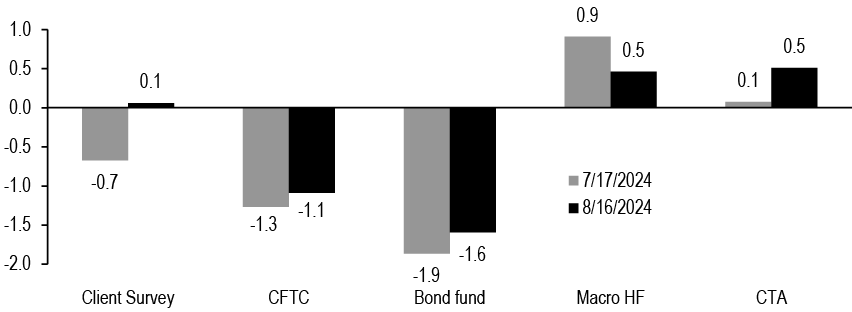
Source: CFTC, Bloomberg Finance L.P, SG, HFR, J.P. Morgan
* JPM Client Survey refers to a 4-week moving average of our Treasury Client Survey Index; (Longs+Neutrals)/(Shorts+Neutrals), see Survey Says: Using the Treasury Client Survey to predict rates moves, 7/21/23for more details. CFTC refers to the non-commercial net longs in UST and SOFR futures contracts reported by the CFTC. CTA beta is the four-week partial beta of SG CTA Index to 10-year UST yields. Real money beta is the eight-week partial beta of excess returns of the 20 largest actively managed US core bond funds to 10-year UST yields. Macro HF beta is the six-week partial beta of HFRX Macro/CTA Index to 10-year UST yields
Treasury market functioning metrics
Various metrics of Treasury market functioning; units as indicated
| Indicator | Today | 1w chg | 1y avg | 1y min | 1y max | 1y z-score |
| Duration weighted mkt depth*; $mn | 230 | 1.1 | 214 | 94 | 308 | 0.4 |
| 10y price impact**; 32nds | 0.8 | 0.0 | 0.8 | 0.4 | 1.1 | 0.4 |
| 1m GC/OIS; bp | 14.6 | 4.0 | 7 | 0.4 | 14.6 | 2.6 |
| UST curveRMSE***; bp | 0.0 | -1.4 | 1.4 | 0.0 | 1.7 | -8.7 |
| 10s/3x old 10s ASW; bp | -0.6 | -0.1 | -1.1 | -3.1 | 0.7 | 0.6 |
| 30s/3x old 30s ASW; bp | 1.1 | 1.5 | -0.3 | -2.1 | 1.8 | 1.7 |
Source: J.P. Morgan, BrokerTec
* Market depth is the sum of the three bids and offers by queue position, averaged between 8:30 and 10:30am daily
** Price impact defined as the average move in order book mid-price against a $100mn flow in traded notional. See Drivers of price impact and the role of hidden liquidity, J. Younger et al., 1/13/17 for more details.
*** Root Mean Square Error of J.P. Morgan par fitted Treasury curve (see The (par) curves they are a-changin’, 7/23/24)
Select Federal Reserve balance sheet items
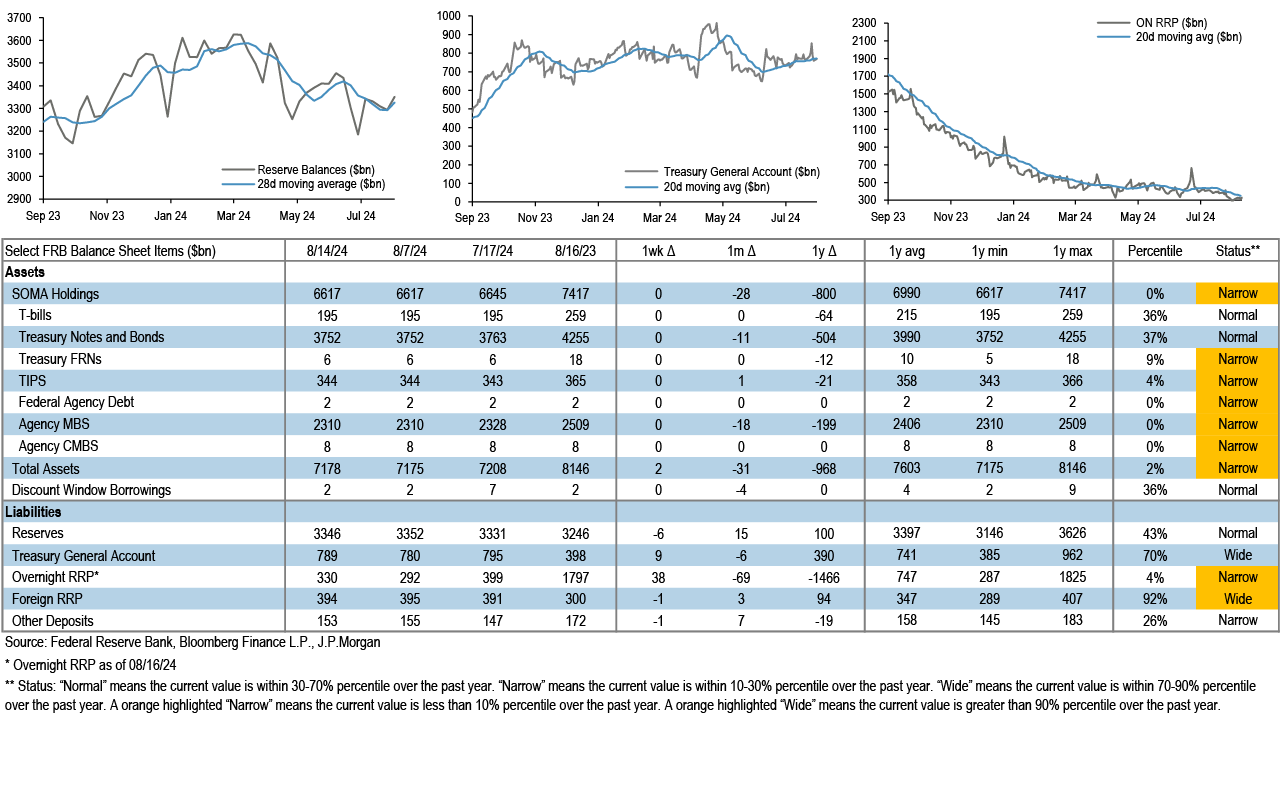
Money market funds
Assets under management ($bn)
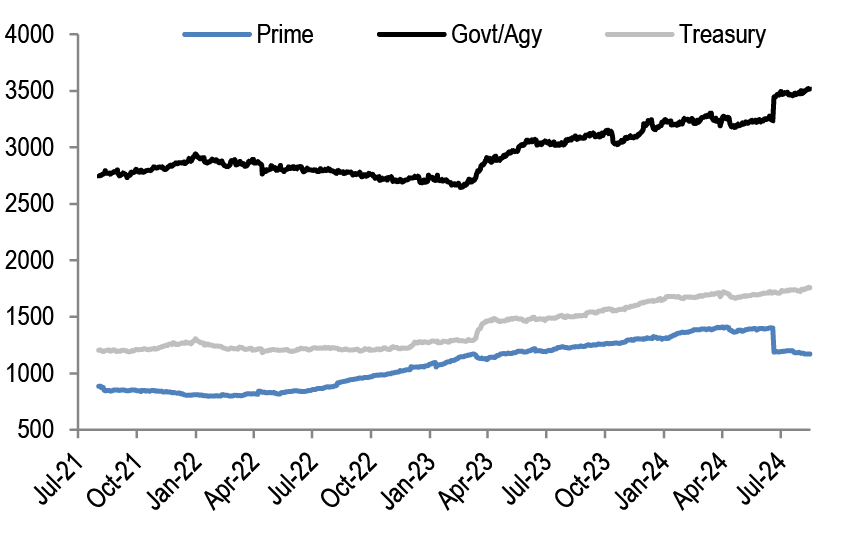
Weighted average maturity (days)
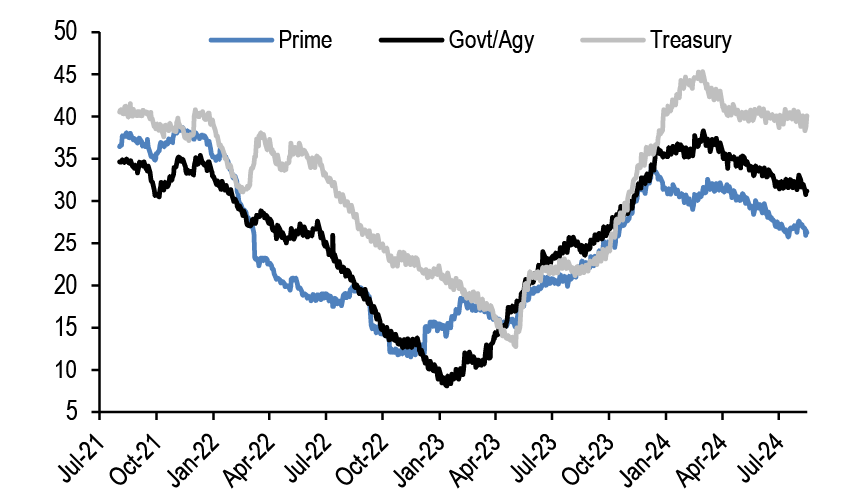
Source: Crane Data, J.P. Morgan
US funds flows
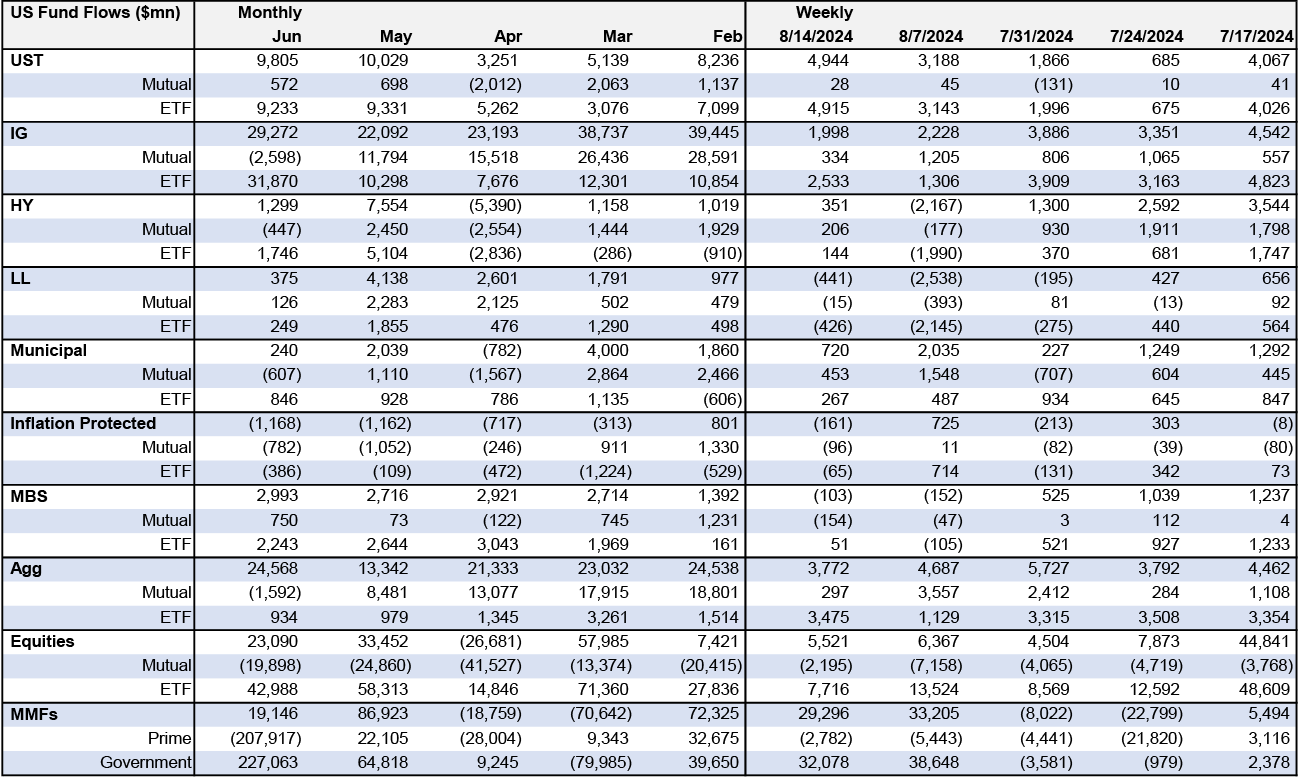
Source: EPFR, Crane Data, J.P. Morgan
Market Movers Calendar
| Monday | Tuesday | Wednesday | Thursday | Friday |
|---|---|---|---|---|
| 19 Aug Leading indicators(10:00am) Jul
Fed Governor Waller speaks(9:15am) |
20 Aug Philadelphia Fed nonmanufacturing(8:30am) Aug
Atlanta Fed President Bostic speaks(1:35pm) Fed Vice Chair for Supervision Barr speaks(2:45pm) |
21 Aug QSS(10:00am) 2Q adv
FOMC minutes (2:00pm)
Auction 20-year bond $16bn |
22 Aug Initial claims(8:30am) w/e Aug 17 230,000 Manufacturing PMI(9:45am) Aug flash 49.0 Services PMI(9:45am) Aug flash 54.0 Existing home sales(10:00am) Jul 3.95mn KC Fed survey(11:00am) Aug
KC Fed Jackson Hole Symposium
Announce 2-year note $69bn Auction 30-year TIPS (r) $8bn Announce 2-year FRN (r) $28bn Announce 5-year note $70bn Announce 7-year note $44bn |
23 Aug New home sales(10:00am) Jul 610,000
Fed Chair Powell speaks(10:00am)
KC Fed Jackson Hole Symposium |
| During the week: KC Fed Jackson Hole Symposium (24 Aug) | ||||
| 26 Aug Durable goods(8:30am) Jul Dallas Fed manufacturing(10:30am) Aug |
27 Aug FHFA HPI(9:00am) Jun, 2Q S&P/Case-Shiller HPI(9:00am) Jun, 2Q Richmond Fed survey(10:00am) Aug Consumer confidence(10:00am) Aug Dallas Fed services(10:30am) Aug
Auction 2-year note $69bn |
28 Aug Auction 2-year FRN (r) $28bn Auction 5-year note $70bn
Atlanta Fed President Bostic speaks(6:00pm) |
29 Aug Real GDP(8:30am) 2Q second Advance economic indicators(8:30am) Jun Initial claims(8:30am) w/e Aug 24 Pending home sales(10:00am) Jul
Auction 7-year note $44bn
Atlanta Fed President Bostic speaks(3:30pm) |
30 Aug Personal income(8:30am) Jul Consumer sentiment(10:00am) Aug final |
| 2 Sep Labor Day, markets closed |
3 Sep Manufacturing PMI(9:45am) Aug final ISM manufacturing(10:00am) Aug Construction spending(10:00am) Jul |
4 Sep International trade(8:30am) Jul Durable goods(10:00am) Aug JOLTS(10:00am) Jul Factory orders(10:00am) Aug Beige book(2:00pm) Light vehicle sales Aug |
5 Sep ADP employment(8:15am) Aug Productivity and costs(8:30am) 2Q Initial claims(8:30am) w/e Aug 31 Services PMI(9:45am) Aug final ISM services(10:00am) Aug
Announce 3-year note $58bn Announce 30-year bond (r) $22bn Announce 10-year note (r) $39bn |
6 Sep Employment(8:30am) Aug |
| 9 Sep Wholesale trade(10:00am) Jul Consumer credit(3:00pm) Jul |
10 Sep NFIB survey(6:00am) Aug QFR(10:00am) 2Q
Auction 3-year note $58bn |
11 Sep CPI(8:30am) Aug QSS(10:00am) 2Q
Auction 10-year note (r) $39bn |
12 Sep PPI(8:30am) Aug Initial claims(8:30am) w/e Sep 7 Federal budget(2:00pm) Aug
Announce 10-year TIPS (r) $17bn Announce 20-year bond (r) $13bn Auction 30-year bond (r) $22bn |
13 Sep Import prices(8:30am) Aug Consumer sentiment(10:00am) Sep preliminary |
Source: Private and public agencies and J.P. Morgan. Further details available upon request.
- 1
Please see 2024 J.P. Morgan Automotive Conference Takewaways (August 12, 2024) from our Auto Equity and Credit Research teams for a summary of the discussions with various senior management and industry experts