
US Weekly Prospects
Data Watch
- The July jobs report was a sizable disappointment, as the unemployment rate jumped 0.2%-pt to 4.3%...
- … and nonfarm payrolls rose a soft 114k, with downward revisions to prior months
- We now see the Fed cutting 50bp at the next two meetings, then 25bp thereafter to 3% next year
- Other labor market data this week show cooling wage growth but elevated jobless claims
What a difference two days make. The July jobs report was a big downside surprise with fairly broad-based signs of weakening, including much-softer-than-expected job growth (up 114,000) and jump in the unemployment rate to 4.3%. Had the Fed had this report in hand going into the FOMC meeting this past Wednesday, it almost certainly would have cut the policy rate by at least 25bp. Now that it looks to be materially behind the curve, we expect a 50bp cut at the September meeting, followed by another 50bp cut in November. From a risk-management perspective, even somewhat stronger inflation or labor market data in the intervening releases should not preclude the Fed from catching up more quickly.
Indeed, a case could be made for an intermeeting easing, especially if the data soften further—although Fed officials might worry about how such a move could be (mis)interpreted. Regardless, with Chair Powell stressing in his press conference that the Fed is carefully watching for signs the labor market could be more than just cooling, attention will be keenly focused on his remarks at the Jackson Hole Symposium later this month, if not sooner. Dovish Chicago Fed president Goolsbee, who was the first Fed official to address the July jobs report, surprisingly advocated for caution and to not overreact to one month’s number—but also declared that the Fed needed to balance policy with the economic data in “short order”and that multiple rate cuts are in the cards.
Looking beyond the next two FOMC meetings, we see the Fed continuing to cut 25bp per meeting until it gets the policy rate much closer to neutral. Assuming that is around 3%, the easing cycle would extend into 3Q25. Overall, this is a more accelerated easing pace than we had previously expected or the Fed had signaled in the now-stale June dot plot.
Looking Sahm-what worse
The details of the July jobs report were not good. The disappointing payroll gains reflected weaker growth across several sectors, and prior months were revised 29k lower. We had flagged the possibility that the impact of Hurricane Beryl could bias down both payrolls and the workweek, while biasing up average hourly earnings. In the event, the workweek was modestly softer (ticking down to 34.2) but wage growth rose just 0.2% overall and 0.3% for production and non-supervisory workers, easing the year-ago growth rates to 3.6% and 3.8%, respectively. The BLS concluded no measurable effect on the data from Beryl, and the distortions in the establishment survey may not have been large despite big jumps in people reporting they did not work or worked fewer than usual hours in the household survey.
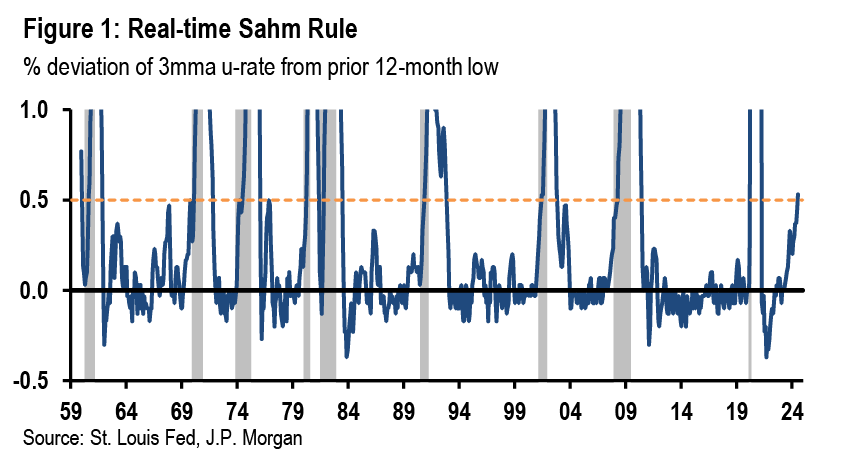
The household survey should have been less impacted by Beryl by construction, leaving the two-tenths rise in the unemployment rate to 4.3% that much more concerning. This triggered the Sahm Rule as typically measured (Figure 1), but more importantly suggested a shift to a greater contribution from inflows into unemployment; the previous drift higher in the u-rate largely reflected a slowdown in outflows. Both household employment and unemployment rose with a gain in labor force as the participation rate rose another tenth to 62.7%. More encouragingly, prime-aged participation jumped 0.3%-pt to 84.0%— its highest rate since 2001. But that largely was the extent of any good news in the July release.
In other labor market news….
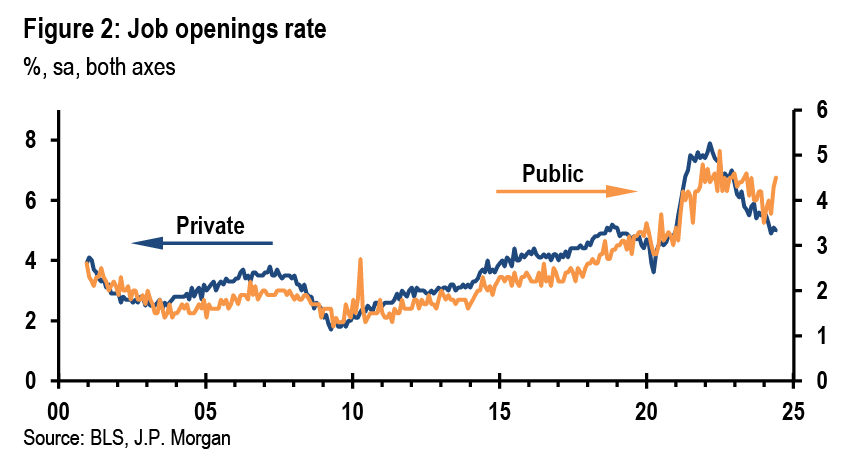
Prior to the July jobs report, other labor market data this week were mostly pointing to some further gradual cooling, as Powell cited in his remarks. The June JOLTS report showed openings, hires, quits and layoffs all declining relative to May. The vacancy/unemployment ratio edged down to 1.20, a new cycle low. The job openings rate was stable at 4.9%, but this was boosted by a second consecutive month of surging openings in government (Figure 2).
On the wage front the news was generally favorable and should reinforce Powell’s belief that the labor market is not contributing to inflationary risks. Labor cost pressures eased in 2Q relative to the beginning of the year, when we saw some unexpected strength in both the employment cost index (ECI) and unit labor costs (ULC). The latter can be quite noisy, but the former is the Fed’s preferred gauge of wage inflation and eased to 3.7%q/q, saar after having popped 4.8% in 1Q. Much like the JOLTS data, the ECI revealed still fairly elevated public sector compensation growth (4.9% for state and local employees versus 3.5% for private workers).
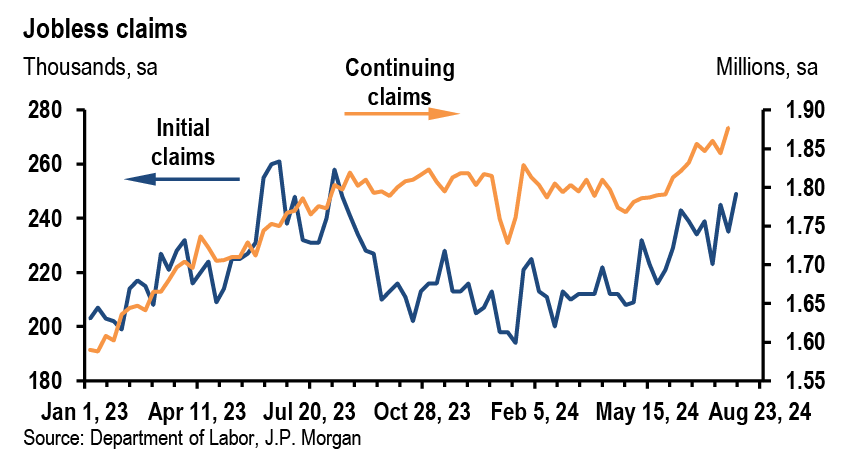
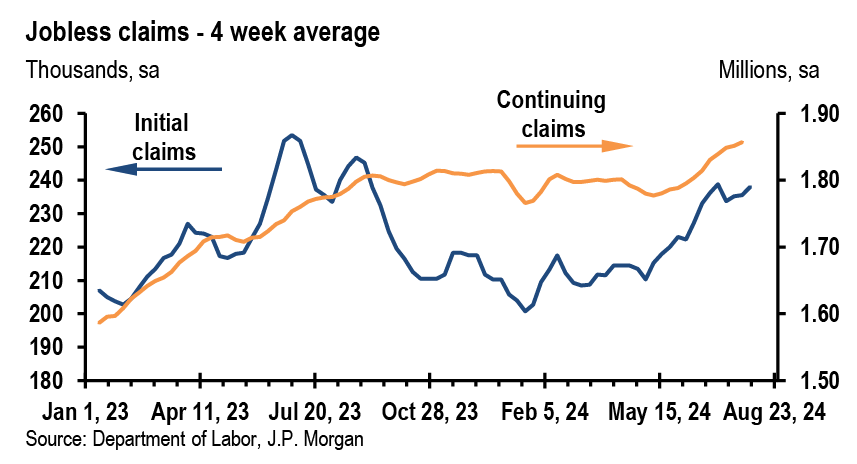
More timely news came with the weekly jobless claims report, which gave a more nuanced picture as both initial and continuing claims moved up, albeit with some residual noise from Hurricane Beryl arguably still affecting the levels. Initial jobless claims for the week ending July 27 jumped to a new high for this year of 249k (from 235k the prior week), and the four-week average approached its recent high from late June. Continuing claims, which shown some stability in recent weeks, broke higher again to 1.877mm. Questions about seasonality have dogged the interpretation of claims lately, and over the past few weeks the NSA initial claims numbers appear to be broadly following the pattern of prior years lower. But the recent rise in continuing claims remains in the NSA data, echoing the more concerning message of labor market weakness in the July employment report.
Manufacturing surveys: divergent declines
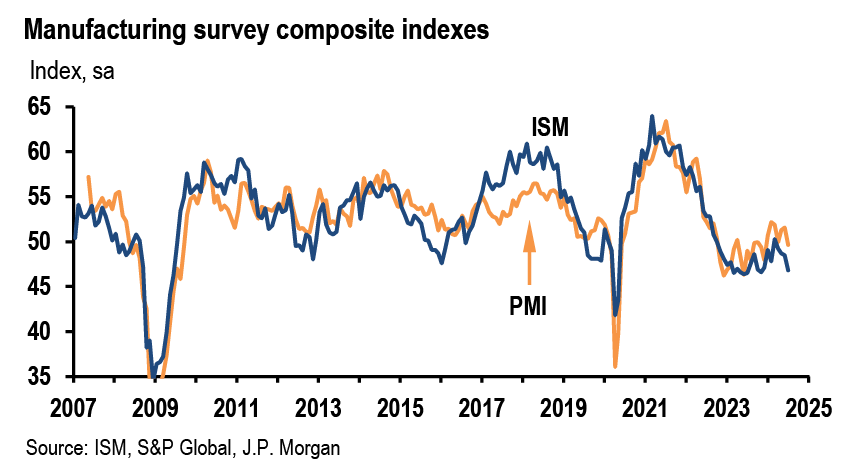
The manufacturing PMI and ISM surveys both weakened in July and point to softness in that sector. But the ISM survey is conveying a considerably more negative message, which so far has not been backed up in the activity data. The ISM composite declined to 46.8, which is barely above the current cycle low (Figure 3). By contrast, the trend in the manufacturing PMI has been modestly higher, with July marking the first decline in three months. While the latest reading of 49.6 is off its earlier peak and at the lower end of what is typically seen during economic expansions, the PMI remains comfortably above its cycle low. The modest uptrend in the PMI also appears more consistent with the actual activity data: manufacturing IP rose 3.6% on a 3m/3m annualized basis in June.
For the ISM survey, the most concerning part was the fall in the employment index, which plunged 6pts to 43.4. That was the lowest level of the current cycle and may point to job losses ahead, whereas the manufacturing PMI employment index does not signal weakness. In the event, the July employment report showed no change in manufacturing jobs.
Home sales and construction data softened
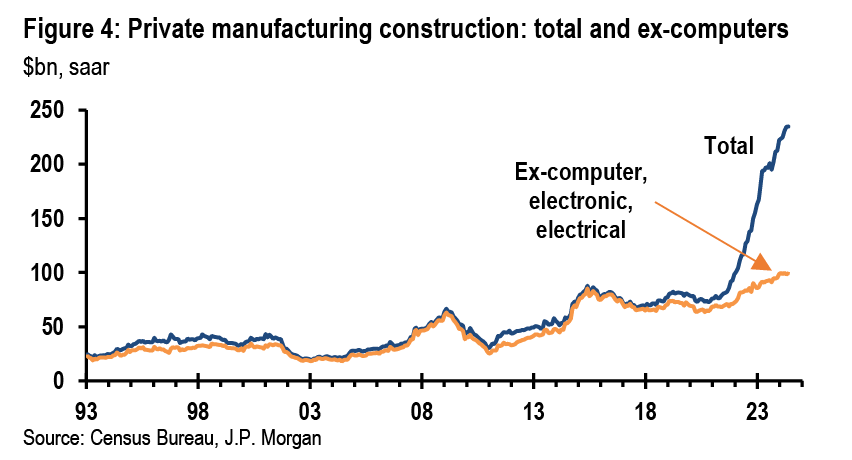
Pending home sales, which lead existing home sales by one to two months, increased 5%m/m in June — albeit from an all-time low. When combined with still-soft weekly mortgage purchase applications, the data are consistent with existing home sales largely moving sideways at very low levels in the near term. The more timely news now for the housing market is what will happen to mortgage rates. With interest rate expectations dropping after the jobs report, mortgage rates could be set for a step down that would likely benefit sales later this year provided a weaker labor market doesn’t materially undermine demand for housing. Construction spending for residential and nonresidential buildings also fell in June, and the trajectory points to the possibility for another drop in private structures investment in 3Q. The decline in housing starts to date should lead to further residential spending reductions in the months ahead, unless improvements begin rising again. For nonresidential building, the surge in manufacturing construction from new technology facilities is continuing but at a slower rate, while spending on most other building types is starting to fall (Figure 4).
Next week will be very light on data. The most important release will be the ISM services survey, with attention focused on whether a large plunge in new orders in June is at least partially reversed. We will also get the latest Senior Loan Officer Opinion Survey , which will offer a look at how credit conditions among banks were changing during 2Q.
Focus: Job finding and rising unemployment
This week’s data pointed to a weakening in the labor market, though also highlighted areas of strength that have nonetheless failed to arrest the upward drift in the unemployment rate. In particular, layoff rates in the June JOLTS fell and have broadly been edging down since early 2023 (Figure 1). The message from this is that weaker hiring without a layoff increase was sufficient to drive higher unemployment. Compounding this challenge, the July employment report’s 0.2%-pt increase in the unemployment rate came despite a stable job finding rate that month, indicating layoffs may also start to add upward pressure to unemployment.
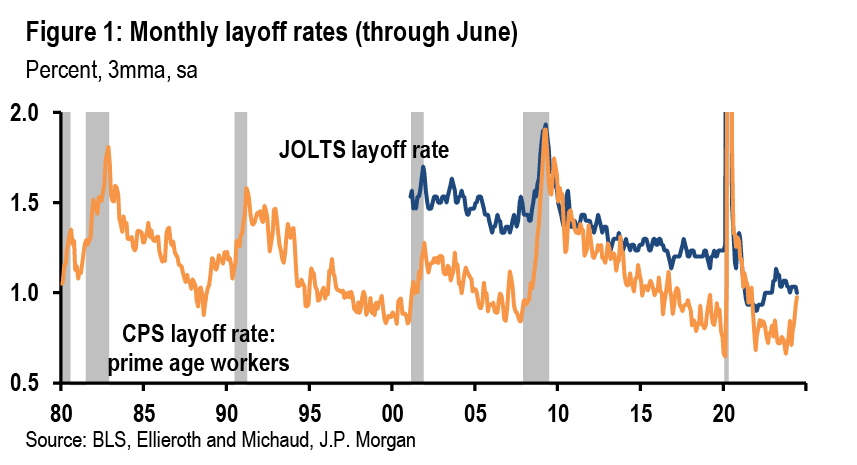
One can also construct a measure of layoffs using the household survey (CPS) by observing workers who made a transition out of employment in a month due to a layoff. In a recent study, Ellieroth and Michaud (2024) construct such a layoff measure (Figure 1). The monthly CPS survey only registers a layoff when a worker (a) exits employment and (b) does not take another job by the time they are interviewed in the next month. Consequently, this CPS layoff rate is sensitive to the chance of finding new work during the month, as opposed to the JOLTS measure which captures all layoffs by surveying employers. Regardless of whether changes in this CPS rate are being driven by rising layoffs or falling hiring, the rate has notably increased in recent months. Its level, which is available through June, is not that much higher than 2019, but the upward move is potentially concerning if it signals more than a normalization following a period at historically low levels. Similar increases in the layoff rate have often, though not always, preceded recessions.
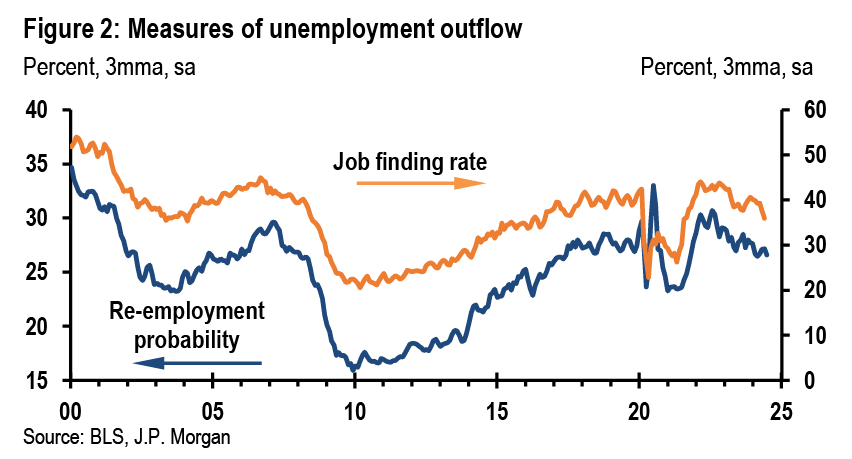
The re-employment rate, the fraction of the unemployed who transition to employment in a given month, is also useful for understanding hiring. Because unemployed workers can also enter employment by moving out of the labor force and later re-entering it, we complement the re-employment probability with the job finding rate introduced by Robert Shimer, which accounts for this. Both measures had been strong after COVID but have since declined a similar amount, signalling that unemployed workers are increasingly struggling to find employment, with the probabilities now slightly worse than in 2019 (Figure 2). However, the monthly job finding rate was stable in July even as unemployment jumped.
Returning to the hiring rate reported in JOLTS, declines now put it back at levels last seen in 2014. But because quits have simultaneously fallen, employment growth has only slowed a bit, unlike the sharp deceleration one would expect if the economy were tipping into recession. Indeed it’s not clear whether quits are so low because hiring is low, or vice versa. For instance, very high levels of job re-allocation immediately following the pandemic might have pulled forward planned job switches, which could later result in low quits.
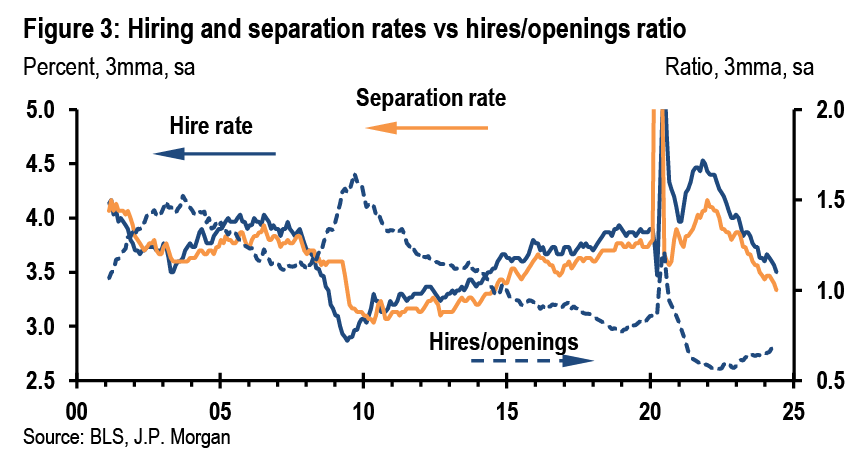
A way to disentangle this is to compare hires to job openings (Figure 3), which will be low when the labor market is strong and hires cannot be made because of a lack of available workers. In 2Q this ratio was 16% below the 2019 level and 34% below the 2014 level, supporting the argument that the labor market is stronger than the hiring rate alone would suggest, although the series may have a downward trend making comparisons across time more challenging. That being said, it has been gently rising from all-time lows over the last couple years, indicative of gradually normalizing conditions, and as noted previously hiring for unemployed workers has not been strong enough to stop the rise in the unemployment rate.
Global Data Watch: Anything and everything
- Interaction of rising growth and fading labor cost risk points to faster Fed
- Step-down in July global manufacturing surveys is broad-based
- BoJ on track toward 1% policy rate as Japan growth moves toward 2%
- Next week: All-ind PMI dips; RBA, RBI on hold; Banxico cuts 25bp
When asked what could go wrong with a macroeconomic forecast, the appropriate answer is always “anything and everything.” Our narrative foresees resilient US and global expansions in which growth downshifts to a trend-like pace amid a broadening regional and sectoral base. Meanwhile we expect core inflation to remain sticky above central bank targets. The space for central bank easing has thus been anticipated to be limited. Recent releases challenge each of these views. The most important news is in the US where rising downside growth risks have been accompanied by moderating labor market pressures. Although the FOMC guided toward a gradual policy easing at this week’s meeting, these developments likely interact to shift the Fed’s perception of risk decisively toward labor market weakness. The door is thus opening for a more forceful monetary policy adjustment, and we now look for the Fed to ease 50bp at the next two meetings.
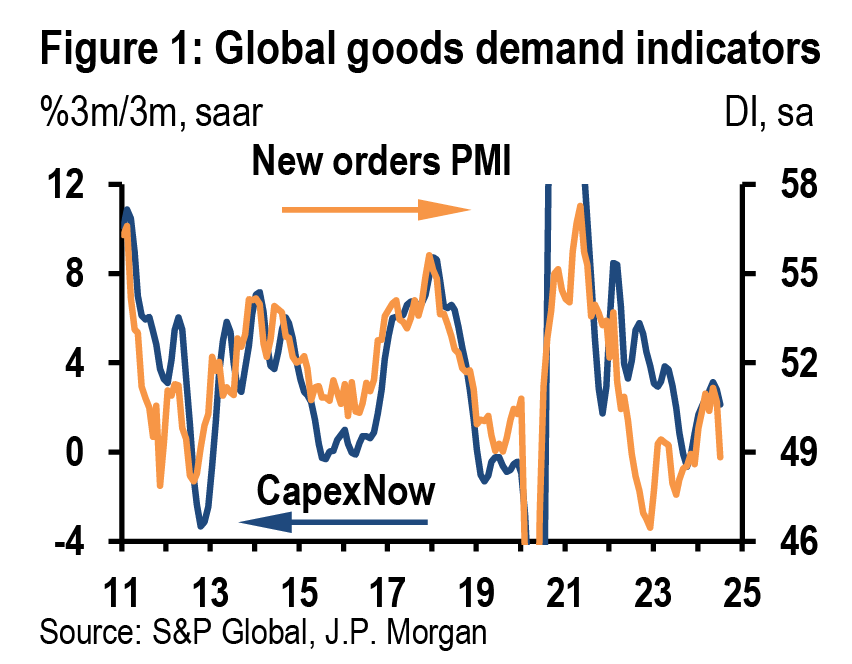
In recent weeks, the midyear slide in DM manufacturing surveys and signs of a loss in Euro area momentum were challenging our view of growth broadening out. These concerns are reinforced this week by a sharp decline in the July EM PMIs. Taken together, the global output PMI has dropped 2.5pts in two months, to a level consistent with a stall in global factory output gains. The details of the report point to even greater weakness in new orders (Figure 1). Combined with the rise in the inventory PMI, the report contrasts with our view that solid retail and capex growth will support 2H24 global IP growth close to the 2.1%ar it recorded last quarter.
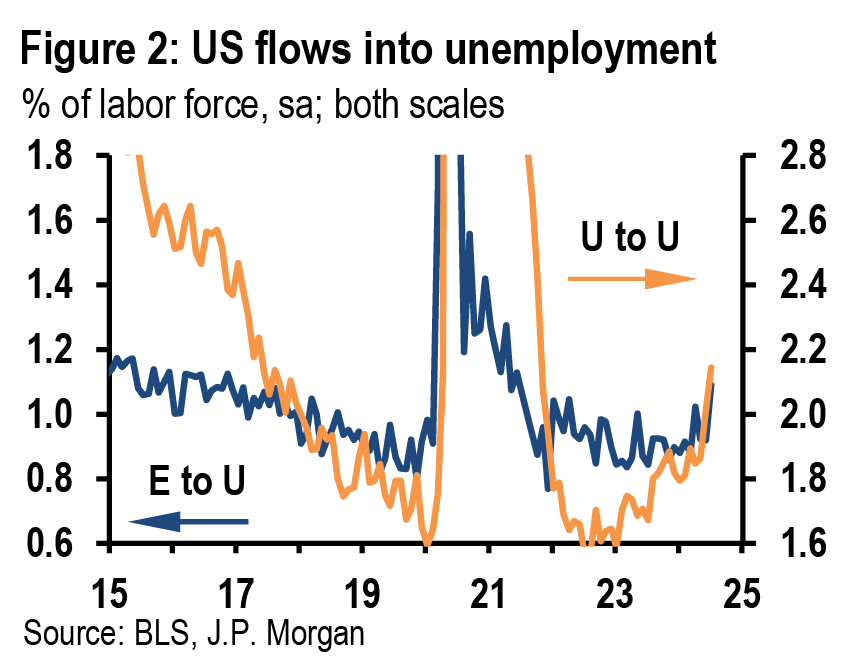
Although the slowing in US employment gains to 114k last month was disappointing, we temper the weight placed on this slide. A surge in employees out of work due to bad weather alongside a workweek decline points to a Hurricane Beryl drag. The allowance for a modest reversal of this drag next month would align job growth with our trajectory of normalizing toward a still solid pace. However, three related labor market developments raise concern. First, as storms depress hours, incomes are normally smoothed as workers continue to be paid, a development not evident in this week’s employment report. Second, the sectoral breadth of job creation narrowed sharply as the diffusion index slipped to 49.6 last month. This signal, consistent with recent business surveys, is not easily linked to bad weather. Third, we have attributed a rising unemployment rate to labor supply gains and a moderation in labor demand that has increased the duration of job searches (Figure 2). While this month’s unemployment rate rise reflects these trends, a notable increase in the flow of workers from employed to unemployed hints at the start of a more troubling behavioral shift toward job shedding.
It is too early to distinguish between a moderation and break in labor market conditions, but the risks of a break are rising. As the Fed balances its dual mandate, a major shift in the inflation risk profile is taking place. The US unemployment rate has increased 0.9%-pt from last year’s low as an immigration surge and a rise in the prime age participation rate to a 23-year high have rebalanced a labor market still generating strong demand. With this week’s ECI report reinforcing the signal from average hourly earnings on wage moderation, and productivity gains limiting unit labor costs, inflation concerns related to tight labor markets have been allayed.
Together these shifts materially change the balance of risk, warranting a level adjustment in the Fed stance. While an easing at each of the meetings for the rest of this year looks likely, the magnitude of moves depends on the data. While there are two CPI reports before the September 18 meeting, news related to growth will likely play the biggest role.
Western Europe CBs to remain gradualists
In contrast to this week’s significant shift in our Fed call, the news flow keeps Western European central banks on track for the modest easing we expect through year-end. Key to this difference is a Fed that is responding to a more pronounced shift in the perception of risk. If the US slips into recession, the risk profile for Western Europe would change materially and therefore require a reassessment of our views.
- The Bank of England cut rates this week in a finely balanced 5-4 vote—delivering on our long-standing August call. The easing came despite a pickup in growth and ongoing strength in wages and services inflation. We interpret Governor Bailey’s message, and the BoE’s projections, as consistent with a quarterly pace of easing, in line with our forecast. The BoE did hint that it could cut more quickly if inflation risks dissipate but November is the most likely date for the next ease. Notably, the BoE will update fiscal assumptions after the Budget in late October. The new Labor government this week argued that higher near-term spending obligations necessitated new tax increases. We continue to expect these to be relatively small, however, with Labor also likely to accept cutbacks to future spending.
- In the Euro area growth disappointments remain modest while inflation stickiness persists. Regional manufacturing, particularly the German industrial sector, remains depressed, but spillovers to the labor market remained limited. Indeed, this week saw the Euro area unemployment rate rise to a level unchanged from a year ago alongside solid job gains. Meanwhile, core HICP inflation surprised to the upside with a 0.3%m/m July increase. With better news on service price inflation details and the regional-wide composite PMI slipping, the ECB is on course for a 25bp September ease. However, the case for a faster pace of easing will require a shift in the perception of macroeconomic risk.
BoJ delivers hawkish wake-up call
In hiking its policy rate 15bp this week to 0.25% and announcing a plan to halve its gross monthly bond purchases over the next couple of years, the Bank of Japan sent a hawkish message. Governor Ueda stated that more hikes will be delivered if the data flow comes in as expected and stressed that policy settings will remain accommodative even after a few more rate hikes. This clear hawkish break was reflected in our NLP model, which puts the statement on par with some of the most hawkish on record for the BoJ. In suggesting that a series of hikes would be needed to bring the BoJ closer to neutral, we think that Ueda has signaled in concrete terms that the terminal rate will be higher than the 0.5% level priced by markets over the next 12 months (Figure 3). We expect the BoJ policy rates to reach 1%.
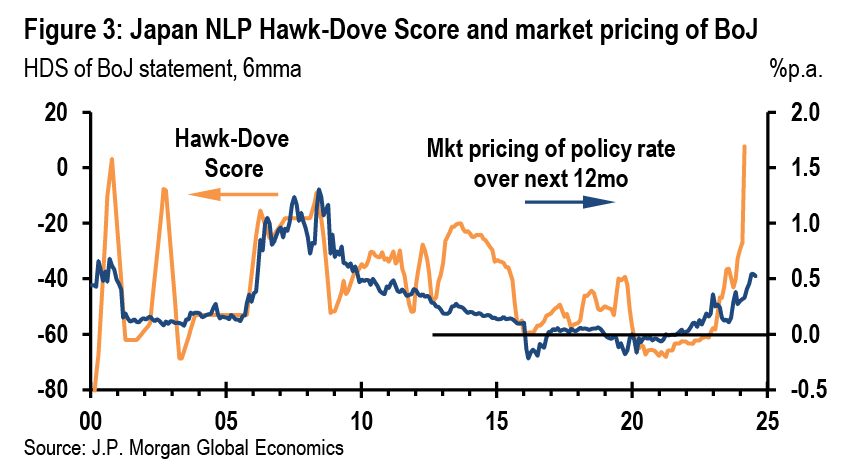
The BoJ’s hawkish turn seems to have caught some off-guard, given what has been a patchy run for macro activity over the past several quarters. The BoJ’s outlook suggests that strong wage momentum will support spending and incoming activity data suggest that this recovery is now taking hold. This week’s June retail sales and July consumer sentiment reports were positive, and manufacturers’ projections into 3Q were nudged up. We have upgraded our forecast for real consumption and GDP to grow at a roughly 2%ar in the middle quarters of this year, a development that could be sustained in an environment of supportive external conditions.
A disappointing start to 3Q in China…
The disappointing news on China’s activity continued this week. The July NBS PMI pointed to further softening in domestic demand, while a large 4.4-pt drop in the Caixin manufacturing output PMI raises concerns that China’s exports, which provided a major lift to 1H growth, may also be losing momentum. Despite mounting pressure for additional policy support, this week’s Politburo meeting did not convey any urgency. There was a greater emphasis on boosting consumer spending, particularly for services, but the 2H policy guidelines were like those from the April meeting. Additional fiscal stimulus remains unlikely after last week’s rate cuts. Instead, policy support should come from accelerating the issuance of special local government bonds and providing more flexibility in the deployment of these funds. We see risks skewed to the downside of our forecast for GDP to advance a modest 4.5%ar in 2H24.
… but still-solid growth in EMAX
Against the weak outturns across most of the rest of the world, the July manufacturing PMIs remain consistent with solid growth in EM Asia outside Mainland China. The region’s PMIs retraced only slightly from their two-year highs and new export orders held up at a strong level. The ongoing tailwind from tech demand, complemented by a modest recovery in domestic demand, keeps us confident that 3Q GDP growth will pick up to a 3%ar after disappointing in 2Q. This week, Korea’s June IP posted a strong gain in tech production accompanied by a surge in shipments and a sharp correction in inventories. We expect Korean GDP to rebound 4%ar in 3Q from -0.9%ar in 2Q. Disappointment in China’s export engine could still tilt regional growth risks to the downside, especially in economies where the share of exports to China still constitutes more than 20% of all exports (Indonesia, Korea, Taiwan).
Financial stability risks to keep RBI on hold
We expect the RBI to stand pat at next week’s monetary policy review and reiterate its “withdrawal of accommodation” stance. While food price dynamics should turn more benign as the monsoon improves, the central bank will need to see more evidence that food inflation—which constitutes almost half the basket—is softening durably and pushing headline CPI closer to the 4% inflation target. The RBI will also be mindful of ongoing financial stability risks given the surge in unsecured lending to households over the last 18 months, which has nonetheless started to soften in response to macroprudential measures. We expect the RBI to ease in 4Q as growth softens and inflation moderates.
CE-3 mirrors Euro area performance
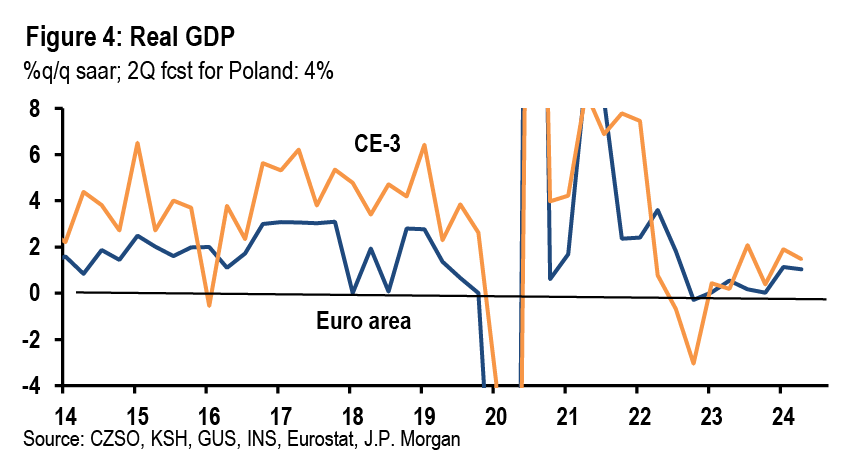
The 2Q GDP releases from Central Europe mirror Euro area performance, a disappointment for a region with a higher underlying potential pace (Figure 4). Czechia and Hungary both disappointed, maintaining the sub-par pace of the previous two quarters. The region’s export-oriented manufacturing sector has strong links with German supply chains and is facing similar problems. Moreover, a recovery in consumer spending has been underwhelming and EU fiscal transfers have yet to deliver an expected boost to capex in this cycle. Further growth disappointment could deliver more than the limited rate cuts we are forecasting. But, for now, policymakers remain focused on still sticky above-target inflation and elevated wage growth (outside Czechia). Poland’s flash July CPI showed core inflation firming to a 4%ar in the three months to July (0.4%m/m, sa in July) while underlying inflation in Hungary is running close to a 5%ar.
Idiosyncratic forces on Latam CBs
Three out of the five major Latin American central banks met last Wednesday, before this week’s weak US labor report. Two delivered as expected, with Brazil’s BCB keeping the policy rate at 10.5% and Colombia’s BanRep cutting 50bp. BCB worries about de-anchored inflation expectations and FX depreciation, but remains comfortable with a stable SELIC rate, while internal BanRep divisions pointed to some who wanted a 75bp cut. Such developments are consistent with our forecasts for rates of 10.5% for Brazil and 8.5% for Colombia at year-end. Next week, we anticipate a 3-2 split with Mexico’s Banxico delivering a 25bp cut.
US Indicator forecasts
| J.P. Morgan Research versus the consensus | ||||||
| Release date/ | J.P. Morgan | Consensus | Consensus | |||
| Indicator | forecast | median | range | |||
| Mon, Aug 05 | ||||||
| Services PMI (Jul final) | 56.0 | 56.0 | 55.8 to 56.1 | |||
| ISM services (Jul) | 50.0 | 51.0 | 49.0 to 53.3 | |||
| Tue, Aug 06 | ||||||
| International trade (Jun) | -$72.4 bn | -$72.5 bn | -$76.2 bn to -$71.0 bn | |||
| Thu, Aug 08 | ||||||
| Jobless claims (w/e Aug 03) | 240k | 242k | 230k to 255k | |||
| Source: J.P. Morgan, consensus forecasts reported by Bloomberg Finance L.P. | ||||||
Services PMI (Jul final)
Released on Mon, Aug 05, at 9:45am
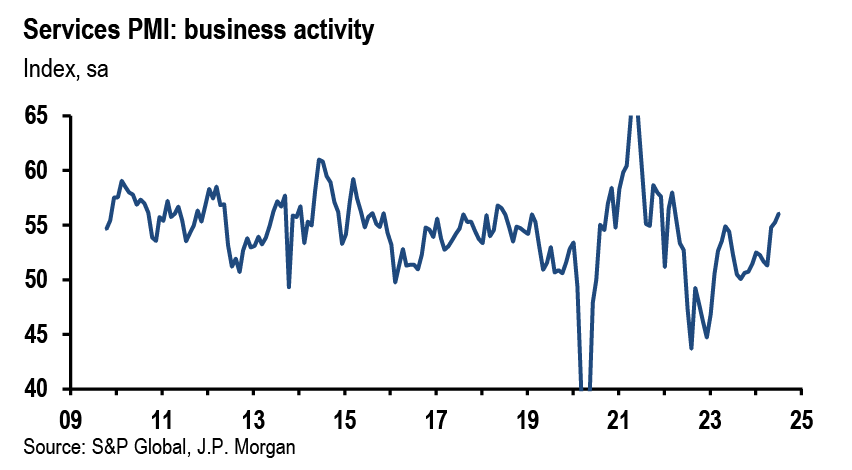
We forecast that the final July reading on the services PMI will be unchanged from the flash value of 56.0. As discussed in the forecast for the ISM non-manufacturing survey, the services PMI has looked surprisingly strong relative to other surveys recently, and it would not be surprising if it weakened in coming months. It is possible such a drop could happen in the final July survey, though usually the flash and final values are quite close. Based on past patterns if there was a decline in the final July report it would likely be no more than one point.
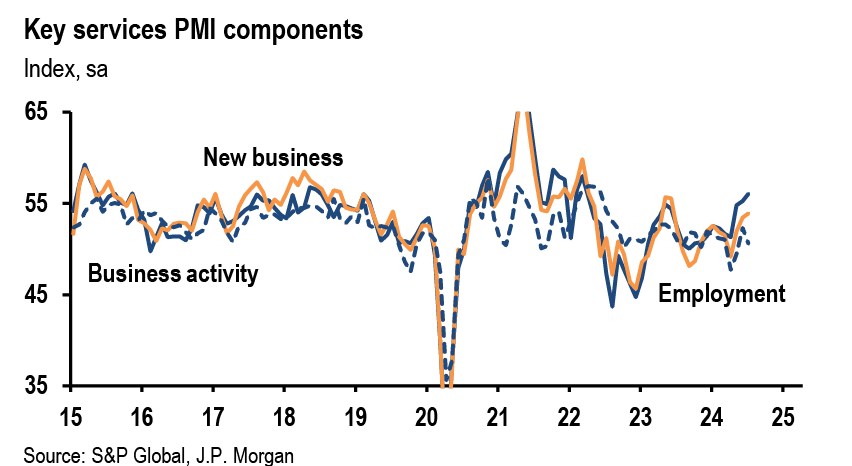
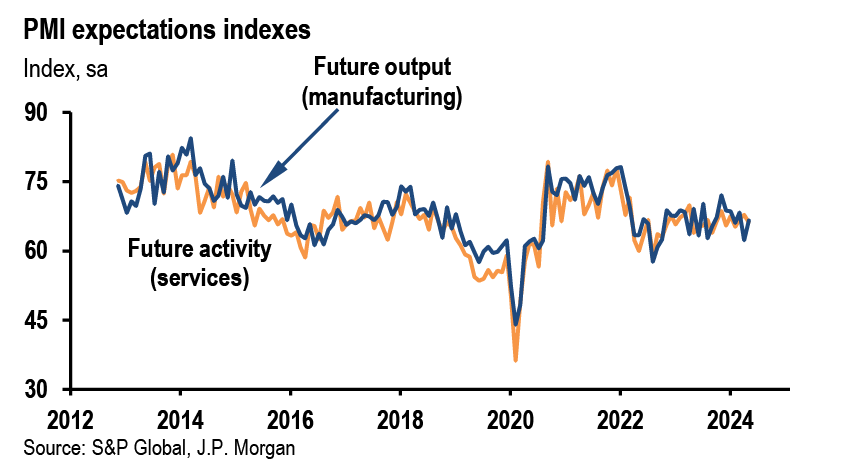
| Services PMI | ||||
| Flash | Final | |||
| Jul 23 | Jun 24 | Jul 24 | Jul 24 | |
| Business activity | 52.3 | 55.3 | 56.0 | 56.0 |
| Incoming new business | 51.9 | 53.5 | 50.6 | |
| Source: S&P Global, J.P. Morgan | ||||
ISM services (Jul)
Released on Mon, Aug 05, at 10:00am
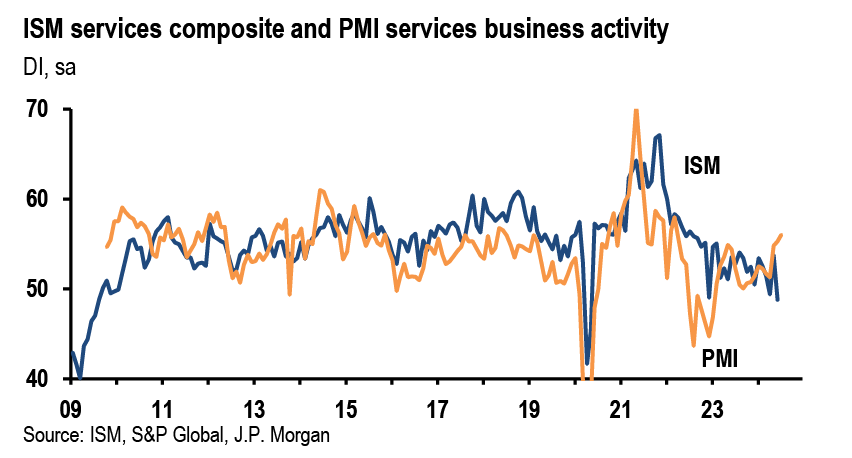
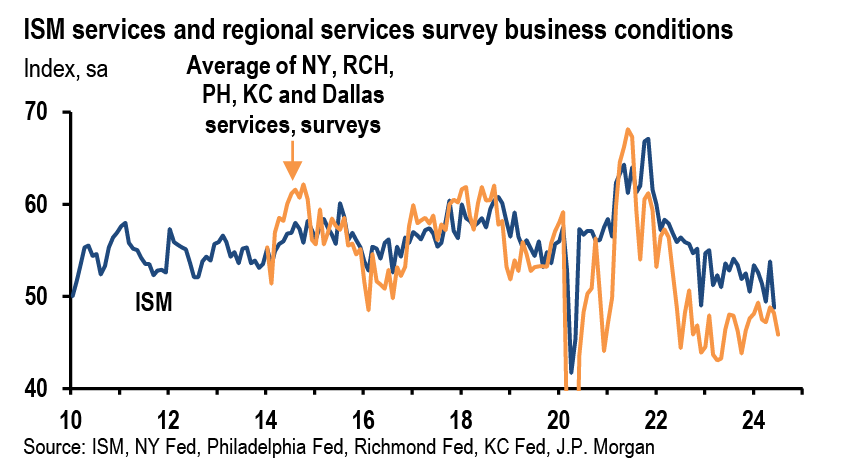
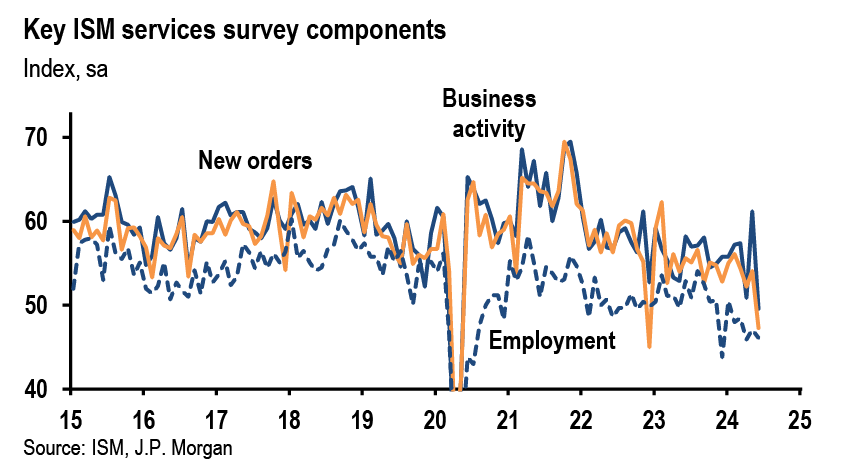
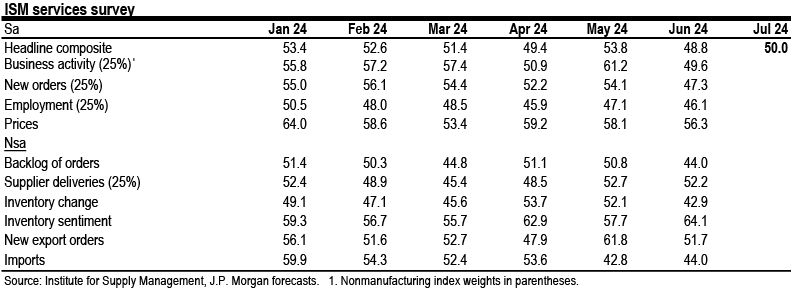
We look for the ISM non-manufacturing index to rise slightly from 48.8 in June to 50.0 in July. The index has been steadily softening for close to a year, but it has also been very volatile in recent months, and the value in June looked surprisingly low, especially with new orders collapsing dramatically to levels usually associated with recession. Consequently we think there is room for it to recover a bit, though our forecast would still be lower than the trailing three-month average of 50.7.
Other business surveys sent mixed signals during the month. The services PMI actually improved in July and is unusually high relative to the ISM non-manufacturing survey, which could argue for more of a recovery in the ISM survey. On the other hand the trend of these two surveys has been significantly different in recent months, and the average business activity reading from regional Fed services surveys worsened for a second consecutive month. The Fed surveys have been running unusually low relative to the ISM ever since COVID, which makes it harder to know what they imply for the level of the ISM, but their direction of travel is weaker, as their recent drop reverses an improvement over the first half of the year.
International trade (Jun)
Released on Tue, Aug 06, at 8:30am
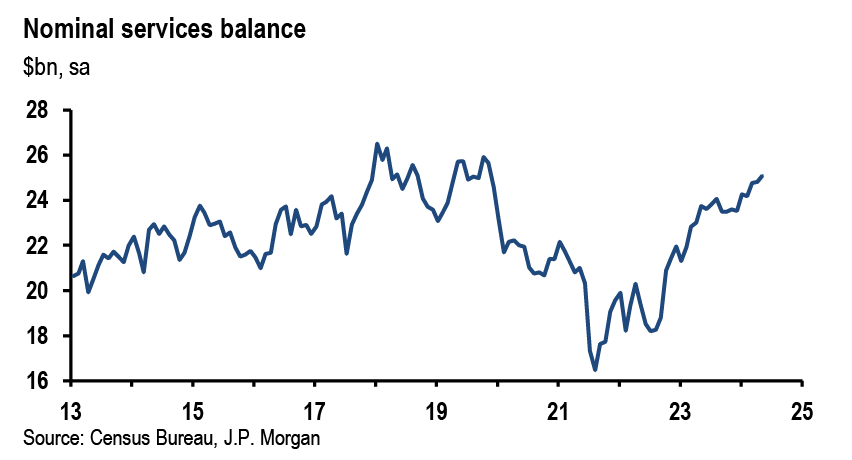
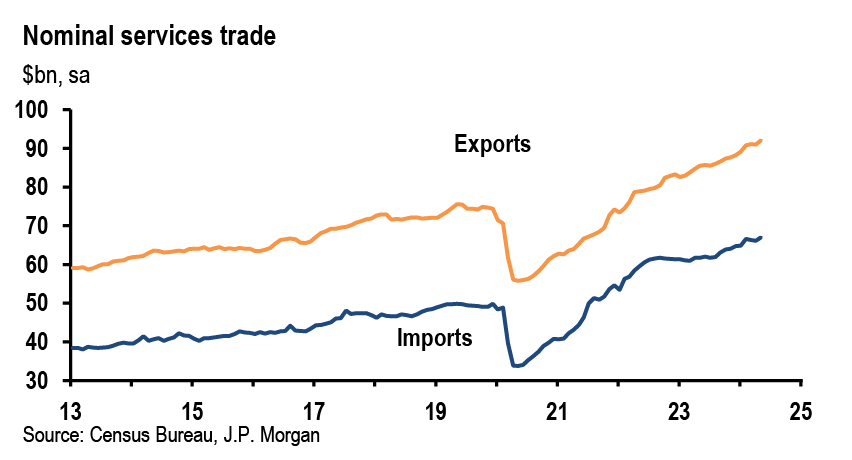
We expect the nominal goods and services trade balance, which was -$75.1bn in May, to narrow to between -$73bn and -$72bn in June. Advance goods trade on a Census basis, which is close to the BOP basis in this report, was already released for June, and it showed the goods deficit shrinking during the month on the back of strong growth in exports. For services, we expect to see ongoing growth in exports and imports that should lead the surplus to continue to slowly increase. The services balance has been rebounding from its post-COVID low as segments like net exports of travel recover.
| International trade | 266.5 | 339.0 | ||||||||||
| Balance ($bn) | Exports (%m/m) | Imports (%m/m) | ||||||||||
| Apr 24 | May 24 | Jun 24 | Apr 24 | May 24 | Jun 24 | Apr 24 | May 24 | Jun 24 | ||||
| Total balance | -74.5 | -75.1 | -72.4 | 0.7 | -0.7 | 1.9 | 2.3 | -0.3 | 0.7 | |||
| Services | 24.8 | 25.1 | 25.4 | -0.2 | 1.3 | 0.7 | -0.4 | 1.3 | 0.5 | |||
| Goods (BoP) | -99.3 | -100.2 | -97.8 | 1.2 | -1.7 | 2.5 | 3.0 | -0.8 | 0.7 | |||
| Foods | -4.6 | -4.8 | -5.8 | -1.3 | -0.4 | 0.1 | ||||||
| Industrial supplies | 5.5 | 2.0 | -2.1 | -3.4 | 2.3 | 2.6 | ||||||
| Capital goods | -25.4 | -25.6 | 3.7 | -0.7 | 3.1 | -0.2 | ||||||
| Aircraft | 1.0 | 0.6 | 13.2 | -21.8 | 32.3 | -22.0 | ||||||
| Motor vehicles | -26.8 | -25.8 | 4.8 | -3.2 | 10.5 | -3.5 | ||||||
| Consumer goods | -43.5 | -41.1 | 5.7 | 1.5 | -0.3 | -3.1 | ||||||
| Other goods | -3.4 | -4.0 | 5.6 | -4.1 | 6.5 | 2.6 | ||||||
| Real goods (BoP) | -94.0 | -94.5 | -92.1 | 0.3 | -0.9 | 2.9 | 2.5 | -0.4 | 0.7 | |||
| Source: US Department of Commerce, Bureau of Economic Analysis, J.P. Morgan forecasts | ||||||||||||
Initial claims (w/e Aug 03)
Released on Thu, Aug 08, at 8:30am
We project that initial jobless claims will pull back to around 240k in the week ending August 3 from 249k the prior week. The four-week average would rise to 242k from 238k, which would be just slightly above the prior high of 239k for this year, which was set at the end of June. Jobless claims last week had popped up by 14k. While a gradual loosening in the labor market could be causing claims to drift up, the lingering effects of Hurricane Beryl still appeared to be propping up claims in Texas last week by around 10k, so claims could drop in the latest week assuming Texas reverts to normal patterns.
Jobless claims rose last month during the summer before declining by the fall, and because claims rose at a similar time this year there are lingering questions around the residual seasonality in this series. We discussed this at more length here, noting that NSA claims were in fact more elevated than usual last year during the summer, but that this was boosted by unusual changes in Ohio, Texas, and Minnesota. When these states are excluded claims were much more similar to earlier years, and claims for this year are tracking quite close to prior year patterns. If the labor market loosens further then claims should increase over time. On the other hand if claims continue to follow the pattern from last year then seasonally adjusted claims would move lower by the winter. Last year initial claims were unusually low in the winter, likely stemming from lower agriculture and construction claims, and that pattern was repeated again during January and February of this year. Assuming that winter temperatures do not turn sharply colder than the last couple years the lower pattern of claims could repeat.
Continuing jobless claims have also increased recently, though they have shown some signs of stability over the last four weeks. While they rose again in the week ending July 20, claims stemming from Hurricane Beryl were likely a contributing factor. Excluding Texas, continuing claims rose slightly but were still similar to the prior month.
| Jobless claims (regular state programs, seasonally adjusted) | ||||||||||
| Jun 15¹ | Jun 22 | Jun 29 | Jul 6 | Jul 13¹ | Jul 20 | Jul 27 | Aug 3 | |||
| Initial claims (000s) | 239 | 234 | 239 | 223 | 245 | 235 | 249 |

|
||
| Weekly change | -4 | -5 | 5 | -16 | 22 | -10 | 14 | -9 | ||
| 4-week moving average | 233 | 236 | 239 | 234 | 235 | 236 | 238 | 242 | ||
| Weekly change | 6 | 3 | 3 | -5 | 2 | 0 | 3 | 4 | ||
| Continuing claims (000s) | 1832 | 1856 | 1847 | 1860 | 1844 | 1877 | ||||
| Weekly change | 11 | 24 | -9 | 13 | -16 | 33 | ||||
| 4-week moving average | 1814 | 1831 | 1839 | 1849 | 1852 | 1857 | ||||
| Weekly change | 11 | 16 | 9 | 10 | 3 | 5 | ||||
| Insured unemployment rate (%) | 1.2 | 1.2 | 1.2 | 1.2 | 1.2 | 1.2 | ||||
| Source: US Department of Labor, J.P. Morgan forecasts.1. Employment survey week. | ||||||||||
| 240 |
J.P. Morgan US forecast
| %q/q, saar | %q4/q4 | %y/y | |||||||||||||||||
| 4Q23 | 1Q24 | 2Q24 | 3Q24 | 4Q24 | 1Q25 | 2Q25 | 3Q25 | 2023 | 2024 | 2025 | 2023 | 2024 | 2025 | ||||||
| Gross domestic product | |||||||||||||||||||
| Real GDP | 3.4 | 1.4 | 2.8 | 1.0 | 1.0 | 2.0 | 2.3 | 1.8 | 3.1 | 1.6 | 1.9 | 2.5 | 2.4 | 1.7 | |||||
| Final sales | 3.9 | 1.8 | 2.0 | 0.6 | 0.9 | 1.6 | 2.3 | 1.8 | 3.5 | 1.3 | 1.8 | 2.9 | 2.3 | 1.5 | |||||
| Domestic | 3.6 | 2.4 | 2.7 | 1.0 | 1.3 | 1.8 | 2.3 | 1.9 | 3.2 | 1.8 | 1.9 | 2.3 | 2.5 | 1.8 | |||||
| Consumer spending | 3.3 | 1.5 | 2.3 | 1.1 | 1.1 | 1.2 | 1.5 | 1.3 | 2.7 | 1.5 | 1.3 | 2.2 | 2.1 | 1.3 | |||||
| Business investment | 3.7 | 4.4 | 5.2 | 2.1 | 3.4 | 5.3 | 5.7 | 4.1 | 4.6 | 3.8 | 4.6 | 4.5 | 3.9 | 4.3 | |||||
| Equipment | -1.1 | 1.6 | 11.6 | 1.0 | 1.8 | 4.0 | 4.5 | 3.3 | -0.6 | 3.9 | 3.7 | -0.3 | 2.4 | 3.6 | |||||
| Structures | 10.9 | 3.4 | -3.3 | 2.5 | 2.0 | 4.0 | 5.0 | 3.5 | 16.9 | 1.1 | 3.9 | 13.2 | 4.9 | 3.0 | |||||
| Intellectual property products | 4.3 | 7.7 | 4.5 | 3.0 | 5.5 | 7.0 | 7.0 | 5.0 | 3.2 | 5.2 | 5.7 | 4.5 | 4.7 | 5.6 | |||||
| Residential investment | 2.8 | 16.0 | -1.4 | -5.0 | -4.0 | 0.0 | 10.0 | 8.0 | 0.4 | 1.1 | 5.9 | -10.6 | 3.8 | 1.7 | |||||
| Government | 4.6 | 1.8 | 3.1 | 0.6 | 1.3 | 1.6 | 1.4 | 1.0 | 4.6 | 1.7 | 1.3 | 4.1 | 3.0 | 1.4 | |||||
| Net exports ($bn, chained $2017) | -919 | -960 | -1007 | -1031 | -1056 | -1073 | -1081 | -1089 | - | - | - | - | - | - | |||||
| Exports (goods and services) | 5.1 | 1.6 | 2.0 | -0.8 | 0.3 | 1.5 | 3.0 | 3.0 | 1.8 | 0.8 | 2.6 | 2.6 | 1.7 | 1.6 | |||||
| Imports (goods and services) | 2.2 | 6.1 | 6.9 | 2.2 | 3.0 | 3.0 | 3.0 | 3.0 | -0.1 | 4.5 | 3.0 | -1.7 | 3.7 | 3.1 | |||||
| Inventories (ch $bn, chained $2017) | 54.9 | 28.6 | 71.3 | 95.2 | 100.2 | 124.3 | 121.5 | 119.0 | - | - | - | - | - | - | |||||
| Contribution to real GDP growth (% pts): | |||||||||||||||||||
| Domestic final sales | 3.6 | 2.5 | 2.7 | 1.0 | 1.3 | 1.9 | 2.4 | 1.9 | 3.2 | 1.8 | 1.9 | 2.3 | 2.5 | 1.8 | |||||
| Net exports | 0.3 | -0.7 | -0.7 | -0.4 | -0.4 | -0.3 | -0.1 | -0.1 | 0.3 | -0.5 | -0.1 | 0.6 | -0.3 | -0.2 | |||||
| Inventories | -0.5 | -0.4 | 0.8 | 0.4 | 0.1 | 0.4 | 0.0 | 0.0 | -0.4 | 0.2 | 0.1 | -0.4 | 0.2 | 0.2 | |||||
| Income and profits (NIPA basis) | |||||||||||||||||||
| Adjusted corp profits | 17.3 | -5.4 | 2.0 | 2.0 | 2.0 | 3.0 | 5.0 | 5.0 | 5.1 | 0.1 | 4.7 | 1.5 | 4.1 | 3.4 | |||||
| Real disposable personal income | 0.9 | 1.3 | 1.0 | 1.6 | 1.4 | 1.9 | 2.3 | 1.8 | 3.8 | 1.3 | 2.0 | 4.1 | 1.2 | 1.8 | |||||
| Nominal disposable personal income | 2.7 | 4.7 | 3.6 | 4.0 | 3.9 | 4.0 | 4.2 | 3.9 | 6.6 | 4.1 | 4.1 | 7.9 | 3.9 | 4.0 | |||||
| Saving rate1 | 3.7 | 3.8 | 3.5 | 3.6 | 3.7 | 3.8 | 4.0 | 4.1 | - | - | - | 4.5 | 3.6 | 4.1 | |||||
| Prices and labor cost | |||||||||||||||||||
| Consumer price index | 2.7 | 3.8 | 2.8 | 2.1 | 2.8 | 2.4 | 2.1 | 2.3 | 3.2 | 2.9 | 2.3 | 4.1 | 3.0 | 2.4 | |||||
| Core | 3.4 | 4.2 | 3.2 | 2.0 | 2.7 | 2.6 | 2.4 | 2.4 | 4.0 | 3.0 | 2.5 | 4.8 | 3.4 | 2.5 | |||||
| PCE deflator | 1.8 | 3.4 | 2.6 | 2.4 | 2.5 | 2.1 | 1.9 | 2.1 | 2.8 | 2.7 | 2.1 | 3.7 | 2.6 | 2.2 | |||||
| Core | 2.0 | 3.7 | 2.9 | 2.1 | 2.2 | 2.1 | 2.1 | 2.1 | 3.2 | 2.7 | 2.1 | 4.1 | 2.7 | 2.2 | |||||
| GDP chain-type price index | 1.6 | 3.1 | 2.3 | 2.4 | 2.3 | 2.3 | 2.3 | 2.2 | 2.6 | 2.5 | 2.2 | 3.6 | 2.5 | 2.3 | |||||
| S&P/C-S house price index (%oya) | 5.1 | 6.4 | 2.5 | 1.3 | 0.0 | 0.8 | 1.6 | 2.4 | 5.1 | 0.0 | 3.0 | 2.4 | 2.5 | 1.9 | |||||
| Employment Cost Index | 3.8 | 4.8 | 3.7 | 3.0 | 2.8 | 2.7 | 2.9 | 3.0 | 4.2 | 3.6 | 2.9 | 4.5 | 3.9 | 2.9 | |||||
| Productivity | 3.5 | 0.4 | 2.3 | 0.3 | 0.3 | 1.0 | 1.0 | 1.0 | 2.7 | 0.8 | 1.0 | 1.5 | 2.0 | 0.8 | |||||
| Other indicators | |||||||||||||||||||
| Housing starts (mn units, saar)1 | 1.481 | 1.407 | 1.348 | 1.430 | 1.450 | 1.470 | 1.490 | 1.510 | - | - | - | 1.421 | 1.409 | 1.498 | |||||
| Industrial production, mfg. | -1.4 | -1.3 | 3.4 | 0.4 | 0.3 | 1.0 | 1.0 | 0.8 | -0.4 | 0.7 | 0.9 | -0.5 | 0.0 | 0.9 | |||||
| Light vehicle sales (mn units, saar)1 | 15.7 | 15.3 | 15.7 | 15.6 | 15.6 | 15.8 | 16.0 | 16.2 | - | - | - | 15.5 | 15.6 | 16.1 | |||||
| Unemployment rate1 | 3.7 | 3.8 | 4.0 | 4.3 | 4.5 | 4.5 | 4.6 | 4.5 | - | - | - | 3.6 | 4.2 | 4.5 | |||||
| Payroll employment (ch, '000s, samr)1 | 212 | 267 | 177 | 150 | 115 | 150 | 150 | 125 | - | - | - | 251 | 177 | 138 | |||||
| Nominal GDP | 5.1 | 4.5 | 5.2 | 3.4 | 3.3 | 4.3 | 4.6 | 4.0 | 5.9 | 4.1 | 4.2 | 6.3 | 5.0 | 4.1 | |||||
| Current account balance ($bn)1 | -221.8 | -237.6 | -216.9 | -221.9 | -226.9 | -232.0 | -237.2 | -242.5 | - | - | - | -905.4 | -903.3 | -954.5 | |||||
| % of GDP | -3.2 | -3.4 | -3.0 | -3.1 | -3.1 | -3.2 | -3.2 | -3.2 | - | - | - | -3.3 | -3.1 | -3.2 | |||||
| Federal budget balance ($bn)1 | - | - | - | - | - | - | - | - | - | - | - | -1690.0 | -1915.0 | -1850.0 | |||||
| % of GDP | - | - | - | - | - | - | - | - | - | - | - | -6.2 | -6.7 | -6.2 | |||||
| 1. Entries are average level for the period.Federal balance figures are for fiscal years. | |||||||||||||||||||
| Aug 2 | 3Q24 | 4Q24 | 1Q25 | 2Q25 | |||||||||||||||
| Interest rate forecast (end of period) | |||||||||||||||||||
| Fed funds target (top of range) | 5.50 | 5.00 | 4.25 | 3.75 | 3.25 | ||||||||||||||
| 2-yr Treasury | 3.87 | 3.60 | 3.20 | 2.75 | 2.35 | ||||||||||||||
| 5-yr Treasury | 3.62 | 3.40 | 3.10 | 2.75 | 2.45 | ||||||||||||||
| 10-yr Treasury | 3.79 | 3.75 | 3.50 | 3.30 | 3.15 | ||||||||||||||
| 30-yr Treasury | 4.11 | 4.10 | 3.90 | 3.80 | 3.70 | ||||||||||||||
| Source: J.P. Morgan | |||||||||||||||||||
US Economic Calendar
| Monday | Tuesday | Wednesday | Thursday | Friday |
|---|---|---|---|---|
| 5 Aug Services PMI(9:45am) Jul final 56.0 ISM services(10:00am) Jul 50.0 Senior loan officer survey(2:00pm) 3Q
Chicago Fed President Goolsbee speaks(8:30am) San Francisco Fed President Daly speaks(5:00pm) |
6 Aug International trade(8:30am) Jun -$72.4bn
Auction 3-year note $58bn |
7 Aug Consumer credit(3:00pm) Jun
Auction 10-year note $42bn |
8 Aug Initial claims(8:30am) w/e Aug 3 240,000 Wholesale trade(10:00am) Jun
Auction 30-year bond $25bn
Richmond Fed President Barkin speaks(3:00pm) |
9 Aug |
| 12 Aug Federal budget(2:00pm) Jul |
13 Aug NFIB survey(6:00am) Jul PPI(8:30am) Jul
Atlanta Fed President Bostic speaks(1:15pm) |
14 Aug CPI(8:30am) Jul |
15 Aug Retail sales(8:30am) Jul Import prices(8:30am) Jul Initial claims(8:30am) w/e Aug 10 Empire State survey(8:30am) Aug Philadelphia Fed manufacturing(8:30am) Aug Industrial production(9:15am) Jul NAHB survey(10:00am) Aug Business inventories(10:00am) Jun TIC data(4:00pm) Jun
Announce 30-year TIPS (r) $8bn Announce 20-year bond $16bn
Philadelphia Fed President Harker speaks(1:10pm) |
16 Aug Housing starts(8:30am) Jul Business leaders survey(8:30am) Aug Consumer sentiment(10:00am) Aug prelim
Chicago Fed President Goolsbee speaks(1:25pm) |
| 19 Aug Leading indicators(10:00am) Jul |
20 Aug Philadelphia Fed nonmanufacturing(8:30am) Aug
Atlanta Fed President Bostic speaks(1:35pm) |
21 Aug QSS(10:00am) 2Q adv
Auction 20-year bond $16bn |
22 Aug Initial claims(8:30am) w/e Aug 17 Manufacturing PMI(9:45am) Aug flash Services PMI(9:45am) Aug flash Existing home sales(10:00am) Jul KC Fed survey(11:00am) Aug Announce 2-year note $69bn Auction 30-year TIPS (r) $8bn Announce 2-year FRN (r) $28bn Announce 5-year note $70bn Announce 7-year note $44bn |
23 Aug New home sales(10:00am) Jul |
| 26 Aug Durable goods(8:30am) Jul Dallas Fed manufacturing(10:30am) Aug |
27 Aug FHFA HPI(9:00am) Jun, 2Q S&P/Case-Shiller HPI(9:00am) Jun, 2Q Richmond Fed survey(10:00am) Aug Consumer confidence(10:00am) Aug Dallas Fed services(10:30am) Aug Auction 2-year note $69bn |
28 Aug Auction 2-year FRN (r) $28bn Auction 5-year note $70bn |
29 Aug Real GDP(8:30am) 2Q second Advance economic indicators(8:30am) Jun Initial claims(8:30am) w/e Aug 24 Pending home sales(10:00am) Jul Auction 7-year note $44bn |
30 Aug Personal income(8:30am) Jul Consumer sentiment(10:00am) Aug final |
Source: Private and public agencies and J.P. Morgan. Further details available upon request.