
Flows & Liquidity
What are the spillovers from private to public assets?
- In principle, the risks posed by private assets to public markets should be modest given that the holders of private assets are typically investors such as SWFs, endowments, pension funds and high net worth individuals with long investment horizons and who intend to hold these assets to maturity.
- However there are circumstances where there could be spillover effects from private assets to public markets particularly in a recession and within private assets these circumstances are more likely to emanate from private equity.
- The recent rebound in US liquidity or money supply should prove temporary.
- While euro area companies appear to have accumulated a rather heavy effective long EUR position, speculative investors such as CTAs have to yet to reach extreme long EUR territory.
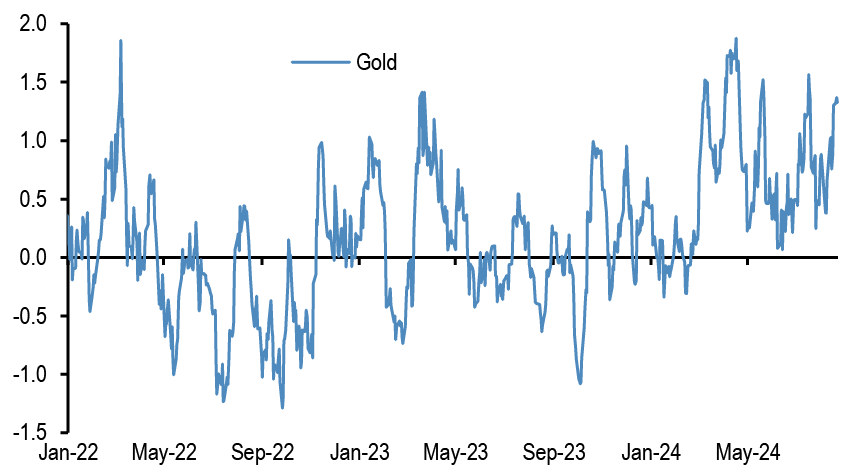
- Positions across commodity futures look oversold in Brent oil, neutral in copper and overbought in gold.
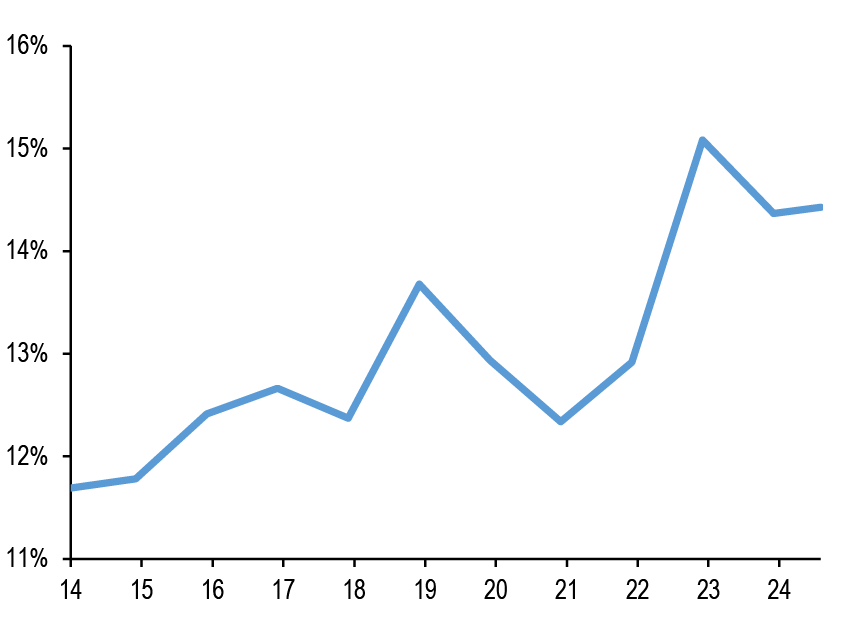
- The stock of private assets i.e. private equity, private credit, real estate and hedge funds, continued to grow this year approaching the $30tr mark ( Figure 1). This represents a sizable close to 15% share of the total asset universe of both private and public assets ( Figure 2). While private assets continue to attract a large amount of investor capital of above $1tr each year, fundraising has slowed significantly in recent years as higher interest rates have hit private assets such private equity and real estate. Figure 3 suggests that fundraising for private assets had peaked at $1.6tr in 2021 and has been slowing steadily since then with the YTD pace of $1.07tr representing the slowest pace since 2018.
Figure 1: Capitalization of global asset classes – traditional versus private
$tr.
| Asset Class | end - 2003 | end- 2006 | end - 2015 | end - 2019 | end - 2020 | end-2021 | end-2022 | end-2023 | Q3-2024 (QTD) | Annualised growth vs end-2019 | Annualised growth vs. end-2021 | Annualised growth vs. end-2015 |
| World Equities | $27.1 | $43.1 | $50.9 | $71.5 | $82.8 | $97.0 | $78.8 | $92.5 | $101.9 | 7.9% | 1.9% | 8.4% |
| World FI | $22.3 | $26.9 | $51.9 | $64.8 | $78.3 | $77.0 | $68.8 | $72.9 | $75.7 | 3.4% | -0.6% | 4.5% |
| Total Traditonal Assets | $49.4 | $70.0 | $102.7 | $136.3 | $161.1 | $174.0 | $147.6 | $165.3 | $171.1 | 5.0% | -0.6% | 6.1% |
| Private Equity | $0.7 | $1.2 | $2.4 | $4.3 | $5.2 | $6.7 | $7.7 | $8.7 | $9.5 | 18.7% | 14.2% | 17.3% |
| Private Debt | $0.1 | $0.1 | $0.5 | $0.8 | $1.0 | $1.2 | $1.4 | $1.7 | $1.9 | 19.2% | 18.4% | 16.1% |
| Real Estate | $6.3 | $8.6 | $8.8 | $11.8 | $12.9 | $13.9 | $13.3 | $13.2 | $13.2 | 2.4% | -2.0% | 4.8% |
| Hedge Funds | $0.8 | $1.5 | $2.9 | $3.3 | $3.6 | $4.0 | $3.8 | $4.1 | $4.3 | 5.8% | 2.9% | 4.7% |
| Total Private Assets | $7.9 | $11.4 | $14.6 | $20.2 | $22.7 | $25.8 | $26.2 | $27.7 | $28.9 | 7.9% | 4.3% | 8.2% |
| Share of Private as a % of Total Assets | 13.8% | 14.0% | 12.4% | 12.9% | 12.3% | 12.9% | 15.1% | 14.4% | 14.4% |
Source: EIKON, Bloomberg Finance L.P., Barclays, Preqin, MSCI, HFR, J.P. Morgan.
- Given the headwind to private assets from higher interest rates a question that has emerged in our conversations is regarding the risks posed by private assets to public markets. In principle, these risks should be modest given that the holders of private assets are typically investors such as SWFs, endowments, pension funds and high net worth individuals with long investment horizons and who intend to hold these assets to maturity. However there are circumstances where there could be spillover effects from private assets to public markets particularly in a recession and within private assets these circumstances are more likely to emanate from private equity.
Figure 2: Share of private assets in the total asset universe of both private and traditional asset classes
In %.
Source: EIKON, Bloomberg Finance L.P., Barclays, Preqin, MSCI, HFR, J.P. Morgan.
Figure 3: Flows/Fundraising into private asset classes
In $bn.
| in $bn | PE | Private Debt | Real Estate | HF | Total |
| 2015 | 488 | 110 | 152 | 44 | 793 |
| 2016 | 759 | 127 | 142 | -70 | 958 |
| 2017 | 822 | 132 | 166 | 10 | 1130 |
| 2018 | 815 | 137 | 176 | -34 | 1094 |
| 2019 | 917 | 153 | 202 | -43 | 1229 |
| 2020 | 896 | 196 | 171 | -30 | 1233 |
| 2021 | 1105 | 239 | 251 | 15 | 1610 |
| 2022 | 999 | 224 | 221 | -55 | 1388 |
| 2023 | 905 | 210 | 153 | -10 | 1258 |
| 2024 YTD | 508 | 123 | 77 | 7 | 715 |
Source: EIKON, Bloomberg Finance L.P., Barclays, Preqin, MSCI, HFR, J.P. Morgan.
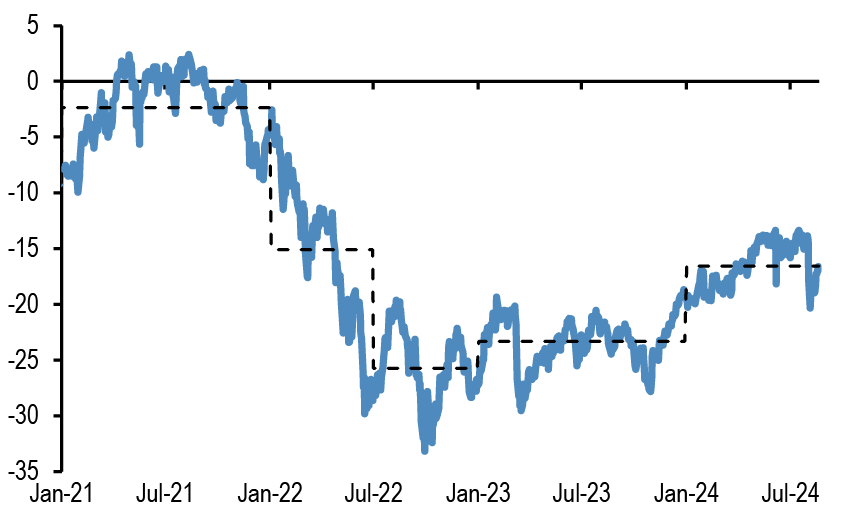
- The question of vulnerabilities in the private equity space was one of the issues that we have touched on in our sister publication Alternative Investments Outlook and Strategy (AIOS). We have noted that rising debt service costs has created issues for older vintages in particular, where deals were made typically with higher leverage and higher interest costs present a larger drain on cash flows and consequently a larger headwind for payouts to private equity investors. In turn, this has been a factor behind the prolonged period of softness in exit activity, amid a persistent gap between the price that sellers expect to receive and what buyers are prepared to pay, even as fundraising has remained robust. One of the manifestations of this gap is the discount to NAV on publicly listed PE funds ( Figure 4). This discount has improved from its lows in 2H22 when it averaged around 25% to 23% in 2023. In 2024, this had improved further from around 20% in 1Q24 and close to 15% in 2Q24. The deterioration in sentiment around risk assets saw it widen again briefly to around 20%., but the recovery in publicly listed markets has also been accompanied by a partial reversal of this deterioration in discount to NAV.
Figure 4: Premium/Discount on LPX Major Market Index of publicly listed private equity
In %. Measured as the premium or discount embedded in the price to book ratio of the LPX index. Dashed line denotes the average discount in 2021, 1H22, 2H22, 2023 and 2024 to-date.
Source: LPX, J.P. Morgan.
- In the event this gap between robust fundraising and weak exits continues there could be spillover effects from private equity to broader markets. If PE investors struggle to meet capital commitments they have made via participating in previous fundraising rounds because cashflows from existing investments prove insufficient, then they could be forced to sell assets in order to meet these commitments. And capital calls by private equity funds for example tend to rise during downturns as the sponsored companies struggle for survival, potentially exacerbating the problem.
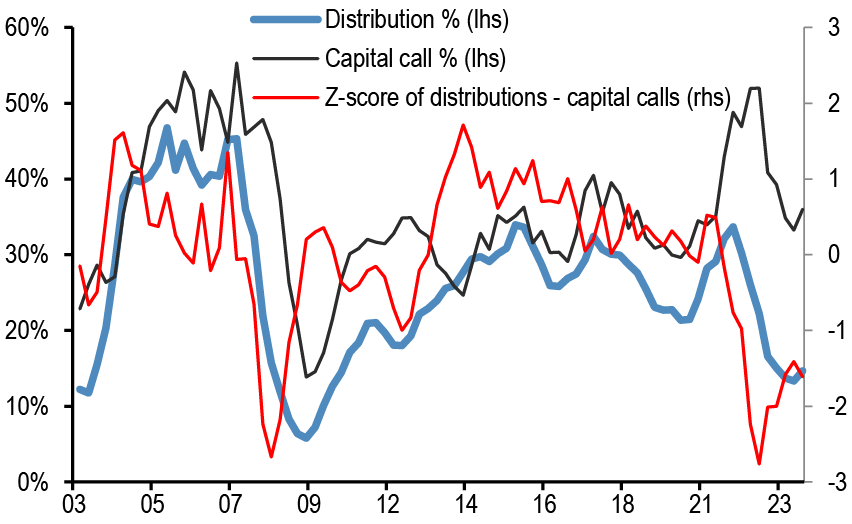
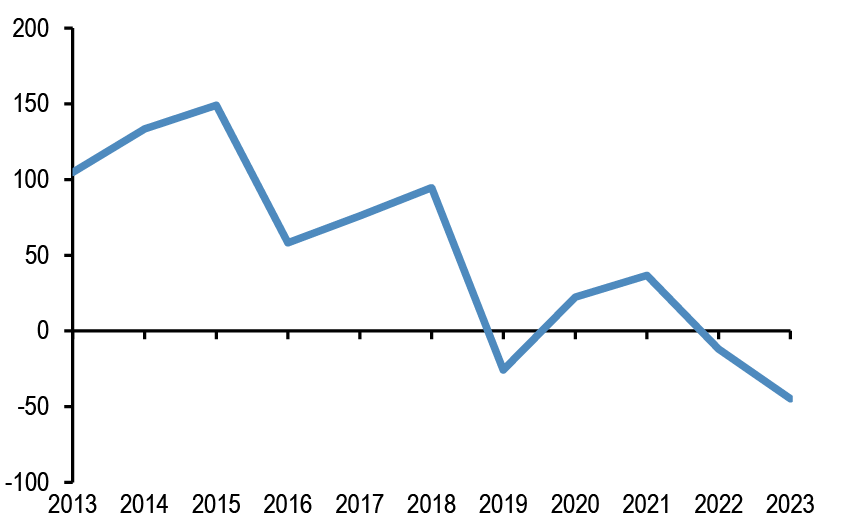
- This headwind to payouts to PE investors can also be seen in a rising gap between distribution and capital call rates, shown in Figure 5. It shows the 12-month rolling distributions of cash as a percentage of NAV and the 12-month rolling capital calls as a percentage of dry powder, as well as the z-score of the difference between distribution and capital call rates. Capital call rates rose sharply in 2021 and 2022 as PE fund managers sought to increase deal activity, but while they have slowed from their 3Q22 highs capital calls remain at the upper end of their pre-pandemic ranges. At the same time, distribution rates have declined from their 2021 high as exit activity slowed to levels last seen in 2010. As a result, the z-score of the difference between the distribution and capital call rates remains rather depressed the past two decades. Not only has the gap between the two remained depressed, but net cash flows to PE investors have turned negative in notional terms as well as capital calls are outpacing distributions ( Figure 6). Another manifestation of this bottleneck in exits is that the share of NAV that has been held for more than 7 years in PE funds has increased from around a quarter in 2021 to around a third in mid-2023 according to Pitchbook data.
Figure 5: Global private equity (PE) distribution and capital call rates
Distribution rate as a % of NAV and capital call rate as a % of dry powder in % (lhs), z-score of the difference between distribution and capital call rate (rhs).
Source: Pitchbook, J.P. Morgan.
Figure 6: Global PE net cash flows as difference between distributions and contributions
In $bn.
Source: Pitchbook, J.P. Morgan.
- This negative gap between distributions and capital calls, while perhaps not large in magnitude, nonetheless highlights a vulnerability to negative shocks in the current conjuncture. While broader market sentiment in listed equity and bond markets has improved, after weaker than expected US labor market data had prompted a notable increase in concerns over recession risk, there is an apparent fragility in market sentiment. And in the event recession risks increase or even materialise, this negative gap between distributions and capital calls could worsen. And as we note above, eventually this could force investors to sell public assets to meet these private asset commitments (similar to 2008) or sell private assets in secondary markets. The development and growth in the secondary market in private equity following the financial crisis has been a positive development in this regard as it means there is an alternative route for investors to raise liquidity by offloading private equity stakes. Coupled with publicly listed markets holding up, this likely provides some confidence for PE investors that they will be able to meet capital calls for new commitments.
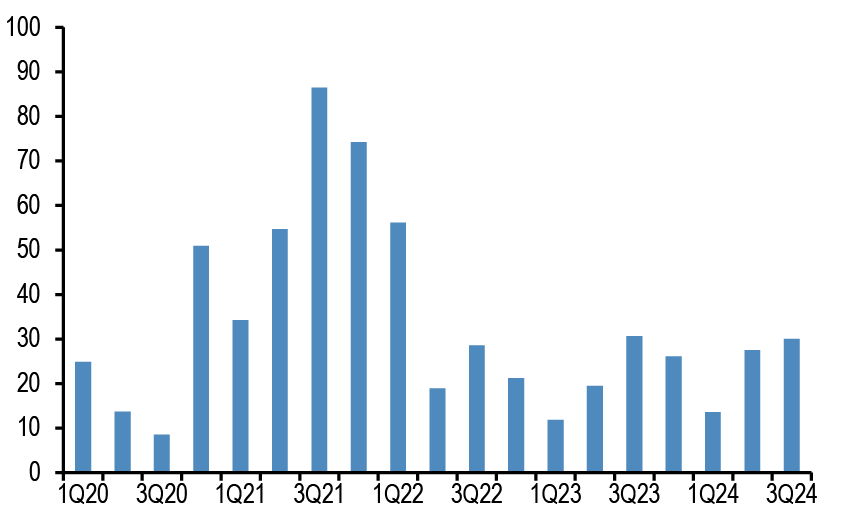
- There are some signs that the pickup in activity in secondary markets in 2Q24 after a weak 1Q has continued in 3Q thus far ( Figure 7). Given that the dry powder of secondary funds stood at around $235bn in 2H23 according to Pitchbook estimates, this suggests that there is significant space to absorb these sales. In 2H23, a similar increase in the pace of exits vs. a weaker 1H23 was accompanied by an improvement in discounts to NAV on secondary transactions according to Jefferies data. But this improvement was in part flattered by PE investors selling newer vintages to reduce discounts as they sought to raise liquidity to free up capital for new investments. The capacity of secondary markets to absorb stakes when PE investors need to raise liquidity is clearly a positive, in particular compared to 2008 when the secondary market for private equity was just emerging in response to the bottleneck the financial crisis at the time had inflicted on private equity. But if this tendency to sell recent vintages to raise liquidity to meet commitments in subsequent fundraisings continues, it also underscores this vulnerability arising from the negative gap between distributions and capital calls. In this regard, a pickup in exits would clearly be welcome.
Figure 7: US secondary buyout PE deal activity
$bn, 3Q24 as of Aug 20th.
Source: Pitchbook, J.P. Morgan.
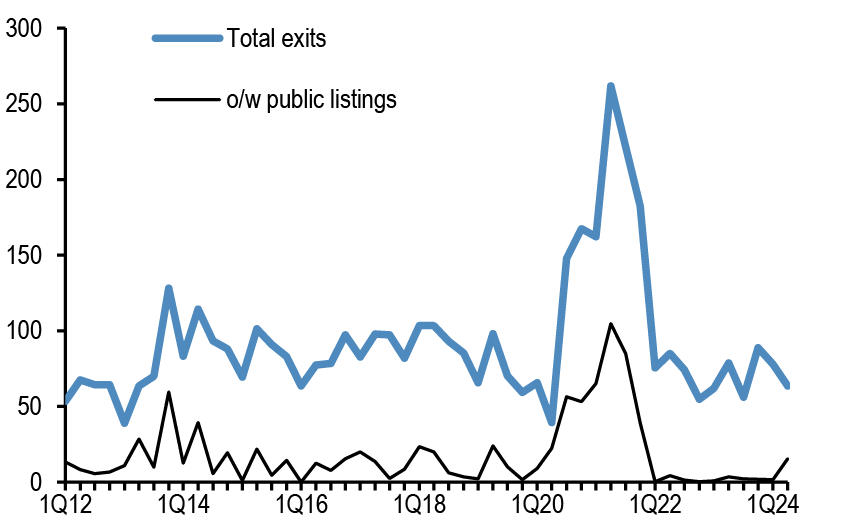
- When it comes to exits, however, the picture is rather mixed. On the positive side, the fact US PE saw an uptick in exits via public listings in 2Q24 to $15bn ( Figure 8), almost equalling the combined total of the prior nine quarters since the start of 2022, was clearly positive. At the same time, the total pace of exits of just under $65bn is below the quarterly average since the start of 2022 of just under $75bn, as well as below the average pace of exits in the five years preceding the financial crisis of around $85bn per quarter. This suggests a rather low exit pace when factoring in the growth in the PE universe relative to the pre-pandemic period.
Figure 8: Quarterly US PE exits
In $bn.
Source: Pitchbook, J.P. Morgan.
- The start of an eventual easing cycle by the Fed should provide some relief as it could signal that after a prolonged period of high interest costs this headwind for older vintages could begin to recede. However, this clearly depends on the catalyst for these rate cuts. If it represents a gradual shift away from tight monetary conditions towards neutral as inflation settles closer to target and growth holds up, this would clearly be positive. If, on the other hand, it represents the start of a cutting cycle amid an economy that approaches contraction, the implications are clearly less benign and the reduced headwind from interest costs would likely be more than offset by a hit to cash flows generated by the underlying companies.
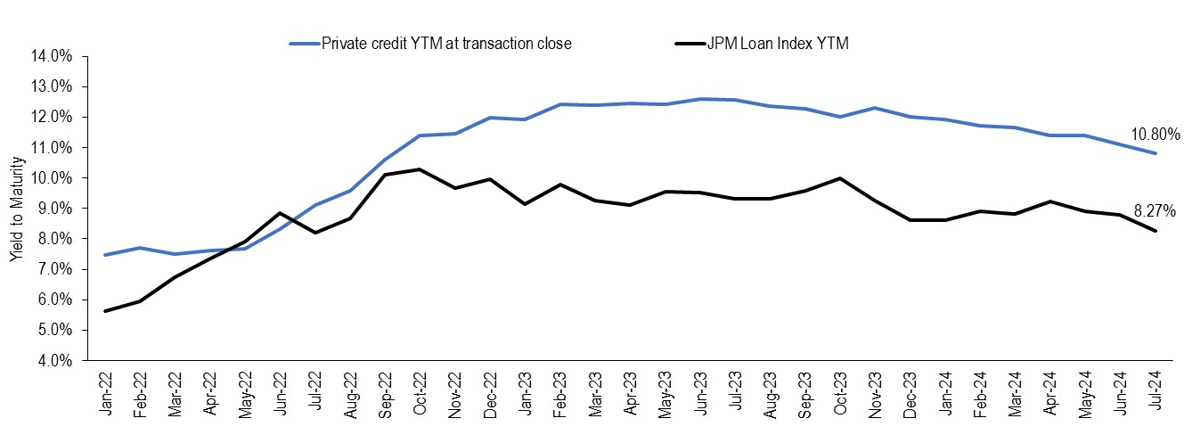
- While the above highlights a vulnerability for private equity, in private credit there are fewer causes for concern. Private credit deals have typically been transacted at higher yields than leveraged loans ( Figure 9), giving some cushion to absorb defaults, and the regular interest payments create a steadier stream of cash flows. Indeed, as we note above, there has been some moderation in fundraising, and an improvement in sentiment has seen improved capital market conditions for syndicated loans and seen a recapturing of market share by public markets from private lenders. Indeed, increased competition between private and syndicated markets has seen around $24bn of syndicated loans refinanced into private credit and around $23bn of direct loans into syndicated loans YTD. Moreover, default activity in private credit and leveraged loans have been broadly comparable (JPM High Yield and Leveraged Loans, Aug 14th).
- What about real estate? High interest rates remain a headwind for commercial real estate, challenging both valuations and refinancing. Legacy non-transacted private real estate has yet to be revalued properly as we previously explained in our sister publication AIOS. That said, similar to private credit, there is steadier stream of cash flows in real estate which combined with some moderation in fundraising reduces the risk of the bottleneck we fear for private equity where investors might be forced to sell public assets to meet capital calls. In all, any spillover effects from private assets to public markets are more likely to emanate from private equity rather than private credit or real estate. That said, rising delinquency rates which are evident in the office space do pose risks to segments of credit markets such as more office-exposed CMBS.
Figure 9: Private credit transactions v Public market pricing
Source: J.P. Morgan. YTM Includes OID.
The recent rebound in US liquidity or money supply should prove temporary
- We had argued previously in our publication that the US liquidity or money supply backdrop, i.e. the sum of the stock of US bank deposits and Money Market Funds (MMFs), has likely entered a mildly contracting trend from April onwards. This forecast of mildly contracting trend of US liquidity that we previously envisaged to last until at least year-end reflected three factors: 1) continuation of the Fed’s QT till at least year-end even as the QT pace was halved from June onwards; 2) a bottoming out in the usage of the Fed’s reverse repo facility by domestic counterparties; and 3) a milder expansion of US bank loans compared to previous years.
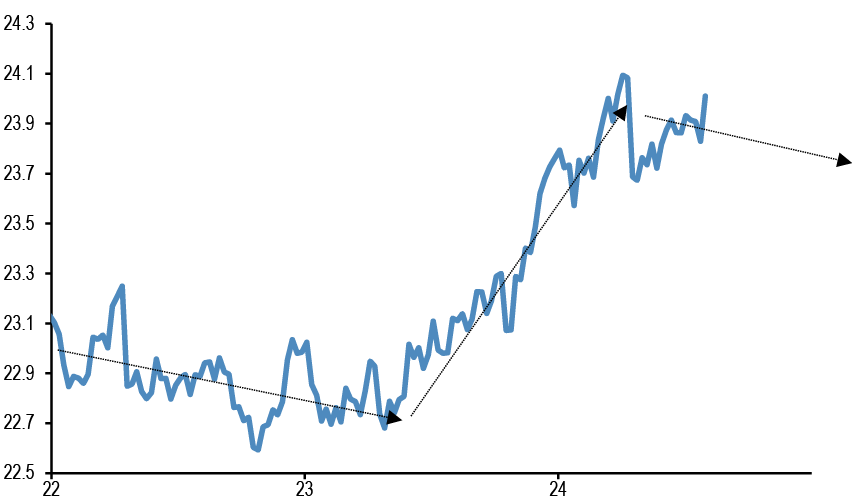
- After contracting in April, US liquidity or money supply rebounded in recent months ( Figure 10). While this rebound challenges our above forecast for a mildly contracting trend until at least year-end, we believe that our forecast is still reasonable and that the recent rebound in US liquidity is likely to prove temporary. In our mind there have been two recent boosts to US liquidity.
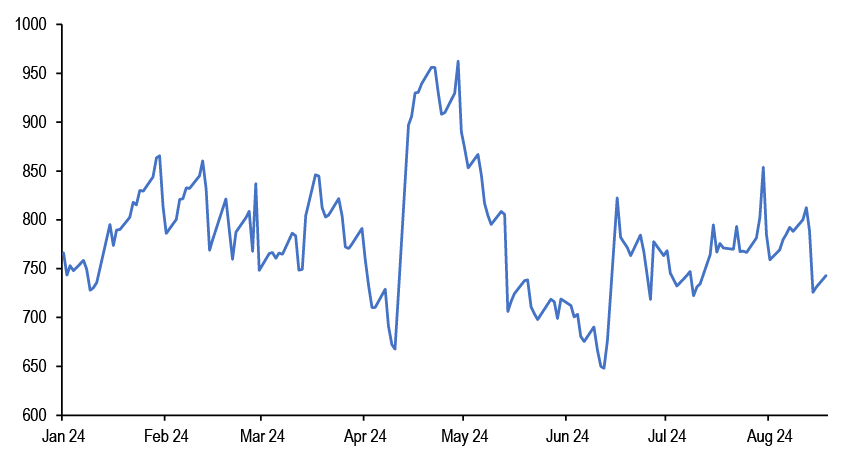
- One temporary boost to US liquidity emanated from the recent decline in the US Treasury General Account (TGA) to below the $850bn level the US Treasury expects for September-end. As the TGA balance rises from its current level of $743bn to $850bn by September-end, this would exert downward pressure on US liquidity.
Figure 10: Stock of US M2 money supply proxied by the sum of the stock of US commercial bank deposits and the AUM of US MMFs
In $tr.
Source: Bloomberg Finance L.P., J.P. Morgan.
Figure 11: US Treasury General Account (TGA) at the Fed
$bn.
Source: Bloomberg Finance L.P., J.P. Morgan.
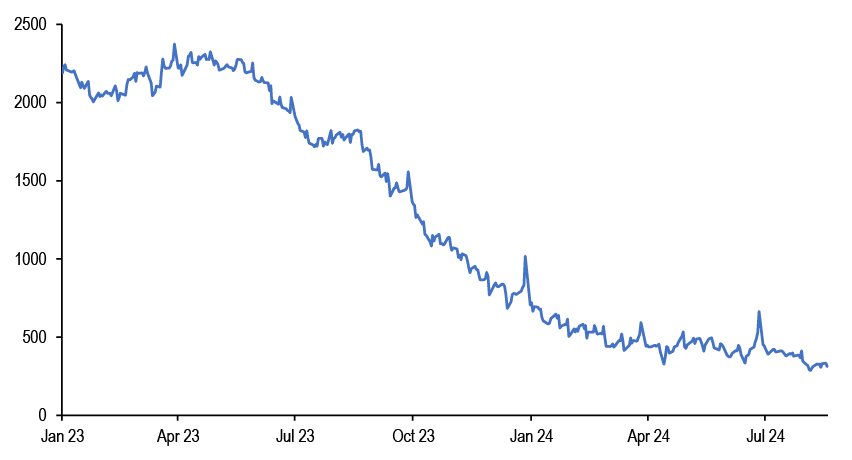
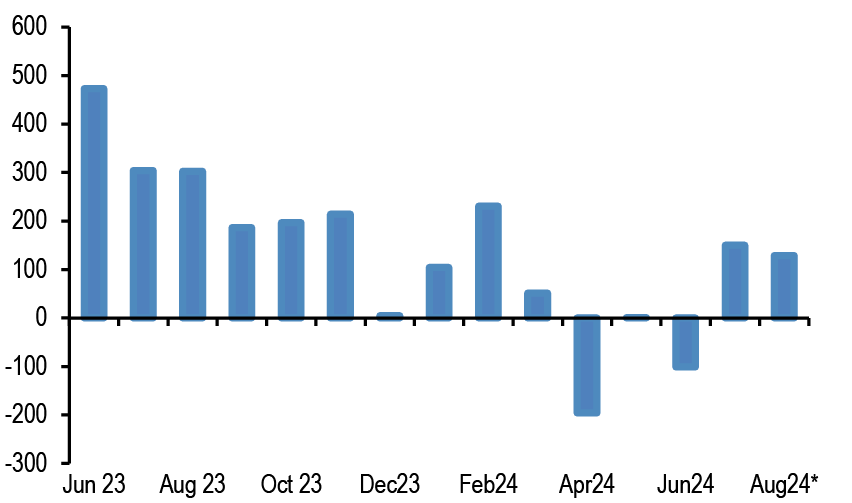
- The second temporary boost emanated from the recent reduction in the Fed’s reverse repo facility to below $300bn in August ( Figure 12) . In turn this reduction was driven by elevated US Tbill issuance during July and August ( Figure 13) that induced US money market funds to shift from reverse repos to Tbills. This force is likely behind us as we expect very little Tbill issuance between now and year-end and we thus look for the Fed’s reverse repo facility to stop declining and hover at close to current levels.
Figure 12: Fed’s Reverse Repo facility usage by domestic counterparties
$bn.
Source: Bloomberg Finance L.P., J.P. Morgan.
Figure 13: Monthly change in outstanding T-bills
$bn.
Source: Federal Reserve, J.P. Morgan.
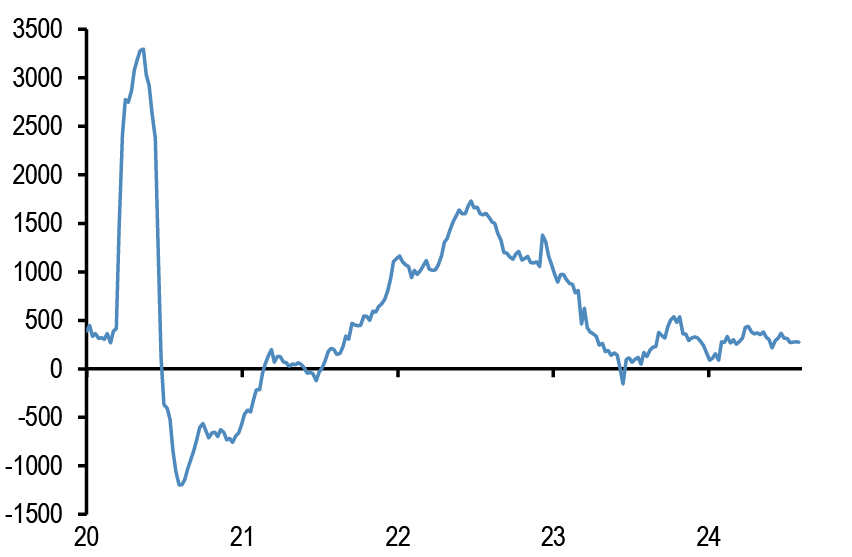
- With these two temporary boosts likely behind us, the Fed’s ongoing QT and a milder expansion of US bank loans ( Figure 14) should all combine to create a contracting trajectory for US liquidity or money supply into year end. And this would represent a big change from the past year and in particular the 11-month period between the end of April 2023 and the end of March 2024, when US money supply had expanded by $1.3tr, largely as the result of the liquidity injection induced by the $1.8tr reduction in the Fed’s reverse repo facility. Over the past few years, we can thus detect three phases in the trajectory for US liquidity or money supply: a mildly contracting phase from the beginning of 2022 to April 2023, a rapidly expanding phase from the end of April 2023 to the end of March 2024 and a return to a mildly contracting phase from April this year onwards.
Figure 14: US commercial bank loan growth
3-month (or 13-week) annualized pace of loan growth in $bn.
Source: Bloomberg Finance L.P., J.P. Morgan.
While euro area companies appear to have accumulated a rather heavy effective long EUR position, speculative investors such as CTAs have to yet to reach extreme long EUR territory
- With expectations on Fed rate cuts intensifying on US recession fears the dollar has come under pressure in particular against the euro given a backdrop of more resilient euro area growth. With the euro breaking out above 1.11, a level which over the past year and a half had triggered mean reversion, a question arises about the current extremity of short dollar/long euro positions.
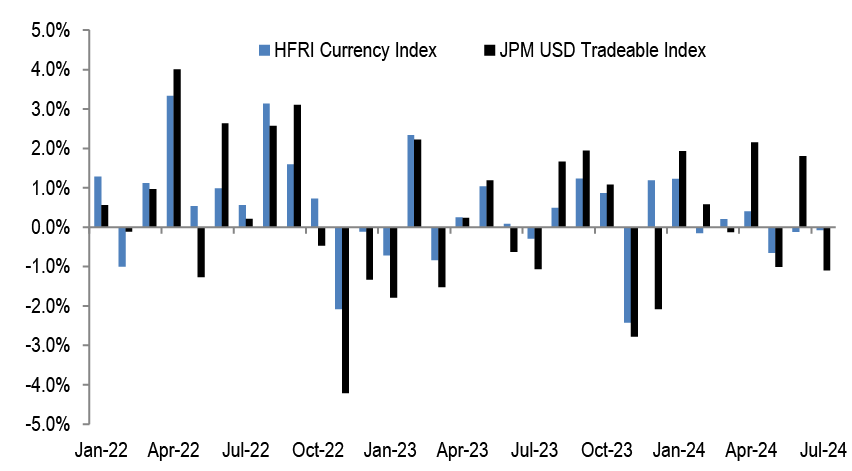
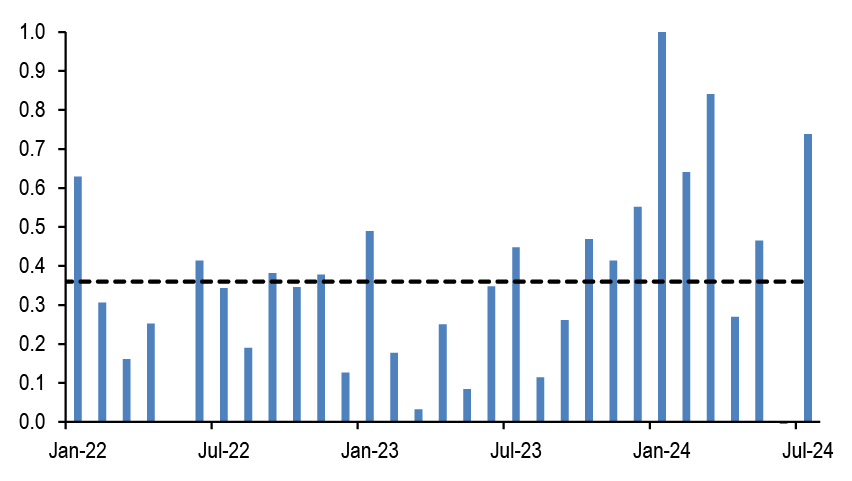
- Starting first with currency only hedge funds, they appear to have started the year with a long dollar stance during January as suggested by the positive beta between the monthly HFRI Currency HF index and the JPM USD tradeable index. According to Figure 15 this positive beta was also present until May but appears to have got unwound during June and July. In other words, currency hedge funds appear to have entered August rather neutral on the dollar.
Figure 15: Currency HFs and USD returns
Monthly returns of the HFRI Currency HF index and the JPM USD tradable index.
Source: HFR, Bloomberg Finance L.P., J.P. Morgan.
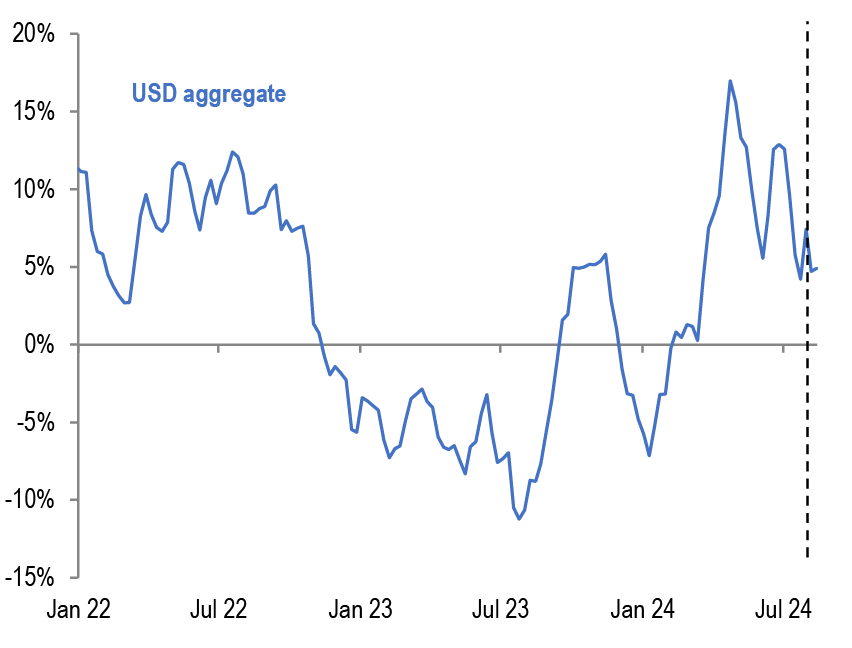
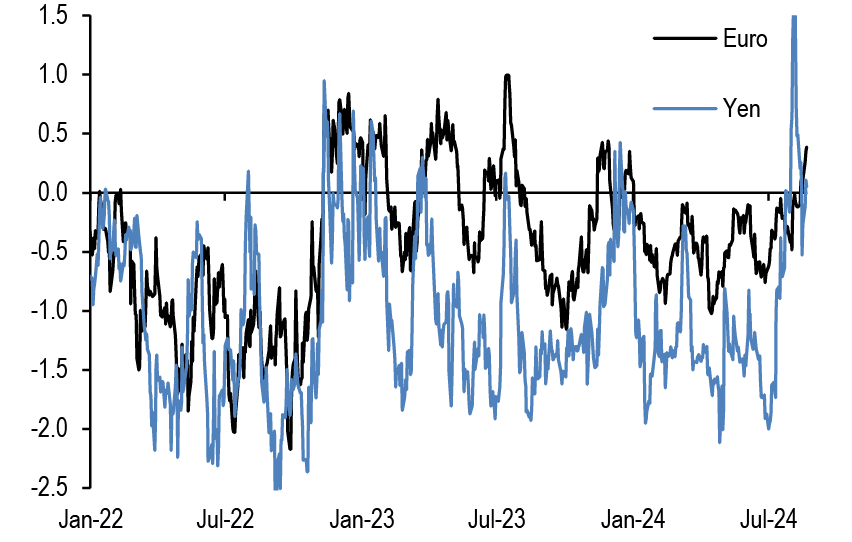
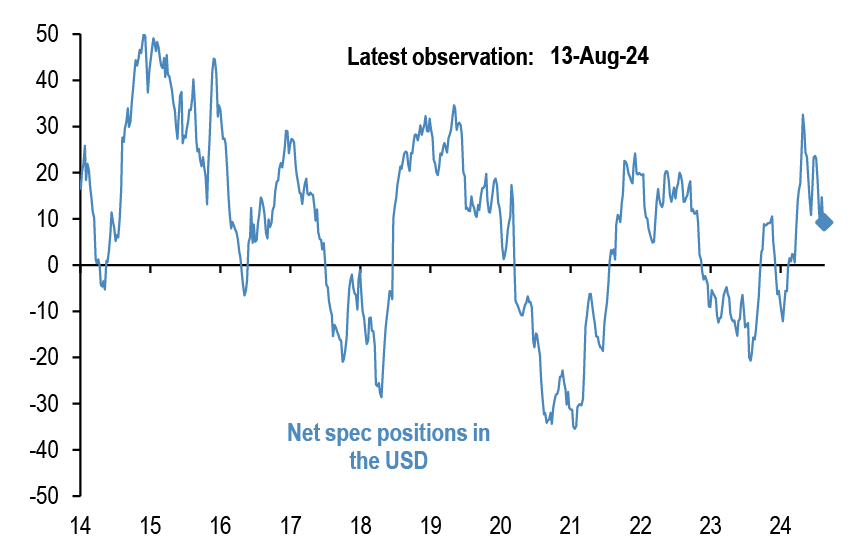
- That said, the speculative position indicator based on the non-commercial category of CFTC data which includes a broader set of macro managers beyond currency only hedge funds, had pointed to a modest long dollar base at the end of July ( Figure 16). Surely some of that previous long dollar base in Figure 16 was due to systematic funds such as CTAs. In particular, the signals from our momentum-based framework (see Tables A3 and A4 in the Appendix) that we regularly use to proxy positioning by momentum traders such as CTAs, pointed to much heavier yen shorts relative to euro shorts at the end of July ( Figure 17). While these previous extreme short yen positions by systematic funds swung from extremely short to extremely long territory and then back down to neutral over the past three weeks, previous euro shorts have seen more orderly unwinding shifting from modestly short territory at the end of July to modestly long territory currently. So in our framework, momentum traders such as CTAs have yet to reach extreme long positions in the euro.
Figure 16: Spec position indicator on aggregate USD
As a % of open interest. Last obs. 13th Aug 24.
Source: CFTC, Bloomberg Finance L.P., J.P. Morgan.
Figure 17: Momentum Signals for the Euro and the Yen
Average z-score of Short and Long term momentum signal in our Trend Following Strategy framework shown in Tables A3 and A4 in the Appendix.
Source: Bloomberg Finance L.P., J.P. Morgan.
- What about corporates? Corporate hedging behavior can also be important for currency moves as corporates come under pressure to boost their hedges when currency fluctuations increase. What evidence do we have on corporate hedging behavior? Gauging corporate hedging behavior or their currency exposure is a difficult task given that corporates face multiple currency influences both in terms of cash flow and balance sheet items. In addition, their reporting on hedges is rather sporadic, lagged and incomplete. To overcome this difficulty, we apply a framework first presented in Gauging corporate fx hedging, Sep 2017, that draws on the academic literature that has devised indirect ways to gauge corporates’ currency exposures via measuring the sensitivity of equity values to foreign exchange changes.
- We follow the extensive academic literature built on the original paper by Adler and Dumas ( “Exposure to Currency Risk” 1984) and we proxy the currency exposure of corporates via the following bivariate regression at the individual firm level:
- Ri,t = a+ c_i × RM,t + b_i × ΔFX,t + residual.
- where Ri,t is the return on the equity value of the firm i for the period t-1 to t, RM,t is the return on the market portfolio proxied by a country’s equity index in local currency terms, c_i is the firm’s market beta, ΔFX,t is the change in the relevant trade weighted exchange rate for the period t-1 to t and b_i is the firm’s exchange rate beta.
- This exchange rate beta coefficient is used as proxy for each firm’s net currency exposure. It effectively reflects the change in each firm’s value that can be explained by movements in the exchange rate after conditioning on the market return. Most empirical academic studies follow the above specification, i.e. they include the return to a market portfolio along with the exchange rate variablein their regression models. The market portfolio return not only controls for “macro” influences on a firm’s value outside the exchange rate, but also improves the precision of the regression coefficient estimates as the residual variance of the model is dramatically reduced.
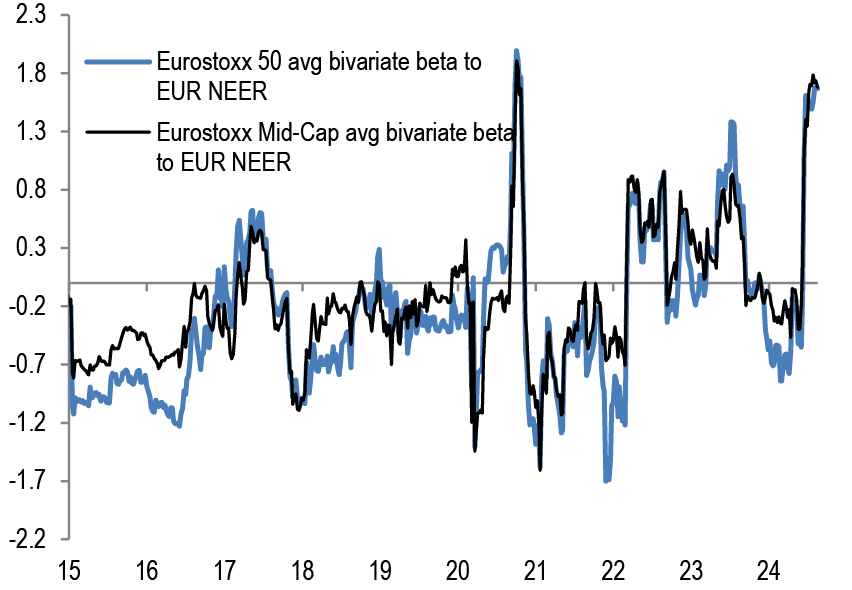
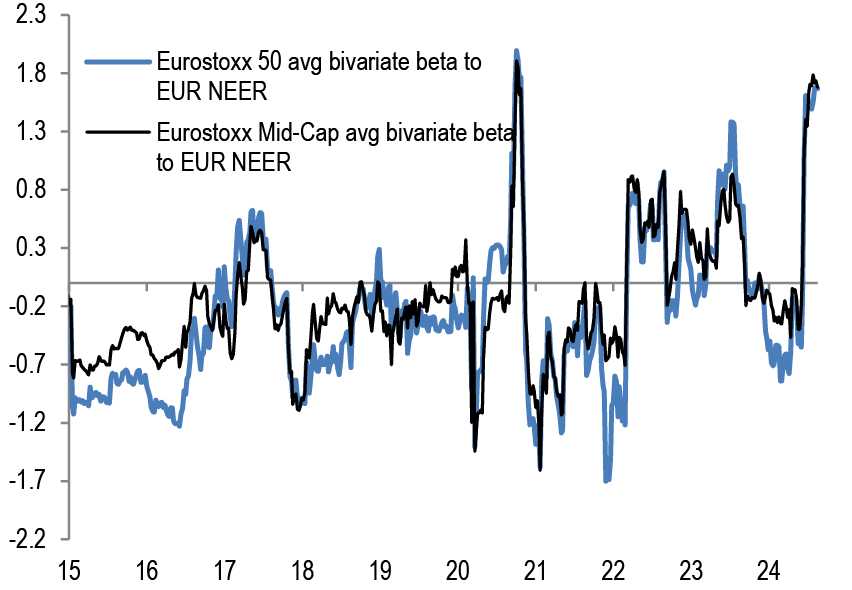
- We apply this framework to both euro area large cap companies, i.e. the 50 companies behind the Eurostoxx50 index, and small cap companies, i.e. the 50 biggest companies behind the Eurostoxx Small Cap index. Figure 18 shows these average betas, i.e. the average of the bivariate regression coefficients across 50 individual firm regression models for Eurostoxx50 and for 50 small-cap companies. The regressions are done over 6-month rolling periods and are based on weekly equity returns and currency changes of the JPM euro trade weighted index. Given the 6-month rolling periods the betas tend to be more backward looking and as a result more difficult to interpret. That said, the abrupt increases in Figure 18 do suggest that Euro area companies had accumulated a rather heavy effective long euro position, perhaps due to importers’ reluctance to hedge their structural long euro position or due to exporters overhedging their structural short euro position.
Figure 18: Average beta of Eurostoxx 50 companies and Eurostoxx Mid-Cap to trade-weighted EUR
Rolling 26 weeks average betas based on a bivariate regression of the weekly returns of individual stocks in the Eurostoxx 50 index to the weekly returns of the MSCI AC World and JPM EUR Nominal broad effective exchange rate (NEER).
Source: Bloomberg Finance L.P., J.P. Morgan.
Speculative investors’ positions across commodity futures look oversold in Brent oil, neutral in copper and overbought in gold
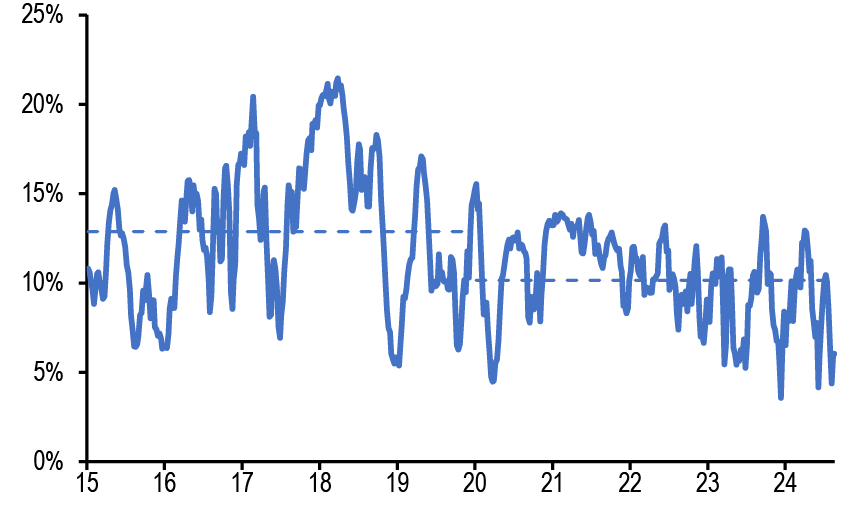
- With Brent oil prices about to breach this year’s low, how oversold are oil positions? As we argued previously the mean of net long positions in Brent futures by the managed money category appears to have experienceda structural shift post the pandemic, as the supply of net short positions by the “producer/user” category has been reduced. After taking this structural break into account, we find that discretionary spec investors have exhibited marked OWs in oil futures in September 2023 and early April 2024 but have shifted in the opposite direction in recent weeks shifting to historically very oversold levels ( Figure 19).
Figure 19: Net speculative (managed money) longs in Brent futures
% of open interest. Dashed line shows average for 2015-2019 and 2020 onward.
Source: CFTC, Bloomberg Finance L.P., J.P. Morgan.
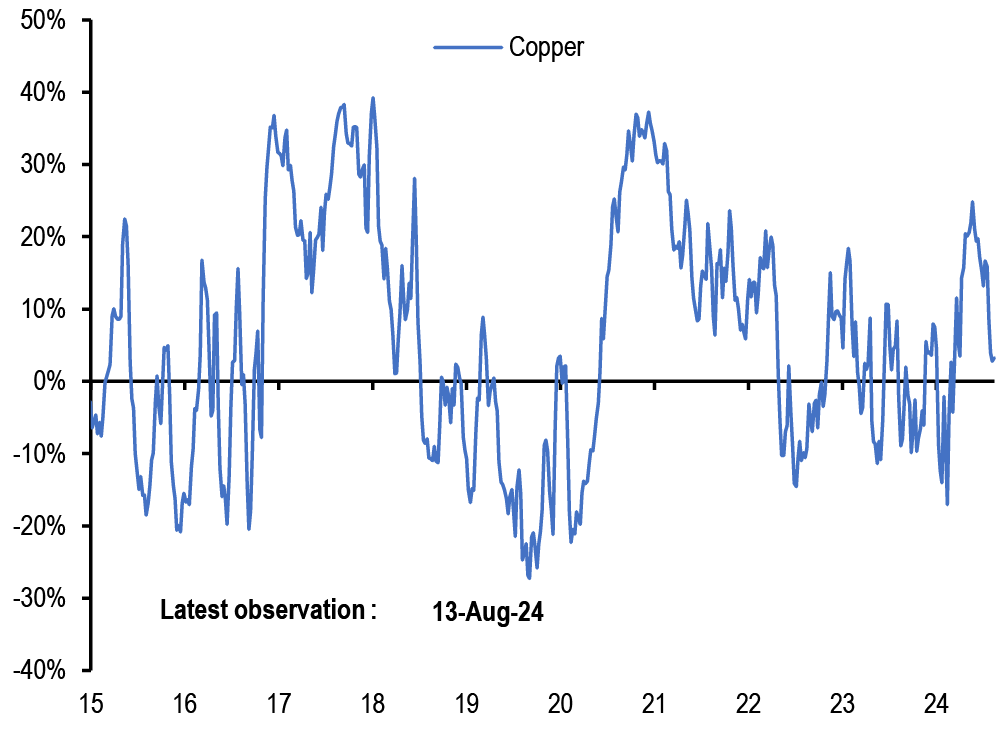
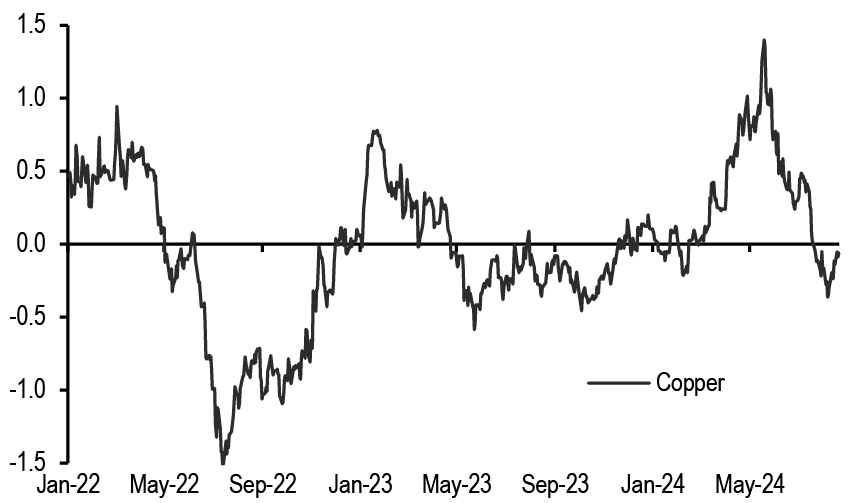
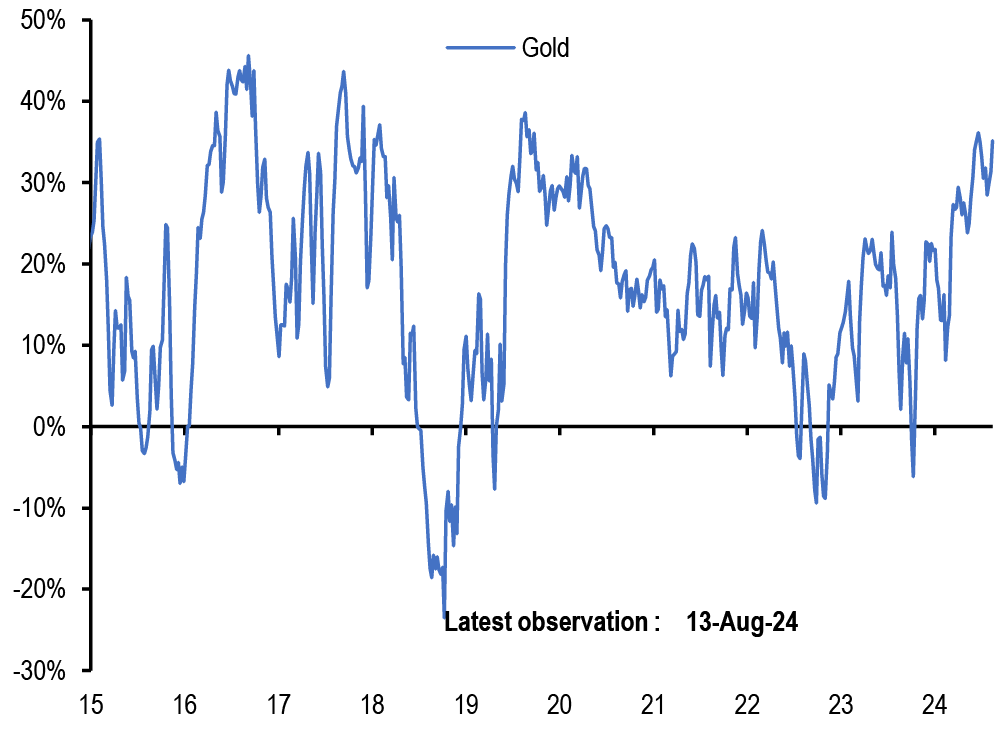
- What about other commodities? For copper futures, whether one looks at the speculative/managed money positions ( Figure 20) or our momentum signals as a proxy of how momentum traders such as CTAs are positioned ( Figure 21) , positions look close to neutral. For gold futures whether one looks at the speculative/managed money positions ( Figure 22) or our momentum signals as a proxy of how momentum traders such as CTAs are positioned ( Figure 23) , positions look rather overbought.
Figure 20: Net speculative (managed money) longs in copper future
As a % of open interest.
Source: CFTC, Bloomberg Finance L.P., J.P. Morgan.
Figure 21: Momentum signals for copper futures
Average z-score of shorter- and longer-term signals.
Source: Bloomberg Finance L.P., J.P. Morgan.
Figure 22: Net speculative (managed money) longs in gold futures
% of open interest.
Source: CFTC, Bloomberg Finance L.P., J.P. Morgan.
Figure 23: Momentum signals for gold futures
Average z-score of shorter- and longer-term signals.
Source: Bloomberg Finance L.P., J.P. Morgan.
Appendix
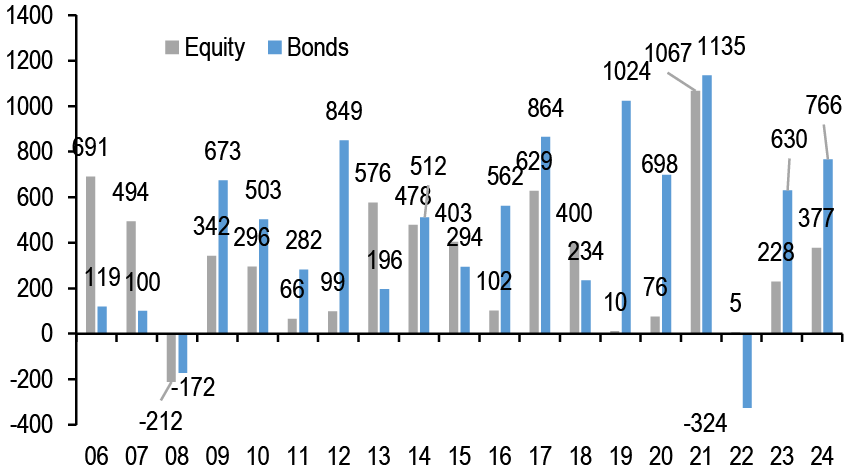
Chart A1: Global equity & bond fund flows
$bn per year of Net Sales, i.e. includes net new sales + reinvested dividends for Mutual Funds and ETFs globally, i.e. for funds domiciled both inside and outside the US. Flows come from ICI (worldwide data up to Q1’24). Data since then are a combination of monthly and weekly data from Lipper, EPFR and ETF flows from Bloomberg Finance L.P.
Source: ICI, EPFR, Lipper, Bloomberg Finance L.P., J.P. Morgan.
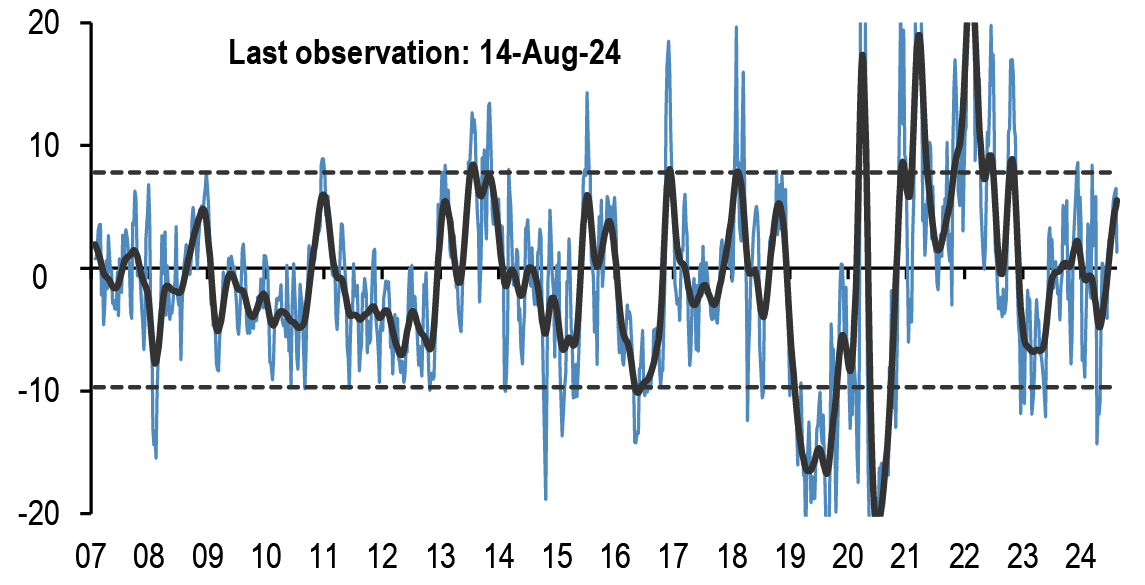
Chart A2: Fund flow indicator
Difference between flows into Equity and Bond funds: $bn per week. Difference between flows into Equity vs. Bond funds in $bn per week. Flows include Mutual Fund and ETF flows globally, i.e. funds domiciled both inside and outside the US (source: EPFR) The thin blue line shows the 4-week average of difference between Equity and Bond fund flows. Dotted lines depict ±1 StDev of the blue line. The thick black line shows a smoothed version of the same series. The smoothing is done using a Hodrick-Prescott filter with a Lambda parameter of 100.
Source: EPFR, J.P. Morgan.
Table A1: Flow Monitor
$bn per week. The first two rows include Mutual Fund and ETF flows globally, i.e.flows for funds domiciled both inside and outside the US(source: EPFR). The last four rows only include funds domiciled in the US.International Equity funds are equity funds domiciled in the US that invest outside the US (source: ICI and Bloomberg Finance L.P.).
| MF & ETF Flows | 14-Aug | 4 wk avg | 13 wk avg | 2024 avg |
| All Equity | 11.52 | 13.1 | 14.2 | 10.4 |
| All Bond | 6.36 | 11.8 | 12.3 | 11.6 |
| US Equity | -4.67 | -4.5 | -1.6 | -3.9 |
| US Bonds | 1.46 | 3.5 | 5.1 | 6.9 |
| Non-US Equity | 16.19 | 17.6 | 15.8 | 14.2 |
| Non-US Bonds | 4.90 | 8.2 | 7.2 | 4.5 |
| US Taxable Bonds | 6.73 | 5.9 | 6.1 | 4.8 |
| US Municipal Bonds | 0.13 | 0.2 | 0.1 | 0.1 |
| US HG Bonds | 5.57 | 3.6 | 3.4 | 4.2 |
| US HY Bonds | -0.38 | -0.9 | 0.1 | 0.3 |
| US MMFs | 29.58 | 7.8 | 9.6 | 8.7 |
| UCITS Flows | May-24 | 3 mth avg | 2023 avg | 2024 avg |
| Euro MMFs | -13.13 | 2.08 | 15.63 | 4.06 |
| Euro Equities | 28.53 | 8.7 | 0.6 | 7.7 |
| Euro Bonds | 22.24 | 23.5 | 12.3 | 28.5 |
Source: ICI, EPFR, EFAMA, Bloomberg Finance L.P., and J.P. Morgan.
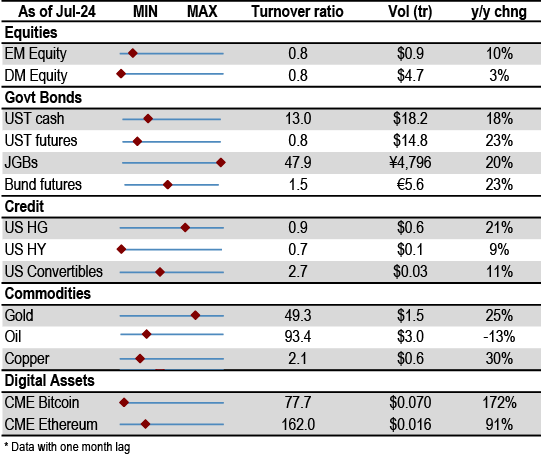
Table A2: Trading turnover monitor
Volumes are monthly and Turnover ratio is annualised (monthly trading volume annualised divided by the amount outstanding). UST Cash is primary dealer transactions in all US government securities. UST futures are from Bloomberg Finance L.P. JGBs are OTC volumes in all Japanese government securities. Bunds, Gold, Oil and Copper are futures. Gold includes Gold ETFs. Min-Max chart is based on Turnover ratio. For Bunds and Commodities, futures trading volumes are used while the outstanding amount is proxied by open interest. The diamond reflects the latest turnover observation. The thin blue line marks the distance between the min and max for the complete time series since Jan-2005 onwards. Y/Y change is change in YTD notional volumes over the same period last year.
Source: Bloomberg Finance L.P., Federal Reserve, Trace, Japan Securities Dealer Association, WFE, J.P. Morgan.
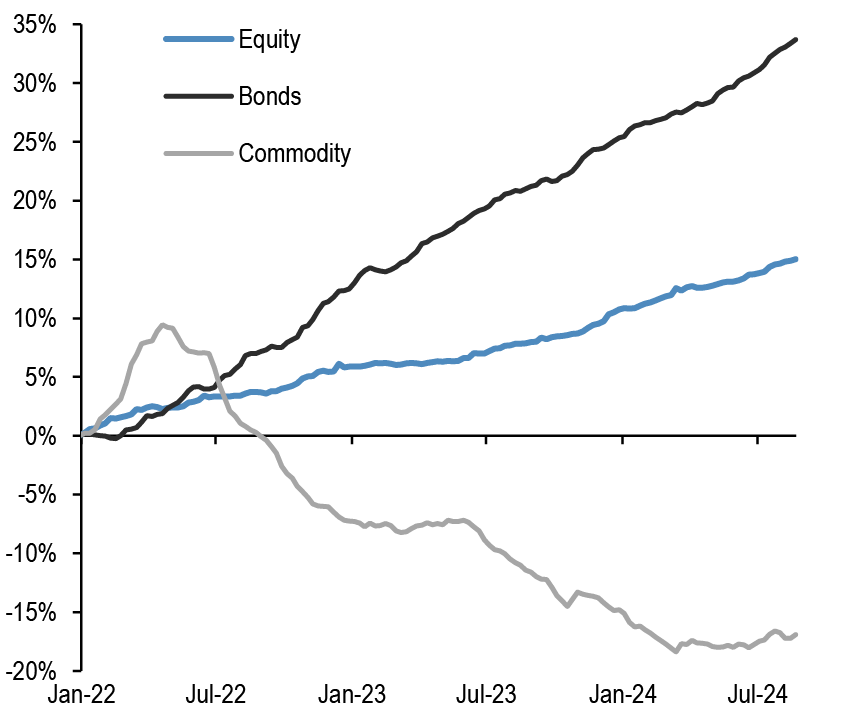
ETF Flow Monitor (as of 14th Aug)
Chart A3: Global Cross Asset ETF Flows
Cumulative flow into ETFs as a % of AUM
Source: Bloomberg Finance L.P., J.P. Morgan.
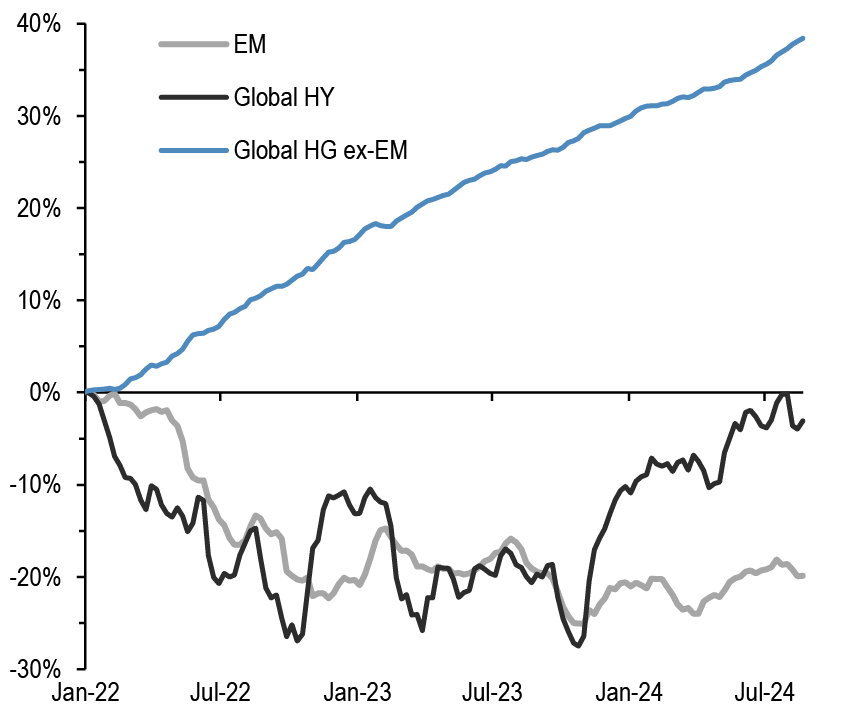
Chart A4: Bond ETF Flows
Cumulative flow into bond ETFs as a % of AUM
Source: Bloomberg Finance L.P., J.P. Morgan.
Chart A5: Global Equity ETF Flows
Cumulative flow into global equity ETFs as a % of AUM
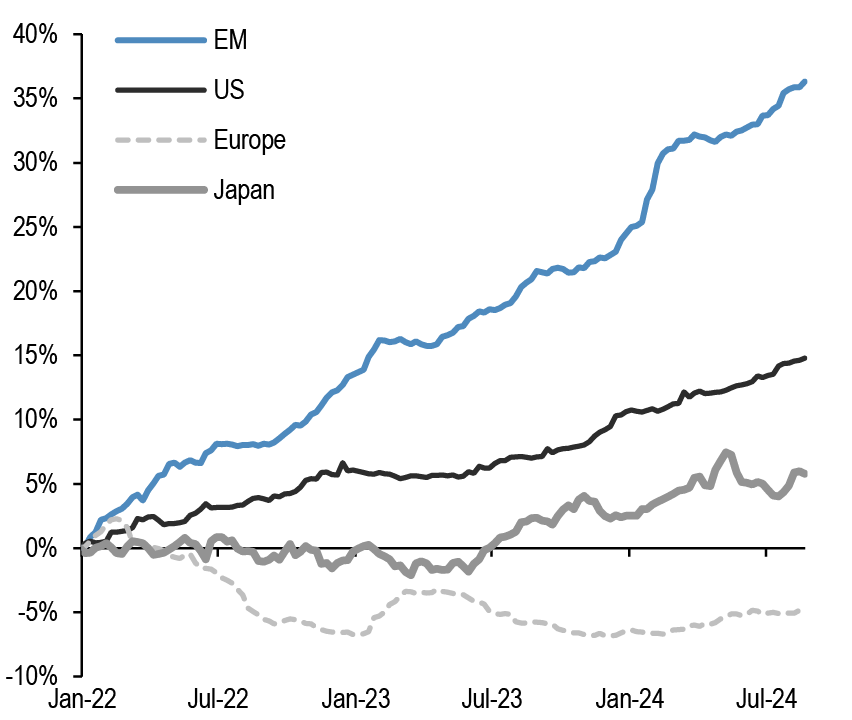
Source: Bloomberg Finance L.P., J.P. Morgan. Note: We include ETFs with AUM > $200mn in all the flow monitor charts. Chart A5 exclude China On-shore (A-share) ETFs from EM and in Japan. We subtract the BoJ buying of ETFs.
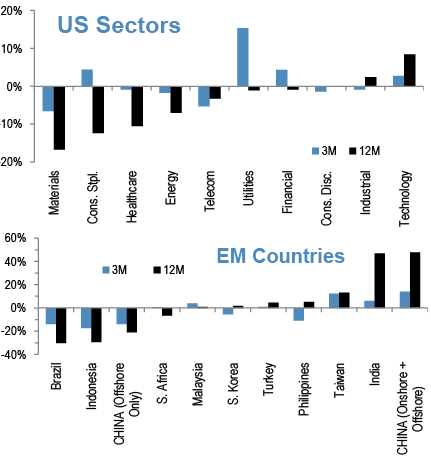
Chart A6: Equity Sectoral and Regional ETF Flows
Rolling 3-month and 12-month change in cumulative flows as a % of AUM. Both sorted by 12-month change
Source: Bloomberg Finance L.P., J.P. Morgan.
Short Interest Monitor
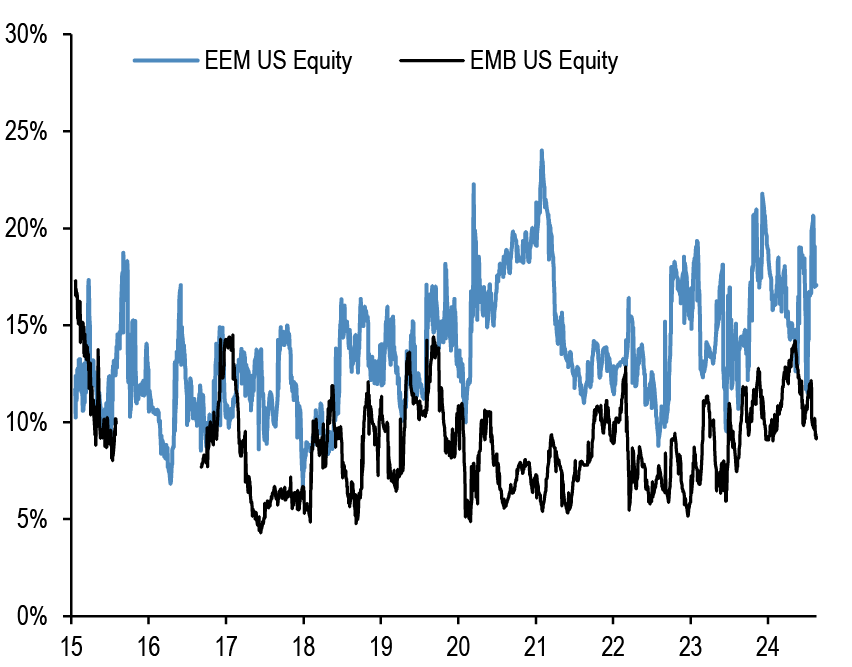
Chart A7: Short interest on the EEM and EMB US ETF
Short Interest as a % share of share outstanding.
Source: S3, J.P. Morgan
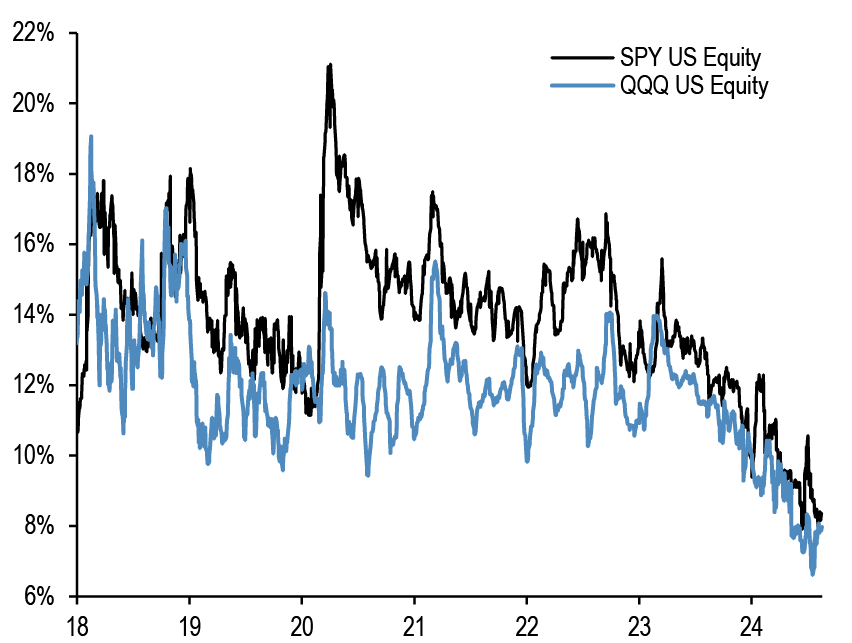
Chart A9: Short interest on the SPY and QQQ US ETF
Short Interest as a % share of share outstanding. Last obs is for 16th August 2024.
Source: S3, J.P. Morgan
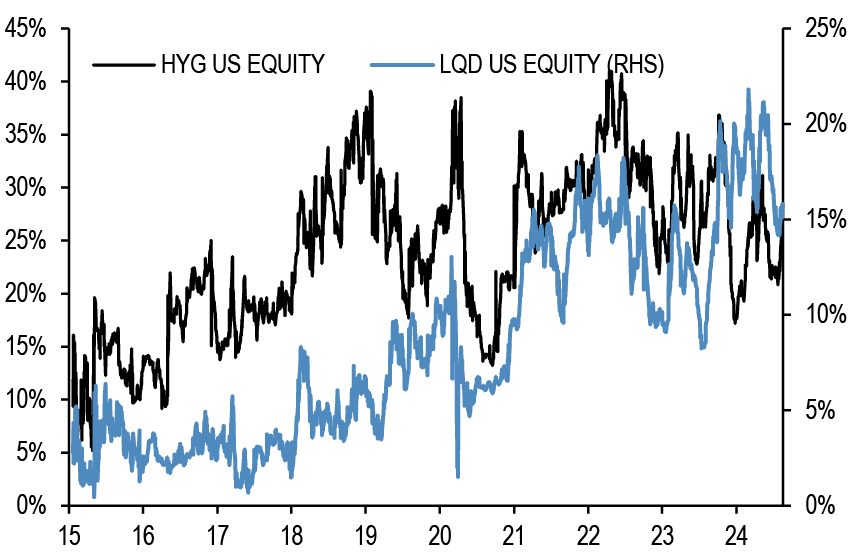
Chart A8: Short interest on the LQD and HYG US ETF
Short Interest as a % share of share outstanding.
Source: S3, J.P. Morgan
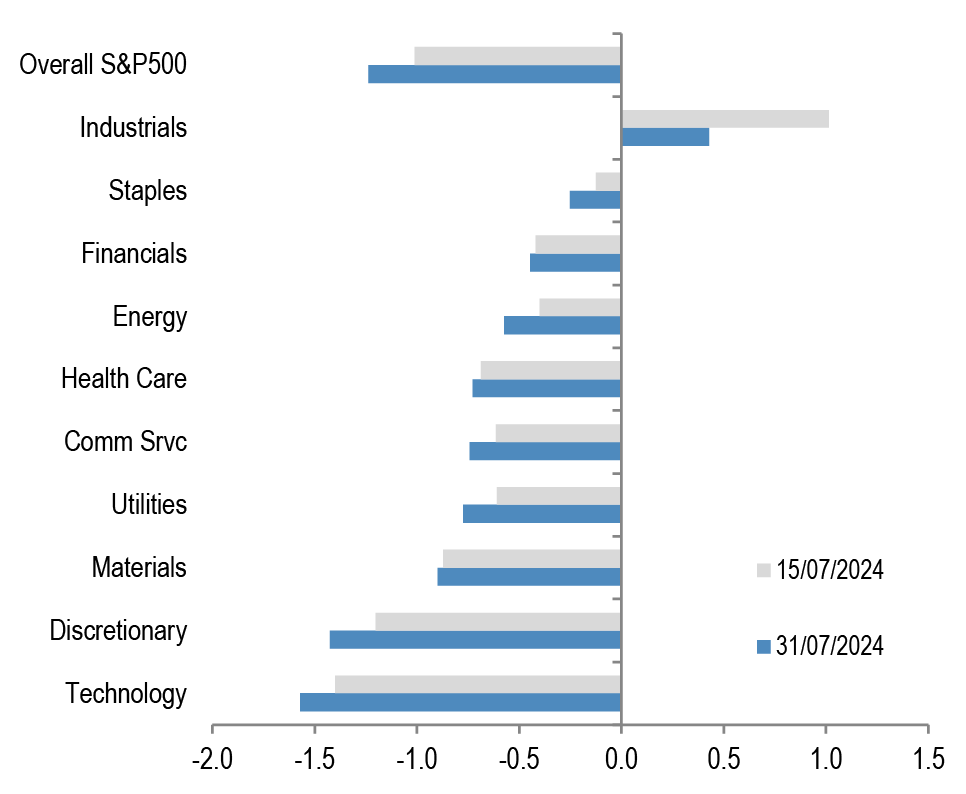
Chart A10: S&P500 sector short interest
Short interest as a % of shares outstanding based on z-scores. A strategy which overweights the S&P500 sectors with the highest short interest z-score (as % of shares o/s) vs. those with the lowest, produced an information ratio of 0.7 with a success rate of 56% (see F&L, Jun 28,2013 for more details).
Source: NYSE, Bloomberg Finance L.P., J.P. Morgan
Chart A11a: Cross Asset Volatility Monitor 3m ATM Implied Volatility (1y history), as of 20th Aug-2024
This table shows the richness/cheapness of current three-month implied volatility levels (red dot) against their one-year historical range (thin blue bar) and the ratio to current realised volatility. Assets with implied volatility outside their 25th/75th percentile range (thick blue bar) are highlighted. The implied-to-realised volatility ratio uses 3-month implied volatilities and 1-month (around 21 trading days) realised volatilities for each asset.
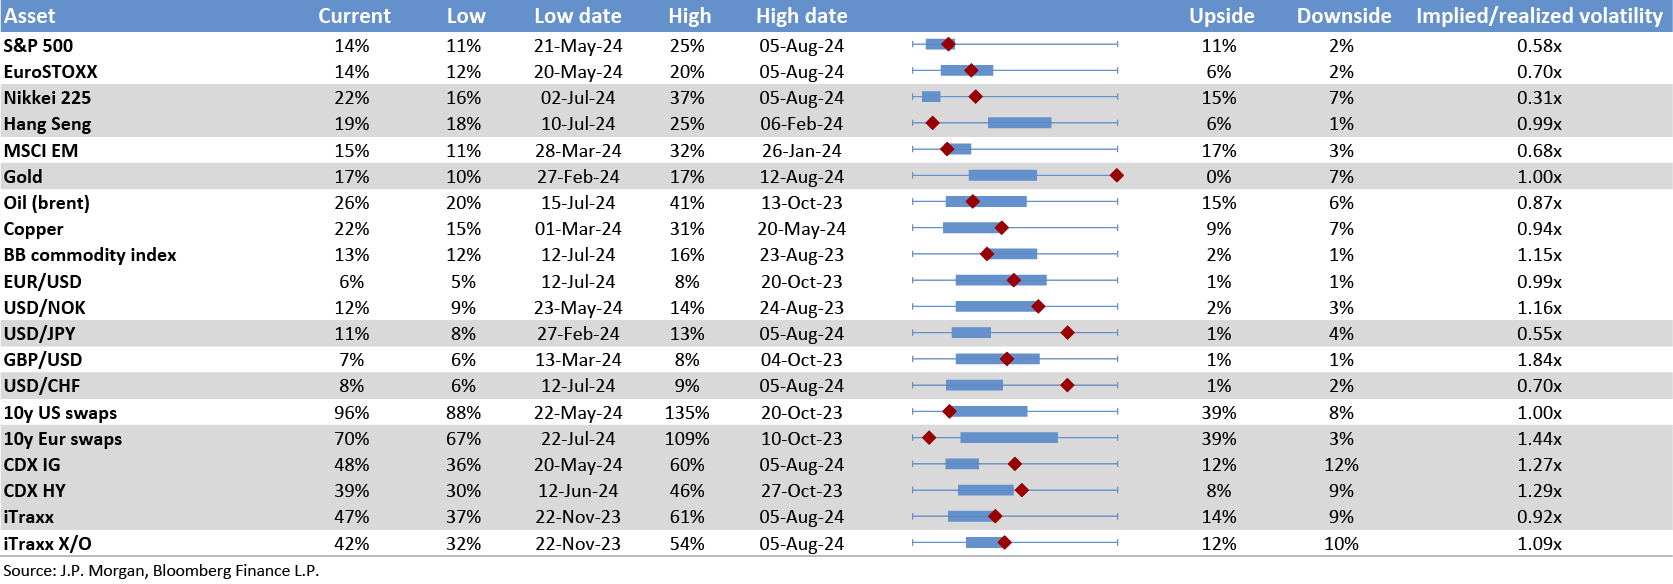

Chart A11b: Option skew monitor
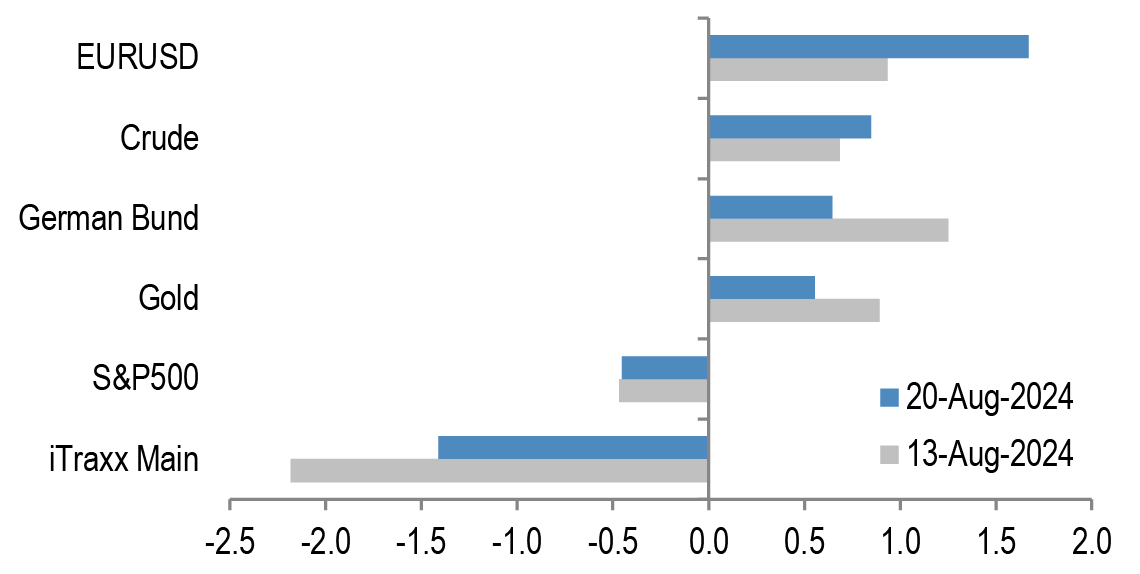
Skew is the difference between the implied volatility of out-of-the-money (OTM) call options and put options. A positive skew implies more demand for calls than puts and a negative skew, higher demand for puts than calls. It can therefore be seen as an indicator of risk perception in that a highly negative skew inequities is indicative of a bearish view. The chart shows z-score of the skew, i.e. the skew minus a rolling 2-year avg skew divided by a rolling two-year standard deviation of the skew. A negative skew on iTraxx Main means investors favour buying protection, i.e. a short risk position. A positive skew for the Bund reflects a long duration view, also a short risk position.
Source: J.P. Morgan.
Chart A11c: Equity-Bond metric map
Explanation of Equity - Bond metric map: Each of the five axes corresponds to a key indicator for markets. The position of the blue line on each axis shows how far the current observation is from the extremes at either end of the scale. For example, a reading at the centre for value would mean that risky assets are the most expensive they have ever been while a reading at the other end of the axis would mean they are the cheapest they have ever been. Overall, the larger the blue area within the pentagon, the better for the risky markets. All variables are expressed as the percentile of the distribution that the observation falls into. I.e. a reading in the middle of the axis means that the observation falls exactly at the median of all historical observations. Value: The slope of the risk-return trade-off line calculated across USTs, US HG and HY corporate bonds and US equities(see GMOS p. 6, Loeys et al, Jul 6 2011 for more details). Positions: Difference between net spec positions on US equities and intermediate sector UST. See Chart A13. Flow momentum: The difference between flows into equity funds (incl. ETFs) and flows into bond funds. Chart A1. We then smooth this using a Hodrick-Prescott filter with a lambda parameter of 100. We then take the weekly change in this smoothed series as shown in Chart A1. Economic momentum:The 2-month change in the global manufacturing PMI. (See REVISITING: Using the Global PMI as trading signal, Nikolaos Panigirtzoglou, Jan 2012). Equity price momentum: The 6-month change in the S&P500 equity index. As of 16th Aug 24.

Source: Bloomberg Finance L.P., J.P. Morgan.
Spec position monitor
Chart A12: Weekly Spec Position Monitor
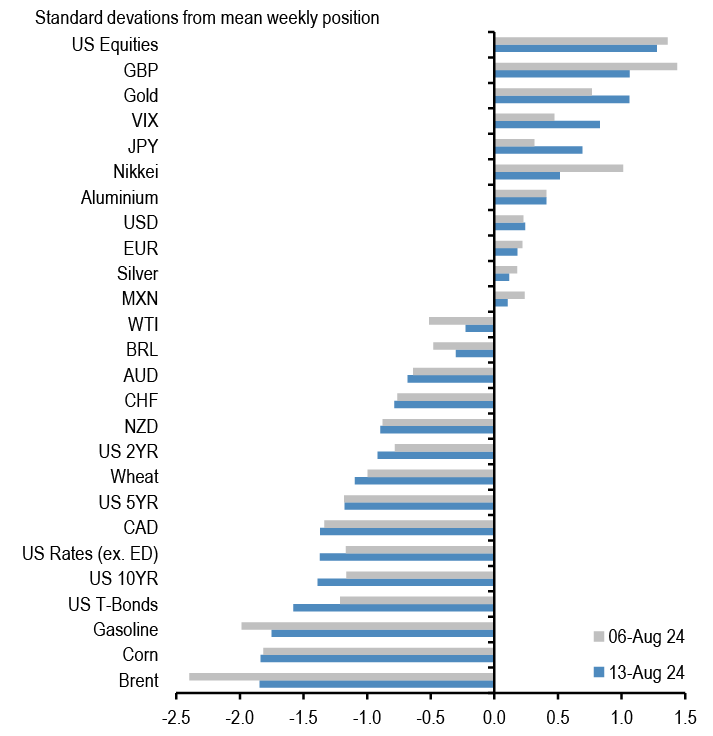
Net spec positions are proxied by the number of long contracts minus the number of short contracts using the speculative category of the Commitments of Traders reports (as reported by CFTC). To proxy for speculative investors for equity and US Treasury bond futures positions we use Asset managers and leveraged funds (see Chart A13), whereas for other assets we use the legacy Non-Commercial category. This net position is then converted to a dollar amount by multiplying by the contract size and then the corresponding futures price. We then scale the net positions by open interest. The chart shows the z-score of these net positions. US rates is a duration-weighted composite of the individual UST futures contracts excluding the Eurodollar contract.
Source: Bloomberg Finance L.P., CFTC, J.P. Morgan
Chart A14: Spec position indicator on Risky vs. Safe currencies
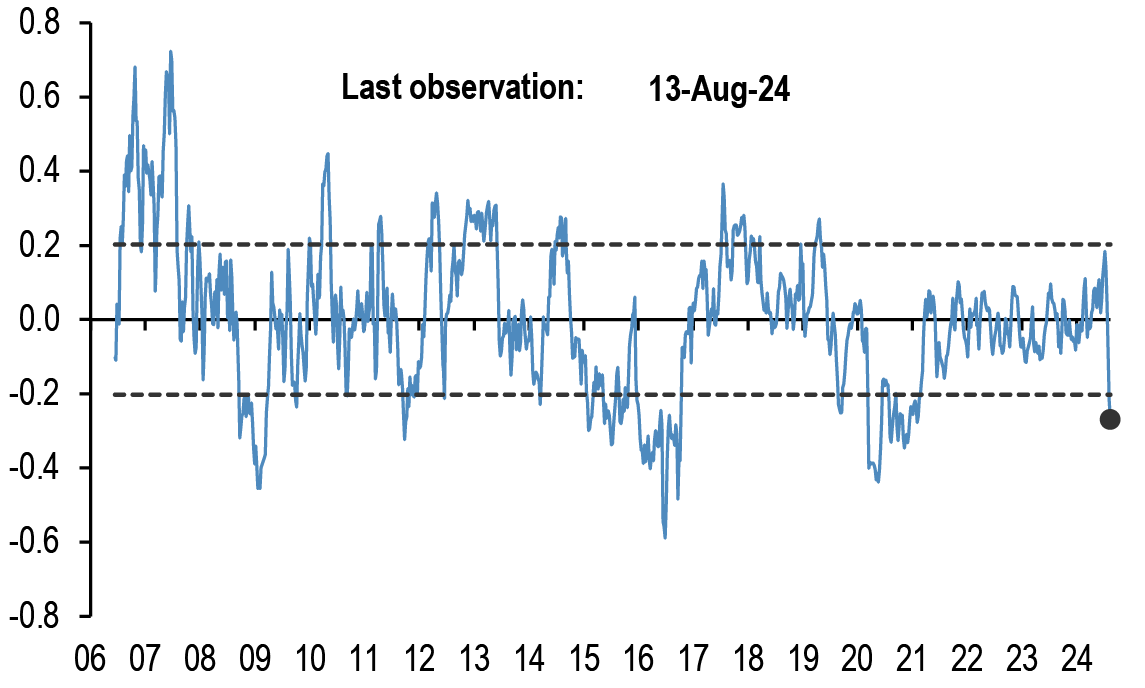
Difference between net spec positions on risky & safe currencies. Net spec position is calculated in USD across 5 ‘risky’ and 3 ‘safe’ currencies (safe currencies also include Gold). These positions are then scaled by open interest and we take an average of ‘risky’ and ‘safe’ assets to create two series. The chart is then simply the difference between the“risky” and “safe” series. The final series shown in the chart below is demeaned using data since 2006. The risky currencies are: AUD, NZD,CAD, MXN and BRL. The safe currencies are: JPY, CHF and Gold.
Source: Bloomberg Finance L.P., CFTC, J.P. Morgan.
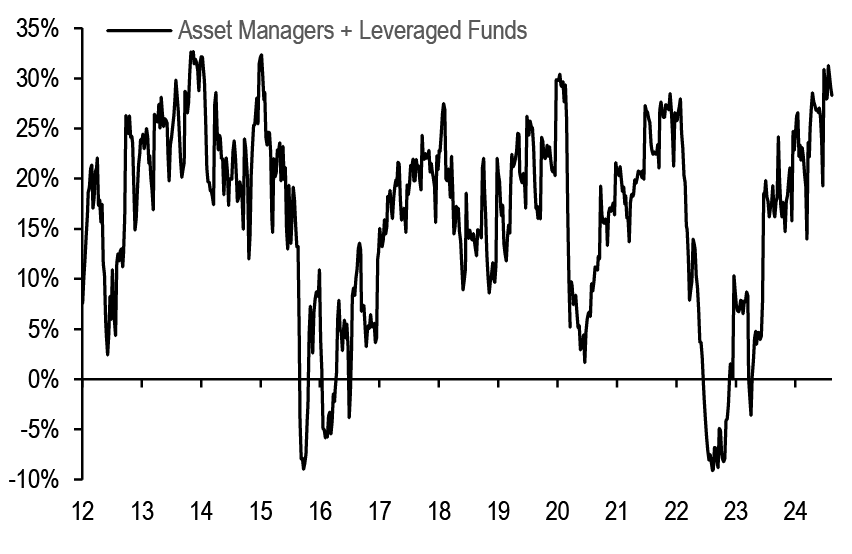
Chart A13: Positions in US equity futures by Asset managers and Leveraged funds
CFTC positions in US equity futures by Leveraged funds and Asset managers (as a % of open interest). It is an aggregate of the S&P500, DowJones, NASDAQ and their Mini futures contracts.
Source: CFTC, Bloomberg Finance L.P. and J.P. Morgan
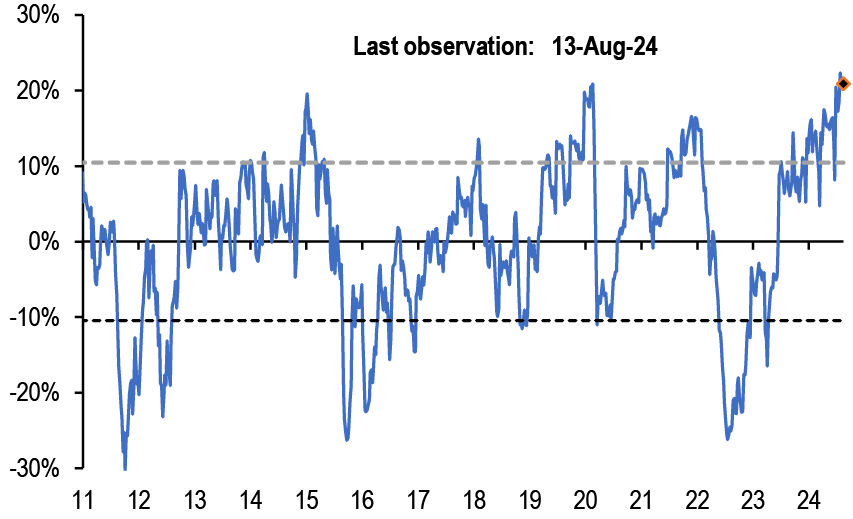
Chart A15: Spec position indicator on US equity futures vs. intermediate sector UST futures
Difference between net spec positions on US equity futures vs.intermediate sector UST futures. This indicator is derived by the difference between total CFTC positions in US equity futures by Asset managers + Leveraged Funds scaled by open interest minus the Asset managers + Leveraged Funds spec position on intermediate sector UST futures (i.e. all UST futures duration weighted ex ED and ex 2Y UST futures) also scaled by open interest.
Source: CFTC, Bloomberg Finance L.P. and J.P. Morgan
Mutual fund and hedge fund betas
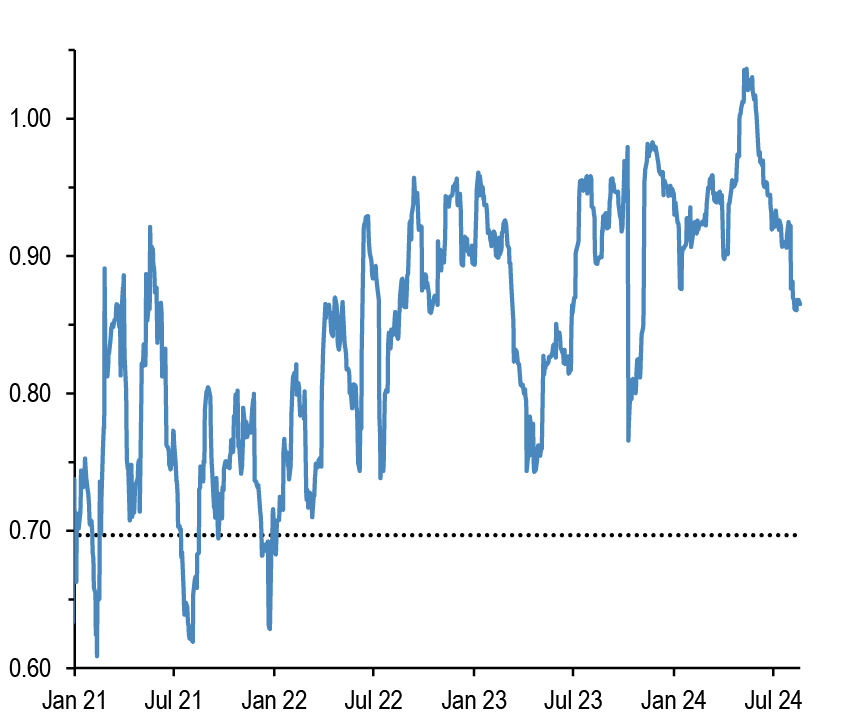
Chart A16: 21-day rolling beta of 20 biggest active US bond mutual fund managers with respect to the US Agg Bond Index
The dotted line shows the average beta since 2013.
Source: Bloomberg Finance L.P., J.P. Morgan.
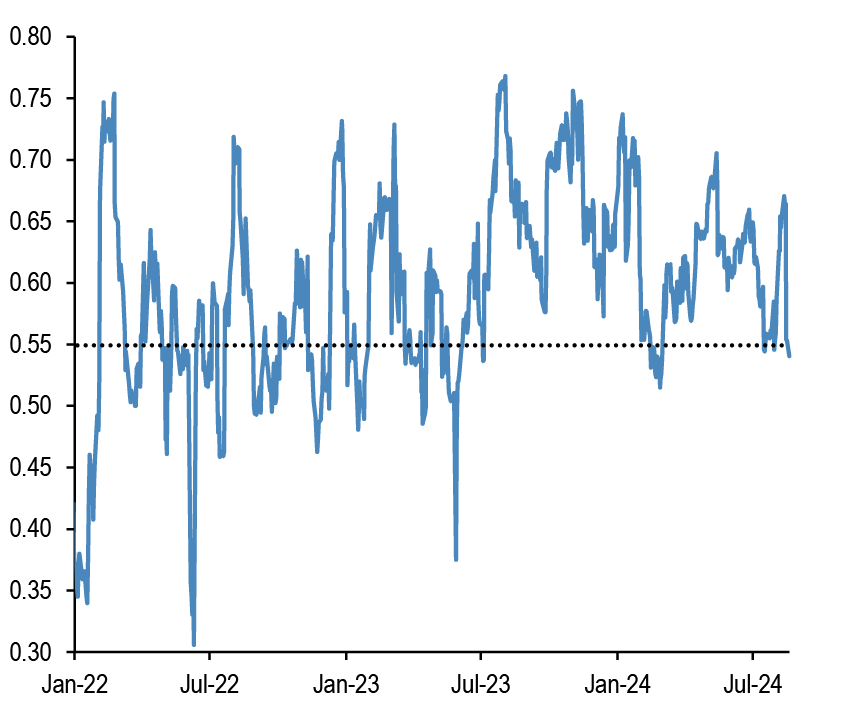
Chart A17: 21-day rolling beta of 20 biggest active Euro bond mutual fund managers with respect to the Euro Agg Bond Index
The dotted line shows the average beta since 2013.
Source: Bloomberg Finance L.P., J.P. Morgan.
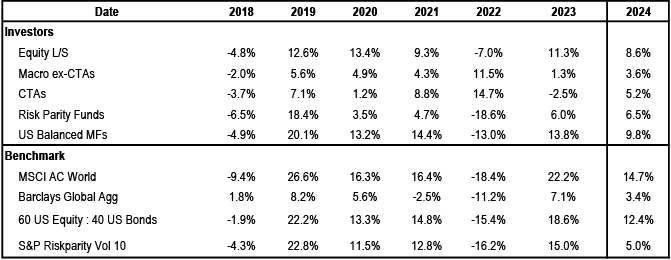
Chart A18: Performance of various type of investors
The table depicts the performance of various types of investors in % as of 13th August 2024.
Source: Bloomberg Finance L.P., HFR, Pivotal Path, J.P. Morgan.
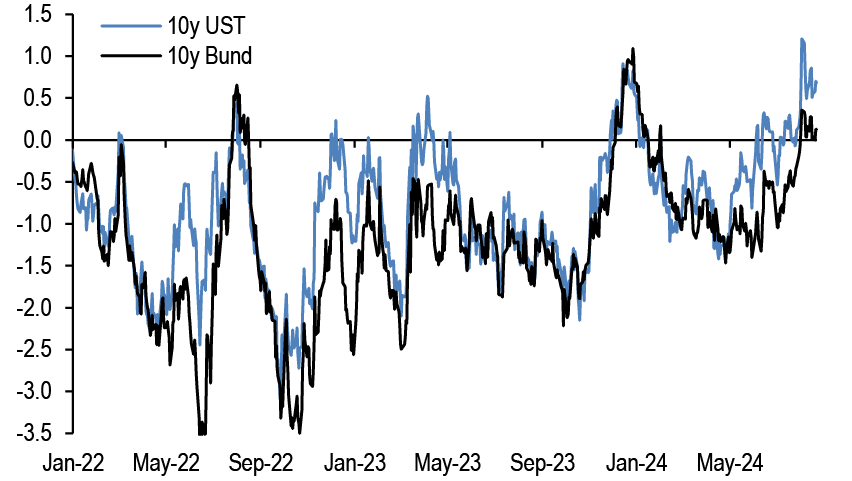
Chart A19: Momentum signals for 10Y UST and 10Y Bunds
Average z-score of Short- and Long-term momentum signal in our Trend Following Strategy framework shown in Tables A3 and A4 below in the Appendix
Source: Bloomberg Finance L.P., J.P. Morgan.
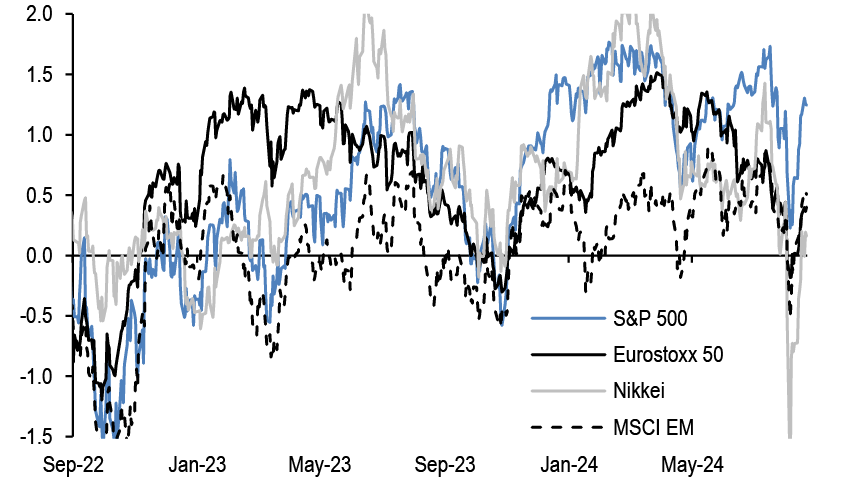
Chart A20: Momentum signals for S&P500
Average z-score of Short- and Long-term momentum signal in our Trend Following Strategy framework shown in Tables A3 and A4 below in the Appendix.
Source: Bloomberg Finance L.P., J.P. Morgan.
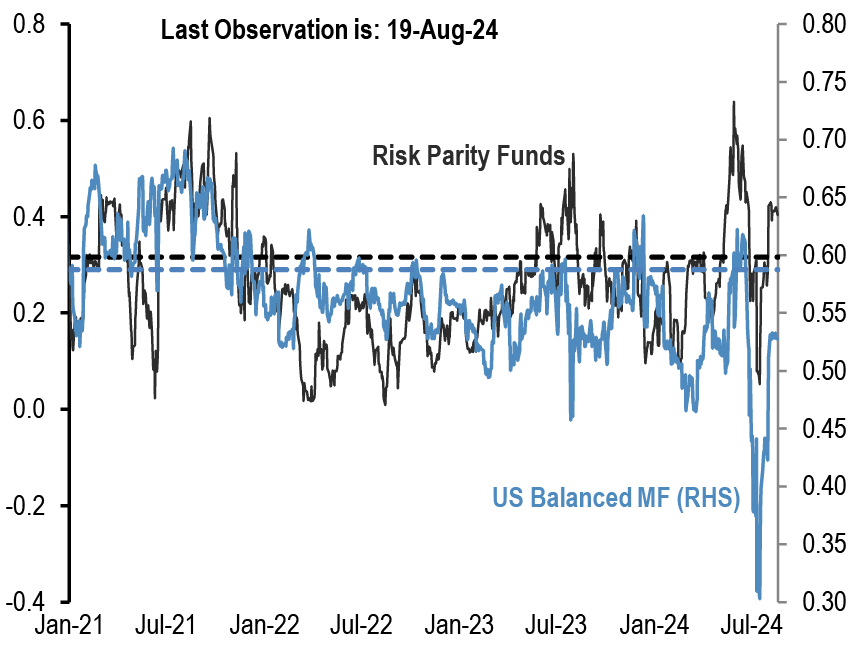
Chart A21: Equity beta of US Balanced Mutual funds and Risk Parity funds
Rolling 21-day equity beta based on a bivariate regression of the daily returns of our Balanced Mutual fund and Risk Parity fund return indices to the daily returns of the S&P 500 and BarCap US Agg indices. Given that these funds invest in both equities and bonds we believe that the bivariate regression will be more suitable for these funds. Our risk parity index consists of 25 daily reporting Risk Parity funds. Our Balanced Mutual fund index includes the top 20 US-based active funds by assets and that have existed since 2006. Our Balanced Mutual fund index has a total AUM of$700bn, which is around half of the total AUM of $1.5tr of US based Balanced funds which we believe to be a good proxy of the overall industry It excludes tracker funds and funds with a low tracking error. Dotted lines are average since 2015.
Source: Bloomberg Finance L.P., J.P. Morgan.
Chart A22: Equity beta of monthly reporting Equity Long/Short hedge funds
Proxied by the ratio of the monthly performance of Pivotal Path Asset-Weighted Equity Hedge fund index divided by the monthly performance of MSCI ACWorld Index.
Source: Bloomberg Finance L.P., Pivotal Path, J.P. Morgan
Chart A23: USD exposure of currency hedge funds
The net spec position in the USD as reported by the CFTC. Spec is the non-commercial category from the CFTC.
Source: CFTC, Barclay, Datastream, Bloomberg Finance L.P., J.P. Morgan.
CTAs – Trend following investors’ momentum indicators
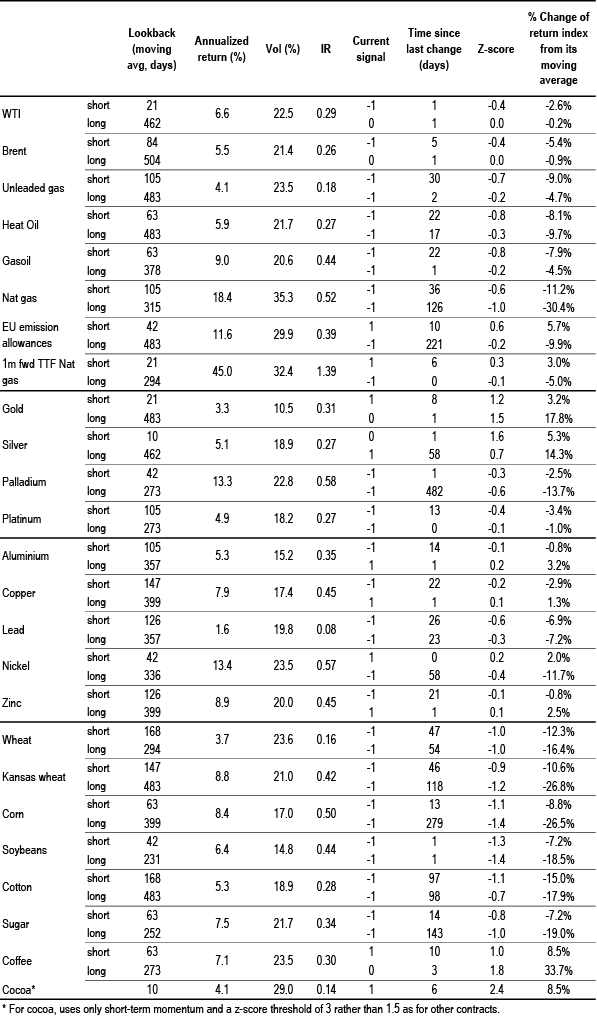
Table A3: Simple return momentum trading rules across various commodities
Optimal look-back period of each momentum strategy combined with a mean reversion indicator that turns signal neutral when momentum z-score more than 1.5 standard deviations above or below mean, and a filter that turns neutral when the z-score is low (below 0.05 and above -0.05) to avoid excessive trading. Look-backs, current signals and z-scores are shown for shorter-term and longer-term momentum separately, along with performance of a combined signal. Annualised return, volatility and information ratio of the signal; current signal; and z-score of the current return over the relevant look-back period; data from 1999 onward.
Source: Bloomberg Finance L.P., J.P. Morgan calculations.
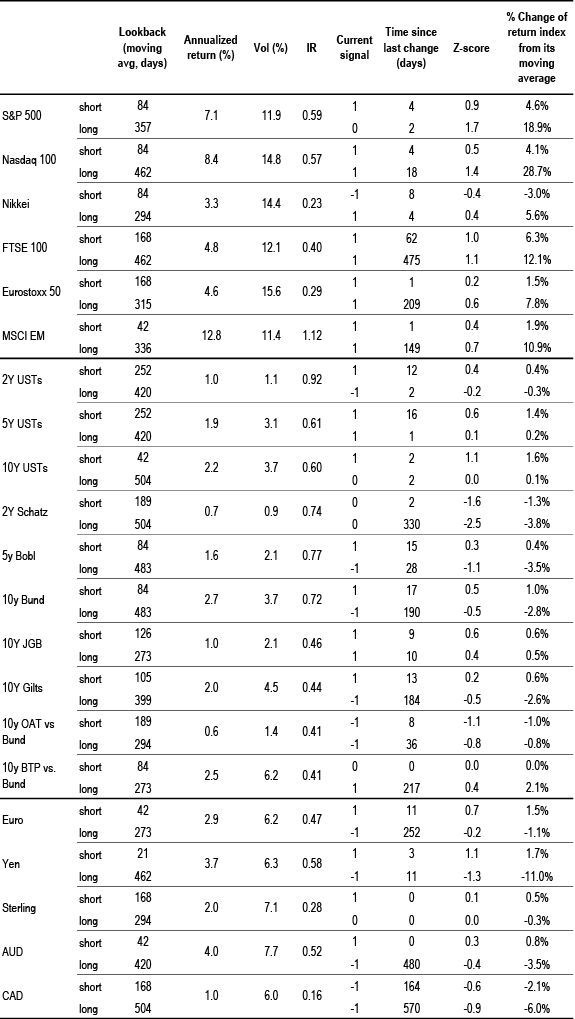
Table A4: Simple return momentum trading rules across international equity indices, bond futures and FX
Optimal look-back period of each momentum strategy combined with a mean reversion indicator that turns signal neutral when momentum z-score more than 1.5 standard deviations above or below mean, and a filter that turns neutral when the z-score is low (below 0.05 and above -0.05) to avoid excessive trading. Look-backs, current signals and z-scores are shown for shorter-term and longer-term momentum separately, along with performance of a combined signal. Annualised return, volatility and information ratio of the signal; current signal; and z-score of the current return over the relevant look-back period; data from 1999 onward.
Source: Bloomberg Finance L.P., J.P. Morgan calculations.
Corporate Activity
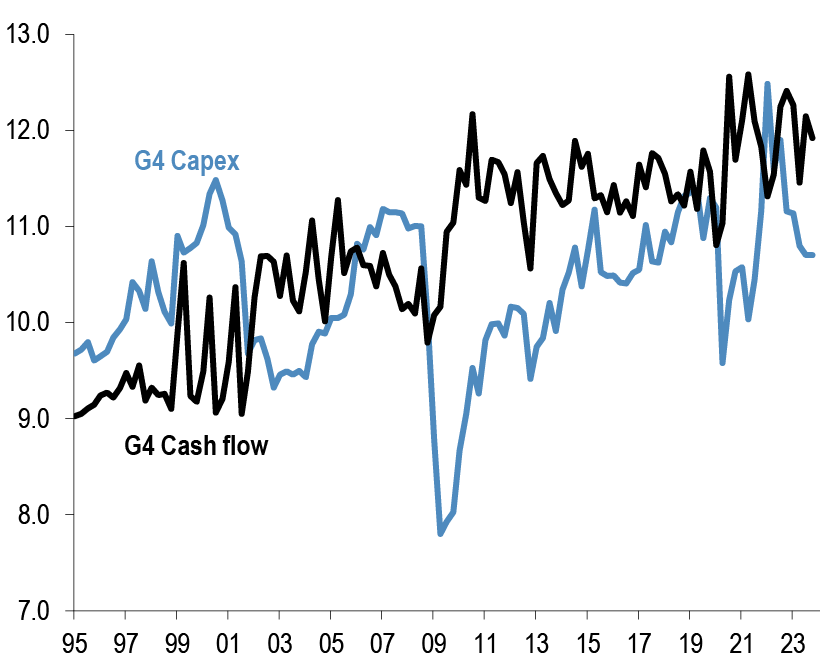
Chart A24: G4 non-financial corporate capex and cash flow as % of GDP
% of GDP, G4 includes the US, the UK, the Euro area and Japan. Last observation as of Q4 2023.
Source: ECB, BOJ, BOE, Federal Reserve flow of funds, J.P. Morgan.
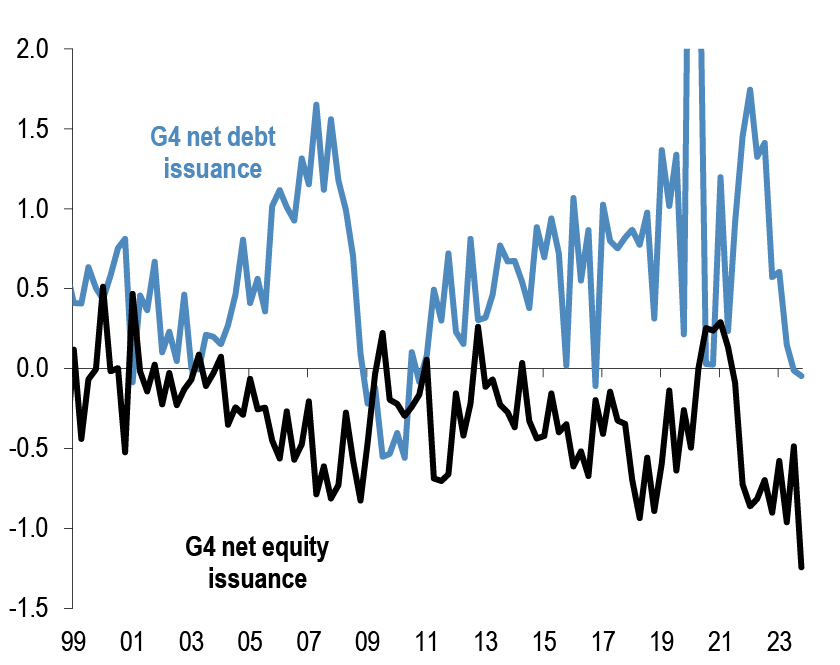
Chart A25: G4 non-financial corporate sector net debt and equity issuance
$tr per quarter, G4 includes the US, the UK, the Euro area and Japan. Last observation as of Q4 2023.
Source: ECB, BOJ, BOE, Federal Reserve flow of funds, J.P. Morgan.
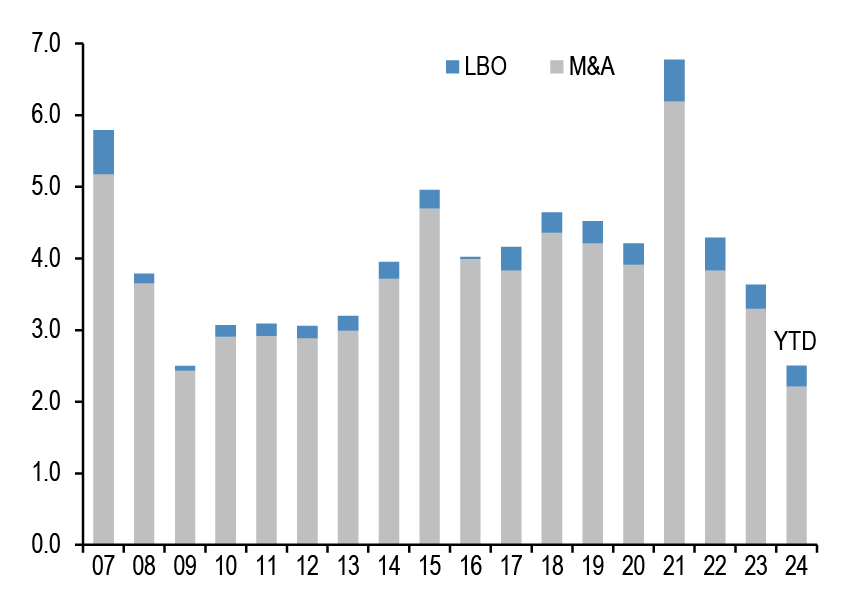
Chart A26: Global M&A and LBO
$tr. M&A and LBOs are announced.
Source: Dealogic, J.P. Morgan.
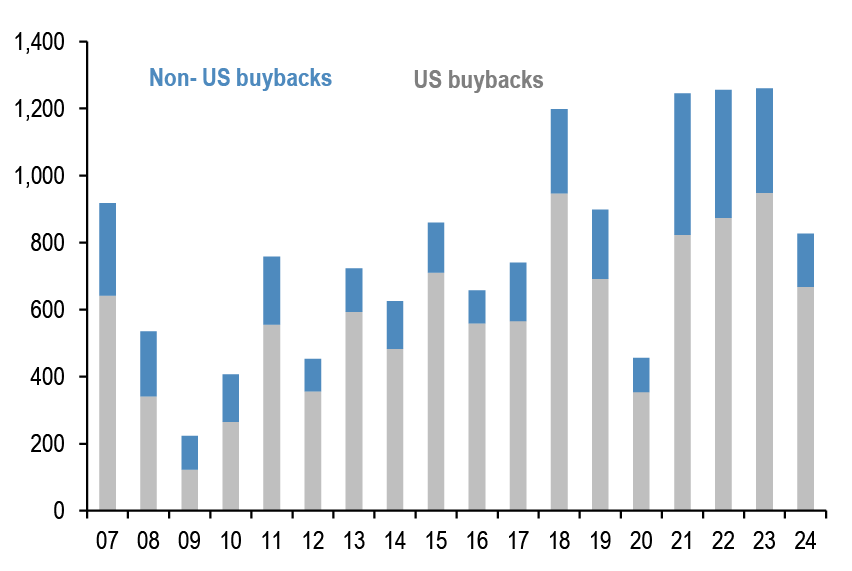
Chart A27: US and non-US share buyback
$bn, are as of August’24. Buybacks are announced.
Source: Bloomberg Finance L.P., Thomson Reuters, J.P. Morgan
Pension fund and insurance company flows
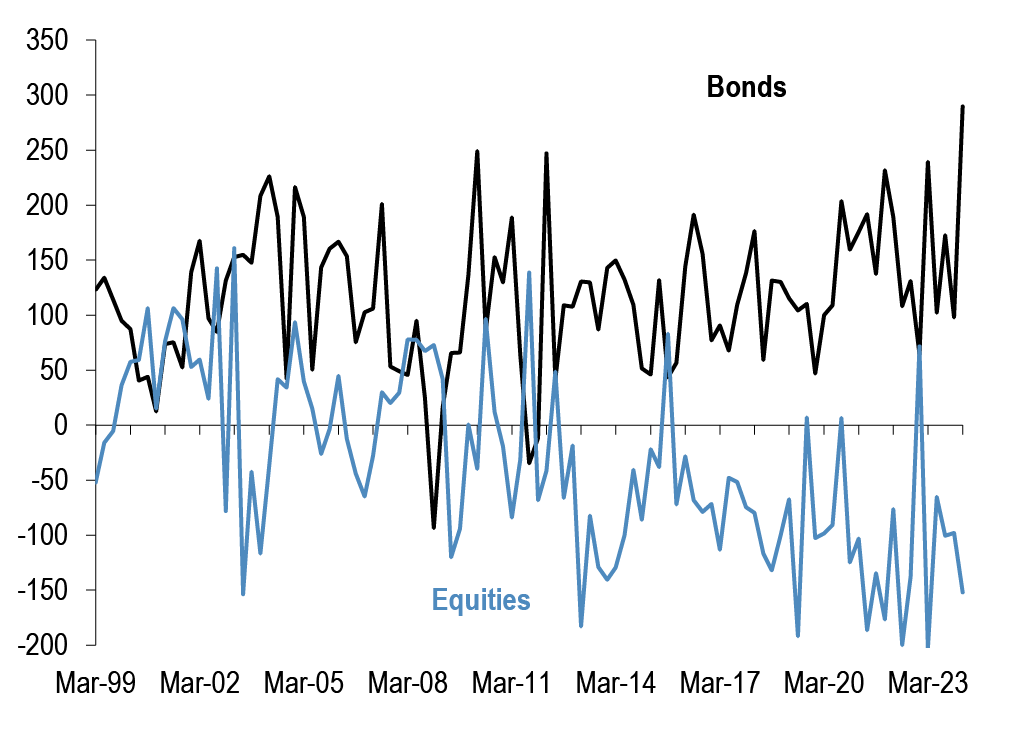
Chart A28: G4 pension funds and insurance companies equity and bond flows
Equity and bond buying in $bn per quarter. G4 includes the US, the UK,Euro area and Japan. Last observation is Q1 2024.
Source: ECB, BOJ, BOE, Federal Reserve flow of funds, J.P. Morgan.
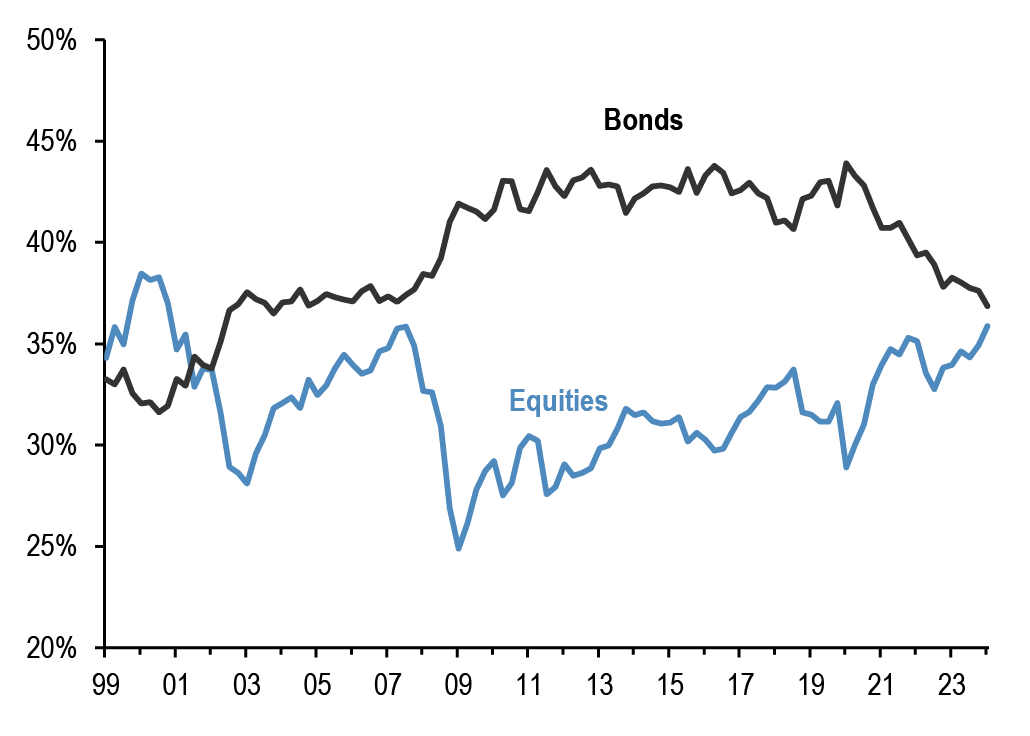
Chart A29: G4 pension funds and insurance companies equity and bond levels
Equity and bond as % of total assets per quarter. G4 includes the US, the UK, Euro area and Japan. Last observation is Q1 2024.
Source: ECB, BOJ, BOE, Federal Reserve flow of funds., J.P. Morgan
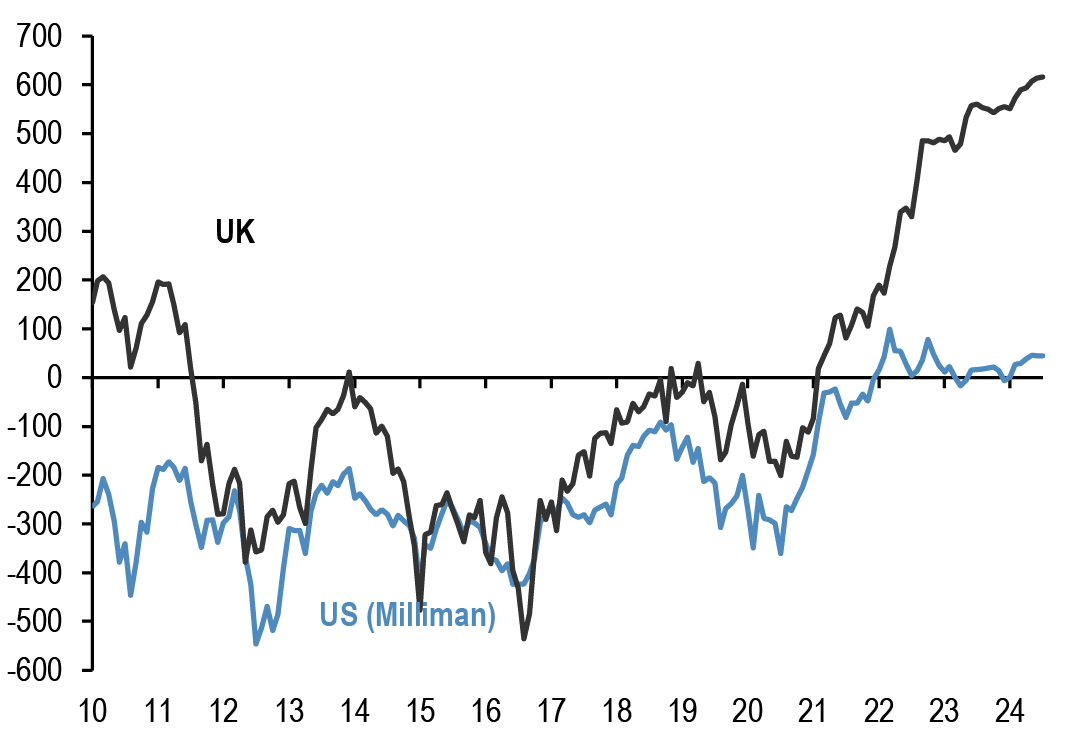
Chart A30: Pension fund deficits
US$bn. For US, funded status of the 100 largest corporate defined benefit pension plans, from Milliman. For UK, funded status of the defined benefit schemes eligible for entry to the Pension Protection Fund, converted to US$at today’s exchange rates.
Last obs. is July’24 for US & UK.
Source: Milliman, UK Pension Protection Fund, J.P. Morgan.
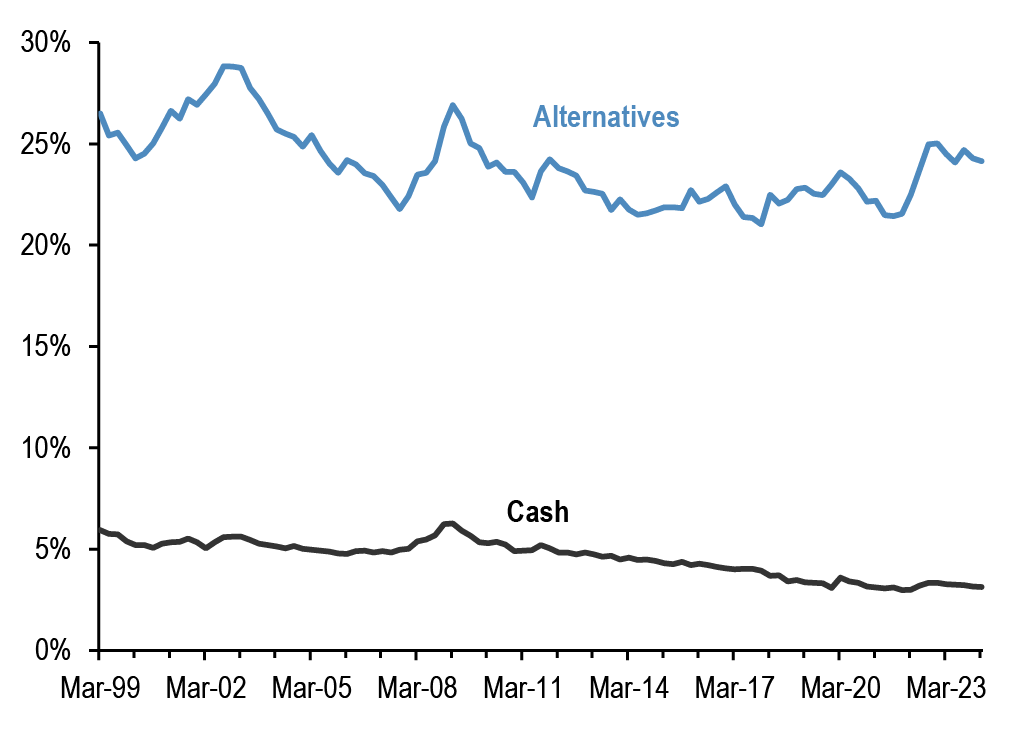
Chart A31: G4 pension funds and insurance companies cash and alternatives levels
Cash and alternative investments as % of total assets per quarter. G4 includes the US, the UK, Euro area and Japan. Last observation is Q1 2024.
Source: ECB, BOJ, BOE, Federal Reserve flow of funds, J.P. Morgan.
Credit Creation
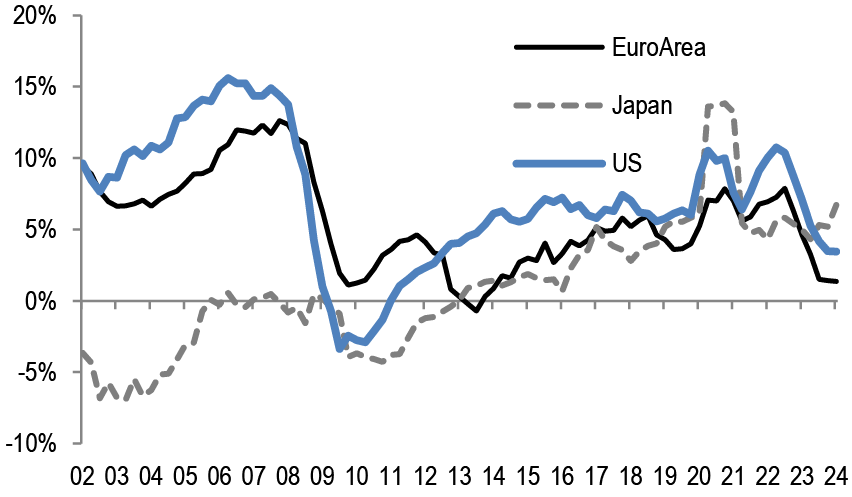
Chart A32: Credit creation in the US, Japan and Euro area
Rolling sum of 4-quarter credit creation as % of GDP. Credit creation includes both bank loans as well as net debt issuance by non-financial corporations and households. Last obs. is Q1’24 for Japan, Euro Area and US.
Source: Fed, ECB, BoJ, Bloomberg Finance L.P., and J.P. Morgan calculations.
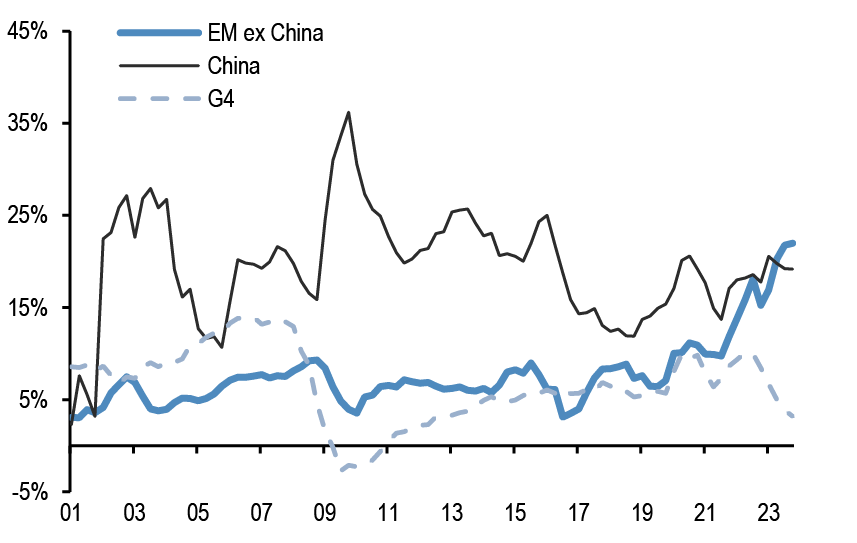
Chart A33: Credit creation in EM
Rolling sum of 4-quarter credit creation as % of GDP. Credit creation includes both bank loans as well as net debt issuance by non-financial corporations and households. Last obs. is for Q4’23.
Source: G4 Central banks FoF, BIS, ICI, Barcap, Bloomberg Finance L.P., IMF, and J.P.Morgan calculation
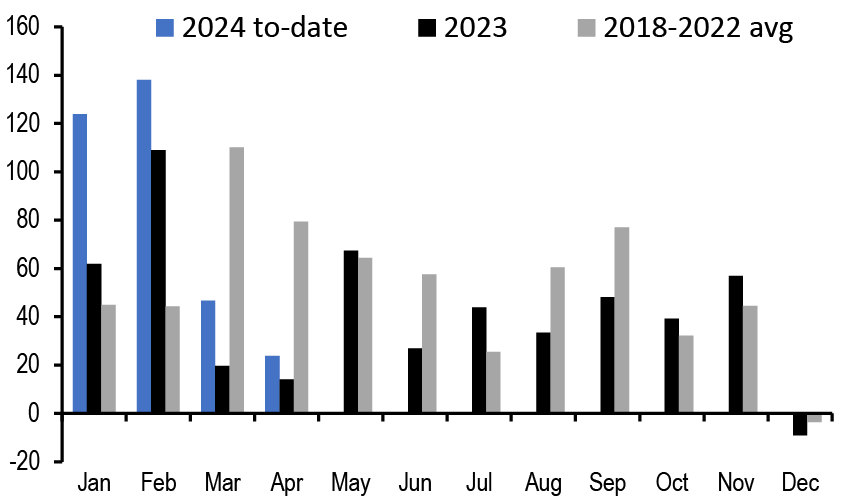
Chart A34: Monthly net issuance of US HG bonds
$bn. May 2024.
Source: Dealogic, J.P. Morgan
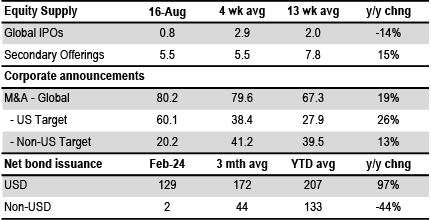
Table A5: Equity and Bond issuance
$bn, Equity supply and corporate announcements are based on announced deals, not completed. M&A is announced deal value and buybacks are announced transactions. Y/Y change is change in YTD announcements over the same period last year.
Source: Bloomberg Finance L.P., Dealogic, Thomson Reuters, J.P. Morgan.
Bitcoin monitor
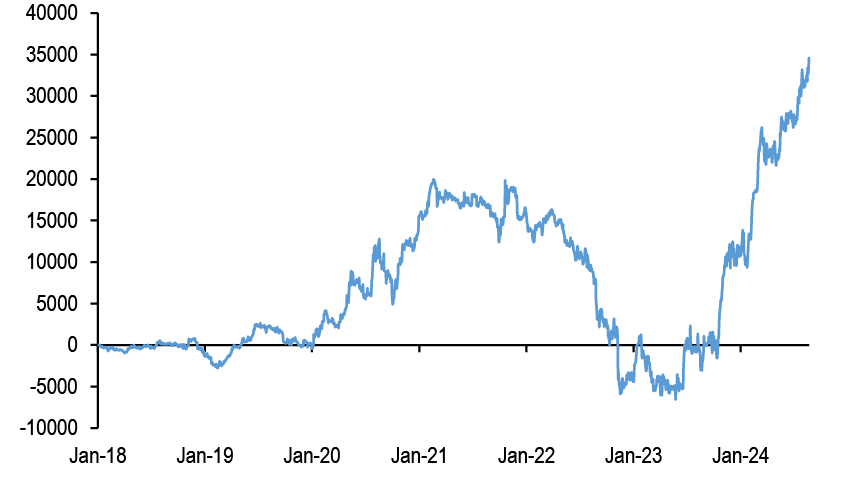
Chart A35: Our Bitcoin position proxy based on open interest in CME Bitcoin futures contracts
In number of contracts. Last obs. for 21st August 2024.
Source: Bloomberg Finance L.P., J.P. Morgan
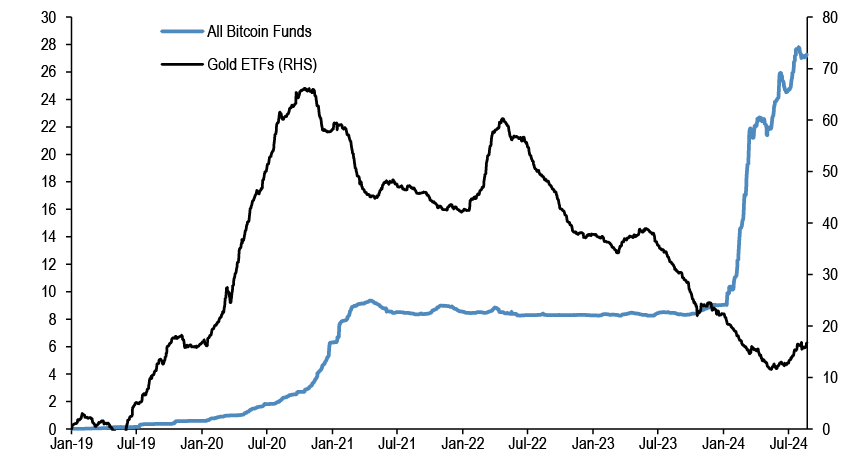
Chart A36: Cumulative Flows in all Bitcoin funds and Gold ETF holdings
Both the y-axis in $bn.
Source: Bloomberg Finance L.P., J.P. Morgan.
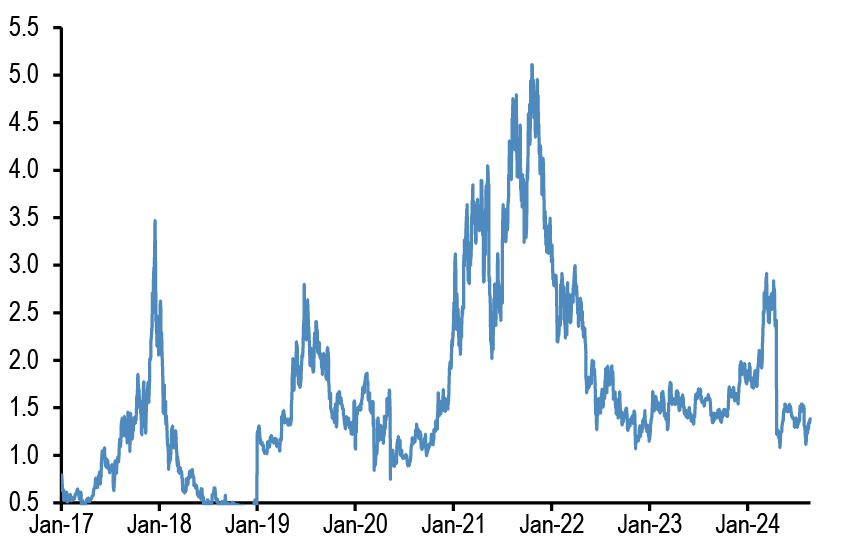
Chart A37: Ratio of bitcoin market price to production cost
Based on the cost of production approach following Hayes (2018).
Source: Bitinfocharts, J.P. Morgan
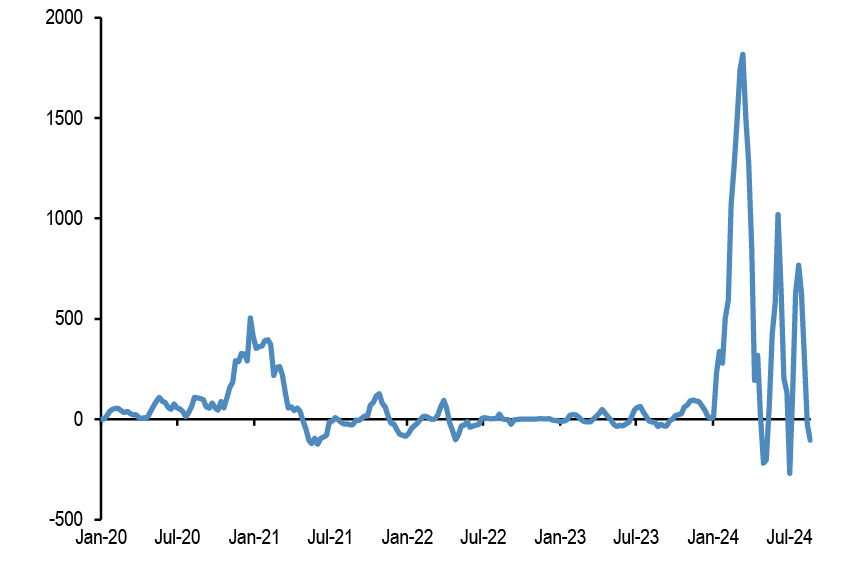
Chart A38: Flow pace into publicly-listed bitcoin funds including bitcoin ETFs
$mm per week, 4-week rolling average flow.
Source: Bloomberg Finance L.P., J.P. Morgan.
Japanese flows and positions
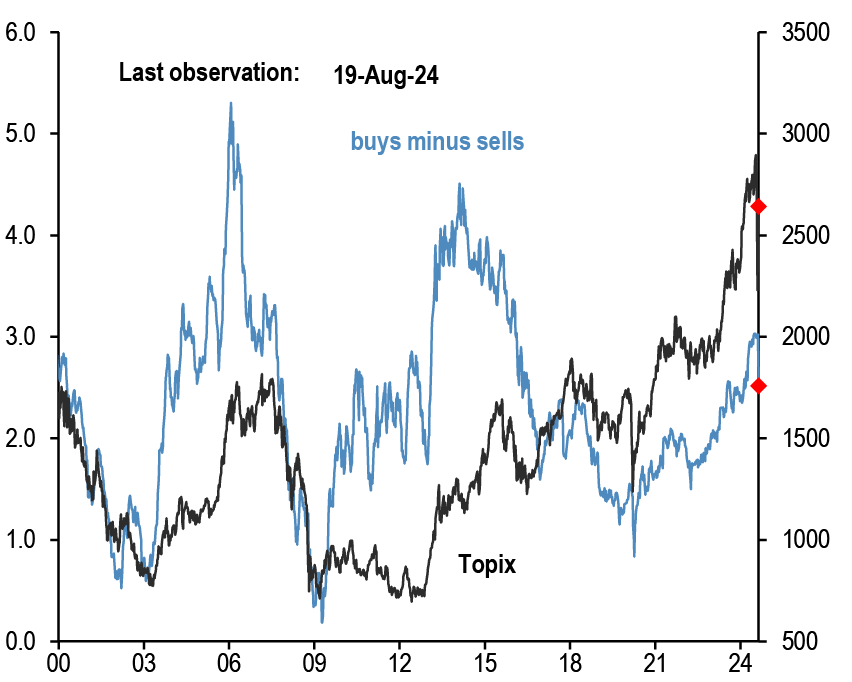
Chart A39: Tokyo Stock Exchange margin trading: total buys minus total sells
In bn of shares. Topix on right axis.
Source: Tokyo Stock Exchange, Bloomberg Finance L.P., J.P. Morgan.
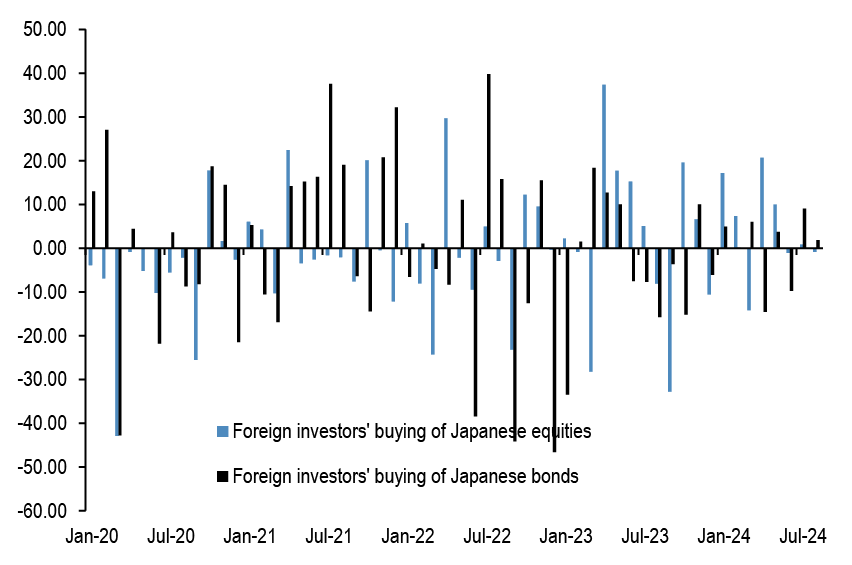
Chart A40: Monthly net purchases of Japanese bonds and Japanese equities by foreign residents
$bn, Last weekly obs. is for 9th Aug’ 24.
Source: Japan MoF, Bloomberg Finance L.P., and J.P. Morgan.
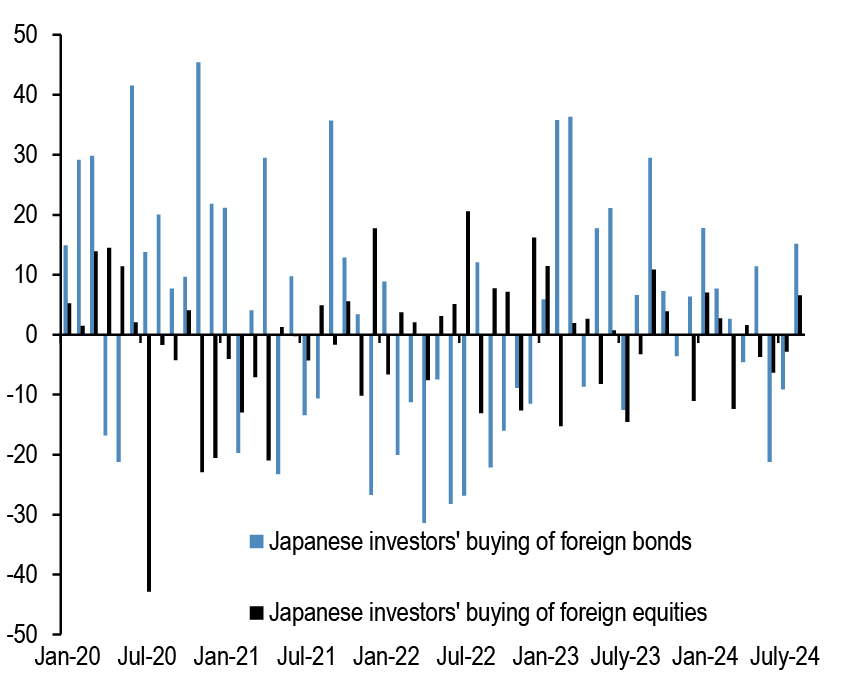
Chart A41: Monthly net purchases of foreign bonds and foreign equities by Japanese residents
$bn, Last weekly obs. is for 9th Aug’ 24.
Source: Japan MoF, Bloomberg Finance L.P., and J.P. Morgan.
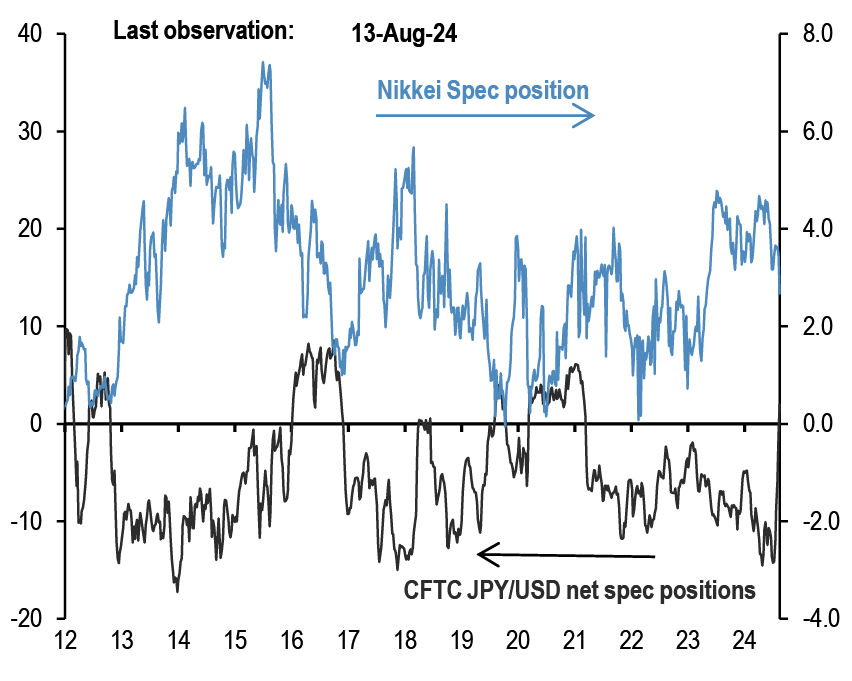
Chart A42: Overseas CFTC spec positions
CFTC spec positions are in $bn. For Nikkei we use CFTC positions in Nikkei futures (USD & JPY) by Leveraged funds and Asset managers.
Source: Bloomberg Finance L.P., CFTC, J.P. Morgan calculations.
Commodity flows and positions
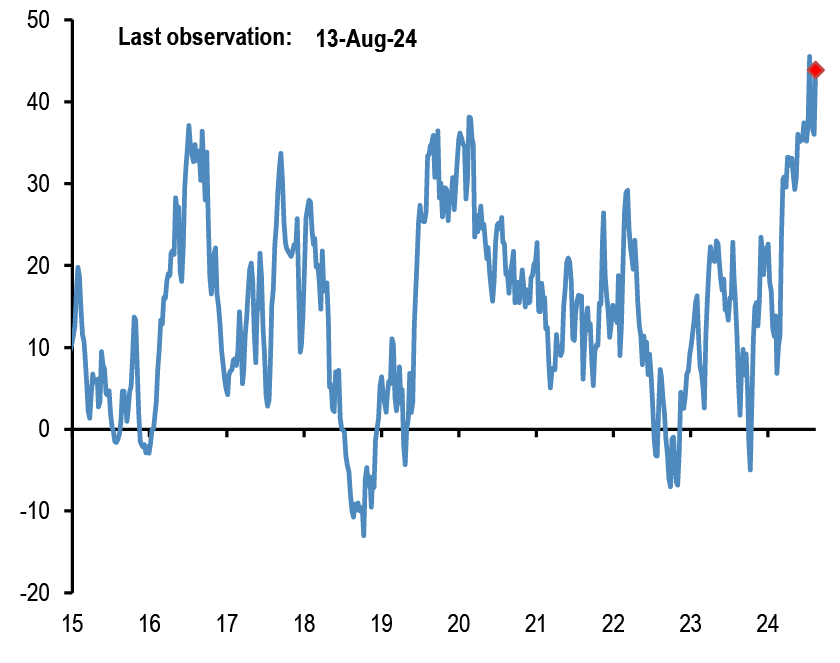
Chart A43: Gold spec positions
$bn. CFTC net long minus short position in futures for the Managed Money category.
Source: CFTC, Bloomberg Finance L.P., J.P. Morgan.
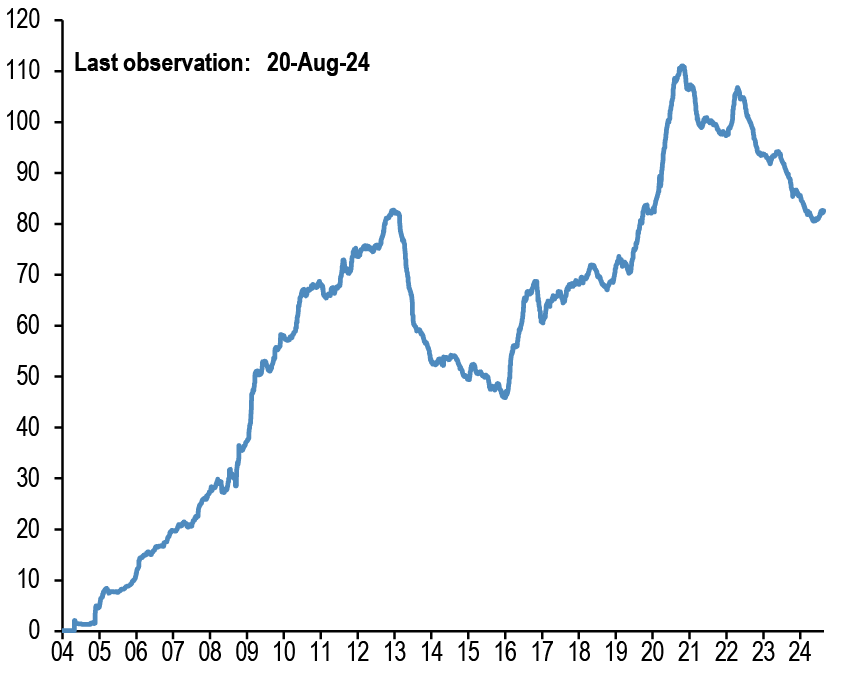
Chart A44: Gold ETFs
Mn troy oz. Physical gold held by all gold ETFs globally.
Source: Bloomberg Finance L.P., J.P. Morgan.
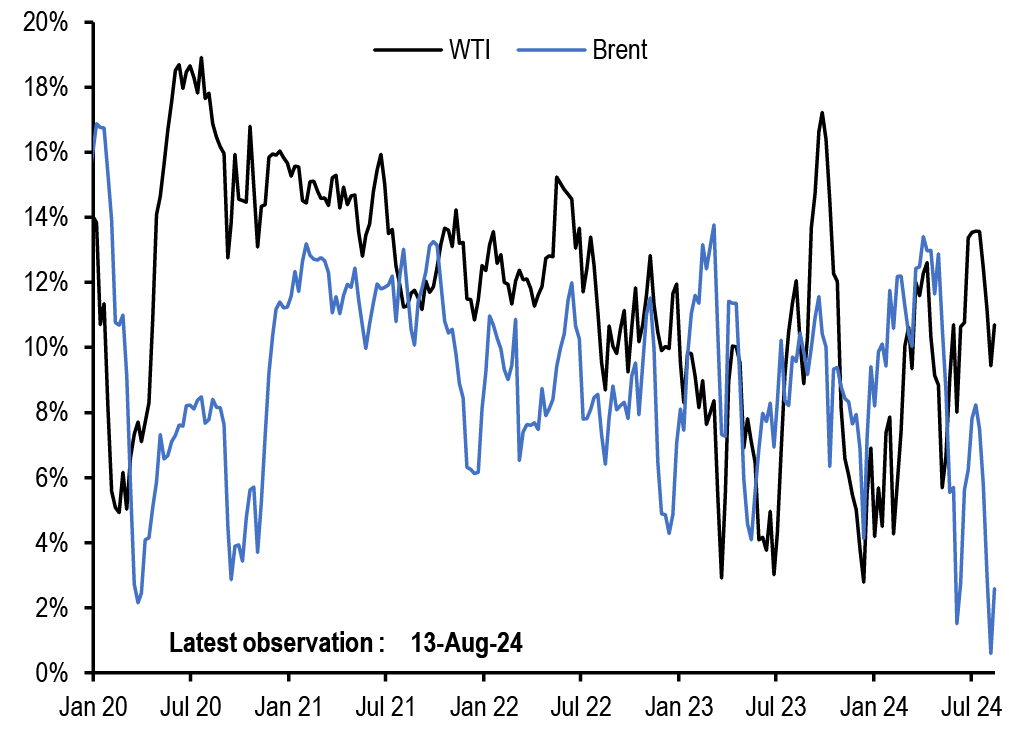
Chart A45: Oil spec positions
Net spec positions divided by open interest. CFTC futures positions for WTI and Brent are net long minus short for the Managed Money category.
Source: CFTC, Bloomberg Finance L.P., J.P. Morgan.
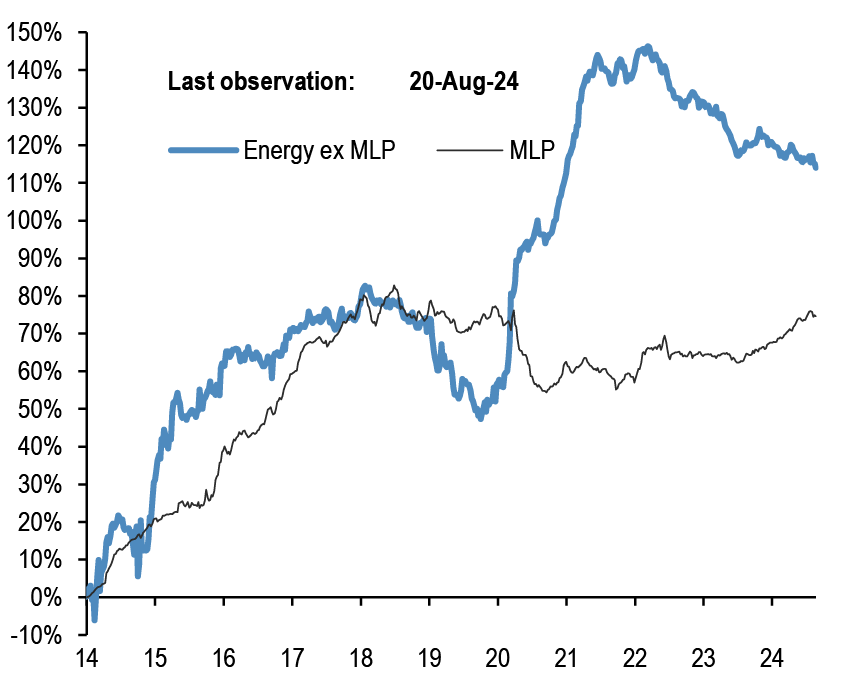
Chart A46: Energy ETF flows
Cumulative energy ETFs flow as a % of AUM. MLP refers to the Alerian MLP ETF.
Source: CFTC, Bloomberg Finance L.P., J.P. Morgan.
Corporate FX hedging proxies
Chart A47: Average beta of Eurostoxx 50 companies and Eurostoxx Mid-Cap to trade-weighted EUR
Rolling 26 weeks average betas based on a bivariate regression of the weekly returns of individual stocks in the Eurostoxx 50 index to the weekly returns of the MSCI AC World and JPM EUR Nominal broad effective exchange rate (NEER).
Source: Bloomberg Finance L.P., J.P. Morgan
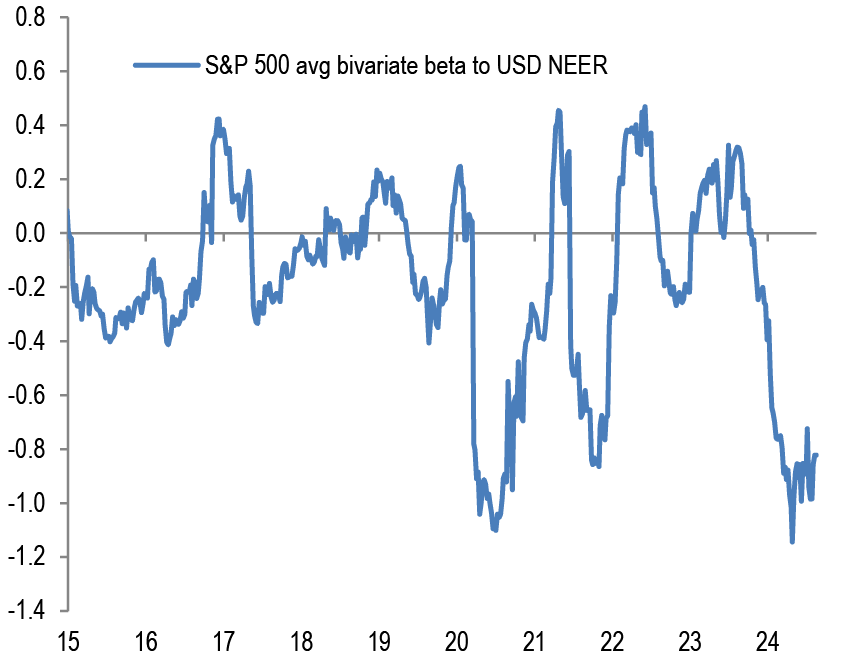
Chart A48: Average beta of S&P500 companies to trade-weighted US dollar
Rolling 26 weeks average betas based on a bivariate regression of the weekly returns of stocks in the S&P500 index to the weekly returns of the MSCI AC World and JPM USD Nominal broad effective exchange rate(NEER).
Source: Bloomberg Finance L.P., J.P. Morgan
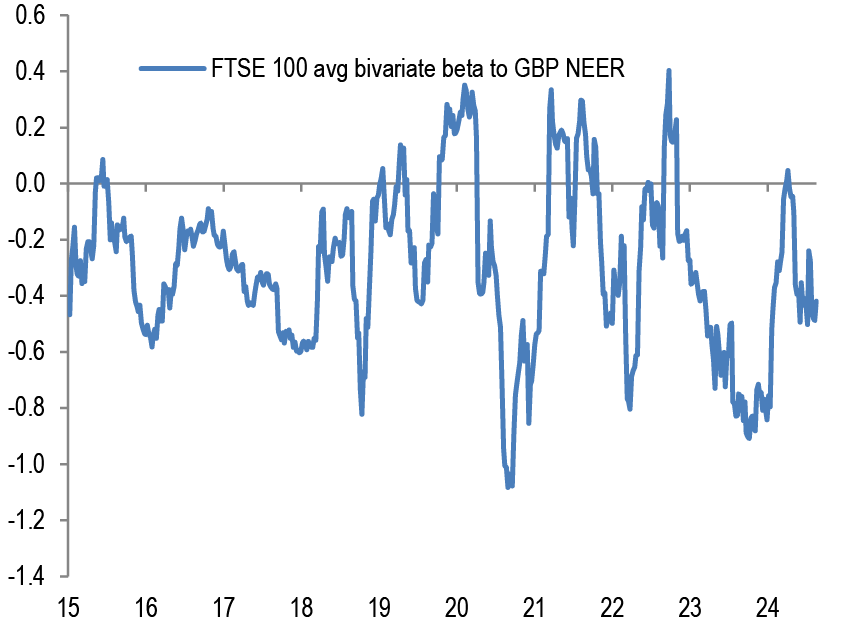
Chart A49: Average beta of FTSE 100 companies to trade-weighted GBP
Rolling 26 weeks average betas based on a bivariate regression of the weekly returns of individual stocks in the FTSE 100 index to the weekly returns of the MSCI AC World and JPM GBP Nominal broad effective exchange rate (NEER).
Source: Bloomberg Finance L.P., J.P. Morgan
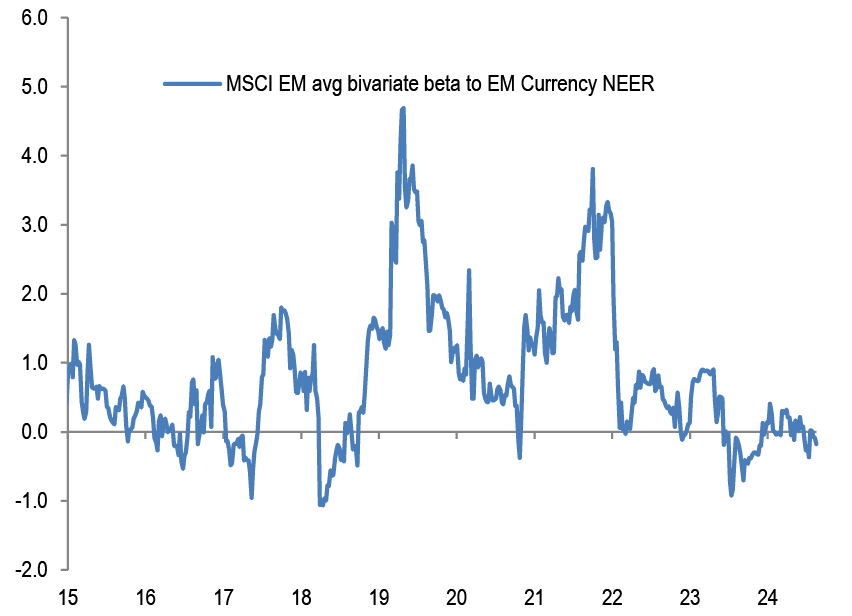
Chart A50: Average beta of MSCI EM companies to trade-weighted EM Currency Index
Rolling 26 weeks average betas based on a bivariate regression of the weekly returns of individual stocks in the MSCI EM index to the weekly returns of the MSCI AC World and JPM EM Nominal broad effective exchange rate (NEER).
Source: Bloomberg Finance L.P., J.P. Morgan
Non-Bank investors’ implied allocations
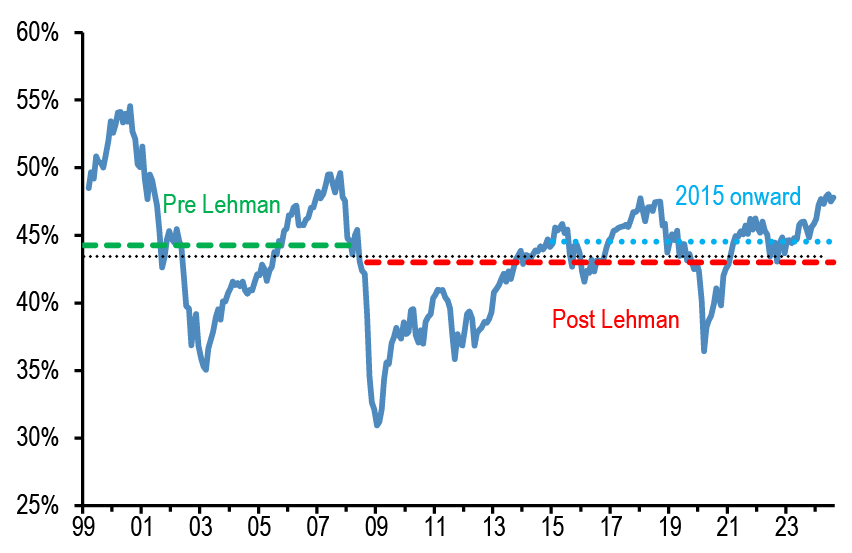
Chart A51: Implied equity allocation by non-bank investors globally
Global equities as % total holdings of equities/bonds/M2 by non-bank investors. Dotted lines are averages.
Source: Bloomberg Finance L.P., J.P. Morgan
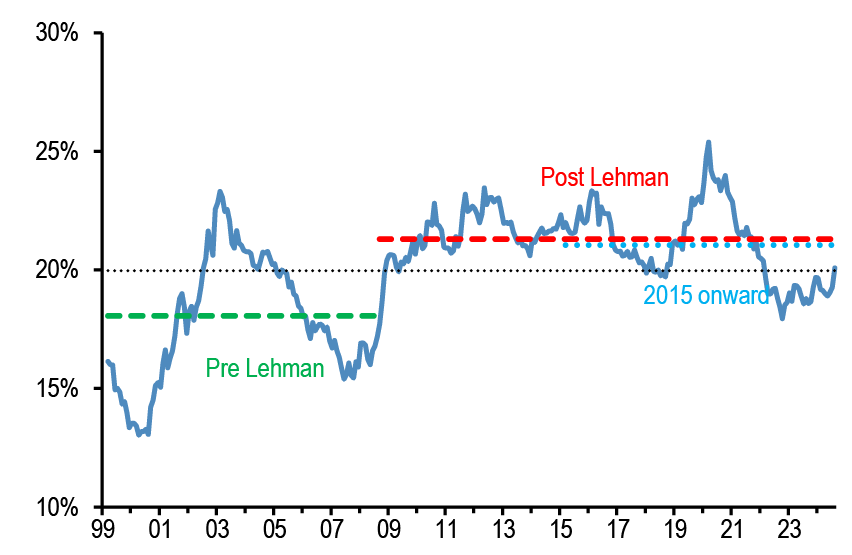
Chart A52: Implied bond allocation by non-bank investors globally
Global bonds as % total holdings of equities/bonds/M2 by non-bank investors. Dotted lines are averages.
Source: Bloomberg Finance L.P., J.P. Morgan
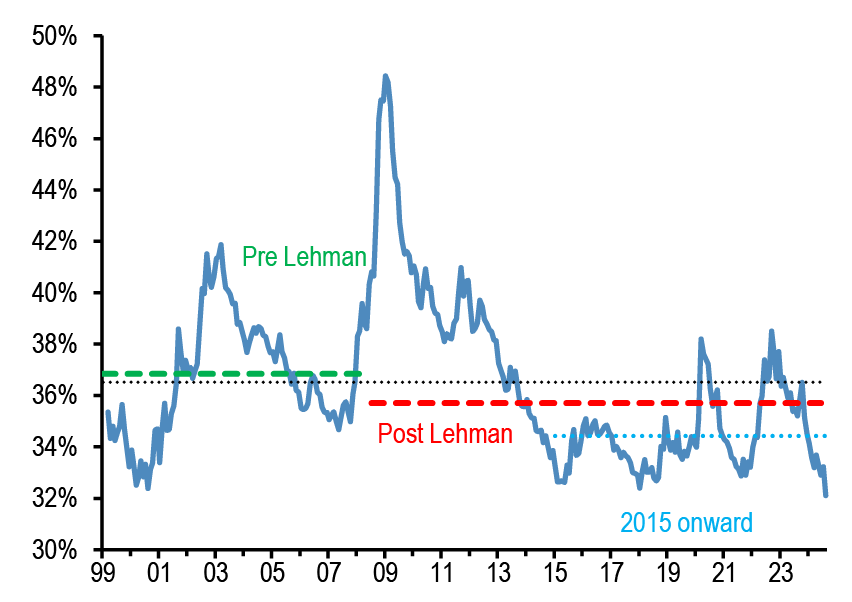
Chart A53: Implied cash allocation by non-bank investors globally
Global cash held by non-bank investors as % total holdings of equities/bonds/M2 by non-bank investors. Dotted lines are averages.
Source: Bloomberg Finance L.P., J.P. Morgan
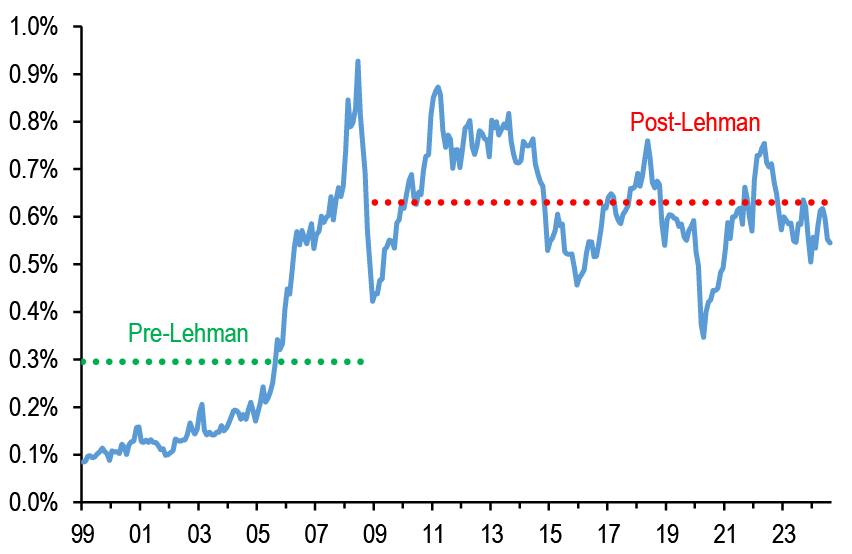
Chart A54: Implied commodity allocation by non-bank investors globally
Proxied by the open interest of commodity futures ex gold as % of the stock of equities, bonds and cash held by non-bank investors globally.
Source: Bloomberg Finance L.P., J.P. Morgan