
Equity Strategy
Should SPW and SX5E, which stalled since March, break out higher?
While SPX is at fresh highs, powered by a few stocks, both the equal weighted US equity index - SPW, as well as SX5E, have stalled since March…

…this consolidation beneath the surface is likely to continue through the summer, in our view, on softer growth, but at the same time on higher for longer Fed

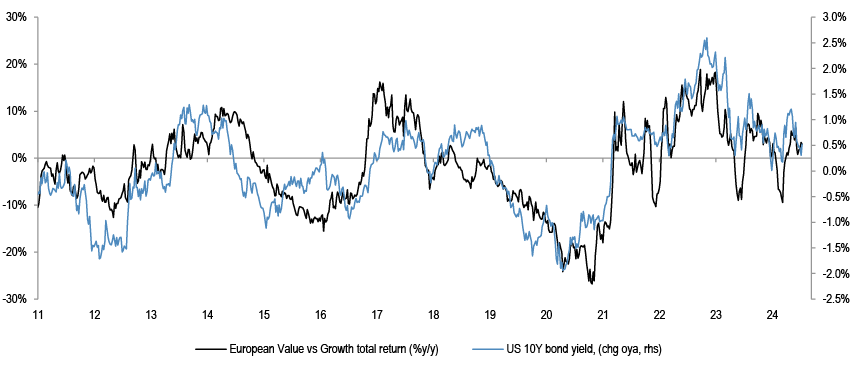
For Value to work, one nee ds rising bond yields for the right reasons, but we fear bond yields will move further lower
Source: Datastream, Bloomberg Finance L.P.
- While the S&P500 was powered again this year by Mag-7, the equal weighted index - SPW, is up a more modest 6%, having peaked in March. Likewise, SX5E has also peaked in March - top chart. Indeed, the historical spread between the performance of S&P500 and SPW is extreme. Given this, it is probable that the divergence peaks, but that could happen through winners stalling, and not through laggards rallying. Post the benign CPI print last week, SPW is bouncing again, but we fear the conditions for a sustained rally are not there, and look for the consolidation beneath the surface to continue through the summer.
- The peaks in SPW and in SX5E coincided with the worsening in Growth - Policy tradeoff - middle chart. Since March, Fed futures started to point to higher for longer rates, but at the same time the activity dataflow started to inflect lower, relative to the optimistic expectations. The more challenging macro tradeoff could stay with us.
- Consumer spending and labour markets are softening, while at the same time the PMI rebound that was in force earlier in the year stalled. On the other side, and in contrast to the start of the year, when the Fed was seen to be cutting quickly, frequently, and for the right reasons, such as falling inflation, the Fed could indeed commence the cuts from Sept, but not only due to falling inflation - softer labour markets could come into the mix. In a sense, the Fed has moved from pre-emptive cuts to reactive ones, and could fall behind the curve.
- The slowing growth is likely to impact earnings delivery in 2H. The expectations are rather punchy, at 13-15% yoy EPS growth rate in Q3 and Q4. This could be challenged by softer corporate pricing and slowing topline, on top of weakening activity, in particular from the consumer.
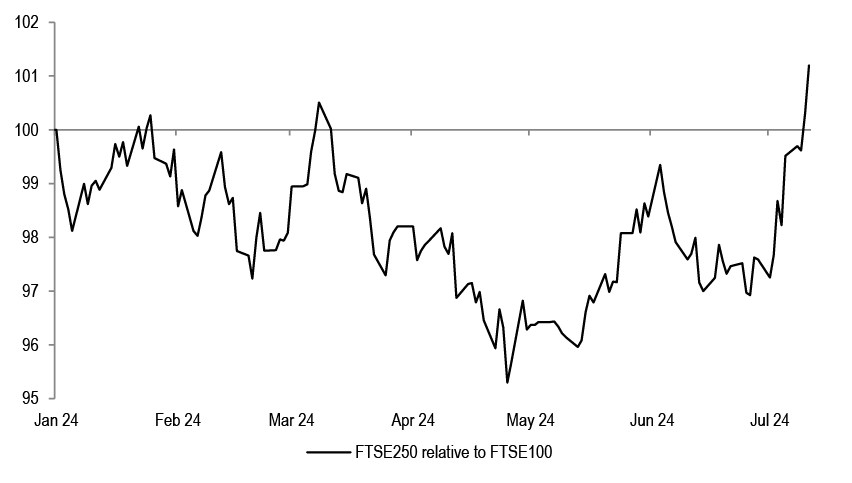
- In terms of positioning, we have been bullish on Growth over Value style, the same as we had through 2023, and we are not changing it just yet, even as the risk is that Growth style struggles from here, given extreme concentration. For the leadership to broaden, we think one needs to see a genuine reflationary push, with accelerating growth and with rising bond yields for the right reasons - bottom chart, but we appear to be having the opposite. Our view remains that bond yields will be lower, which favours Defensive positioning - we are in particular bullish on Utilities and Real Estate - see our April report. Within this, while small caps remain a poor performer in most places this year, the same as they were in 2023, we have last month argued to get more constructive on selected small caps, such as in the UK, and also in Eurozone. We note that FTSE250 is now starting to move ahead of FTSE100, after 2.5 years of significant weakness. A similar pattern could be seen in Eurozone.
- Regionally, we keep the view that it is too early to OW Eurozone vs the US - report, but given the meaningful lag, a good opportunity might present itself in 2H to buy Eurozone. For this to have traction, Growth style needs to stop leading, French politics needs to demonstrate stability over next months, and USD and tariffs should not become the headwinds.
When will the stalling in SPW and in SX5E, in force since March, change?
Figure 1: S&P500 and SPW - equal weighted SPX index

Source: Bloomberg Finance L.P.
The big 17% year to date gain for S&P500 masks the less punchy performance of the average stock within the index. The equal weighted S&P500 index is up 6% year to date, having peaked in March. In the past few days SPW is showing signs of life, on the benign inflation print, but the question is whether the rally can sustain.
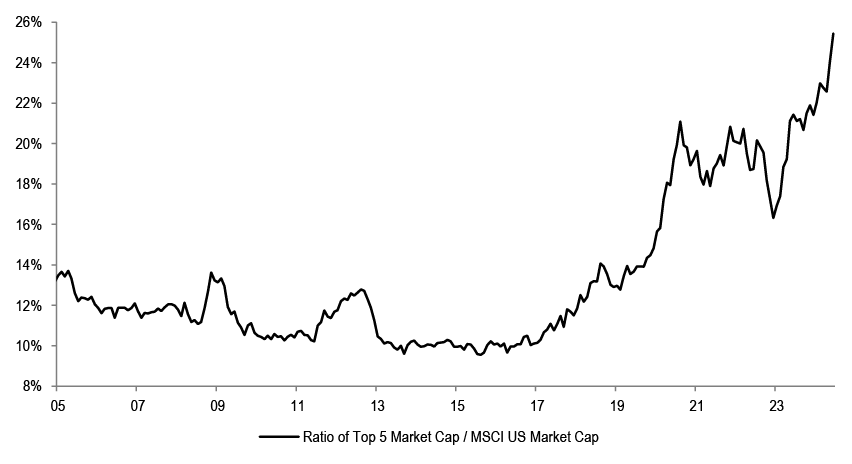
Market concentration is extreme, which calls for a reversal...
Figure 2: Market capitalization weight of top 5 stocks in MSCI US
Source: Datastream
It is the case that the US market has been getting more and more narrow for a while now. The bulk of the move higher in US equities has been driven by a handful of megacap stocks. The top 5 stocks by market cap in the US index represent almost a quarter of the total market capitalization of the index.
Figure 3: Ratio of S&P500 to Equal weighted S&P500 index - 10Y run up to 2000 Tech bubble peak and current

Source: Bloomberg Finance L.P.
Looking at the ratio of S&P500 to the equal weighted index - SPW over the past 10 years, and compared to the 10 years run-up to the 2000 bubble bursting, we are at similar extremes currently.
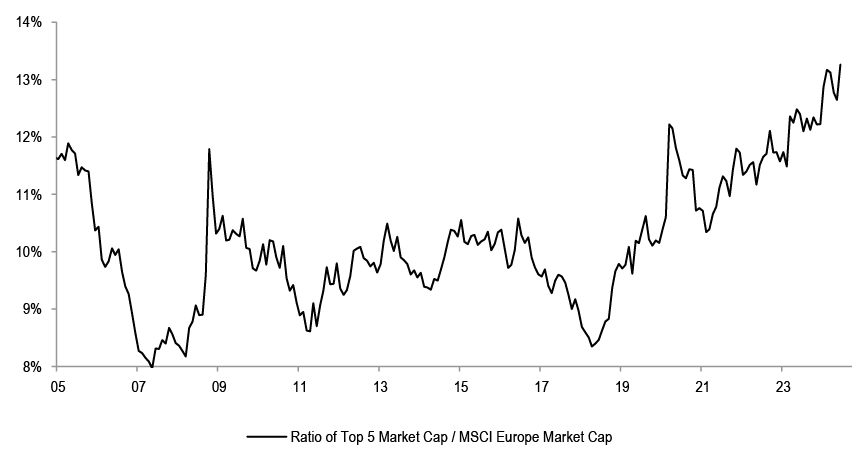
Figure 4: Market capitalization weight of top 5 stocks in MSCI Europe
Source: Datastream
European equities have also seen an increase in concentration, though not to the same extent as seen in the US.
...the reversal might not happen in a good way, with laggards rebounding… this is because the Growth - Policy trade-off has deteriorated again since Q1...
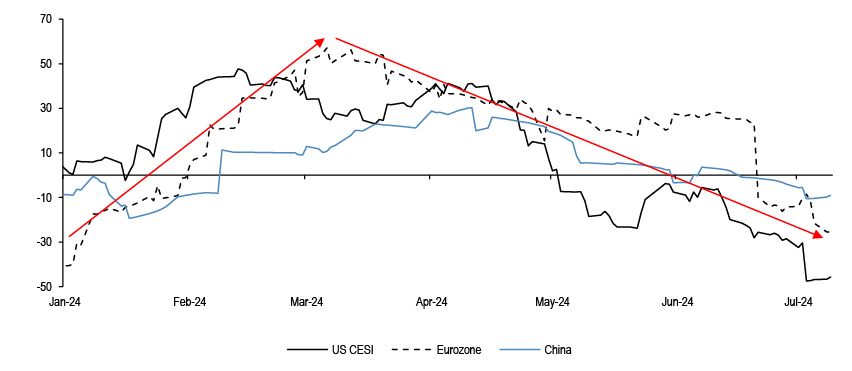
Figure 5: CESIs in key regions
Source: Bloomberg Finance L.P.
The extreme concentration suggests the leaders might stall, but in order for the laggards to rally, we think one needs to see a genuine reflation in the background, which is underpinned by strengthening growth. We are seeing the opposite right now, after accelerating early in the year, economic surprise indices have moved into negative territory across key regions in the past months.
Figure 6: US CESI and Fed policy rate expectations

Source: Bloomberg Finance L.P.
The March peaks in both SPW and in SX5E coincided with the weakening activity, but at the same time with Fed cuts being pushed out.
Figure 7: US ISM Manufacturing and Eurozone Manufacturing PMI

Source: Bloomberg Finance L.P.
We think this stalling could have legs. The PMI rebound that was seen at the turn of the year in manufacturing and in Europe appears to have stopped.
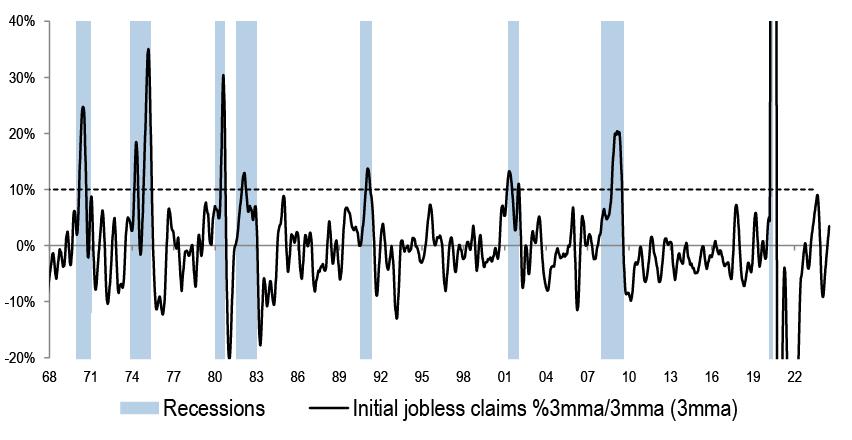
Figure 8: US jobless claims and recessions
Source: Bloomberg Finance L.P.
Labour market was rock solid until now, but there are some indications of softening. Claims have been steadily climbing higher.
Figure 9: US unemployment rate and recessions

Source: Bloomberg Finance L.P.
The unemployment rate has made a turn.
Figure 10: US Quits rate vs Atlanta Fed wage tracker

Source: Bloomberg Finance L.P.
Weaker wage growth ahead is likely, which could be a headwind for the consumer spend.
Figure 11: US Savings rate

Source: Bloomberg Finance L.P.
US savings rate is below trend.
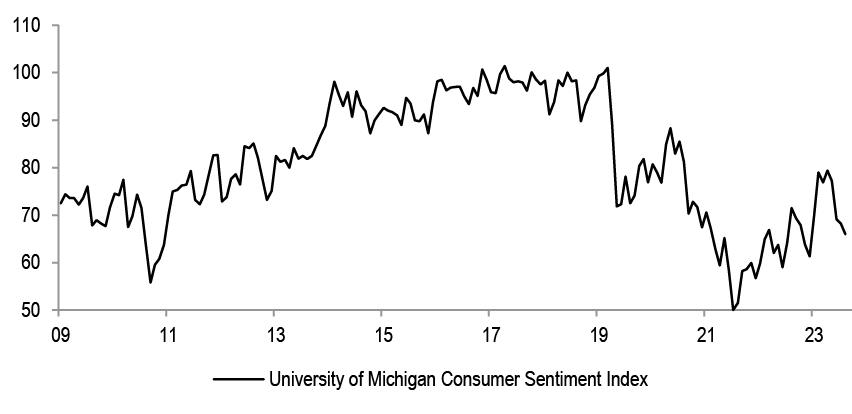
Figure 12: University of Michigan Consumer Sentiment index
Source: Bloomberg Finance L.P.
Consumer sentiment has been weakening as well.
Figure 13: US Retail sales control group

Source: Bloomberg Finance L.P.
Retail sales have been softening for a while now, and the number of recent corporate profit warnings in consumer space suggests this could continue.
Figure 14: Real Fed Policy rate minus Holston Laubach Williams Natural Rate of interest

Source: Bloomberg Finance L.P., Holston Laubach Williams Natural Rate is the real short-term interest rate expected to prevail when an economy is at full strength and inflation is stable
Even if Fed starts cutting in November, as JPM expects, we expect interest rates will remain well above the neutral rate, i.e. monetary policy could remain restrictive for the foreseeable future.
...earnings hurdle rate for 2H is too high if activity continues to slow
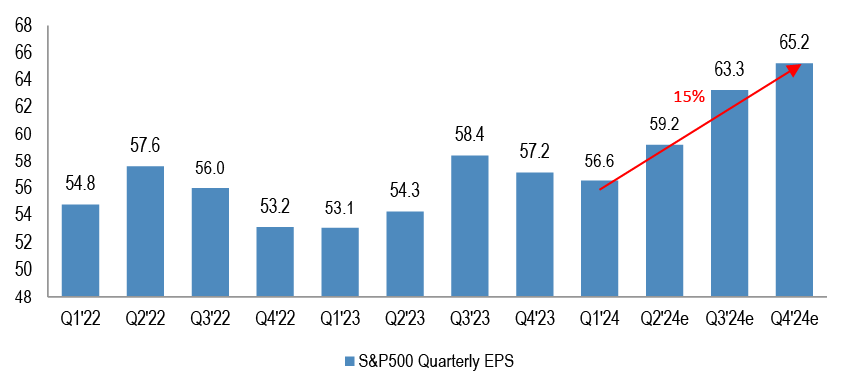
Figure 15: S&P500 quarterly EPS, with projections for the rest of the year
Source: Thomson Reuters
S&P500 earnings are projected to increase sequentially every quarter this year. Q4 EPS is forecast to be 15% above Q1.
Table 1: S&P500 historical quarterly earnings: Q4 vs Q1 move
| 1Q | 2Q | 3Q | 4Q | 4Q vs 1Q | |
| 2010 | 19.7 | 21.5 | 21.8 | 22.6 | 14% |
| 2011 | 23.5 | 24.1 | 25.7 | 24.6 | 4% |
| 2012 | 25.6 | 25.8 | 26.0 | 26.3 | 3% |
| 2013 | 26.7 | 27.4 | 27.6 | 28.6 | 7% |
| 2014 | 28.2 | 30.1 | 30.0 | 30.5 | 8% |
| 2015 | 28.6 | 30.1 | 30.0 | 29.5 | 3% |
| 2016 | 27.0 | 29.6 | 31.2 | 31.3 | 16% |
| 2017 | 30.9 | 32.6 | 33.5 | 36.0 | 17% |
| 2018 | 38.1 | 41.0 | 42.7 | 41.2 | 8% |
| 2019 | 39.2 | 41.3 | 42.1 | 42.0 | 7% |
| 2020 | 33.1 | 28.0 | 38.7 | 42.6 | 29% |
| 2021 | 49.1 | 52.6 | 53.7 | 54.0 | 10% |
| 2022 | 54.8 | 57.6 | 56.0 | 53.2 | -3% |
| 2023 | 53.1 | 54.3 | 58.4 | 57.2 | 8% |
| 2024e | 56.6 | 59.2 | 63.3 | 65.2 | 15% |
| Average | 10% | ||||
| Median | 8% |
Source: Thomson Reuters
This is well above the 8% median growth seen historically for Q4 EPS compared to Q1.
Figure 16: US Real GDP growth forecasts - JPM

Source: J.P. Morgan
This is also at odds with the projected slowdown in growth momentum in the US in 2H of this year. We believe corporate profitability is likely to come under pressure as topline growth weakens and margins soften on account of weaker pricing.
We reiterate our preference for Growth over Value, for now...
Figure 17: US and European Growth vs Value ytd

Source: Datastream
We have been OW Growth vs Value again this year, the same as through 2023, and, despite the extreme concentration risk, expect the trade to keep working, for now.
Figure 18: MSCI Europe Value vs Growth and US 10Y bond yields

Source: Datastream
The performance of Value factor is very much dependent on the direction of bond yields, Value needs rising bond yields for the right reasons to work. We believe bond yields are likely to keep moving lower as the Fed starts easing and / or growth continues to moderate.
...and for Defensives over Cyclicals
Figure 19: Stoxx 600 Real Estate price relative and German bond yield

Source: Bloomberg Finance L.P.
We have in early April argued to add to bond proxies, Utilities and Real Estate, on a likely move lower in bond yields.
Figure 20: MSCI Europe sectors’ performance last 3 months

Source: Datastream
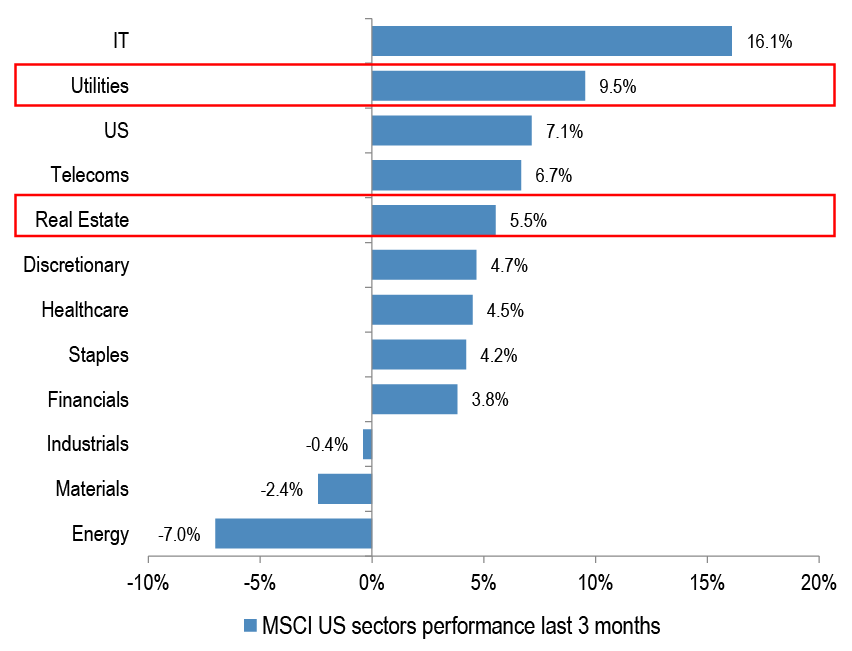
In the last 3 months there has been some turn in performance, with those two sectors picking up in the rankings. We think this will continue.
Figure 21: MSCI US sectors’ performance last 3 months
Source: Datastream
The same is visible in the US.
Figure 22: MSCI World Defensives relative and US 10Y bond yields

Source: Datastream
More broadly, if the last 3-4 years of a move higher in bond yields turns, then traditional Defensive sectors are likely to see an improvement, as well.
Figure 23: Cyclicals vs Defensives 12m Fwd. P/E relative

Source: Datastream
Some of the Defensive sectors have derated significantly, and offer an attractive entry point, in our view.
Figure 24: Stoxx 600 Cyclicals minus Defensives median earnings growth, %y/y

Source: J.P. Morgan
We also note that Cyclical sectors’ relative earnings momentum is starting to deteriorate versus Defensives.
Selected Small Cap stocks could trade better versus Large caps in 2H
Table 2: Small caps vs large caps – YTD performance
| YTD performance | ||
| MSCI US | Small Caps | 1.1% |
| Large Caps | 17.6% | |
| MSCI Eurozone | Small Caps | 1.7% |
| Large Caps | 7.9% | |
| MSCI UK | Small Caps | 5.3% |
| Large Caps | 5.7% | |
| MSCI Japan | Small Caps | 12.6% |
| Large Caps | 25.3% |
Source: Datastream
Small caps had another poor start to the year, on the back of underperformance in the past 2 years. They are back to the lows in the US, and we are not changing our UW there. Having said that, we have last month closed our long-standing UW on European and UK small caps, given the big underperformance, cheap valuations, improving domestic activity momentum and the start of the easing cycle in Europe.
Figure 25: FTSE250 relative to FTSE100 ytd
Source: Datastream
UK small caps in particular have responded positively to the recent political changes.
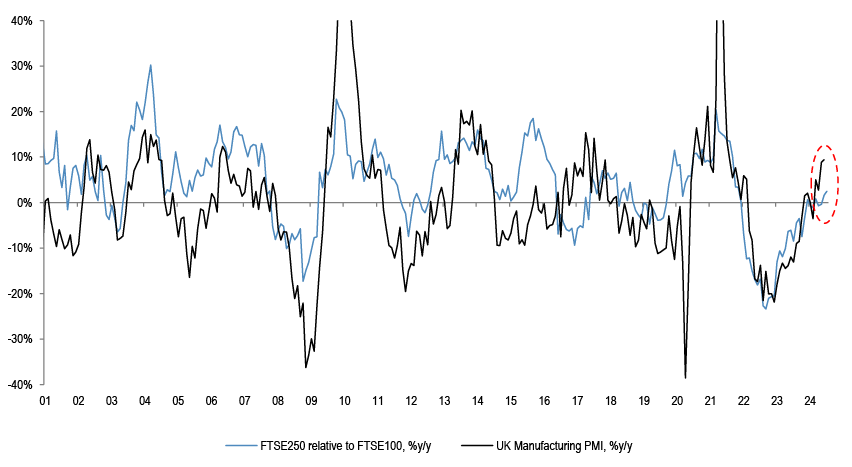
Figure 26: FTSE250 relative to FTSE100 and UK Manufacturing PMI
Source: Datastream, J.P. Morgan
They are also more sensitive to the domestic economic outlook and should trade better as PMIs stabilize.
Figure 27: MSCI UK Small vs large cap performance around BoE first cut

Source: Datastream
The start of the rate cut cycle has historically coincided with better performance of small caps over large caps.
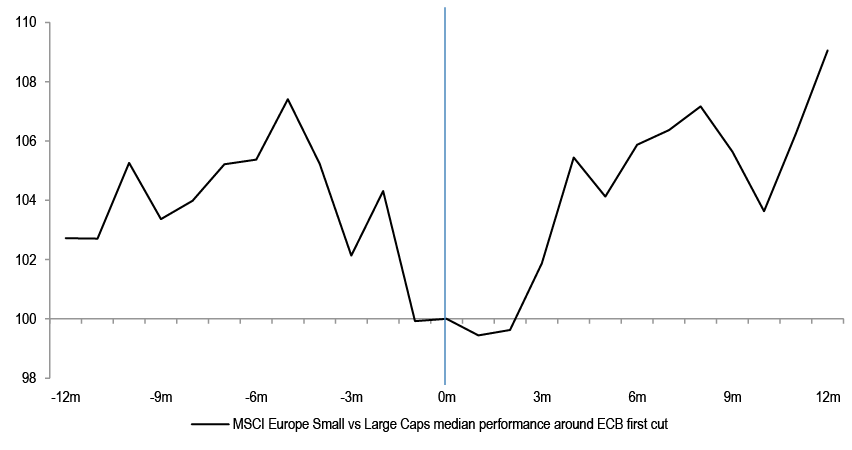
Figure 28: MSCI Europe Small vs large cap performance around ECB first cut
Source: Datastream
Similarly, European small caps also outperform post the start of the rate cut cycle.
Figure 29: MSCI Eurozone Small vs Large Caps and Manufacturing PMI

Source: Datastream, J.P. Morgan
PMIs also suggest that small caps in Eurozone could be supported.
Regionally, we still believe it is too early to go OW Eurozone vs the US…
Figure 30: MSCI Eurozone relative performance to MSCI US ($)

Source: Datastream
In Q1, we closed our UW Eurozone vs the US call that we had held since May ‘23. Key considerations at the time included cheaper valuations, stabilizing China economy and start of the ECB easing cycle ahead of any Fed move.
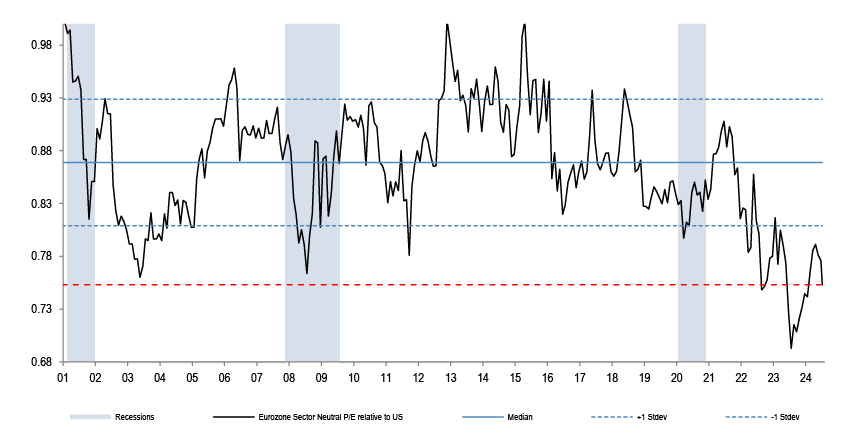
Figure 31: Eurozone sector neutral P/E relative to US
Source: Datastream
Despite the recent weakness following the French election triggered volatility, we do not think one needs to go outright long Eurozone versus the US just yet. We acknowledge that valuations do look attractive; however, we believe there could be a better entry point for the trade in the coming months.
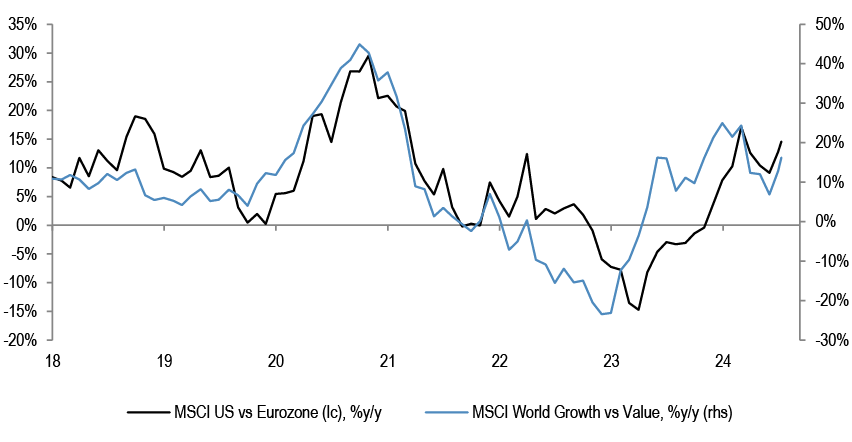
Figure 32: MSCI US vs Eurozone and World Growth vs Value
Source: Datastream
Eurozone equities typically struggle during periods of Value underperformance. We need a reversal in styles for Eurozone to work, and also in the near-term a market friendly outcome from the French political deadlock would be needed. Finally, dollar strength and worsening US-China trade relations could be headwinds. We look to buy Eurozone at some point in 2H, but think that there might be a better opportunity later on.
Equity Strategy Key Calls and Drivers
SPW, an equal-weighted S&P500 index, has stalled since March, and is behind SPX so far this year by more than 10%. We think this is reflecting a changing Growth-Policy narrative vs early 2024. Entering this year, investor expectations were for a Goldilocks outcome – growth acceleration and at the same time quick Fed easing, starting already in March. The early Fed cuts and the consequent improving credit impulse didn’t materialize, which should weigh on growth in 2H. US activity momentum is slowing, with CESI outright negative at present, putting EPS growth projections of as much as 15% acceleration between Q1 and Q4 of this year at risk. Instead of easing preemptively for market-friendly reasons, such as falling inflation, as was the view at the start of the year, the Fed could end up easing, but reactively, in a response to weakening growth. At the same time, there is no safety net any more, the market is positioned long, Vix is at lows, potentially underpricing risks and credit spreads are extremely tight – this is as good as it gets. Adding to the picture strengthening USD and elevated political uncertainty currently, we arrive at a problematic setup for the equity market during summer. In terms of positioning, we have entered this year again OW Growth vs Value style and Large vs Small caps, and we are keeping these for 2H in the US, not expecting much broadening. The recent relative dip due to French political uncertainty is likely to become a buying opportunity as we move through 2H, but we think the risk of further drawdowns is not finished, as the potential new French government will likely try to test the limits of what they can do. Cyclicals were the best performing sectors in Q1, but struggled to outperform in Q2 . We reiterate our barbell of OW Defensives and Commodities.
Table 3: J.P. Morgan Equity Strategy — Factors driving our medium-term views
| Driver | Impact | Our Core Working Assumptions | Recent Developments |
| Global Growth | Neutral | At risk of weakening as consumer strength wanes | Global composite PMI is at 52.9 |
| European Growth | Positive | reset last year, manufacturing improving, consumer can pick up | |
| Monetary Policy | Neutral | Fed pivot could be accompanied by activity weakness | |
| Currency | Neutral | USD could strengthen again | |
| Earnings | Negative | Corporate pricing power is likely to weaken from here | 2024 EPS projections are continuing their downtrend |
| Valuations | Negative | At 21x, US forward P/E is still stretched, especially vs real yield | MSCI Europe on 13.7x Fwd P/E |
| Technicals | Negative | Sentiment and positioning are stretched post the rally since November | RSIs are in overbought territory |
Source: J.P. Morgan estimates
Table 4: : Base Case and Risk
| Scenario | Assumption |
| Upside scenario | No further hawkish tilt by the Fed. No landing |
| Base-case scenario | Inflation to fall further, risk of downturn still elevated. Earnings downside from here |
| Downside scenario | Further Fed tightening and global recession to become a base case again |
Source: J.P. Morgan estimates.
Table 5: Index targets
| Dec '24 Target |
11-Jul-24 | % upside | |
| MSCI Eurozone | 256 | 295 | -13% |
| FTSE 100 | 7,700 | 8,223 | -6% |
| MSCI EUROPE | 1,850 | 2,082 | -11% |
| DJ EURO STOXX 50 | 4,250 | 4,976 | -15% |
| DJ STOXX 600 E | 460 | 520 | -11% |
Source: J.P. Morgan.
Table 6: Key Global sector calls
| Overweight | Neutral | Underweight |
| Healthcare | Technology | Capital Goods ex A&D |
| Telecoms | Mining | Food& Drug Retail |
| Food, Beverage & Tobacco | Transportation | Autos |
| Real Estate | Banks | |
| Utilities | Discretionary | |
| Energy | ||
| Aerospace & Defence |
Source: J.P. Morgan
Table 7: J.P. Morgan Equity Strategy — Key sector calls*
| Sector | Recommendations | Key Drivers |
| Utilities | Overweight | Sector is low beta, has strong cash flow generation, resilient earnings, and power prices are higher than pre-Ukraine but P/E relative is near record cheap |
| Healthcare | Overweight | Potential for lower yields and stronger dollar are supports, better earnings |
| Staples | Overweight | Sector is one of the best performers around the last Fed hike in the cycle, lower bond yields and better relative EPS momentum should help |
| Banks | Underweight | 3 years of strong performance, NII likely peaking, central banks moving to cuts, underprovisioning |
| Autos | Underweight | Pricing and volume could come under pressure with rising inventories, increasing China competition and weaker demand |
| Chemicals | Underweight | The sector trades at 70% premium to the market, well above historical norm. pricing continues to deteriorate, downside risks to current earnings and margin projections |
Source: J.P. Morgan estimates. * Please see the last page for the full list of our calls and sector allocation.
Table 8: J.P. Morgan Equity Strategy — Key regional calls
| Region | Recommendations | J.P. Morgan Views |
| EM | Neutral | China tactical positive call since Q1, but structural concerns remain |
| DM | Neutral | |
| US | Neutral | Expensive with earnings risk. but our ytd Growth style OW helps |
| Japan | Overweight | Large rate differential, TSE reforms, consumer reflation, but JPY needs to show stability |
| Eurozone | Neutral | Eurozone growth differential bottoming, cheap |
| UK | Overweight | Valuations still look very attractive, low beta with the highest regional dividend yield |
Source: J.P. Morgan estimates.
Top Picks
Table 9: J.P. Morgan European Strategy: Top European picks
| Market Cap | EPS Growth | Dividend Yield | 12m Fwd P/E | Performance | |||||||||||
| Name | Ticker | Sector | Rating | Price | Currency | (€ Bn) | 23e | 24e | 25e | 24e | Current | 10Y Median | % Premium | -3m | -12m |
| ENI | ENI IM | Energy | OW | 14 | E | 46.6 | -35% | -15% | 1% | 6.5% | 6.7 | 12.5 | -46% | -7% | 7% |
| TOTALENERGIES | TTE FP | Energy | OW | 63 | E | 149.9 | -33% | -1% | 2% | 4.9% | 7.3 | 10.6 | -31% | -7% | 21% |
| SHELL | SHEL LN | Energy | OW | 34 | E | 211.0 | -23% | 0% | 2% | 3.5% | 8.7 | 11.1 | -22% | 0% | 22% |
| CRH PUBLIC LIMITED | CRH LN | Materials | OW | 80 | U$ | 49.5 | -14% | 25% | 9% | 1.7% | 14.1 | 14.9 | -5% | -5% | 47% |
| RIO TINTO | RIO LN | Materials | OW | 5250 | £ | 105.8 | -11% | 4% | -1% | 6.4% | 9.1 | 10.3 | -11% | 0% | 6% |
| NORSK HYDRO | NHY NO | Materials | OW | 67 | NK | 11.6 | -60% | 27% | 40% | 3.7% | 10.4 | 12.6 | -18% | -1% | 5% |
| ANGLO AMERICAN | AAL LN | Materials | OW | 2394 | £ | 34.8 | -51% | -14% | 19% | 3.1% | 13.7 | 9.5 | 44% | 13% | 7% |
| SCHNEIDER ELECTRIC | SU FP | Industrials | OW | 230 | E | 132.0 | 2% | 15% | 12% | 1.5% | 25.9 | 16.5 | 57% | 10% | 43% |
| ASHTEAD GROUP | AHT LN | Industrials | OW | 5170 | £ | 26.9 | 26% | - | - | 1.5% | 16.3 | 14.1 | 16% | -10% | -1% |
| RYANAIR HOLDINGS | RYA ID | Industrials | OW | 17 | E | 19.6 | - | - | - | 0.0% | 8.6 | 12.7 | -33% | -17% | 3% |
| AIRBUS | AIR FP | Industrials | OW | 132 | E | 104.5 | 10% | -13% | 34% | 1.4% | 20.3 | 18.5 | 10% | -19% | 0% |
| MTU AERO ENGINES HLDG. | MTX GR | Industrials | OW | 246 | E | 13.3 | 24% | 12% | 14% | 0.8% | 18.6 | 18.1 | 3% | 16% | 8% |
| STELLANTIS | STLAM IM | Discretionary | OW | 19 | E | 56.4 | 12% | -17% | 5% | 8.3% | 3.7 | 4.7 | -21% | -26% | 14% |
| BMW | BMW GR | Discretionary | OW | 91 | E | 57.8 | -35% | -7% | -1% | 6.6% | 5.6 | 7.6 | -27% | -18% | - |
| INDITEX | ITX SM | Discretionary | OW | 46 | E | 144.9 | 27% | - | - | 2.6% | 23.2 | 24.0 | -3% | 7% | 35% |
| ADIDAS | ADS GR | Discretionary | OW | 225 | E | 40.6 | -154% | - | 121% | 0.3% | 44.7 | 24.8 | 80% | 13% | 31% |
| RICHEMONT N | CFR SW | Discretionary | OW | 141 | SF | 85.8 | 78% | - | - | 1.7% | 20.1 | 20.8 | -3% | 7% | -4% |
| COMPASS GROUP | CPG LN | Discretionary | OW | 2171 | £ | 43.9 | 50% | 14% | 10% | 1.9% | 21.7 | 20.9 | 4% | 0% | 5% |
| COLRUYT GROUP | COLR BB | Staples | OW | 45 | E | 5.8 | -27% | - | - | 1.8% | 15.1 | 17.6 | -14% | 13% | 28% |
| ANHEUSER-BUSCH INBEV | ABI BB | Staples | OW | 56 | E | 113.5 | -5% | 9% | 13% | 1.3% | 17.2 | 19.4 | -11% | 1% | 10% |
| NOVO NORDISK 'B' | NOVOB DC | Health Care | OW | 967 | DK | 578.9 | 52% | 26% | 25% | 1.0% | 36.6 | 22.8 | 61% | 11% | 87% |
| ASTRAZENECA | AZN LN | Health Care | OW | 12100 | £ | 222.8 | 9% | 13% | 14% | 1.9% | 17.8 | 17.7 | 1% | 10% | 20% |
| SMITH & NEPHEW | SN/ LN | Health Care | OW | 1091 | £ | 11.3 | 1% | 12% | 18% | 2.7% | 13.8 | 18.4 | -25% | 11% | -7% |
| UBS GROUP | UBSG SW | Financials | OW | 28 | SF | 98.6 | -99% | 4327% | 65% | 2.3% | 17.6 | 10.4 | 70% | 5% | 56% |
| NATWEST GROUP | NWG LN | Financials | OW | 327 | £ | 32.3 | 38% | -20% | 9% | 5.2% | 7.5 | 10.0 | -26% | 20% | 39% |
| ING GROEP | INGA NA | Financials | OW | 17 | E | 55.1 | 106% | -9% | 8% | 6.6% | 8.4 | 9.0 | -7% | 8% | 32% |
| INTESA SANPAOLO | ISP IM | Financials | OW | 4 | E | 65.7 | 79% | 19% | 4% | 8.2% | 7.5 | 10.0 | -25% | 9% | 51% |
| LONDON STOCK EXCHANGE GROUP | LSEG LN | Financials | OW | 9370 | £ | 59.1 | 2% | 10% | 13% | 1.2% | 24.8 | 23.0 | 8% | 1% | 17% |
| AMUNDI (WI) | AMUN FP | Financials | OW | 67 | E | 13.6 | 4% | 8% | 7% | 6.2% | 10.0 | 12.6 | -21% | 4% | 22% |
| DASSAULT SYSTEMES | DSY FP | IT | N | 34 | E | 45.5 | 6% | 8% | 9% | 0.8% | 25.2 | 31.7 | -21% | -15% | -14% |
| ASML HOLDING | ASML NA | IT | OW | 989 | E | 395.2 | 41% | -4% | 60% | 0.6% | 40.1 | 27.3 | 47% | 9% | 56% |
| ASM INTERNATIONAL | ASM NA | IT | OW | 728 | E | 36.0 | -8% | 19% | 35% | 0.4% | 44.4 | 16.7 | 167% | 25% | 96% |
| DEUTSCHE TELEKOM | DTE GR | Telecoms | OW | 24 | E | 118.4 | -13% | 14% | 12% | 3.2% | 12.3 | 14.0 | -12% | 12% | 22% |
| BT GROUP | BT/A LN | Telecoms | OW | 141 | £ | 16.6 | 9% | - | - | 5.5% | 7.8 | 8.6 | -9% | 33% | 15% |
| RELX | REL LN | Industrials | OW | 3543 | £ | 78.6 | 12% | 7% | 9% | 1.7% | 27.7 | 19.5 | 42% | 7% | 45% |
| HELLOFRESH | HFG GR | Staples | N | 6 | E | 1.0 | -49% | -69% | 166% | 0.0% | 16.3 | 18.4 | -11% | -8% | -75% |
| RWE | RWE GR | Utilities | OW | 34 | E | 25.3 | 30% | -55% | -26% | 2.9% | 14.2 | 13.0 | 9% | 8% | -13% |
| ENEL | ENEL IM | Utilities | OW | 7 | E | 69.0 | 15% | 10% | 0% | 6.3% | 10.1 | 11.9 | -15% | 19% | 11% |
| SEGRO | SGRO LN | Real Estate | OW | 946 | £ | 15.2 | 6% | 6% | 8% | 2.9% | 26.4 | 25.3 | 5% | 10% | 32% |
Source: Datastream, MSCI, IBES, J.P. Morgan, Prices and Valuations as of COB 11th Jul, 2024. Past performance is not indicative of future returns.
Please see the most recent company-specific research published by J.P. Morgan for an analysis of valuation methodology and risks on companies recommended in this report. Research is available at http://www.jpmorganmarkets.com
Equity Flows Snapshot
Table 10: DM Equity Fund Flows Summary
| Regional equity fund flows | ||||||||||
| $mn | % AUM | |||||||||
| 1w | 1m | 3m | ytd | 12m | 1w | 1m | 3m | ytd | 12m | |
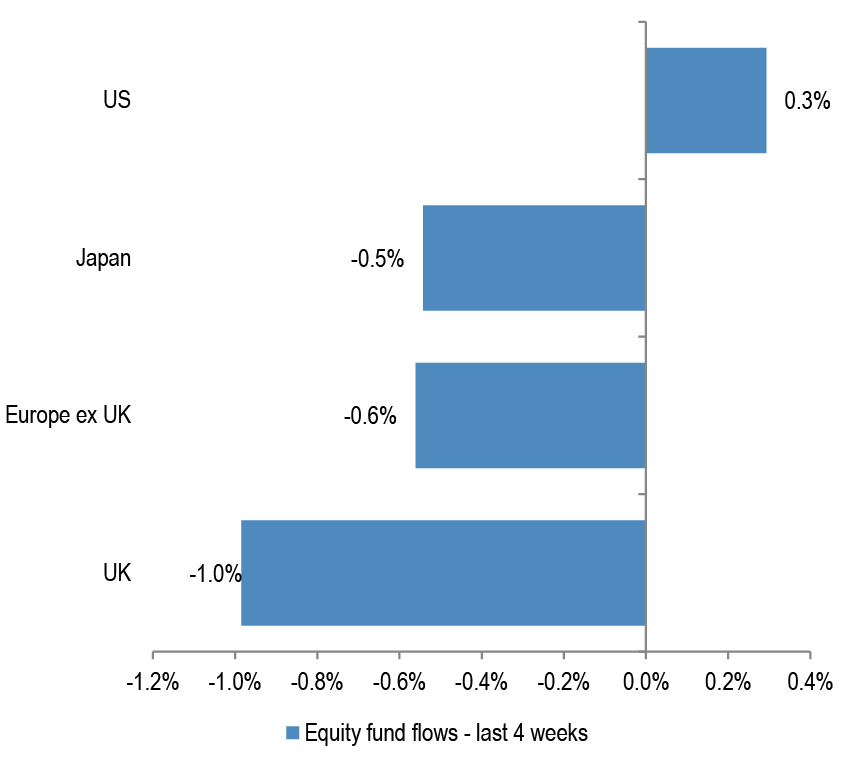
| Europe ex UK | -531 | -1,998 | 347 | -818 | -7,172 | -0.2% | -0.6% | 0.1% | -0.2% | -2.3% |
| UK | -834 | -2,771 | -8,727 | -15,499 | -28,451 | -0.3% | -1.0% | -3.2% | -5.6% | -10.4% |
| US | 5,078 | 32,112 | 81,090 | 146,369 | 272,523 | 0.0% | 0.3% | 0.8% | 1.5% | 3.1% |
| Japan | -2,105 | -4,384 | -4,342 | 7,864 | 13,959 | -0.3% | -0.5% | -0.5% | 1.0% | 1.9% |
Source: EPFR, as of 10th Jul, 2024
Figure 33: DM Equity Fund flows – last month
Source: EPFR, Japan includes BoJ purchases.
Figure 34: DM Equity Fund flows – last 12 months

Source: EPFR, Japan includes BoJ purchases.
Figure 35: Cumulative fund flows into regional funds as a percentage of AUM

Source: EPFR, as of 10th Jul, 2024. Japan includes Non-ETF purchases only.
Figure 36: Cumulative fund flows into regional equity ETFs as a percentage of AUM
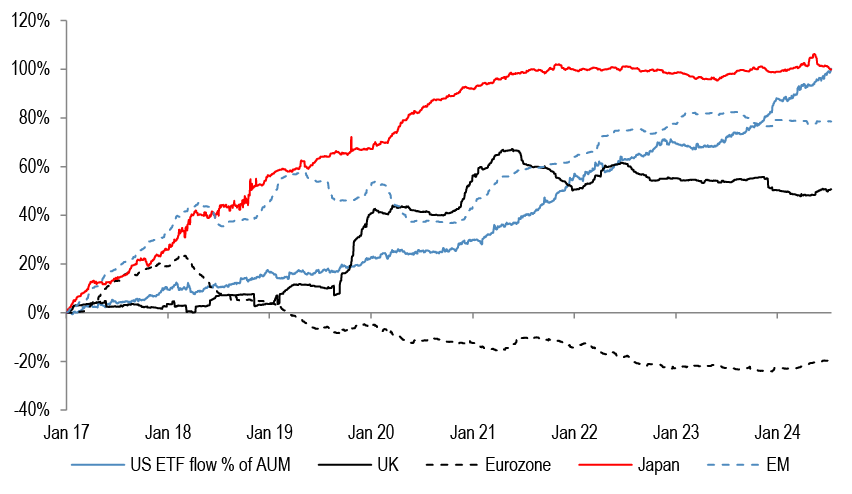
Source: Bloomberg Finance L.P. *Based on the 25 biggest ETF's with a mandate to invest in that particular region. Japan includes BoJ purchases.
Technical Indicators
Figure 37: S&P500 RSI
Source: Bloomberg Finance L.P.
Figure 38: EuroStoxx50 RSI

Source: Bloomberg Finance L.P.
Figure 39: AAII Bull-Bear
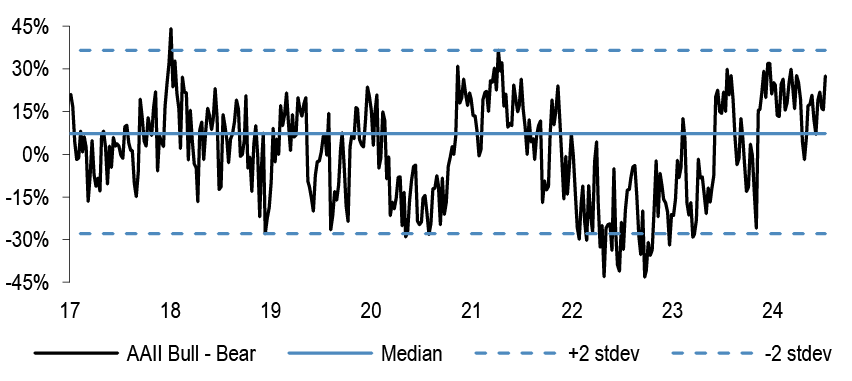
Source: Bloomberg Finance L.P
Figure 40: Put-call ratio
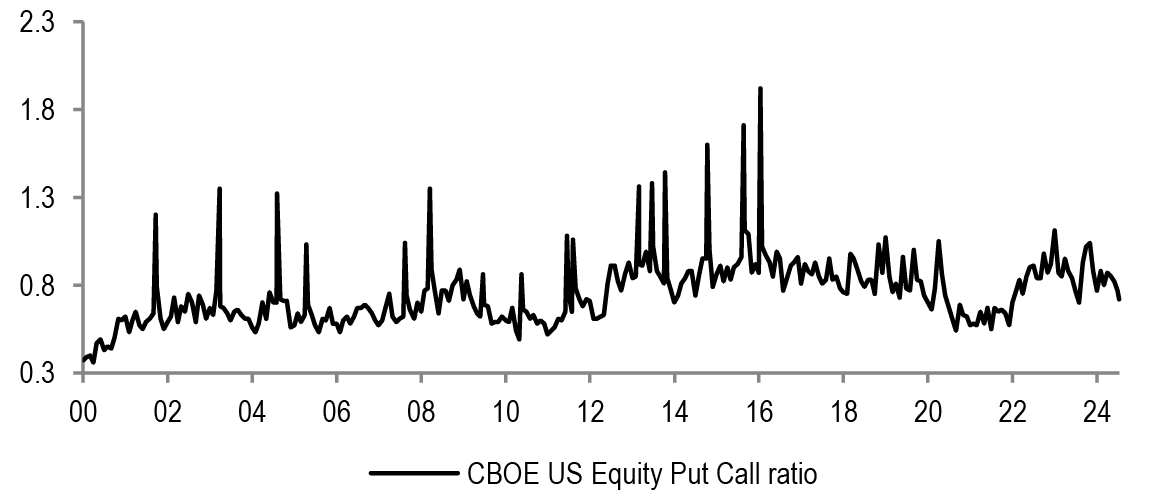
Source: Bloomberg Finance L.P.
Figure 41: Sentix Sentiment Index vs SX5E
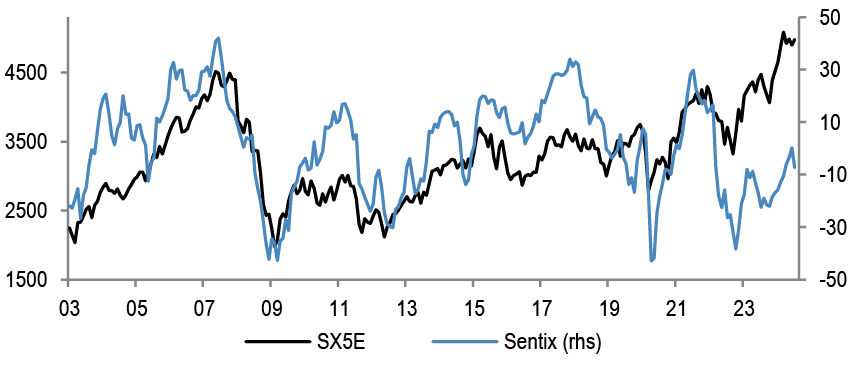
Source: Bloomberg Finance L.P.
Figure 42: Equity Skew
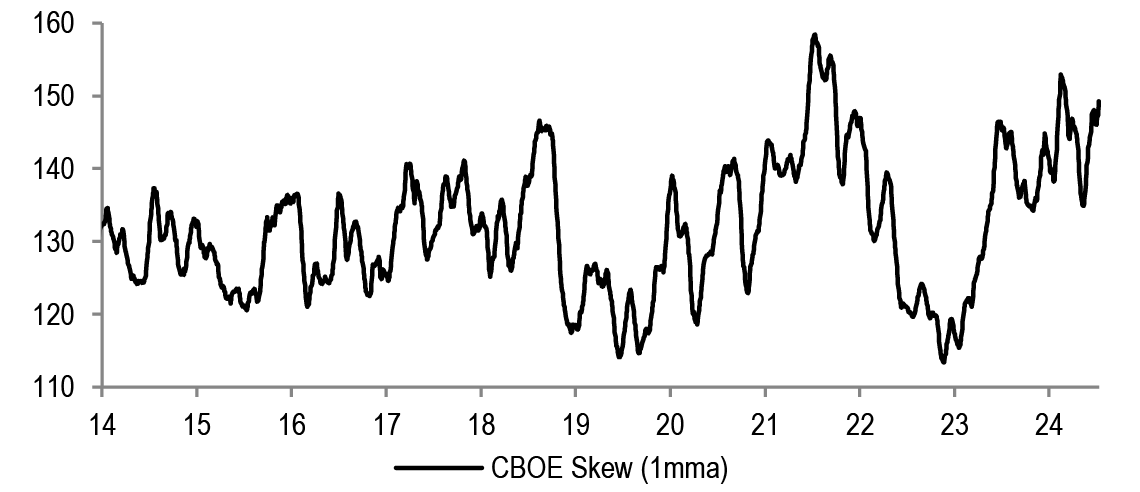
Source: Bloomberg Finance L.P.
Figure 43: Speculative positions in S&P500 futures contracts

Source: Bloomberg Finance L.P.
Figure 44: VIX

Source: Bloomberg Finance L.P.
Performance
Table 11: Sector Index Performances — MSCI Europe
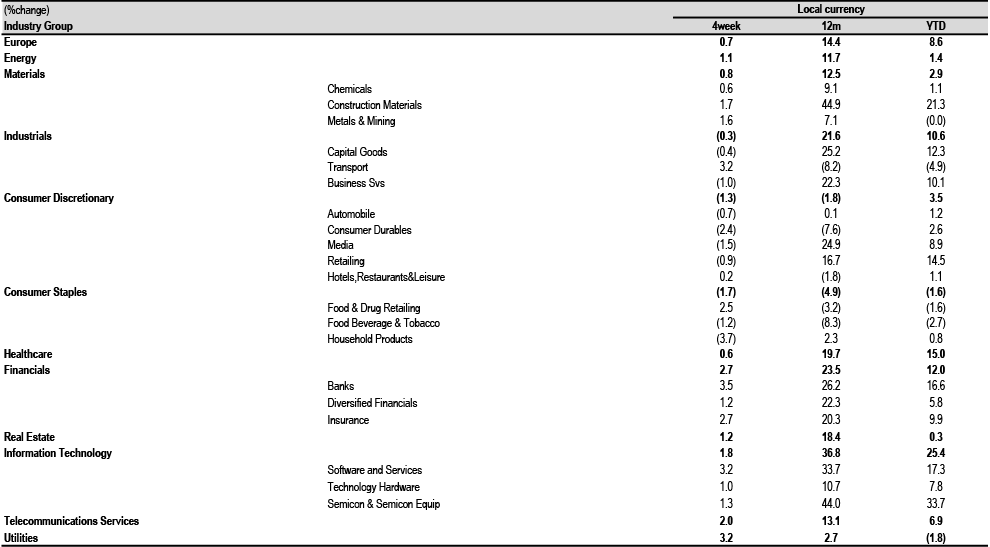
Source: MSCI, Datastream, as at COB 11th Jul, 2024.
Table 12: Country and Region Index Performances
| (%change) | Local Currency | US$ | |||||
| Country | Index | 4week | 12m | YTD | 4week | 12m | YTD |
| Austria | ATX | 2.3 | 18.5 | 7.3 | 3.3 | 17.3 | 5.7 |
| Belgium | BEL 20 | 4.1 | 14.0 | 8.7 | 5.2 | 12.8 | 7.0 |
| Denmark | KFX | (0.9) | 44.7 | 24.3 | 0.1 | 43.0 | 22.3 |
| Finland | HEX 20 | (1.7) | 0.7 | (1.4) | (0.7) | (0.4) | (2.9) |
| France | CAC 40 | (1.0) | 5.6 | 1.1 | (0.1) | 4.6 | (0.4) |
| Germany | DAX | 1.5 | 17.4 | 10.6 | 2.5 | 16.2 | 9.0 |
| Greece | ASE General | 0.5 | 9.8 | 11.8 | 1.5 | 8.7 | 10.1 |
| Ireland | ISEQ | 2.3 | 12.1 | 11.6 | 3.4 | 10.9 | 9.9 |
| Italy | FTSE MIB | 2.1 | 22.3 | 13.1 | 3.1 | 21.1 | 11.4 |
| Japan | Topix | 7.2 | 31.0 | 23.8 | 6.1 | 16.2 | 10.0 |
| Netherlands | AEX | 1.2 | 23.8 | 19.0 | 2.3 | 22.6 | 17.2 |
| Norway | OBX | 0.5 | 13.1 | 6.3 | (0.1) | 9.8 | 0.9 |
| Portugal | BVL GEN | 2.5 | 0.8 | (4.3) | 3.5 | (0.3) | (5.8) |
| Spain | IBEX 35 | 0.9 | 19.7 | 10.6 | 2.0 | 18.5 | 8.9 |
| Sweden | OMX | (0.5) | 14.5 | 7.4 | (0.6) | 16.8 | 3.4 |
| Switzerland | SMI | 1.3 | 11.8 | 10.0 | 1.4 | 10.3 | 3.6 |
| United States | S&P 500 | 2.8 | 25.8 | 17.1 | 2.8 | 25.8 | 17.1 |
| United States | NASDAQ | 3.5 | 32.9 | 21.8 | 3.5 | 32.9 | 21.8 |
| United Kingdom | FTSE 100 | 0.7 | 12.9 | 6.3 | 2.0 | 13.2 | 7.8 |
| EMU | MSCI EMU | 0.8 | 13.6 | 8.4 | 1.8 | 12.4 | 6.7 |
| Europe | MSCI Europe | 0.7 | 14.4 | 8.6 | 1.6 | 13.7 | 6.8 |
| Global | MSCI AC World | 2.7 | 23.2 | 15.1 | 2.9 | 22.1 | 13.8 |
Source: MSCI, Datastream, as at COB 11th Jul, 2024.
Earnings
Table 13: IBES Consensus EPS Sector Forecasts — MSCI Europe
| EPS Growth (%yoy) | |||||
| 2023 | 2024E | 2025E | 2026E | ||
| Europe | (3.8) | 4.2 | 10.2 | 9.2 | |
| Energy | (31.6) | (3.8) | 2.2 | 3.0 | |
| Materials | (39.0) | 7.4 | 14.7 | 8.3 | |
| Chemicals | (39.0) | 23.0 | 19.0 | 12.9 | |
| Construction Materials | 12.2 | 14.3 | 9.5 | 8.7 | |
| Metals & Mining | (46.8) | (4.5) | 11.1 | 3.8 | |
| Industrials | (0.5) | 9.1 | 13.0 | 12.1 | |
| Capital Goods | 20.4 | 12.2 | 14.7 | 12.0 | |
| Transport | (55.8) | (11.4) | (0.8) | 15.5 | |
| Business Svs | 3.2 | 7.7 | 11.5 | 10.4 | |
| Discretionary | 4.9 | 1.4 | 11.1 | 10.5 | |
| Automobile | 1.9 | (6.6) | 6.5 | 7.0 | |
| Consumer Durables | (6.0) | 1.6 | 14.9 | 13.1 | |
| Media | 1.8 | 6.1 | 9.3 | 7.9 | |
| Retailing | 40.2 | 23.9 | 14.9 | 12.5 | |
| Hotels,Restaurants&Leisure | 63.0 | 40.1 | 22.4 | 19.0 | |
| Staples | 2.3 | 2.1 | 8.7 | 7.6 | |
| Food & Drug Retailing | 3.7 | 2.3 | 10.1 | 9.4 | |
| Food Beverage & Tobacco | 1.9 | 0.5 | 8.8 | 7.7 | |
| Household Products | 2.9 | 6.5 | 7.9 | 6.9 | |
| Healthcare | 1.1 | 6.4 | 14.5 | 11.1 | |
| Financials | 15.8 | 8.0 | 7.7 | 8.9 | |
| Banks | 28.8 | 3.6 | 4.4 | 6.7 | |
| Diversified Financials | (19.9) | 18.2 | 22.1 | 20.1 | |
| Insurance | 11.4 | 14.5 | 8.1 | 7.3 | |
| Real Estate | 5.6 | 2.6 | 4.1 | 4.3 | |
| IT | 14.4 | (10.2) | 33.8 | 16.2 | |
| Software and Services | 18.5 | (5.8) | 24.0 | 16.8 | |
| Technology Hardware | (19.1) | 8.9 | 7.5 | 11.2 | |
| Semicon & Semicon Equip | 27.9 | (18.5) | 51.1 | 17.2 | |
| Telecoms | (8.6) | 9.5 | 11.0 | 11.0 | |
| Utilities | 1.8 | (0.0) | 0.4 | 4.1 | |
Source: IBES, MSCI, Datastream. As at COB 11th Jul, 2024.
Table 14: IBES Consensus EPS Country Forecasts
| EPS growth (%change) | |||||
| Country | Index | 2023 | 2024E | 2025E | 2026E |
| Austria | ATX | (23.6) | 6.3 | 4.1 | 5.5 |
| Belgium | BEL 20 | 16.4 | (6.6) | 15.4 | 11.9 |
| Denmark | Denmark KFX | (14.7) | 32.0 | 17.7 | 17.2 |
| Finland | MSCI Finland | (25.2) | 0.6 | 13.7 | 8.9 |
| France | CAC 40 | (2.3) | 0.6 | 9.5 | 8.1 |
| Germany | DAX | 0.2 | 0.6 | 12.6 | 11.0 |
| Greece | MSCI Greece | 15.1 | (8.9) | 5.0 | 10.3 |
| Ireland | MSCI Ireland | 33.8 | 0.4 | 3.0 | 6.4 |
| Italy | MSCI Italy | 8.9 | 0.1 | 3.5 | 5.2 |
| Netherlands | AEX | (1.9) | 2.1 | 12.7 | 9.0 |
| Norway | MSCI Norway | (41.2) | 5.5 | 4.9 | 1.5 |
| Portugal | MSCI Portugal | 16.9 | 16.9 | 0.5 | 8.2 |
| Spain | IBEX 35 | 8.2 | 4.9 | 4.1 | 6.1 |
| Sweden | OMX | 31.9 | 1.5 | 8.6 | 7.1 |
| Switzerland | SMI | (4.5) | 11.6 | 12.6 | 10.4 |
| United Kingdom | FTSE 100 | (10.5) | 0.9 | 8.6 | 7.8 |
| EMU | MSCI EMU | 3.0 | 3.5 | 10.6 | 9.3 |
| Europe ex UK | MSCI Europe ex UK | (0.0) | 5.3 | 10.8 | 9.6 |
| Europe | MSCI Europe | (3.8) | 4.2 | 10.2 | 9.2 |
| United States | S&P 500 | 2.5 | 10.5 | 14.7 | 12.3 |
| Japan | Topix | 18.0 | 8.2 | 10.2 | 8.4 |
| Emerging Market | MSCI EM | (6.5) | 21.6 | 15.9 | 11.0 |
| Global | MSCI AC World | 0.2 | 9.9 | 13.5 | 11.1 |
Source: IBES, MSCI, Datastream. As at COB 11th Jul, 2024** Japan refers to the period from March in the year stated to March in the following year – EPS post-goodwill
Valuations
Table 15: IBES Consensus European Sector Valuations
| P/E | Dividend Yield | EV/EBITDA | Price to Book | |||||||||
| 2024e | 2025e | 2026e | 2024e | 2025e | 2026e | 2024e | 2025e | 2026e | 2024e | 2025e | 2026e | |
| Europe | 14.6 | 13.2 | 12.1 | 3.3% | 3.5% | 3.8% | 8.2 | 7.7 | 7.1 | 2.0 | 1.9 | 1.7 |
| Energy | 7.7 | 7.5 | 7.3 | 5.5% | 5.4% | 5.7% | 3.4 | 3.4 | 3.3 | 1.2 | 1.1 | 1.0 |
| Materials | 16.1 | 14.1 | 13.0 | 3.2% | 3.5% | 3.7% | 7.7 | 6.8 | 6.5 | 1.7 | 1.6 | 1.5 |
| Chemicals | 24.0 | 20.2 | 17.9 | 2.7% | 2.9% | 3.0% | 11.7 | 10.6 | 9.6 | 2.3 | 2.2 | 2.1 |
| Construction Materials | 13.2 | 12.0 | 11.1 | 3.5% | 3.7% | 4.1% | 6.9 | 6.3 | 5.8 | 1.4 | 1.3 | 1.2 |
| Metals & Mining | 11.3 | 10.2 | 9.8 | 3.7% | 4.2% | 4.5% | 5.2 | 4.4 | 4.4 | 1.3 | 1.2 | 1.1 |
| Industrials | 20.2 | 17.9 | 15.9 | 2.3% | 2.5% | 2.8% | 10.4 | 9.4 | 8.6 | 3.4 | 3.1 | 2.9 |
| Capital Goods | 20.2 | 17.6 | 15.7 | 2.2% | 2.4% | 2.7% | 11.1 | 9.6 | 8.8 | 3.5 | 3.2 | 2.9 |
| Transport | 16.1 | 16.2 | 14.0 | 3.2% | 3.2% | 3.4% | 6.7 | 6.8 | 6.3 | 1.8 | 1.7 | 1.7 |
| Business Svs | 23.4 | 21.0 | 19.0 | 2.3% | 2.5% | 2.7% | 13.2 | 12.3 | 11.3 | 6.5 | 6.0 | 5.5 |
| Discretionary | 13.3 | 11.9 | 10.8 | 2.8% | 3.1% | 3.4% | 5.2 | 4.9 | 4.7 | 1.9 | 1.7 | 1.5 |
| Automobile | 6.0 | 5.6 | 5.2 | 5.5% | 5.8% | 6.2% | 1.8 | 1.6 | 1.7 | 0.7 | 0.6 | 0.6 |
| Consumer Durables | 23.7 | 20.7 | 18.3 | 1.9% | 2.1% | 2.3% | 13.8 | 12.6 | 11.3 | 4.0 | 3.6 | 3.2 |
| Media & Entertainment | 17.3 | 15.8 | 14.6 | 2.4% | 2.6% | 2.8% | 12.2 | 9.7 | 9.1 | 2.0 | 2.1 | 1.9 |
| Retailing | 16.5 | 14.4 | 12.8 | 2.3% | 2.5% | 2.7% | 7.1 | 10.1 | 7.6 | 3.6 | 3.1 | 2.8 |
| Hotels,Restaurants&Leisure | 23.6 | 19.3 | 16.2 | 2.0% | 2.5% | 2.9% | 12.2 | 10.4 | 9.4 | 4.5 | 4.1 | 3.7 |
| Staples | 17.1 | 15.8 | 14.7 | 3.1% | 3.4% | 3.6% | 10.7 | 10.0 | 9.2 | 2.8 | 2.7 | 2.5 |
| Food & Drug Retailing | 11.7 | 10.6 | 9.7 | 4.2% | 4.5% | 4.9% | 5.7 | 5.6 | 5.3 | 1.6 | 1.5 | 1.4 |
| Food Beverage & Tobacco | 16.7 | 15.4 | 14.3 | 3.5% | 3.7% | 4.0% | 10.5 | 9.8 | 9.0 | 2.5 | 2.4 | 2.3 |
| Household Products | 20.4 | 18.9 | 17.7 | 2.4% | 2.6% | 2.8% | 13.9 | 12.9 | 11.9 | 4.2 | 3.9 | 3.6 |
| Healthcare | 19.3 | 16.9 | 15.2 | 2.2% | 2.4% | 2.7% | 12.8 | 11.7 | 10.2 | 3.7 | 3.4 | 3.1 |
| Financials | 9.3 | 8.6 | 7.9 | 5.4% | 5.6% | 6.0% | - | - | - | 1.1 | 1.1 | 1.0 |
| Banks | 7.4 | 7.1 | 6.6 | 7.0% | 7.0% | 7.4% | - | - | - | 0.8 | 0.8 | 0.7 |
| Diversified Financials | 15.1 | 12.4 | 10.3 | 2.3% | 2.6% | 2.9% | - | - | - | 1.4 | 1.6 | 1.5 |
| Insurance | 10.9 | 10.0 | 9.4 | 5.5% | 5.9% | 6.3% | - | - | - | 1.7 | 1.6 | 1.5 |
| Real Estate | 15.3 | 14.7 | 14.1 | 4.0% | 4.2% | 4.4% | - | - | - | 0.9 | 0.9 | 0.8 |
| IT | 34.6 | 25.9 | 22.3 | 1.1% | 1.2% | 1.4% | 20.1 | 15.6 | 13.6 | 5.5 | 5.0 | 4.4 |
| Software and Services | 33.2 | 26.8 | 22.9 | 1.3% | 1.4% | 1.5% | 19.0 | 16.1 | 13.8 | 4.6 | 4.2 | 3.7 |
| Technology Hardware | 16.9 | 15.7 | 14.1 | 2.3% | 2.5% | 2.8% | 9.3 | 8.9 | 7.5 | 2.1 | 1.9 | 1.8 |
| Semicon & Semicon Equip | 42.8 | 28.3 | 24.2 | 0.7% | 0.9% | 1.0% | 26.4 | 17.8 | 15.6 | 9.7 | 8.2 | 6.9 |
| Communication Services | 15.1 | 13.6 | 12.2 | 4.2% | 4.3% | 4.5% | 6.6 | 6.2 | 5.7 | 1.5 | 1.5 | 1.4 |
| Utilities | 12.7 | 12.6 | 12.1 | 4.9% | 4.9% | 5.2% | 8.0 | 8.1 | 8.0 | 1.6 | 1.5 | 1.4 |
Source: IBES, MSCI, Datastream. As at COB 11th Jul, 2024.
Table 16: IBES Consensus P/E and 12-Month Forward Dividend Yields — Country Forecasts
| P/E | Dividend Yield | |||||
| Country | Index | 12mth Fwd | 2024E | 2025E | 2026E | 12mth Fwd |
| Austria | ATX | 8.2 | 8.3 | 8.0 | 7.6 | 5.8% |
| Denmark | Denmark KFX | 26.2 | 29.0 | 24.6 | 21.0 | 1.5% |
| Finland | MSCI Finland | 14.5 | 15.7 | 13.8 | 12.7 | 4.4% |
| France | CAC 40 | 12.4 | 13.1 | 12.0 | 11.1 | 3.5% |
| Germany | DAX | 11.8 | 12.8 | 11.3 | 10.2 | 3.4% |
| Greece | MSCI Greece | 29.5 | 30.3 | 28.9 | 26.2 | 1.9% |
| Ireland | MSCI Ireland | 11.0 | 11.2 | 10.9 | 10.3 | 3.7% |
| Italy | MSCI Italy | 9.1 | 9.3 | 9.0 | 8.5 | 5.6% |
| Netherlands | AEX | 15.9 | 17.0 | 15.1 | 13.8 | 2.4% |
| Norway | MSCI Norway | 10.2 | 10.5 | 10.0 | 9.9 | 6.4% |
| Portugal | MSCI Portugal | 14.9 | 15.0 | 14.9 | 13.8 | 3.9% |
| Spain | IBEX 35 | 10.6 | 10.9 | 10.4 | 9.8 | 4.8% |
| Sweden | OMX | 14.6 | 15.3 | 14.1 | 13.3 | 3.8% |
| Switzerland | SMI | 16.9 | 18.1 | 16.1 | 14.6 | 3.2% |
| United Kingdom | FTSE 100 | 11.3 | 11.8 | 10.9 | 10.1 | 4.0% |
| EMU | MSCI EMU | 12.9 | 13.7 | 12.4 | 11.4 | 3.5% |
| Europe ex UK | MSCI Europe ex UK | 14.5 | 15.5 | 14.0 | 12.7 | 3.3% |
| Europe | MSCI Europe | 13.7 | 14.6 | 13.2 | 12.1 | 3.5% |
| United States | S&P 500 | 21.4 | 23.4 | 20.4 | 18.2 | 1.4% |
| Japan | Topix | 15.4 | 16.0 | 14.5 | 13.4 | 2.3% |
| Emerging Market | MSCI EM | 12.1 | 13.2 | 11.9 | 10.2 | 2.9% |
| Global | MSCI AC World | 17.8 | 19.2 | 17.3 | 15.2 | 2.0% |
Source: IBES, MSCI, Datastream. As at COB 11th Jul, 2024; ** Japan refers to the period from March in the year stated to March in the following year – P/E post goodwill.
Economic, Interest Rate and Exchange Rate Outlook
Table 17: Economic Outlook in Summary
| Real GDP | Real GDP | Consumer prices | |||||||||||
| % oya | % over previous period, saar | % oya | |||||||||||
| 2023E | 2024E | 2025E | 4Q23 | 1Q24 | 2Q24E | 3Q24E | 4Q24E | 1Q25E | 1Q24 | 3Q24E | 1Q25E | 3Q25E | |
| United States | 2.5 | 2.3 | 1.7 | 3.4 | 1.4 | 2.0 | 1.0 | 1.0 | 2.0 | 3.2 | 3.1 | 2.7 | 2.4 |
| Eurozone | 0.6 | 0.8 | 1.1 | -0.2 | 1.3 | 1.5 | 1.5 | 1.0 | 1.0 | 2.6 | 2.3 | 2.3 | 1.9 |
| United Kingdom | 0.1 | 1.0 | 0.8 | -1.2 | 2.9 | 2.0 | 1.0 | 1.0 | 0.8 | 3.5 | 2.2 | 2.5 | 2.9 |
| Japan | 1.8 | -0.1 | 0.7 | 0.4 | -1.8 | 1.5 | 1.0 | 0.8 | 0.6 | 2.5 | 2.8 | 3.5 | 2.5 |
| Emerging markets | 4.2 | 4.2 | 3.6 | 4.1 | 6.1 | 3.0 | 3.5 | 3.5 | 3.4 | 3.7 | 3.5 | 3.5 | 3.2 |
| Global | 2.8 | 2.6 | 2.3 | 2.7 | 3.2 | 2.3 | 2.2 | 2.1 | 2.3 | 3.3 | 3.1 | 3.0 | 2.7 |
Source: J.P. Morgan economic research J.P. Morgan estimates, as of COB 5th Jul, 2024
Table 18: Official Rates Outlook
| Forecast for | ||||||||
| Official interest rate | Current | Last change (bp) | Forecast next change (bp) | Sep 24 | Dec 24 | Mar 25 | Jun 25 | |
| United States | Federal funds rate | 5.50 | 26 Jul 23 (+25bp) | Sep 24 (-25bp) | 5.25 | 5.00 | 4.75 | 4.50 |
| Eurozone | Depo rate | 3.75 | 6 Jun 24 (-25bp) | Sep 24 (-25bp) | 3.50 | 3.25 | 3.00 | 2.50 |
| United Kingdom | Bank Rate | 5.25 | 03 Aug 23 (+25bp) | Aug 24 (-25bp) | 5.00 | 4.75 | 4.50 | 4.25 |
| Japan | Pol rate IOER | 0.10 | 19 Mar 24 (+20bp) | 3Q24 (+15bp) | 0.25 | 0.50 | 0.50 | 0.75 |
Source: J.P. Morgan estimates, Datastream, as of COB 5th Jul, 2024
Table 19: 10-Year Government Bond Yield Forecasts
| 10 Yr Govt BY | Forecast for end of | ||||
| 12-Jul-24 | Sep 24 | Dec 24 | Mar 25 | Jun 25 | |
| US | 4.21 | 4.50 | 4.40 | 4.20 | 4.00 |
| Euro Area | 2.49 | 2.40 | 2.20 | 2.10 | 2.00 |
| United Kingdom | 4.07 | 4.10 | 3.95 | 3.85 | 3.75 |
| Japan | 1.06 | 1.20 | 1.45 | 1.45 | 1.60 |
Source: J.P. Morgan estimates, Datastream, forecasts as of COB 28th Jun, 2024
Table 20: Exchange Rate Forecasts vs. US Dollar
| Exchange rates vs US$ | Forecast for end of | ||||
| 11-Jul-24 | Oct 24 | Jan 25 | Apr 25 | Jul 25 | |
| EUR | 1.09 | 1.05 | 1.09 | 1.12 | 1.12 |
| GBP | 1.29 | 1.25 | 1.31 | 1.35 | 1.35 |
| CHF | 0.90 | 0.94 | 0.92 | 0.89 | 0.89 |
| JPY | 159 | 157 | 156 | 155 | 154 |
| DXY | 104.4 | 107.1 | 103.7 | 101.3 | 101.1 |
Source: J.P. Morgan estimates, Datastream, forecasts as of COB 28th Jun, 2024
Sector, Regional and Asset Class Allocations
Table 21: J.P. Morgan Equity Strategy — European Sector Allocation
| MSCI Europe Weights | Allocation | Deviation | Recommendation | ||
| Energy | 5.6% | 8.0% | 2.4% | OW | |
| Materials | 7.0% | 6.0% | -1.0% | N | |
| Chemicals | UW | ||||
| Construction Materials | N | ||||
| Metals & Mining | N | ||||
| Industrials | 15.8% | 14.0% | -1.8% | N | |
| Capital Goods ex Aerospace & Defence | UW | ||||
| Aerospace & Defence | OW | ||||
| Transport | N | ||||
| Business Services | N | ||||
| Consumer Discretionary | 9.1% | 7.0% | -2.1% | UW | |
| Automobile | UW | ||||
| Consumer Durables | N | ||||
| Consumer Srvcs | UW | ||||
| Speciality Retail | UW | ||||
| Internet Retail | UW | ||||
| Consumer Staples | 11.7% | 13.0% | 1.3% | OW | |
| Food & Drug Retailing | UW | ||||
| Beverages | OW | ||||
| Food & Tobacco | OW | ||||
| Household Products | OW | ||||
| Healthcare | 16.0% | 18.0% | 2.0% | OW | |
| Financials | 18.1% | 14.0% | -4.1% | UW | |
| Banks | UW | ||||
| Insurance | N | ||||
| Real Estate | 0.9% | 2.0% | 1.1% | OW | |
| Information Technology | 7.1% | 7.0% | -0.1% | N | |
| Software and Services | N | ||||
| Technology Hardware | N | ||||
| Semicon & Semicon Equip | UW | ||||
| Communication Services | 4.5% | 5.0% | 0.5% | OW | |
| Telecommunication Services | OW | ||||
| Media | N | ||||
| Utilities | 4.4% | 6.0% | 1.6% | OW | |
| 100.0% | 100.0% | 0.0% | Balanced |
Source: MSCI, Datastream, J.P. Morgan.
Table 22: J.P. Morgan Equity Strategy — Global Regional Allocation
| MSCI Weight | Allocation | Deviation | Recommendation | |
| EM | 10.0% | 10.0% | 0.0% | Neutral |
| DM | 90.0% | 90.0% | 0.0% | Neutral |
| US | 70.9% | 68.0% | -2.9% | Neutral |
| Japan | 6.2% | 8.0% | 1.8% | Overweight |
| Eurozone | 8.6% | 8.0% | -0.6% | Neutral |
| UK | 3.8% | 6.0% | 2.2% | Overweight |
| Others* | 10.5% | 10.0% | -0.5% | Neutral |
| 100.0% | 100.0% | 0.0% | Balanced |
Source: MSCI, J.P. Morgan *Other includes Denmark, Switzerland, Australia, Canada, Hong Kong SAR, Sweden, Singapore, New Zealand, Israel and Norway
Table 23: J.P. Morgan Equity Strategy — European Regional Allocation
| MSCI Weight | Allocation | Deviation | Recommendation | |
| Eurozone | 51.0% | 48.0% | -3.0% | Neutral |
| United Kingdom | 22.6% | 25.0% | 2.4% | Overweight |
| Others** | 26.5% | 27.0% | 0.5% | Overweight |
| 100.0% | 100.0% | Balanced |
Source: MSCI, J.P. Morgan **Other includes Denmark, Switzerland, Sweden and Norway
Table 24: J.P. Morgan Equity Strategy — Asset Class Allocation
| Benchmark weighting | Allocation | Deviation | Recommendation | |
| Equities | 60% | 55% | -5% | Underweight |
| Bonds | 30% | 35% | 5% | Overweight |
| Cash | 10% | 10% | 0% | Neutral |
| 100% | 100% | 0% | Balanced |
Source: MSCI, J.P. Morgan

Click here for our weekly podcast
Anamil Kochar (anamil.kochar@jpmchase.com) of J.P. Morgan India Private Limited is a co-author of this report.