
U.S. Fixed Income Markets Weekly
Cross Sector P. White, L. Wash
Treasury yields are lower and spreads stable as the economic data support a gradual economic cooling and as Fed communications confirm expectations of a near-term rate easing cycle. We continue to look for a 50bp cut at the next FOMC meeting and the August employment report will be key for determining the pace of easing. We modestly revise higher our HG gross issuance forecast to $1.5tn for 2024, leaving $400bn of issuance left this year.
Governments J. Barry, P. White, A. Borges, L. Wash
Chair Powell’s dovish tone supports our forecast of consecutive 50bp cuts at each of the next two meetings, but the August employment report is still two weeks away, valuations are no longer cheap, and dealer positioning is elevated, so we stay neutral duration for now. Powell’s comments support further long end steepening, and we recommend holding 5s/30s steepeners to express our core view. Most front-end curves appear too steep relative to their drivers, but 3s/7s offers value for those who want to position for a quicker and more aggressive easing cycle. We discuss the outlook for T-bill supply and valuations. Hold tactical 5y5y inflation swap longs.
Interest Rate Derivatives S. Ramaswamy, I. Ozil, P. Michaelides, A. Parikh
The first cut is all but certain at the Sep meeting, but pace and extent remain uncertain. Policy uncertainty amplifies delivered volatility - stay bullish on vol. Tbill net issuance should turn negative in coming weeks, and term funding premium appears too low - maintain front end spread wideners and position for a flatter 5s/30s spread curve. Initiate 7s/20s weighted spread curve steepeners to benefit from relative value. Forward curve steepeners are preferable to longs in the Reds.
Short-Term Fixed Income T. Ho, P. Vohra
RRP balances have stabilized around $300bn, with limited room to decrease further. Both domestic bank borrowing in the O/N unsecured market and US banks’ participation in the repo market remain minimal, suggesting reserves have not transitioned from abundant to ample yet.
MBS and CMBS J. Sim
Mortgages had a relatively unexciting week, with lower coupons tightening modestly and the rest of the stack close to unchanged. We review 2023 CMBS property financial data, which indicates that net cashflow growth has slowed materially compared to prior years. Multifamily, in particular, has seen operating expenses increase significantly due largely to labor-related costs.
ABS and CLOs A. Sze, R. Ahluwalia
ABS spreads held firm on the week, but current strong technicals are scheduled to be tested in September due to a likely packed new issue ABS calendar, along with macroeconomic data and FOMC schedules.
Investment-Grade Corporates E. Beinstein, S. Doctor, N. Rosenbaum, S. Mantri
HG bond spreads were stable last week despite declining yields. August on track to be the 4th consecutive month of positive returns, supporting demand. We revise up our FY24 supply forecast to $1.5tr leaving $400bn to go in 2024.
High Yield N. Jantzen, T. Linares
High-yield bond yields are at a low since August 2022 and spreads are 60bp inside early August’s high. High-yield bond yields and spreads decreased 12bp and 5bp over the past week to 7.53% and 364bp. And the HY index is up +1.21% in August which boosts 2024’s gain to +6.11%.
Municipals P. DeGroot, Y. Tian, R.Gargan
Cheaper municipal valuations and the expectation for lower absolute rates as the Fed’s easing cycle proceeds, could mean that the next couple of months offer the best opportunity to buy bonds of the year and possibly the rate cycle.
Emerging Markets L. Oganes
In EM fixed income, we are MW GBI-EM local rates, CEMBI and EMBIGD. EM bond flows were -$304mn (-0.08% of weekly AUM, up from -$1.4bn).
Summary of Views
| SECTOR | CURRENT LEVEL | YEAR END TARGET | COMMENT |
| Aug 23, 2024 | Dec 31, 2024 | ||
| Treasuries | |||
| 2-year yield (%) | 3.91 | 3.20 | Maintain 5s/30s steepeners and 75:6 weighted 5s/10s/30s belly-cheapening butterflies to position for higher term premium |
| 10-year yield (%) | 3.81 | 3.50 | |
| Technical Analysis | |||
| 5-year yield (%) | 3.65 | 3.10 | The rally has entered a more linear phase now |
| 5s/30s curve (bp) | 45 | 90 | The curve has broken out of its multi-year base pattern |
| TIPS | |||
| 10-year TIPS breakevens (bp) | 209 | 200 | Initiate tactical 5yx5y inflation swap longs |
| Interest Rate Derivatives | |||
| 2-year SOFR swap spread (bp) | -19 | -6 | The first cut is all but certain at the Sep meeting, but pace and extent remain uncertain. Policy uncertainty amplifies delivered volatility - stay bullish on vol. Tbill net issuance should turn negative in coming weeks, and term funding premium appears too low - maintain front end spread wideners and position for a flatter 5s/30s spread curve. Initiate 7s/20s weighted spread curve steepeners to benefit from relative value. Forward curve steepeners are preferable to longs in the Reds. |
| 5-year SOFR swap spread (bp) | -30 | -22 | |
| 10-year SOFR swap spread (bp) | -44 | -37 | |
| 30-year SOFR swap spread (bp) | -80 | -79 | |
| Agency MBS | |||
| FNMA 30yr 5.5% Front Tsy OAS (bp) | 24 | 25 | Mortgages tightened on the back of weaker economic data |
| RMBS Credit | |||
| CRT M1B/M2 (DM@10CPR) | 1MS + 168bp | 1MS + 175bp | Non-QM and jumbo spreads have moved tighter vs. pre-August rate volatility, and we expect rangebound spreads through year end. |
| RMBS 2.0 PT (6s) | 1-08bk of TBA | 1-12bk of TBA | |
| AAA Non-QM | I + 130bp | I + 150-175bp | |
| ABS | |||
| 3-year AAA card ABS to Treasuries (bp) | 48 | 40 | ABS spreads mostly stable over the first two weeks of July, with strong bids for benchmark credit card and FFELP ABS |
| CMBS | |||
| 10yr conduit CMBS LCF AAA | 102 | 95 | Benchmark CMBS spreads look about fair to their corporate and mortgage comps. However, we see value in upper IG mezz conduit bonds. |
| 10yr Freddie K A2 | 52 | 48 | |
| Investment-grade corporates | |||
| JULI spread to Treasuries (bp) | 110 | 110 | Still attractive yields, a continuation of positive returns, relatively lighter supply in the coming months and the start of Fed cuts will be supportive of spreads, while slower growth and a trend towards lower yields limits meaningful further spread tightening. |
| High yield | |||
| Domestic HY Index spread to worst (bp) | 363 | 380 | We believe HY spreads will be supported in the near-term by resilient earnings, steady inflows, and lighter capital market activity in 3Q |
| Credit Derivatives | |||
| High Grade (bp) | 51 | 50 | Credit has outperformed relative to both equity and equity volatility in the recent selloff. Buying CDS index protection funded by selling VIX futures screens attractive at current levels |
| High Yield | $106.7/330bp | 350 | |
| Short-term fixed income | |||
| EFFR (%) | 5.33 | 4.10 | Funding conditions should remain benign, with liquidity remaining abundant, limiting any potential impacts to EFFR/SOFR, T-bills/OIS, and CP/OIS spreads. We do not expect MMF reform to have any outsized impact on money market credit spreads. Treasury repo clearing remains work in progress, though concerns about readiness are emerging. |
| SOFR (%) | 5.31 | 4.10 | |
| CLOs | |||
| US CLO Primary AAA (Tier 1, bp) | 135 | SOFR + 150 | We widened our base case CLO T1 AAA new issue spread forecast to 150bp (from 130bp prior) and introduced a 175-200bp risk case in the event of a hard landing. |
| Municipals | |||
| 10-year muni yield (%) | 2.69 | 2.10 | Finding sustained market consensus while navigating transition to an easing cycle may be difficult, but we suggest playing the long game, and buying municipal bonds with a longer term perspective, particularly in periods where Treasuries sell-off. We suggest adding idiosyncratic municipal risk opportunistically on market weakness, and highlight potential market cheapening in the period before the election. |
| 30-year muni yield (%) | 3.57 | 3.10 | |
| Emerging Markets | |||
| Hard currency: EMBIG Div (bp) | 395 | 400 | MW EMBIGD |
| Hard currency: CEMBI Broad (bp) | 226 | 220 | MW CEMBI Br |
| Local currency: GBI-EM yield (%) | 6.27% | 5.58% | MW local rates |
Source: J.P. Morgan
US Fixed Income Overview
See you in September
- Economics: The preliminary benchmark payroll revisions lowered total payroll growth for the year through March 2024 by 818k. Initial claims remained relatively unchanged at 232k for the August employment report reference week
- Treasuries: Chair Powell’s dovish tone supports our forecast of consecutive 50bp at each of the next two meetings, but the August employment report is still two weeks away, valuations are no longer cheap, and dealer positioning is elevated, so we stay neutral duration for now. Powell’s comments support further long end steepening, and we recommend holding 5s/30s steepeners to express our core view. Hold tactical 5y5y inflation swap longs
- Interest Rate Derivatives: Policy uncertainty remains elevated with OIS markets placing significant weight on both deep cutting and shallow cutting scenarios. Yields should remain sensitive to new economic and policy information which supports jump risk and elevated realized volatility. We remain bullish on volatility in short expiries. We remain positioned for swap spread curve flattening and we recommend initiating exposure to a flatter 5s/30s swap spread curve
- Short Duration: RRP balances have stabilized around $300bn, with limited room to decrease further. Both domestic bank borrowing in the O/N unsecured market and US banks’ participation in the repo market remain minimal, suggesting reserves have not transitioned from abundant to ample yet
- Securitized Products: Mortgages had a relatively unexciting week, with lower coupons tightening modestly and the rest of the stack close to unchanged. We think mortgage credit spreads can remain rangebound for the rest of the year. We see value in upper IG mezz CMBS and 5yr Agency CMBS bonds
- Corporates: HG bond spreads were stable last week despite declining yields. August on track to be the 4th consecutive month of positive returns, supporting demand. We revise up our FY24 supply forecast to $1.5tn leaving $400bn to go in 2024
- Near-term catalysts: July personal income (8/30), July JOLTS (9/4), Aug employment (9/6), Aug CPI (9/11), Aug PPI (9/12)
Must Read This Week
Cuts are coming, Michael Feroli, 8/23/24
Focus: Beryl and July jobs, Abiel Reinhart, 8/23/24
July FOMC minutes highlighted labor market risks, Abiel Reinhart, 8/21/24
US: Benchmark brings big downward revisions to (lagged) jobs, Abiel Reinhart, 8/21/24
Over the past week Treasury yields are lower and spreads roughly stable across both corporate and mortgage markets as the economic data continue to reinforce only gradual cooling in the economy, the issuance calendar remains light, and Fed communications confirm expectations of a rate cutting cycle beginning in September. Indeed there was little fanfare from what sparse data was released this week. The preliminary benchmark revisions lowered total payroll employment growth for the year through March 2024 by 818k (0.5%), decreasing job growth by about 70k/month to a ~175k monthly run rate over the period. It is difficult to say exactly how the Fed will interpret this data, given that the revision cuts off in March 2024 and the implications for more recent months are not fully clear (see US: Benchmark brings big downward revision to (lagged) jobs, Abiel Reinhart, 8/21/24). At the same time initial jobless claims for the August employment reference week remained roughly unchanged over the week at 232k, but are 13k lower than the July reference week, and claims continue to follow a similar summer seasonal path as the last few years (see US: Good news from mostly stable jobless claims, Abiel Reinhart). The data support our view that the economy is slowing with low risks of a recession.
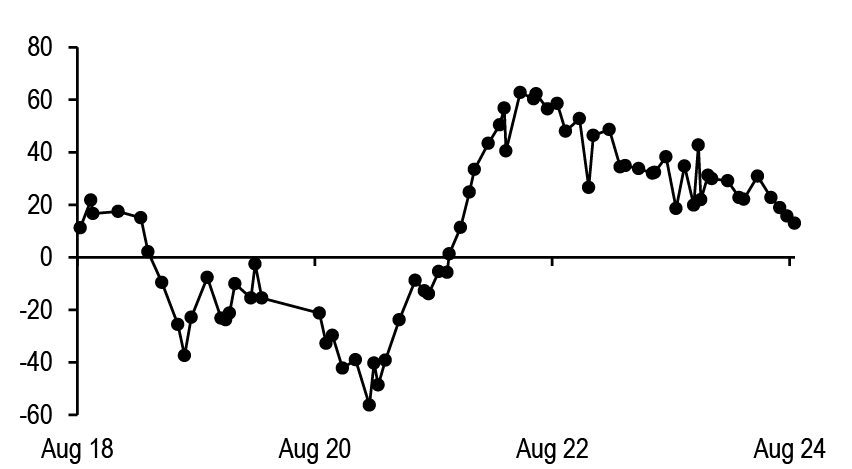
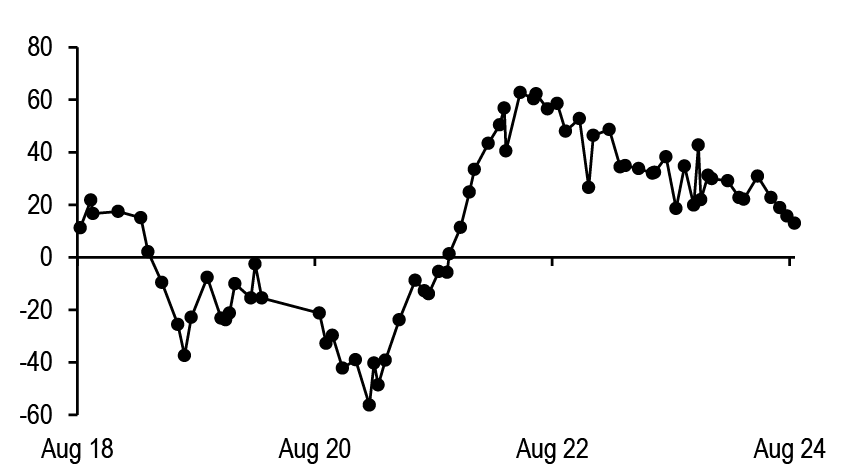
Instead, market participants were focused on Fed communications, which laid the ground work for an upcoming easing cycle. Even before the release of the July payrolls report, the July FOMC minutes revealed that “the vast majority” of the FOMC were ready to cut by the September meeting. Notably “many” participants noted the risks around cutting too little or too late while only “several” thought reducing rates too soon or too much could risk a resurgence in inflation (see July FOMC minutes highlighted labor market risks, Abiel Reinhart). Meanwhile this week Fed speak offered support for a “gradual” or “methodical” pace of cuts. However markets were most keen for Chair Powell’s Friday Jackson Hole speech where his comments skewed dovish. The Chair stated “the time has come” to adjust interest rates and that the Committee does “not seek or welcome further cooling in labor market conditions.” Unsurprisingly, our monetary policy NLP read Powell’s speech as more dovish than his press conference at the July FOMC meeting, and his most dovish speech since the fall of 2021 ( Figure 1, also see Fed, Powell: Review and Outlook, Joseph Lupton, 8/23/24). Whether the FOMC cuts 25bps or 50bps at the September meeting still hinges on the next monthly employment report, though Powell’s comments arguably lower the bar for the Fed to deliver a 50bp cut next month (see Cuts are coming, Michael Feroli, 8/23/24).
Figure 1: Chair Powell’s 2024 Jackson Hole speech scored as his most dovish in nearly 3 years
Jerome Powell Hawk-Dove history, using speeches, testimonies, and press conferences
Source: J.P. Morgan* For methodology, see Listen up: Upgrading J.P.Morgan’s central bank NLP machine, Joseph Lupton and Dan Weitzenfeld, 7/2/24
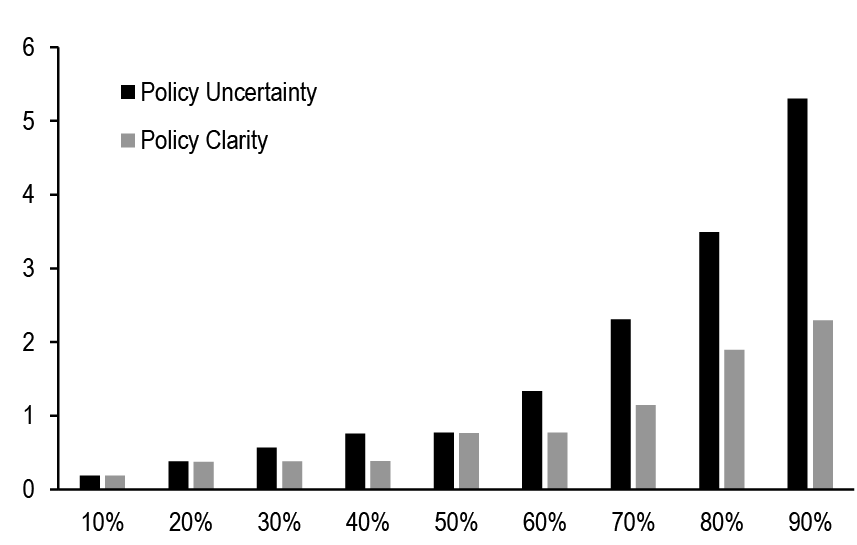
Figure 2: As one might expect, yields have tended to be much more sensitive to Fed-speak in periods of significant policy uncertainty
Size of the Nth percentile absolute change in the Fed sentiment index* on days with one or more Fed-speak events, grouped by policy clarity or uncertainty regime**, for various selected values of N from 10 to 90. Past 6 months; bp
Source: J.P. Morgan, Bloomberg Finance, L.P.
* The Fed sentiment index is computed as the cumulative sum of yield changes in 5-year note Treasury futures in the 15-minute period following the first Fedspeak headline on Bloomberg. Fedspeak is defined as any speech, FOMC meeting or FOMC minutes. ** Days on which the absolute difference between the total weight on deep cut scenarios and shallow cut scenarios was between 0.25 and 0.75 are classified as days characterized by Policy Uncertainty, while all other days are deemed to have Policy Clarity. For more details see Interest Rate Derivatives
As we look ahead, we continue to forecast 50bp cuts at the September and November meetings followed by 25bp per meeting thereafter. Our forecast is rooted in both the resumption of the disinflationary process which remains broad based across components, together with ongoing loosening in labor markets, which has reduced the risk prices remain sticky. With the beginning of the easing cycle less than a month away and OIS forwards pricing in 103bp of easing through YE24 compared to our own projection of 125bp, this would indicate there is value to being long duration. However we remain patient as growth data has turned more favorable in recent weeks and we do not think the debate surrounding the pace of easing will be settled before the August employment report. Moreover valuations look close to our fair value estimate, and in an environment in which term premium is biased higher, we think it’s unlikely that valuations overshoot to the rich side of fair value. Thus, we remain neutral on duration but continue to favor 5s/30s steepeners as a medium-term expression of our bullish view (see Treasuries).
Turning to inflation markets, intermediate breakevens remain cheap to our fair value framework, though the model residual narrowed on Friday, given a dovish shift from Fed Chair Powell. In recent months, the Fed’s wavering confidence in disinflation and thus a heightened focus on labor market data created a less supportive backdrop for TIPS, with real yields demonstrating lower sensitivity to nominal yields in rallies than in sell-offs. However, we argue that the backdrop is becoming more supportive for TIPS once again. Along the curve, the intermediate sector continues to offer value, and forward-starting swaps avoid the negative carry associated with spot breakeven positions. With the fundamental backdrop turning more supportive and valuations still cheap, albeit somewhat less cheap than a week ago, we maintain tactical long exposure in 5Yx5Y inflation swaps (see TIPS).
Despite the near certainty of a cut in September, the pace and extent of easing remain uncertain with OIS markets placing significant weight on both deep cut and shallow cut scenarios. In this period of elevated policy uncertainty, yields should remain highly sensitive to both new economic and policy information; Figure 2 shows the percentile moves in yields around Fedspeak events and indicates that markets are prone to greater sensitivity during periods of elevated policy uncertainty. Such a backdrop is conducive to jump risk and supportive of elevated realized volatility. Thus with significant jump risk going into August payrolls and beyond, we remain bullish on volatility in short expiries. We also remain positioned for a flattening in the swap spread curve. Front-end spreads should be biased wider as SOFR and GC rates normalize and net T-bill supply turns negative in September whereas long-end spreads should narrow against the backdrop of rising term premium. Therefore, we now recommend initiating exposure to a flatter 5s/30s swap spread curve (see Interest rate derivatives).
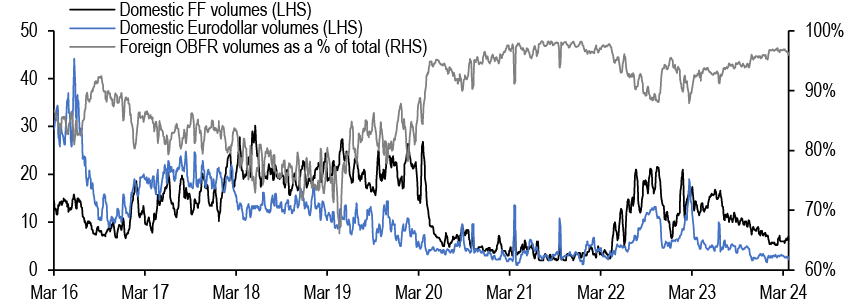
Turning to Fed’s balance sheet, the July FOMC minutes did not reveal much new information. The SOMA manager noted that repo rates had risen due to increased demand for financing Treasury securities and balance sheet normalization. Meanwhile, the manager concluded that reserves remained abundant but emphasized that the staff would continue to closely monitor developments in money markets. We agree, as we note domestic banks remain largely absent from overnight funding markets, whether in fed funds or Eurodollar deposits, while bank call reports show little increased net reverse repo activity YTD, as the GC/IORB spread remains subdued ( Figure 3). If we were to see increasing participation of banks within overnight markets or an increasing percentage of overnight Treasury repo transacted at or above IORB, this would signal reserve scarcity is approaching. To that end, bank reserves have been steady at ~$3.4tn while ON RRP balances have fallen by ~$700bn YTD as MMFs have shifted towards T-bills and non-Fed repo. We think there is limited room for ON RRP to move much below the current low $300 level, given operational considerations for MMFs to meet unexpected liquidity needs, and we think QT can continue through year-end (see Short term fixed income).
Figure 3: Domestic banks have remained largely absent from the overnight market, both in fed funds and Eurodollar deposits
Fed funds and Eurodollar deposits (OBFR-FF) volumes (LHS, $bn) versus Foreign OBFR volumes as a % of total (RHS,%)
Source: Federal Reserve Bank of New York Fed, J.P. Morgan
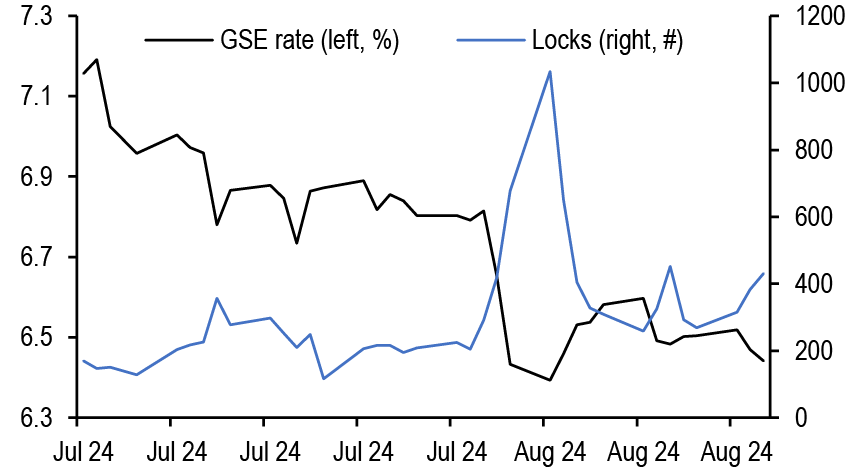
Mortgage rates are roughly unchanged across the stack, with lower coupons modestly tighter. Along with most spread products, valuations have recovered from the local wides seen early in the month; still, with mortgages continuing to offer historically compelling yields vs. corporates, we think the technical support for the product from money managers can be maintained. We continue to prefer UIC conventionals and are underweight 4.5s and 5s. Primary rates have fallen to roughly 6.44% on GSE loans and 5.47% for VA IRRRLs, but we have not seen a surge in refi applications, likely as originators picked up some low hanging fruit earlier this month ( Figure 4, see Mortgages). Mortgage credit spreads similarly retraced much of the widening seen earlier in the month with AAA non-QM back to 130bp in new issue. We expect spreads to remain rangebound over the rest of the year as the macro outlook remains challenging while the election season quickly approaches. Primary activity has been very active this summer, but stepped down over the month from $12bn to $7bn new issue RMBS in August, and we think primary markets will be light in the next week (see RMBS).
ABS spreads largely held firm over the month with relatively muted supply and as markets focused on opportunities in higher-yielding segments. Deals were marketed at wider initial price targets given the volatility this month, but final pricing was able to track within these margins given heightened oversubscriptions. Light primary dealer issue activity lent support to the secondary market this week, allowing dealers to off-load some inventory. Private credit student loan ABS tightened by 10-15bp across the capital stack. Meanwhile performance on our bankcard ABS index remains solid. Charge-offs have increased 6bp this year to 2.2% and these low losses coupled with high yields resulted in record high quarterly average excess spreads of 19.9%. Strong credit performance, robust demand, and the back-drop of a no-recession base case scenario should sustain spreads, though we note the potential for a likely heavy new issue ABS calendar alongside increased macro volatility come September (see ABS).
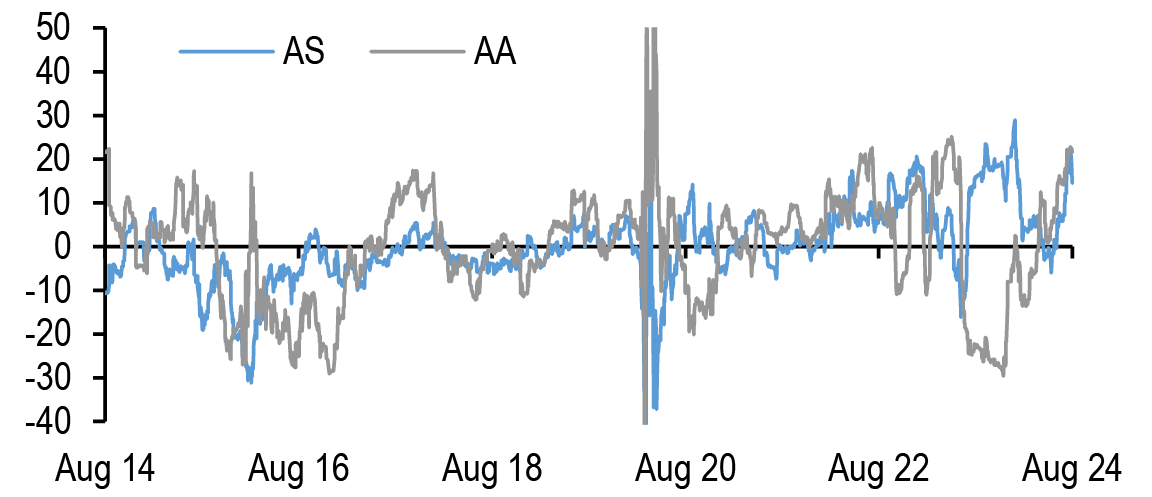
Issuance was similarly relatively light within CMBS markets over the past week. Benchmark CMBS spreads were slightly tighter, and valuations look fair relative to their corporate and mortgage comparables. Conduit IG mezz tightened more, with AS to single-As tighter 8-16bp over the week. We continue to see value in upper IG mezz bonds (AS and AA) which should be more insulated from near-term risks to the data but still look cheap relative to corporate comps and to the spread curve ( Figure 5). We also still see 5yr Agency CMBS as leaning cheap to current coupon Treasury OAS and ZVs. Our analysts review 2023 conduit CMBS property financial data, which indicates that net cashflow growth has slowed materially compared to recent years, with multifamily revenues in particular suffering from rising labor-related expenses and significantly rising insurance premiums (see CMBS).
Figure 4: Primary rates have edged lower, but lock volume is off the early August highs
GSE rate/term refi lock rates (%) and number of locks (#);
Source: Optimal Blue
Figure 5: Conduit CMBS upper IG mezz are cheap on the spread curve
Residuals from linear regressions* of 10yr conduit CMBS AS and AA Treasury spreads to those of adjacent tranches; bp
Source: J.P. Morgan
*Modeled spreads linearly regresses 10yr conduit CMBS AS spreads against 10yr conduit CMBS LCF AAA and 10yr conduit CMBS AA spreads over the last 10 years (R2 = 96%,SE = 8.8bp) and 10yr conduit CMBS AA spreads against 10yr conduit CMBS LCF AS and 10yr conduit CMBS A spreads over the last 10 years (R2 = 97%,SE = 12bp)
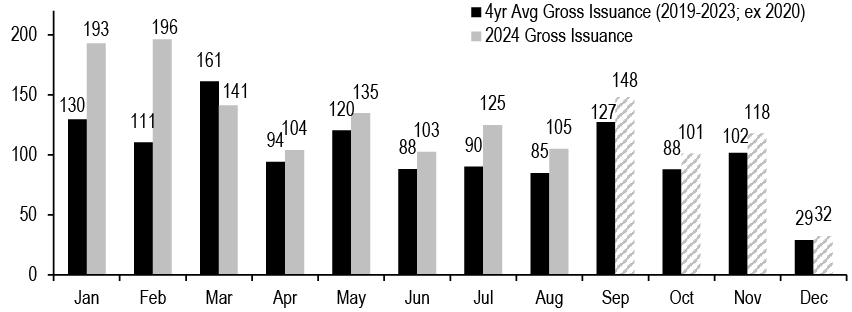
Turning to corporate credit, JULI spreads remained rangebound over the past week within a tight 109-112bp range and the stability of spreads in recent weeks comes despite declining yields and heavy corporate issuance. Supply has been active with $103bn priced in August, surpassing the historical average of $85bn. Instead we think spreads have benefited from the reversal of the equity sell-off following more encouraging economic data, seasonally unusually strong liquidity, and retail fund inflows. Indeed trading volumes averaging $35bn/day are 67% higher than the historical August pace, bucking the typical seasonal trend of late summer depressed liquidity, while fund flows have been robust averaging $5.3bn/week this month, likely driven by positive returns. Looking ahead, we recently revised higher our gross issuance forecast modestly to $1.5tn. Specifically, we expect $400bn in supply over the remainder of the year, a step down from the current pace, and this would leave roughly $150bn of supply come September according to historical seasonals ( Figure 6). In an environment where economic growth is slow but positive and the Fed lowers rates, we would expect spreads to remain near current levels. Meanwhile if the Fed does deliver on our projected easing forecast, we expect the percentage gap in yield between HG credit vs Treasuries to be near its widest YTD and this could spur the marginal duration buyer towards credit over rates (see Corporates).
Down the capital stack, high yield spreads are 5bp tighter over the week while yields are at their lowest levels since August 2022 amid a Goldilocks narrative on growth without inflation. Month-to-date, BB spreads are tighter by 3bp while B and CCC spreads are now wider by 9bp and 33bp in August, respectively. Meanwhile the percentage of leveraged loans trading above par recovered to 42% amid improving growth sentiment, moderating retail outflows, robust CLO origination, and light capital activity. We note that the ratings profile for HY bonds is near its most benign on record, as the universe of single Bs contracted 440bp this year versus an expansion of 420bp for BBs and only a 20bp increase in CCCs. Conversely, the rating mix for loans is considerably weaker than bonds given the aggressive capital market activity earlier this year and a historic downgrade wave (see High Yield).
After a firm start to the year, US CLO supply has subsided in recent months with $12bn of new supply in August MTD compared to $24bn in May. We anticipate there will be a strain on new issuance over the coming months given challenging loan sourcing, rising recession risks, and Fed rate cuts. Spreads could soften as investors proceed with caution around market volatility. Meanwhile refi/reset activity has strong momentum with July the third heaviest month of all time at $27bn. Indeed there are 102 US managers that have refi’d/reset a deal this year compared to 42 last year as volumes have picked up (see CLOs).
Figure 6: We revise higher our gross issuance forecast to $1.5tn and expect $400bn for the remainder of the year. HG supply has exceeded the historical pattern in almost every month this year, and we expect this to continue through YE
4yr average gross issuance versus 2024 gross issuance*; bn
Source: J.P. Morgan
*The grey dashed bars are estimates based on historical pace and not our forecast
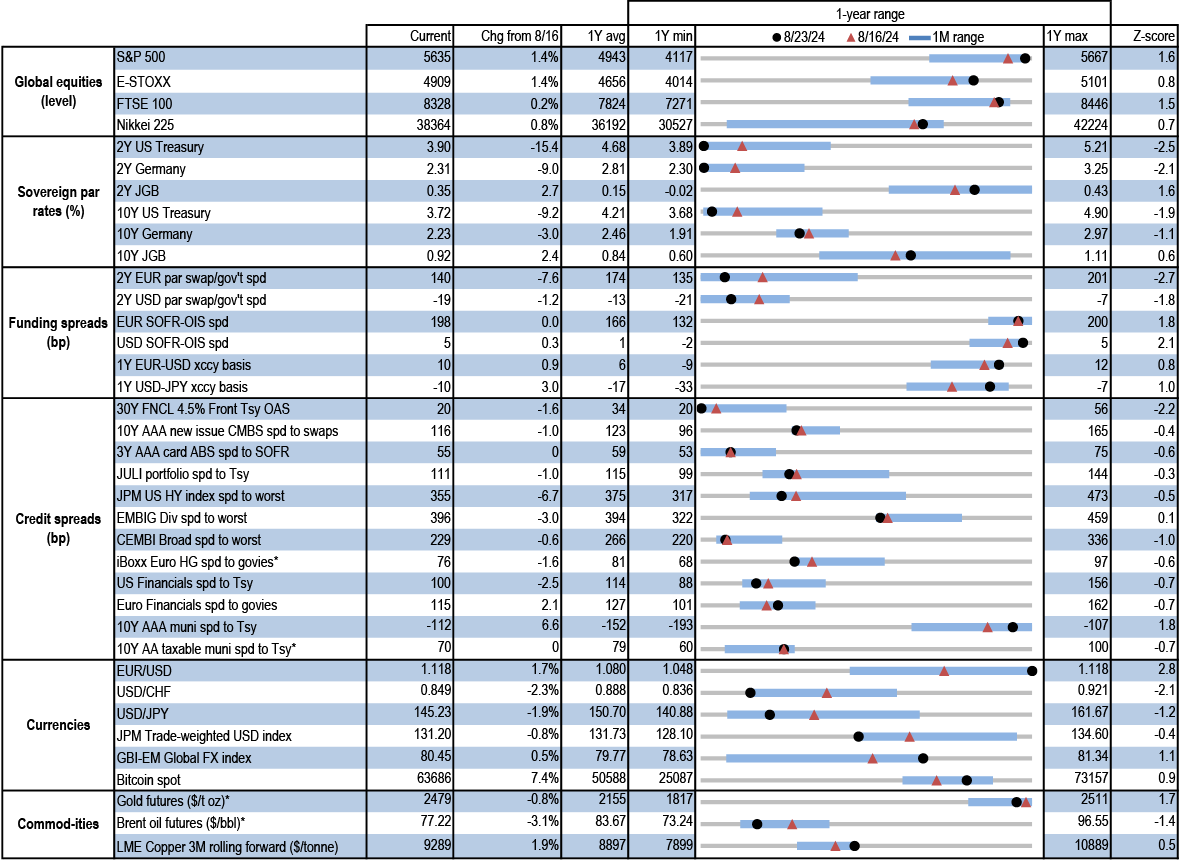
Figure 7: Cross sector monitor
Current levels, change since 8/16/24, 1-year average, minimum, maximum, and current z-score for various market variables; units as indicated
Source: J.P. Morgan, Bloomberg Finance L.P., ICE, IHS Markit
* 8/22/24 levels for iBoxx Euro HG, AA taxable munis, gold, and brent oil; 8/23/24 levels for all others
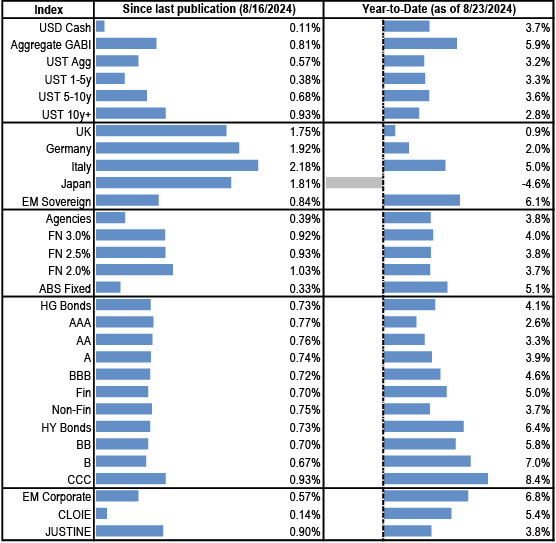
Figure 8: YTD returns on various fixed income indices; %
Source: J.P. Morgan
Economics
- Fed’s Powell: “The time has come for policy to adjust”
- Limited guidance leaves the debate over a 25bp or 50bp cut wide open; we continue to expect the latter...
- … but that will depend on the August jobs report after mixed labor market news this week
- Expected soft core PCE inflation in focus next
The path to rate cuts is now wide open. Fed communications this week—both the minutes to the late July FOMC meeting and Powell’s speech at the Jackson Hole conclave—were quite direct in signaling that policy rates will be reduced at the September meeting and presumably further in the fall and winter. Neither the minutes nor Powell shed light on the market’s current debate over a 25bp or 50bp cut next month, which makes sense given there’s almost a full monthly slate of data between now and the next meeting.
We still look for a 50bp cut in September. With risks to the inflation mandate ebbing and risks to the employment mandate growing, we think it makes sense for policy to be closer to neutral, which is likely at least 150bp below where rates are now. That said, the inconclusive nature of the Fed’s recent guidance with respect to pace suggests that the next employment report will dictate whether our forecast is realized or whether the Fed takes a more gradualist approach to easing.
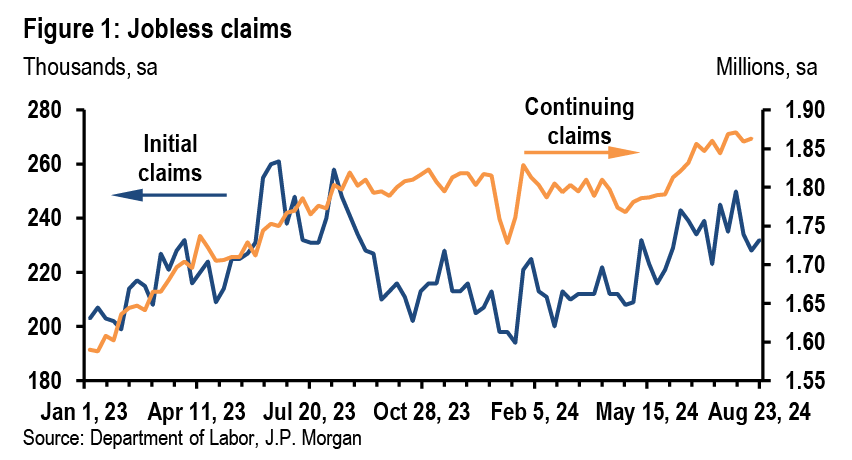
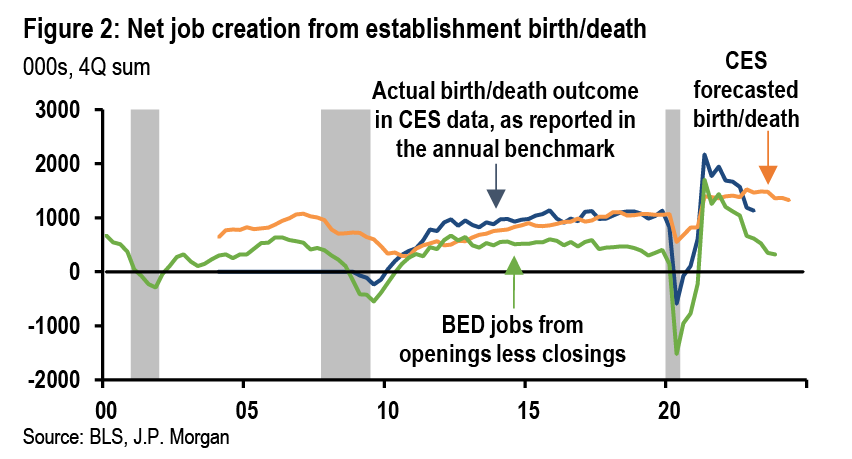
Staying on the topic of the labor market, the latest news has been mixed. Once again, weekly jobless claims remained tame, consistent with a healthy jobs market (Figure 1). However, the benchmark level of employment in March 2024 was revised down by a historically sizable 818,000 jobs. Data from the Business Employment Dynamics survey through December 2023 indicate that the BLS’s preliminary estimates of job growth attributable to the net of business births and deaths may have been overstated, and so it is possible that overstatement could extend beyond March 2024.
Next week promises to be relatively quiet before the fireworks of the data deluge after Labor Day. We expect next Friday’s core PCE figure will be up 0.12%m/m, which would leave the year-ago number unchanged at 2.6%.
Cuts are coming
Chair Powell’s remarks at the Jackson Hole forum left little room for doubt that the Fed will soon be cutting rates, as he frankly put it: “The time has come for policy to adjust.” He didn’t tip his hand on the expected size of that adjustment. Instead, he said “the timing and pace of rate cuts will depend on incoming data, the evolving outlook, and the balance of risks.” While noncommittal on size, this was more open-ended guidance than what we’ve heard from some other Fed officials, who have recently spoken about “methodical” rate cuts. Overall, Powell’s remarks leaned dovish, as he stressed the FOMC’s attentiveness to labor market conditions. Powell did not express worry about the current state of the labor market, but also offered that the Fed does “not seek or welcome further cooling in the labor market.”
We continue to look for the Fed to start off the easing cycle with a 50bp cut next month, though that will depend in part on the August jobs report. As Powell noted, “The current level of our policy rate gives us ample room to respond to any risks we may face, including the risk of unwelcome further weakening in labor market conditions.” If the August jobs report validates the July weakness, then we believe they should quickly make use of that ample room.
While the labor market headlines stuck out, Powell also expressed growing confidence in inflation returning to 2 percent. In fact, much of the body of the speech was a retrospective on inflation developments over the past four years. In that, he attributed “much of the increase in inflation to an extraordinary collision between overheated and temporarily distorted demand and constrained supply.”
Earlier in the week, the minutes to the July 30-31 FOMC meeting (which occurred just before the release of the weak July labor report) similarly skewed dovish and showed a committee more focused on labor market risks than the possibility of a renewed jump in inflation—even if they still judged current inflation as somewhat elevated. While “several” had contemplated cutting 25bp at the last meeting, a “vast majority” were prepared to cut at the September meeting, and “many” saw policy as currently restrictive.
Like many others, participants were trying to understand how much of the unemployment rise reported at the time of the meeting was due to rising labor supply and how that rise should be weighed against less concerning news from new jobless claims and layoff rates. On balance, however, they did not appear to be discounting the increase. Moreover, the Committee was anticipating the possibility of downward payroll revisions, and “several assessed that payroll gains may be lower than those needed to keep the unemployment rate constant with a flat labor force participation rate.”
The labor market giveth, and taketh away
In an otherwise fairly quiet data week, jobless claims were comforting in their recent stability but the unexpectedly large preliminary benchmark revision to payrolls cast a broader pall over markets. Data on initial claims were collected during the reference week for the payroll survey, and do not point to another step down in job growth for August. It’s unclear how much signal for upcoming job growth one should take from the 818K preliminary downward revision to March 2024 payrolls—the final revision will take place early next year—but it helped narrow some of the unusually wide gap between the establishment and household measures of employment. The revisions suggest CES job growth likely averaged around 175K for the 12 months through March, rather than the 242K per month on average as reported, although history suggests a slightly smaller final revision is common. That said, the possibility that payrolls are still being overstated since March 2024 remains: the birth-death model looks to still be adding more jobs than recent (albeit lagged) data from the Business Employment Dynamics suggest is likely (Figure 2).
Mixed signals from home sales
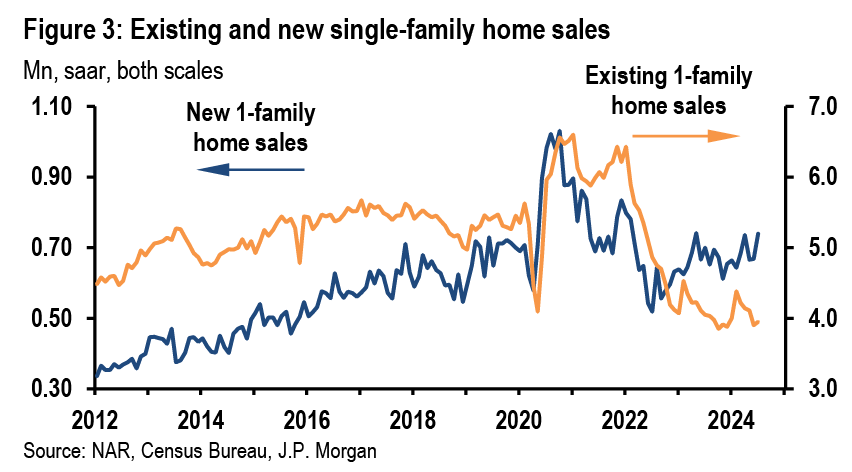
After a pop near the start of the year, most housing market data have trended back down over the past several months. For July, new home sales surprised with a strong 10.6% pop, whereas existing home sales modestly disappointed with a more paltry 1.3% rise. Most importantly, the July single-family new home sales release came with substantial upward revisions to prior months that suggests a better trajectory for this year (Figure 3). New home sales tend to be volatile but they also tend to lead existing home sales (as the former reflects signed contracts while the latter are not recorded until a contract is closed). However, other leading indicators of existing home sales, such as mortgage purchases applications or pending home sales, continue to point to existing home sales remaining stuck at low levels. Inventories of existing homes remain low, although as interest rates come down that could stimulate sales later this year. By contrast, inventories of new homes remain quite elevated, which is restraining price growth and likely weighing on housing starts.
Divergent flash PMI details
In a sign of stability, the all-industry flash PMI for August (54.1) was nearly unchanged from July (54.3). But beneath the headline, the details offered divergent messages. First, looking across sectors, the manufacturing index fell to 48.0. This marks the second consecutive monthly decline, reversing much of its gradual improvement since early 2023 and taking the index to its lowest level since December. The weakness in the manufacturing PMI appears broad-based across survey components. By contrast, the business activity headline for services firmed marginally to 55.2 in August, with new business activity also well supported. While there has been some speculation that services activity would cool as the post-pandemic recovery normalized and the prospect of lower interest rates gave a lift to manufacturing, in reality the services sector remains the main impetus for the continued economic expansion.
Second, the employment flash PMI sent a concerning signal ahead of the August jobs report, with the all-industry measure sliding to its lowest reading in this cycle (outside of April) of 48.9. Weakness was evident in both the manufacturing and services PMIs, although the latter has been quite choppy of late. That said, we do not tend to take much of a signal from this report for the upcoming payroll print as monthly moves in the employment PMI are not particularly informative for the jobs report.
Next week we will get inflation readings in the monthly PCE report but not much labor market news other than the weekly claims. The most important piece of information will arrive after Labor Day with the August jobs report, which might incorporate a very modest post-Beryl addition to payrolls.
Excerpted from, United States Data Watch , Michael Feroli, August 23, 2024
Treasuries
Your time has come
- The Treasury curve bullishly steepened this week supported by the July FOMC meeting minutes and Chair Powell’s speech at Jackson Hole, as both indicated a step in the dovish direction
- Given Powell’s concerns over further cooling in labor markets and his acknowledgement that there is significant room to lower policy rates, we think this supports our forecast of 50bp cuts in September and November, before downshifting to 25bp thereafter
- At face value, with money markets pricing a slower pace of cuts than our forecast, this suggests we should be overweight duration. However, we think it will require a weak August employment report to price a more dovish path for the Fed. With valuations no longer cheap and dealer balance sheets somewhat bloated, we prefer to be patient before adding duration
- In the meantime, this also supports a steeper curve at the long end, as the first cut approaches and the Fed begins to ease consistently. At the long end, steepeners with shorts anchored in 30s offer more value than those anchored in 20s, and we continue to favor 5s/30s to express our core view
- Front-end steepeners should outperform if the Fed eases aggressively, but 2s/5s appears too steep in our framework and incurs significantly negative carry. On margin, 3s/7s looks more attractive for those who want to position for the risk of a quicker and more aggressive easing cycle
- The period of positive net T-bill issuance is set to come to a seasonal close in early-September as we approach the corporate tax date. Longer-dated T-bills are trading at the cheap end of their recent range, but with issuance set to turn negative, dealer positions at average levels and our derivative colleagues biased toward wider swap spreads, we see scope for richening over the near term
Market views
The Treasury curve bullishly steepened this week, supported by the July FOMC minutes and Chair Powell’s speech at Jackson Hole, both of which read dovishly. The July minutes indicated the Committee’s confidence in inflation returning to 2% had increased, while in June, participants had emphasized the need to see more data. There was also heightened focus on the risk that continued easing in labor market conditions could transition to a more serious deterioration, and it’s no surprise in this context that participants saw the upside risks to the inflation outlook as moderating, while the downside risks to labor market weakening were increasing. Finally, “the vast majority observed that, if the data continued to come in about as expected, it would likely be appropriate to ease policy at the next meeting” (see July FOMC minutes highlighted labor market risks, Abiel Reinhart, 8/21/24).
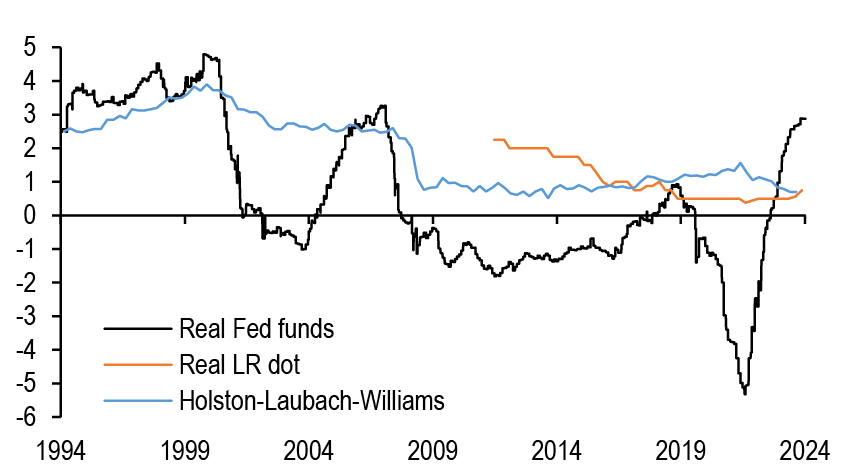
Chair Powell advanced the discussion further at Jackson Hole on Friday, saying “The time has come for policy to adjust. The direction of travel is clear, and the timing and pace of rate cuts will depend on incoming data, the evolving outlook, and the balance of risks.” This was a bit of a departure from speakers earlier this week who framed the expected pace of cuts as either “gradual” or “methodical.” What’s more, the balance of risks has shifted to the labor markets, as Powell offered, “We do not seek or welcome further cooling in labor market conditions.” Finally, the Chair stated, “The current level of our policy rate gives us ample room to respond to any risks we may face.” As we discussed last week, the real Fed funds rate is approximately 2.75%, a full 200bp above the Fed’s real longer-run dot. Using either the Fed’s longer-run dot (with data back to 2012) or the Holston-Laubach-Williams r* estimate, policy rates were negligibly restrictive in 2019, and only about 100bp restrictive in mid-1995 before the first cut, suggesting policy rates are highly restrictive ( Figure 9). Unsurprisingly, our monetary policy NLP read Powell’s speech as more dovish than his press conference at the July FOMC meeting, and his most dovish speech since the fall of 2021 ( Figure 10, also see Fed, Powell: Review and Outlook, Joseph Lupton, 8/23/24).
Figure 9: Policy is highly restrictive right now, underscoring Chair Powell’s point that there is “ample room to respond”...
Real Fed funds rate*, real longer-run median Fed dot, and Holston-Labach-Williams natural rate of interest rate; %
Source: J.P. Morgan, Federal Reserve bank of New York, Bloomberg Finance L.P
* Fed funds target less core PCE oya
Figure 10: ...and today scores as his most dovish speech in nearly 3 years
Jerome Powell Hawk-Dove history, using speeches, testimonies, and press conferences
Source: J.P. Morgan* For methodology, see Listen up: Upgrading J.P.Morgan’s central bank NLP machine, Joseph Lupton and Dan Weitzenfeld, 7/2/24
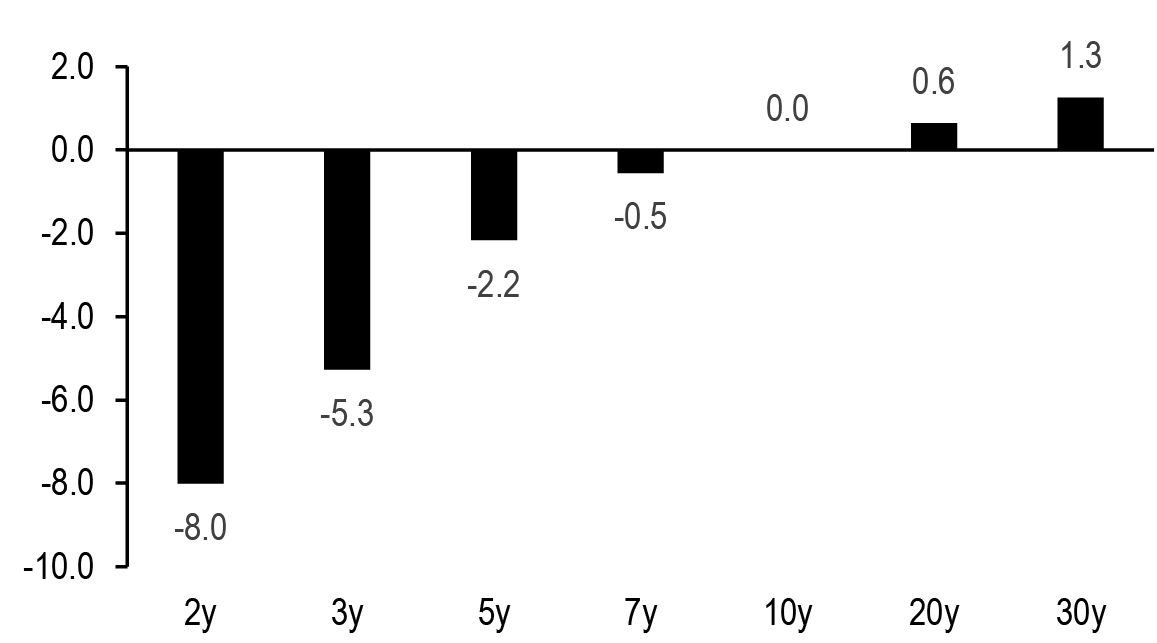
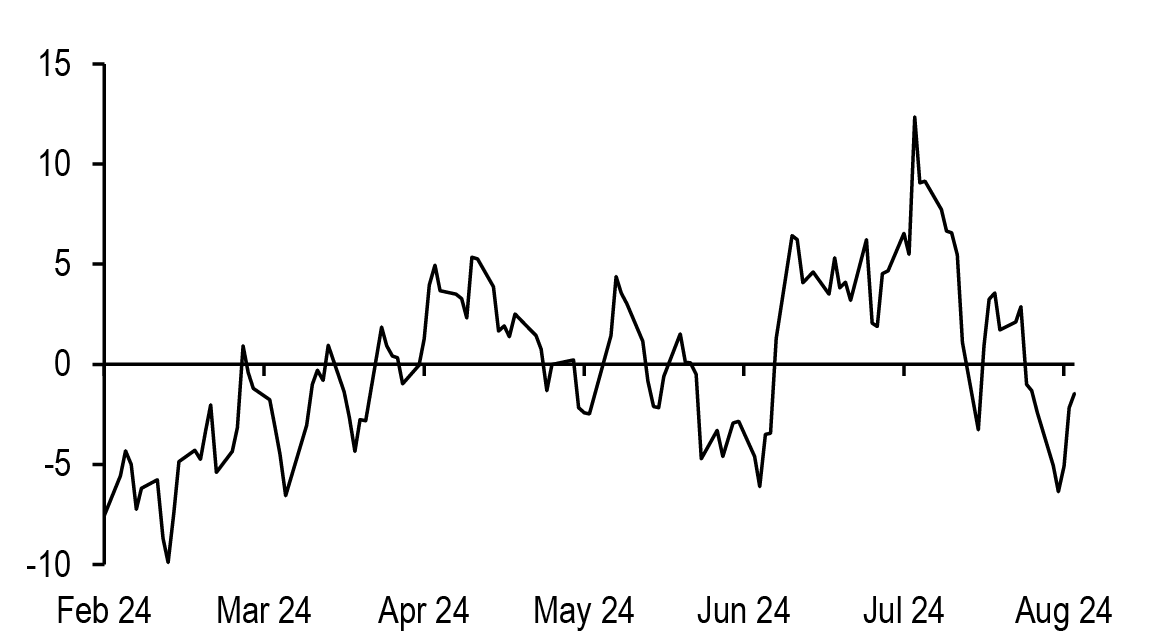
On the week, 2-, 5-, 10-, and 30-year yields declined 15bp, 12bp, 9bp, and 5bp, respectively. Considering the recent sensitivities of most points along the curve, the steepening is more pronounced than would be expected by the decline in front-end yields. Figure 11 shows that adjusting for the 3-month beta to changes in 10-year yields, the short- to intermediate sector strongly outperformed this week. However, we think some mean reversion is at work here. The primary driver of most curve slopes is the market’s medium-term Fed policy expectations, and late last week, the curve had flattened more than would be implied by the move in 2-year yields. With these moves, the curve appears more appropriately priced after adjusting for the level of 2-year yields ( Figure 12).
Figure 11: The front-end outperformed on a beta-adjusted basis this week...
Actual change in yields by sector over the past week minus the change implied by the 3-month beta with 10-year yields; bp
Source: J.P. Morgan
Figure 12: ...but we think this reflects mean reversion from flat levels
Residual of 5s/30s Treasury curve regressed on 2-year Treasury yields*; bp
Source: J.P. Morgan
*6-month regression. R-squared = 87.2%, SE = 4.2bp
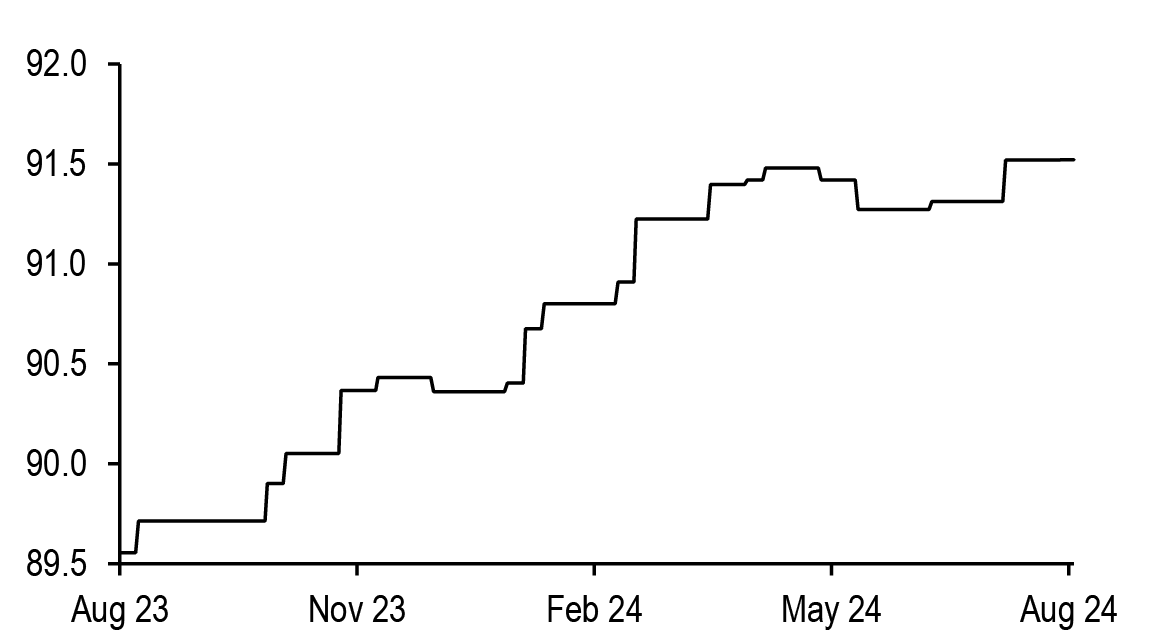
Looking ahead, we continue to forecast 50bp cuts in September and November and think Chair Powell’s comments today leave the door open to this outcome. Our forecast is driven by two different factors. First, the disinflationary process has resumed in a more broad-based fashion than observed in 2H23, considering there has been disinflation in core goods, services ex-shelter, and shelter. Second, the ongoing loosening of the labor markets has reduced the risk that services prices remain sticky to the upside. OIS forwards are pricing in approximately 103bp of easing over the balance of this year, versus our 125bp forecast, and this would indicate there is value to being long duration at current levels. However, the August employment report is still two weeks away, and validation of the weak July data will be needed to price in more aggressive easing this year. This is particularly important, as final demand remains strong, and our US FRI has moved higher, as we’ve recently revised up growth forecasts for the current quarter ( Figure 13). Thus, we do not think the debate about pace will be settled until the release of the August employment report on September 6.
Figure 13: Labor markets will be key in determining the pace of cuts, as our growth forecasts have been revised higher in recent weeks
J.P. Morgan US growth Forecast Revision Index;
Source: J.P. Morgan
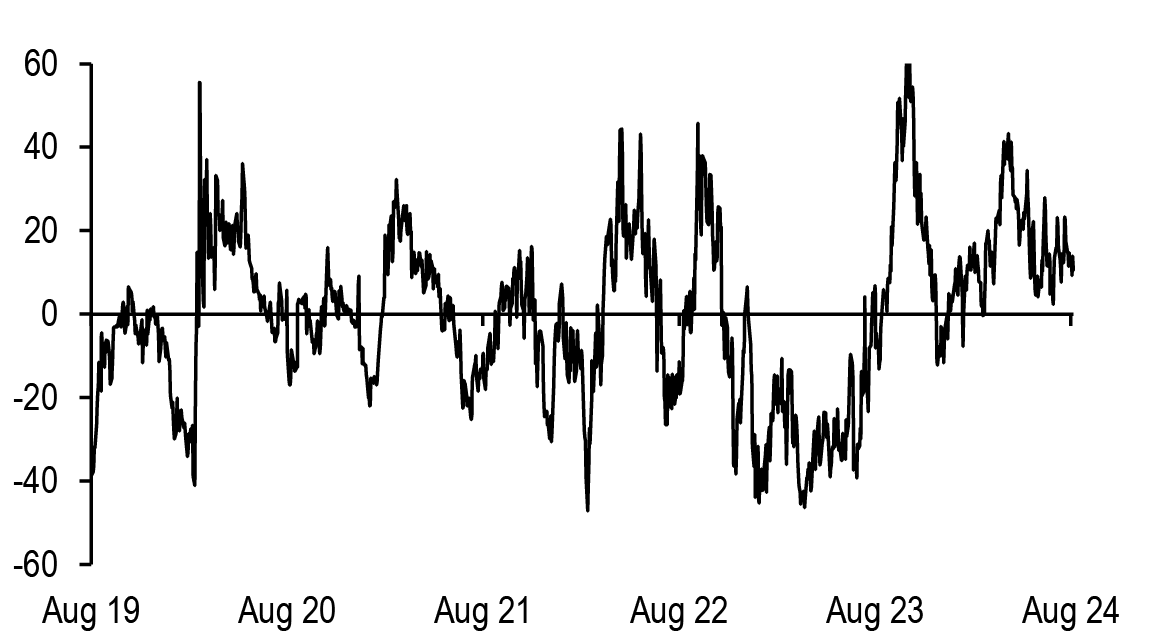
Figure 14: 10-year Treasuries are no longer cheap after adjusting for their fundamental drivers, and we think an overshoot to the downside is unlikely in an environment in which term premium is biased higher...
Residual of J.P. Morgan 10-year Treasury fair value model*; bp
Source: J.P. Morgan, Federal Reserve, US Treasury
* Regression of 10-year Treasury yields on 5Yx5Y seasonally-adjusted TIPS breakevens (%), 3m3m OIS rates (%), Fed policy guidance (months), J.P. Morgan US Forecast Revision Index (%), and SOMA share of outstanding marketable US Treasury debt, excluding T-bills (%). Regression over the last 5-years. R-squared = 97.8%, SE = 20.1bp
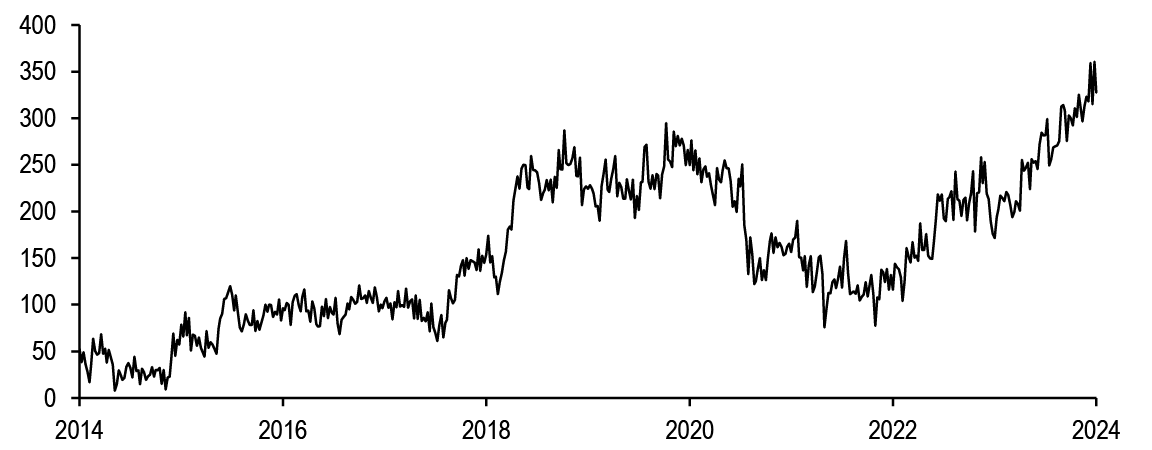
Valuations are relatively neutral as well, as yields in the intermediate sector no longer appear cheap to their fundamental drivers: Figure 14 shows 10-year Treasuries are fairly valued when controlling for their market’s medium-term Fed policy, inflation, and growth expectations. Given that the first expected cut is now less than a month away, one could argue there is room for yields to overshoot to the downside, but as the figure shows, Treasuries have not traded significantly rich relative to their drivers since “immaculate disinflation” was the market’s narrative in late 2023. Moreover, the current environment, in which the Treasury market continues to grow more rapidly than its traditional constituents of demand, term premium is biased higher, which should make it hard for valuations to overshoot the rich side of fair value (see In the eye of the beholder, 9/12/23). We can observe this dynamic to a certain extent in the evolution of primary dealer positions, which have increased nearly 30% in coupons this year, as more price sensitive demand has yet to appear ( Figure 15). Given this backdrop, we continue to recommend patience before adding duration, but given the sensitivity of the Fed’s reaction function to the labor markets, we will reevaluate as we get closer to the release of the August employment data.
Figure 15: ...which we think is reflected in the considerable rise in dealer positions over the last year
Primary dealer positions in Treasuries (excluding T-bills); $bn
Source: Federal Reserve Bank of New York
Powell’s comments and his implicit acknowledgment that policy is significantly restrictive validate the view that there is significant room to normalize policy rates from current levels, which should support further broad steepening. The periods just prior to and around the beginning of an easing cycle are supportive of long-end led steepening, and we believe this leaves further room for the long end to steepen from current levels. Moreover, our medium-term valuation framework also suggests there is value in steepeners at current levels as well: Figure 16 shows that the market’s medium-term Fed policy and inflation expectations, as well as the Fed’s ownership share of the Treasury market have been highly significant in explaining the variation in most Treasury curve pairs over the last three years. 5s/30s is flagging as fairly valued after controlling for these drivers, while curve pairs with the long leg anchored in 20s appearing too steep, reflecting the recent cheapening of this sector. Thus, we continue to recommend 5s/30s steepeners as the medium-term expression of our bullish view as we move into an easing cycle.
Figure 16: Our curve models indicate long-end steepeners with shorts anchored in 30s are fairly valued, while most front-end pairs appear too steep relative to their drivers, with the exception of 3s/7s
Statistics for various Treasury curves over the last 3 years, with statistics from 3-year regressions on 1y1y OIS (%), 5Yx5Y TIPS breakevens (%), and Fed share of the Treasury market (%); bp unless otherwise indicated
| Curve | Last | Min | Max | Avg | % | R^2 | Partial betas | Residual | Z-score | ||
| 1y1y OIS | 5y5y BE | Fed share | |||||||||
| 2s/5s | -26 | -78 | 78 | -17 | 59% | 73% | -0.30 | 0.65 | 0.02 | 3.6 | 0.2 |
| 2s/7s | -21 | -91 | 108 | -15 | 65% | 74% | -0.39 | 0.74 | 0.01 | 0.6 | 0.0 |
| 2s/10s | -11 | -109 | 129 | -17 | 70% | 75% | -0.47 | 0.82 | -0.01 | 2.6 | 0.1 |
| 2s/20s | 28 | -96 | 179 | 16 | 70% | 77% | -0.52 | 0.71 | -0.01 | 6.9 | 0.3 |
| 2s/30s | 19 | -119 | 184 | 2 | 73% | 81% | -0.59 | 0.82 | -0.03 | 3.0 | 0.1 |
| 3s/7s | -2 | -55 | 81 | -6 | 70% | 77% | -0.27 | 0.40 | -0.02 | -4.1 | -0.3 |
| 3s/10s | 8 | -76 | 103 | -8 | 77% | 79% | -0.35 | 0.47 | -0.03 | -2.1 | -0.2 |
| 3s/20s | 46 | -63 | 153 | 25 | 78% | 81% | -0.39 | 0.36 | -0.03 | 2.1 | 0.1 |
| 3s/30s | 38 | -86 | 158 | 11 | 81% | 86% | -0.47 | 0.47 | -0.05 | -1.8 | -0.1 |
| 5s/10s | 16 | -36 | 56 | 0 | 84% | 82% | -0.17 | 0.17 | -0.03 | -1.0 | -0.2 |
| 5s/20s | 54 | -23 | 109 | 34 | 84% | 77% | -0.21 | 0.06 | -0.03 | 3.3 | 0.4 |
| 5s/30s | 45 | -46 | 116 | 20 | 83% | 86% | -0.29 | 0.17 | -0.05 | -0.7 | -0.1 |
| 7s/10s | 10 | -21 | 23 | -2 | 90% | 83% | -0.08 | 0.08 | -0.02 | 2.0 | 0.7 |
| 7s/20s | 48 | -8 | 77 | 31 | 87% | 65% | -0.13 | -0.04 | -0.02 | 6.3 | 0.9 |
| 7s/30s | 40 | -37 | 85 | 17 | 86% | 83% | -0.20 | 0.08 | -0.03 | 2.4 | 0.3 |
| 10s/20s | 38 | 13 | 57 | 33 | 73% | 45% | -0.05 | -0.11 | 0.00 | 4.3 | 0.8 |
| 10s/30s | 30 | -18 | 63 | 19 | 79% | 76% | -0.12 | 0.00 | -0.02 | 0.4 | 0.1 |
Source: J.P. Morgan
Finally, most front-end pairs appear too steep and incur significantly negative carry as well. Thus, though steepeners like 2s/5s do outperform in more aggressive easing cycles, both valuations and the carry implications make these trades less attractive locally. However, among front-end pairs, 3s/7s looks too flat in this framework, and offers value for those who want to position for a quick and aggressive easing cycle.
T-bill update
Turning to the front end, T-bill net issuance has been positive for the last 7 weeks, and the stock of outstanding T-bills has risen by $290bn over the period. However, this period is coming to an end, and we forecast net T-bill issuance will turn negative in two weeks, in line with traditional seasonals ahead of the corporate and estimated tax deadline on September 16th. Figure 17 shows our weekly T-bill net issuance and TGA projections for the coming months, assuming Treasury hits the $5bn cap at each of the four cash management buyback operations scheduled for the September 5-25 period. Looking at the details, we expect one more week of outsized net issuance, as the $35bn CMB maturing September 12 settles next week, and look for 5 weeks of negative T-bill issuance into early October. Following this period, we project more than $125bn in net issuance between mid-October and mid-November.
Figure 17: T-bill issuance should turn negative in early-September, ahead of the corporate tax date
Net T-bill issuance* (lhs; $bn) versus TGA balance (rhs; $bn)

Source: US Treasury, J.P. Morgan
*Grey bars are J.P. Morgan forecasts
Figure 18: Longer-dated T-bills are near the cheaper end of their recent ranges…
T-bill/SOFR matched maturity spreads, current levels with 3-month statistics; bp unless otherwise indicated
| Maturity | Current | 3m chg | 3m high | 3m low | 3m avg | Percentile |
| 4-week | -7.1 | -3.6 | -3.2 | -13.3 | -6.6 | 37% |
| 8-week | -4.5 | -2.4 | 2.0 | -8.8 | -4.1 | 52% |
| 13-week | -1.7 | 0.6 | 2.3 | -6.5 | -2.8 | 75% |
| 17-week | 1.0 | 2.1 | 6.8 | -2.9 | -0.2 | 84% |
| 26-week | 5.2 | 6.5 | 8.0 | -7.1 | -0.1 | 87% |
| 52-week | 7.6 | 10.4 | 11.2 | -3.3 | 3.0 | 84% |
Source: J.P. Morgan
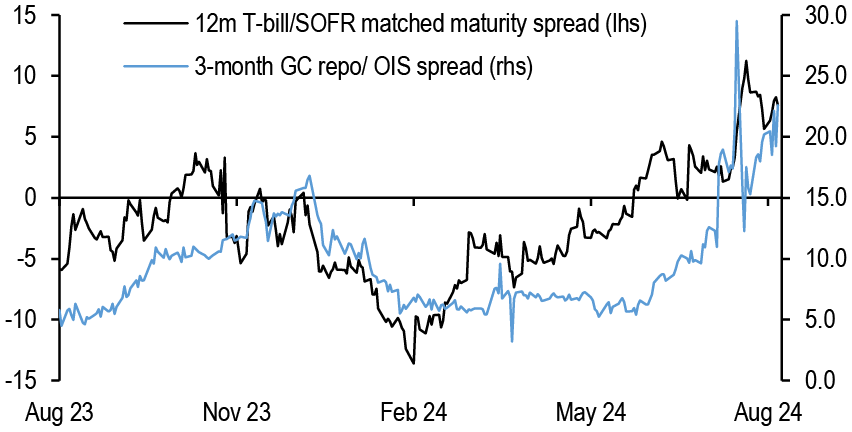
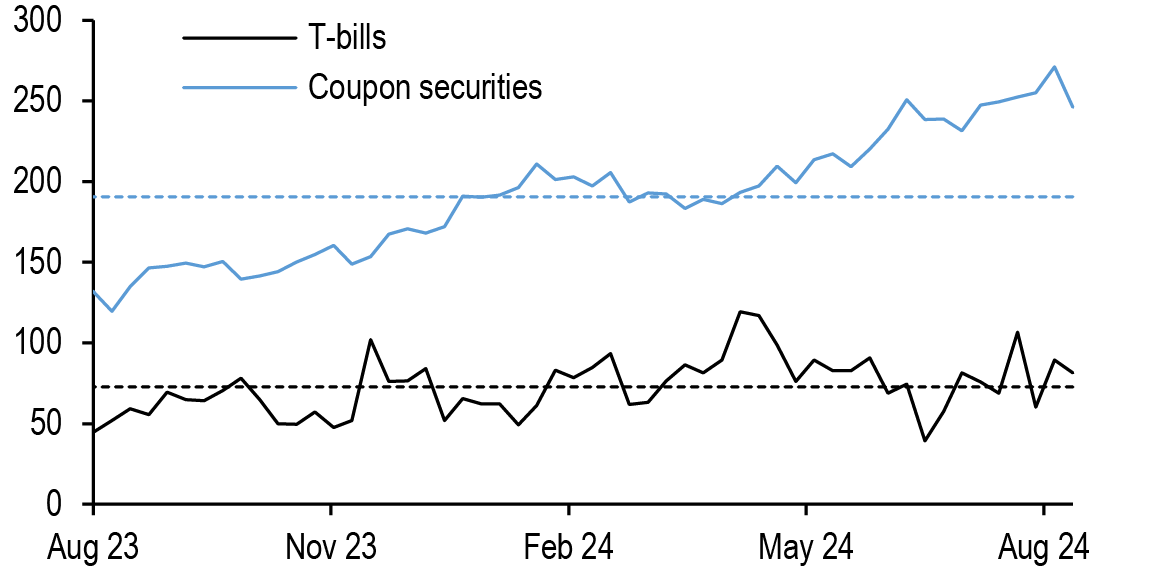
This issuance pattern should be marginally supportive for valuations in the weeks ahead. However, we would note the upcoming reductions should be concentrated in shorter-maturity T-bills. This is important because while 3- to 12-month T-bills are now trading near the cheaper end of their 3-month ranges, this is not the case for 1- and 2-month bills, which remain closer to the middle of the ranges that have persisted over the last three months ( Figure 18). Taking a step back, the cheapening in longer-dated bills should not be surprising given the recent widening in GC/OIS spreads, which we tend to view as a proxy for dealer financing costs ( Figure 19). As discussed earlier, primary dealer positions in Treasuries have risen sharply YTD, which helps explain the cheapening of Treasuries on spread to SOFR, but T-bill inventories have remained relatively stable, and most of this accumulation has occurred in coupon securities ( Figure 20). Moreover, our colleagues in derivatives strategy continue to recommend swap spread wideners at the front end. Given these dynamics, we see some room for longer-dated bills to richen from current levels over the coming weeks.
Figure 19: ...and have cheapened alongside the widening of GC/OIS spreads
12-month T-bill/ SOFR matched-maturity spread (lhs) versus 3-month GC repo/ OIS spread; bp
Source: J.P. Morgan
Figure 20: Primary dealer Treasury holdings have risen over the last year, but not in T-bills
Primary dealer positions in Treasuries*; $bn
Source: Federal Reserve Board of New York *Latest data as of as of 8/14/2024
Dashed lines represent 1-year averages
Trade recommendations
- Maintain 5s/30s steepeners
- Stay long 100% risk, or $112mn notional of T 4.875% Oct-28s
- 100% risk, or $29.9mn notional of T 4.75% Nov-53s
- (US Treasury Market Daily, 11/22/23: P/L since inception: 17.4bp)
- Maintain 75%/6% weighted 5s/10s/30s belly-cheapening butterflies
- Stay long 75% risk, or $43mn notional of T 4.625% Sep-28s
- Stay short 100% risk, or $33.3mn notional of T 3.875% Aug-33s
- Stay long 6% risk, or $1mn notional of T 4.125% Aug-53s
- (US Fixed Income Markets Weekly, 9/29/23: P/L since inception: -6.7bp)
- Maintain 23:84 weighted 2s/7s/10s belly-richening butterflies
- Stay short 23% risk, or $28mn notional of T 4.375% Jul-26s
- Stay long 100% risk, or $40.2mn notional of T 4.125% Jul-31s
- Stay short 84% risk, or $23mn notional of T 3.875% Aug-34s
- (US Treasury Market Daily, 8/21/24: P/L since inception: -0.4bp)
Figure 21: Closed trades in last 12 months
P/L reported in bp of yield unless otherwise indicated
| TRADE | ENTRY | EXIT | P/L |
| Duration | |||
| 5-year duration longs | 08/04/23 | 09/08/23 | -27.6 |
| 5-year duration longs | 10/03/23 | 11/02/23 | 14.9 |
| 7-year duration shorts | 11/03/23 | 11/22/23 | -7.9 |
| 30-year duration shorts | 12/15/23 | 01/04/24 | 10.9 |
| 5-year duration longs | 01/19/24 | 02/01/24 | 25.3 |
| 5-year duration longs | 02/09/24 | 03/07/24 | 3.3 |
| Equi-notional 2s/5s flatteners | 05/31/24 | 06/06/24 | 16.0 |
| 5-year duration shorts | 06/14/24 | 07/01/24 | 21.9 |
| 30% 2-year duration short | 07/12/24 | 07/31/24 | -1.8 |
| Curve | |||
| 10s/30s steepener | 12/16/22 | 09/29/23 | 3.0 |
| 10s/30s steepener | 11/03/23 | 11/22/23 | -7.3 |
| 2s/5s flatteners | 12/08/24 | 05/17/24 | 6.0 |
| Relative value | |||
| 100:96 weighted 3.5% Feb-39 / 3.75% Nov-43 flatteners | 07/28/23 | 08/16/23 | 3.2 |
| 2.75% Aug-32/ 3.5% Feb-39 steepeners | 01/10/24 | 01/26/24 | 5.2 |
| 20s/ old 30s flatteners | 02/15/24 | 05/10/24 | -2.6 |
| 100:97 weighted 3.75% Apr-26/ 4.625% Sep-26 flatteners | 04/12/24 | 05/17/24 | 2.2 |
| 100:95 weighted 4% Feb-28 / 4% Feb-30 steepeners | 02/23/24 | 05/31/24 | -6.6 |
| 50:50 weighted 3s/5s/7s belly-richening buterflies | 03/15/24 | 06/14/24 | 2.1 |
| 100:98 weighted 4.75% Feb 37s / 4.5% Aug 39s steepeners | 06/14/24 | 07/12/24 | 2.6 |
| 100:95 weighted 0.625% Jul-26s / 1.25% Dec-26s steepeners | 07/12/24 | 08/14/24 | 1.5 |
| Number of positive trades | 14 | ||
| Number of negative trades | 6 | ||
| Hit rate | 70% | ||
| Aggregate P/L | 64.3 |
Source: J.P. Morgan
Technical Analysis
- The spread between market-implied terminal easing rate and market-implied neutral has traded in a range over the past 24-months, where the market has been unwilling to price the policy rate more than 30-50bp through implied neutral. In the past three cycles, the front-end pricing breakouts coincided with trends to higher jobless claims...
- ...Regardless of the macro-fundamental driver, the bullish consolidation richer than the 4.115-4.20% initial support zone continues to favor a positive bias and technical view that looks for an eventual breakout in late-2024 or early-2025….
- Along with the shape of the OIS curve and 2-year note pattern neckline at 3.555-3.65%, we are also focused on the -20bp through -15bp area on the 2s/5s curve chart. That has marked a barrier for multiple quarters to what we believe to be a cycle bottom pattern. We see a asymmetric risk-reward setup heading into the latter months of the year and early-2025 in favor of a breakout and transition to an aggressive steepening trend.
- The 5-year note continues to bullishly consolidate after the mid-summer acceleration to lower yields. We expect the 3.885-4.02% support zone to cap yields through late summer. A break through 4.15-4.20% is needed to derail the bullish pattern structure at this point. The rally stalled near the 3.50% Oct-Apr equal swings objective and the associated channel trend line, now at 3.475. We suspect that area will act as resistance for a few weeks but give way later in the year or into 2025.
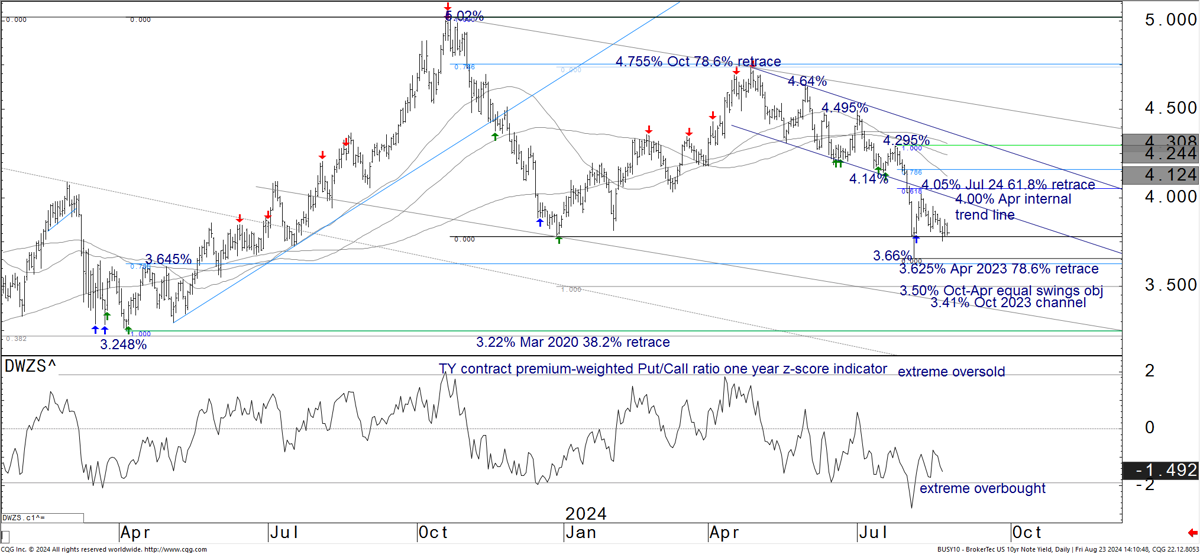
- The 10-year note yield bullishly consolidates behind the 3.625% Apr 2023 78.6% retrace and in front of key support at 4.02-4.14%. We expect those two zones to define the trading range into the early fall. The next zone of chart resistance sits at 3.22-3.248%, targets for later this year or early 2025.
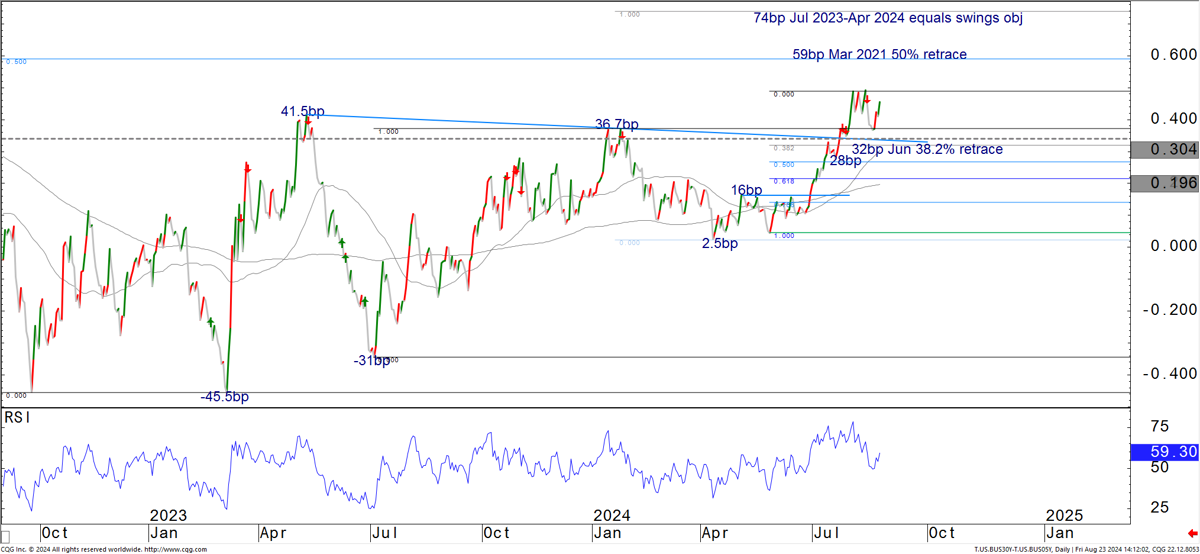
- Look for continued 5s/30s curve range trading below the 59bp Mar 2021 50% retrace and above the 28-32bp support zone in the weeks ahead. We think that range will consolidate the breakout from the 2022-2024 base pattern and give way to a more aggressive steepening trend in the months ahead.
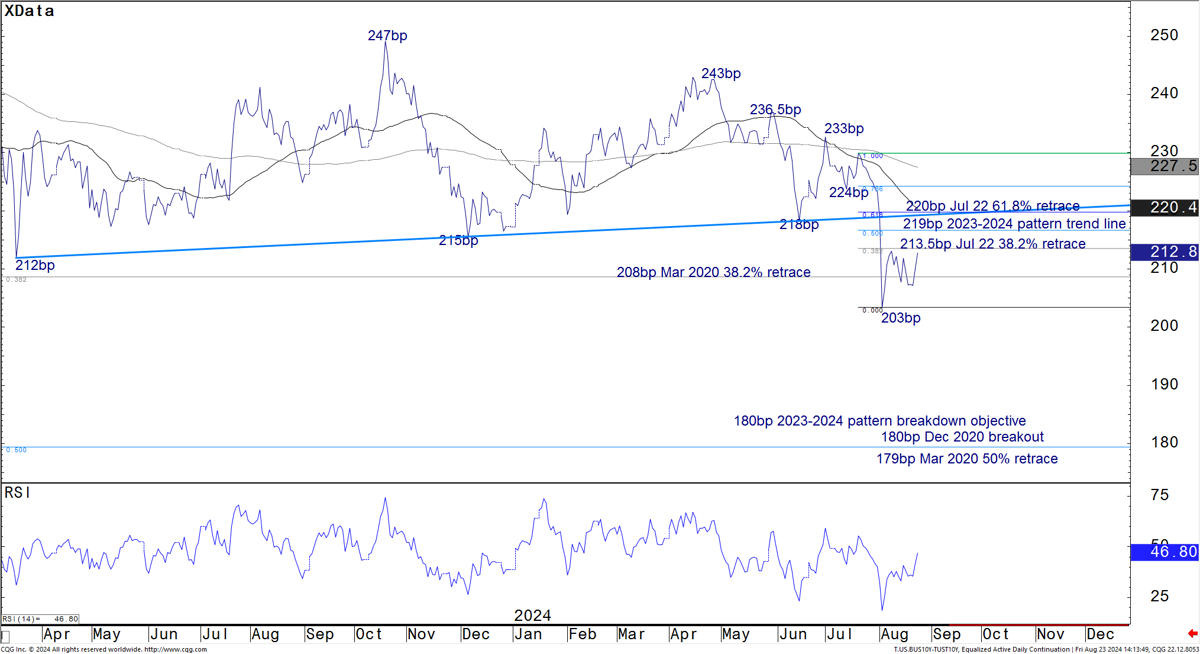
- 10-year TIPS breakevens widen back into the 212-220bp resistance zone following the dovish Fed messaging. We are looking for breakevens to falter in that area again and for that reversal to set the market up for renewed tightening pressure into the Sep-Oct period of seasonal weakness for risky markets. Look for a retest of the 200bp area over that period.
US
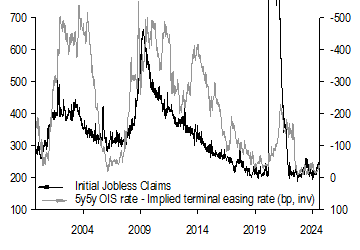
Treasuries continue to trade in what look like bullish consolidation patterns across the entire duration spectrum as the Fed validates the recent dovish repricing. The Aug flight-to-quality rotation helped propel the 2-year note back toward the low yields realized early last year in the aftermath of two bank failures. Likewise, that as the money market curve adjust to nearly match the dovish extremes achieved over the past two years, with more than 230bp of total eases priced for the cycle, and the terminal easing rate priced more than 30bp through market-implied neutral. Across the board, front-end pricing tagged chart levels that now define the necklines of multi-quarter reversal patterns. Beyond the importance those key thresholds represent on the charts from a pattern perspective, the threshold on money market curve charts also represented key bifurcation zones during the cycles since the mid-1990s and when we have OIS markets to analyze. The spread between 5y5y OIS rate levels (market-implied neutral) and the forwards priced terminal easing rate has a loose inverse correlation with initial jobless claims historically ( Figure 22). While claims have been well-anchored below 260K during most of the post-COVID recovery and expansion, the spread between market implied neutral and the expected terminal easing rate has also been range bound. In each of the three slowdowns over the observed period, the money market curve not only tracked claims higher, but the market transitioned to an aggressive trending regime once it broke out.
Figure 22: The spread between market-implied terminal easing rate and market-implied neutral has traded in a range over the past 24-months, where the market has been unwilling to price the policy rate more than 30-50bp through implied neutral. In the past three cycles, the front-end pricing breakouts coincided with trends to higher jobless claims...
Initial jobless claims (sa, 1000s, left scale), spread between 5y5y OIS rate and OIS implied terminal easing rate (bp, inverted, right scale)
Source: J.P. Morgan
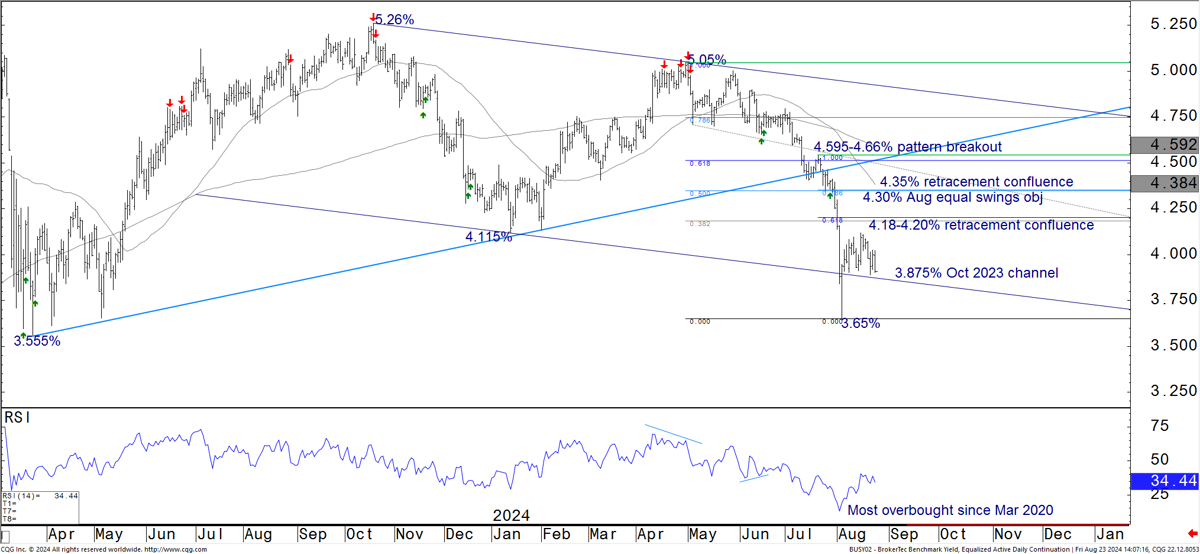
Regardless of the driver, the bullish consolidation on duration and yield curve charts favor an eventual release to lower yields and bull steepening breakouts in the months ahead. For the 2-year note, that bullish consolidation has unfolded richer than the 4.115% Jan yield low and 4.18-4.20% Fibonacci retracement confluence ( Figure 23). Another group of levels rests at 4.30-4.35%. The more mixed data in recent weeks leaves a backup to that second zone as a possibility, especially if the u-rate retraces some of the recent rise with the early-Sep data. The market would need to back up through the 4.595-4.66% breakout area to completely nullify the bullish trend dynamics, levels we do not see getting tested going forward. To lower yields, tactical bulls would regain traction with a break through 3.88% for another run at the 3.65% Aug extreme.
Figure 23: Regardless of the macro-fundamental driver, the bullish consolidation richer than the 4.115-4.20% initial support zone continues to favor a positive bias and technical view that looks for an eventual breakout in late-2024 or early-2025...
2-year note yield, daily bars with momentum divergence signals; %
Source: J.P. Morgan, CQG
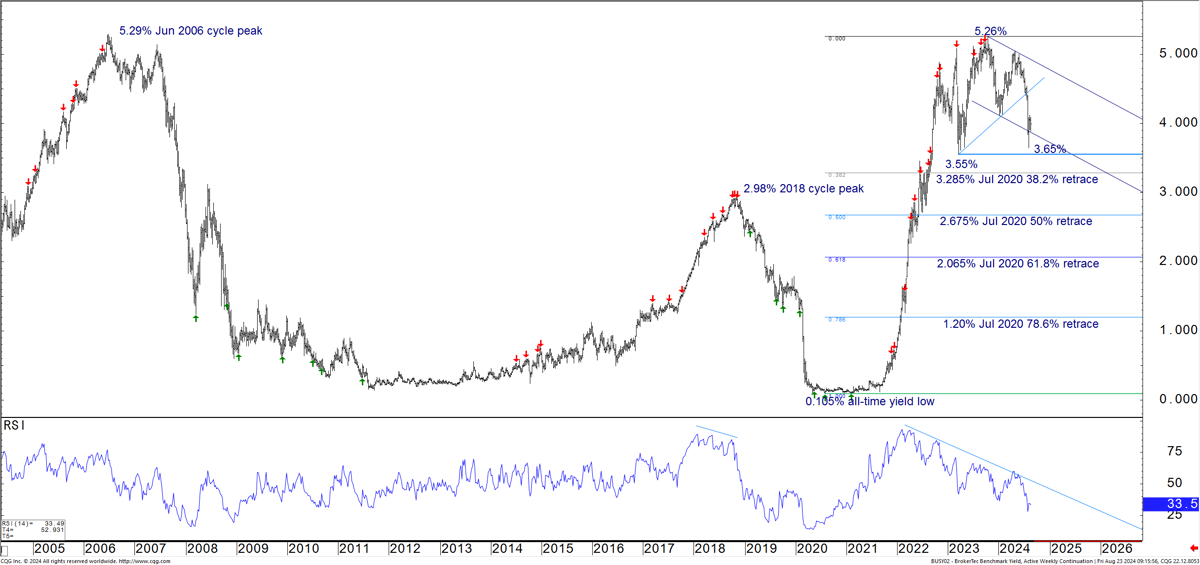
Bigger picture, the weekly and monthly time-frame momentum divergence buy signals that triggered in 2022-2023, the yield curve breakouts, late-cycle signals across other markets like USD/JPY, and recent bullish impulses to lower yield levels leave us viewing the entire 2023-2024 price action as large bullish reversal patterns ( Figure 24). We expect the front-end to pressure those levels into the fall and eventual break richer into early-2025. Initial breakout resistance rests at the 3.285% Jul 2020 38.2% retrace and 2.98% 2018 cycle cheap.
Figure 24: … The lower-frequency bullish momentum divergence signals that triggered through late-2022 and 2023, the recent impulsive bullish price action, and steepening breakouts on yield curve charts all suggest the entire late-2022 through 2024 2-year note pattern represents a large bullish trend reversal.
2-year note yield, weekly bars with momentum divergence signals; %
Source: J.P. Morgan, CQG
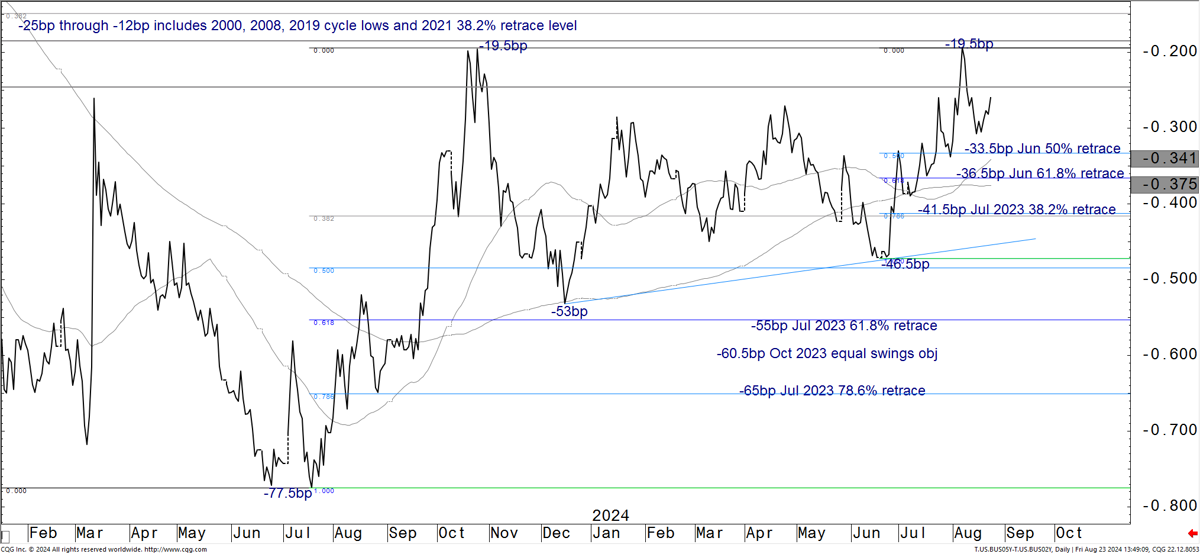
Similar to the key thresholds noted above, the 2s/5s curve has kept the area between -25bp and -12bp under steepening pressure this summer. That not only marks the upper-end of the 2023-2024 base pattern, but was also the 1989, 2000, 2006, and 2019 cycle troughs ( Figure 25). Given the dynamics identified in the money market curve pricing in prior cycles, we suspect a 2s/5s curve breakout above that area will mark the transition to an aggressive steepening trend, so we’ve added a stop-in strategy to our list of long duration proxies in the trade strategy section. On the downside, the recent corrective flattening held above support at the -33.5bp Jun 50% retrace, -34bp 50-day moving average, -36.5bp Jun 61.8% retrace, and -37.5bp 200-day moving average. We see the -41.5bp Jul 2023 38.2% retrace as a likely floor going forward.
Figure 25: Along with the shape of the OIS curve and 2-year note pattern neckline at 3.555-3.65%, we are also focused on the -20bp through -15bp area on the 2s/5s curve chart. That has marked a barrier for multiple quarters to a what we believe to be a cycle bottom pattern. We see a asymmetric risk-reward setup heading into the latter months of the year and early-2025 in favor of a breakout and transition to an aggressive steepening trend.
2s/5s curve, daily closes; bp
Source: J.P. Morgan, CQG
Figure 26: The 5-year note continues to bullishly consolidate after the mid-summer acceleration to lower yields. We expect the 3.885-4.02% support zone to cap yields through late summer. A break through 4.15-4.20% is needed to derail the bullish pattern structure at this point. The rally stalled near the 3.50% Oct-Apr equal swings objective and the associated channel trend line, now at 3.475. We suspect that area will act as resistance for a few weeks but give way later in the year or into 2025.
5-year note, daily bars with momentum divergence signals; %

Source: J.P. Morgan, CQG
Figure 27: The 10-year note yield bullishly consolidates behind the 3.625% Apr 2023 78.6% retrace and in front of key support at 4.02-4.14%. We expect those two zones to define the trading range into the early fall. The next zone of chart resistance sits at 3.22-3.248%, targets for later this year or early 2025.
10-year note yield, daily bars with momentum divergence and TY premium-weighted Put/Call z-score signals; %
Source: J.P. Morgan, CQG, CME
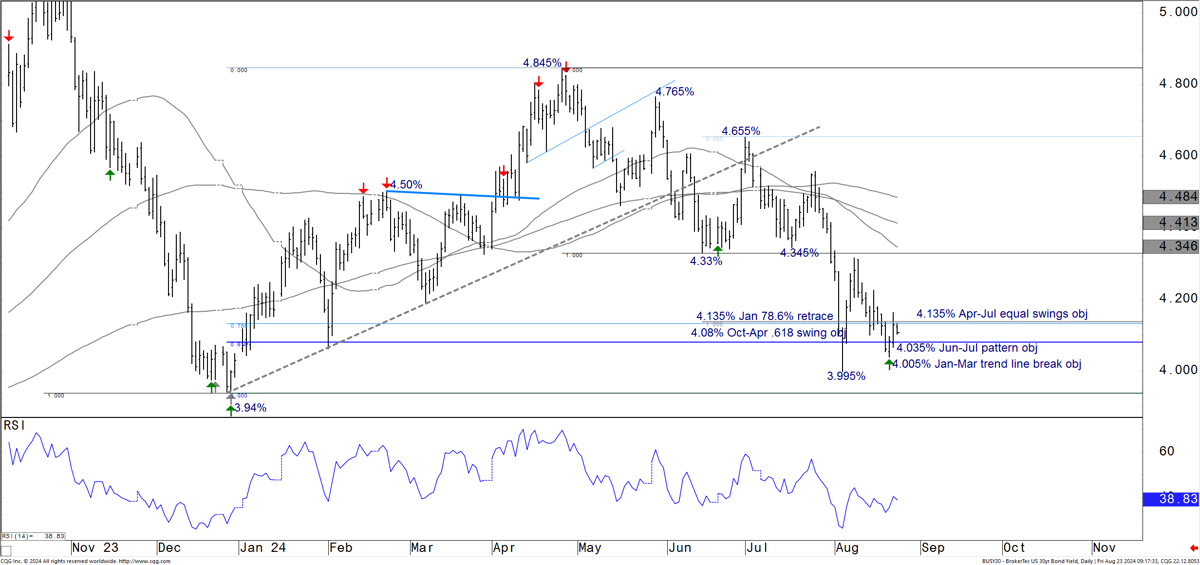
Figure 28: The 30-year bond bullishly consolidates richer than the 4.33-4.345% Jun-Jul pattern riches and in front of the 4.40-4.50% confluence of moving averages. Look for further coiling around the 4.00% area in the weeks ahead.
30-year bond yield, daily bars with momentum divergence signals; %
Source: J.P. Morgan, CQG
Figure 29: Look for continued 5s/30s curve range trading below the 59bp Mar 2021 50% retrace and above the 28-32bp support zone in the weeks ahead. We think that range will consolidate the breakout from the 2022-2024 base pattern and give way to a more aggressive steepening trend in the months ahead.
5s/30s curve, daily closes; bp
Source: J.P. Morgan, CQG
Figure 30: 10-year TIPS breakevens widen back into the 212-220bp resistance zone following the dovish Fed messaging. We are looking for breakevens to falter in that area again and for that reversal to set the market up for renewed tightening pressure into the Sep-Oct period of seasonal weakness for risky markets. Look for a retest of the 200bp area over that period.
10-year TIPS breakevens, daily closes; bp
Source: J.P. Morgan, CQG
This report was excerpted from Global Fixed Income Technical, Jason Hunter, August 23, 2024
TIPS Strategy
Fed shift sets more supportive foundation for TIPS
- Intermediate breakevens remain cheap to our fair value framework, though the model residual narrowed on Friday, given a dovish shift from Fed Chair Powell
- In recent months, the Fed’s wavering confidence in disinflation and thus a heightened focus on labor market data created a less supportive backdrop for TIPS, with real yields demonstrating lower sensitivity to nominal yields in rallies than in sell-offs. However, we argue that the backdrop is becoming more supportive for TIPS once again...
- ...Chair Powell stated that his “confidence has grown” on the inflation front, while the Committee is now committed to dialing back policy restriction to support strong labor markets
- Along the curve, the intermediate sector continues to offer value, and forward-starting swaps avoid the negative carry associated with spot breakeven positions. IOTAs broadly remain tight across the curve, although we acknowledge this is particularly so at the front end, and we think there’s room for the IOTA curve to flatten
- With the fundamental backdrop turning more supportive and valuations still cheap, albeit somewhat less cheap than a week ago, we maintain tactical long exposure in 5Yx5Y inflation swaps
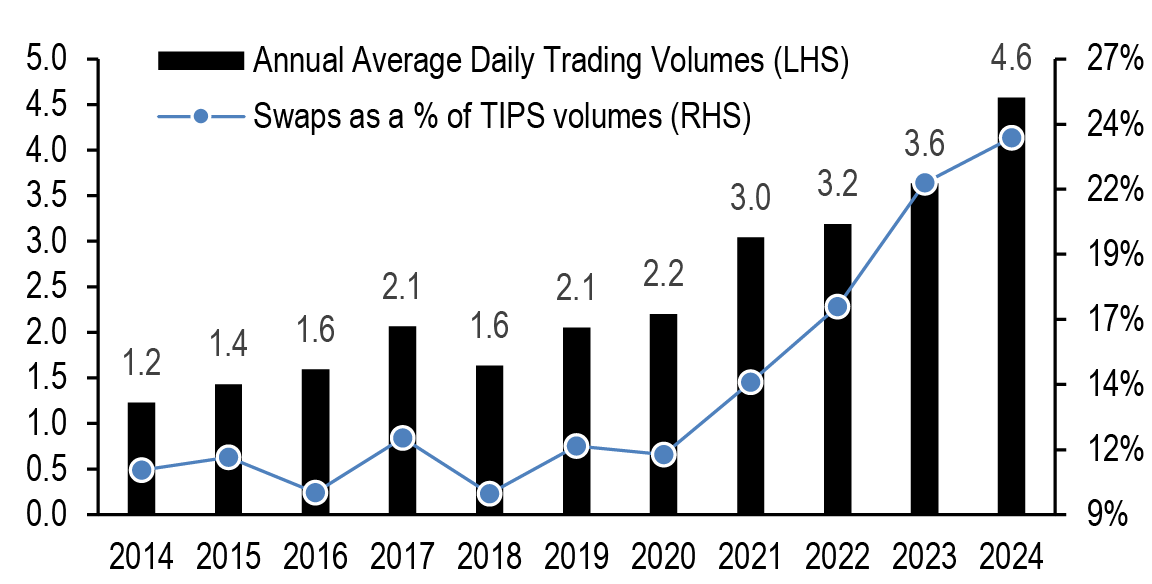
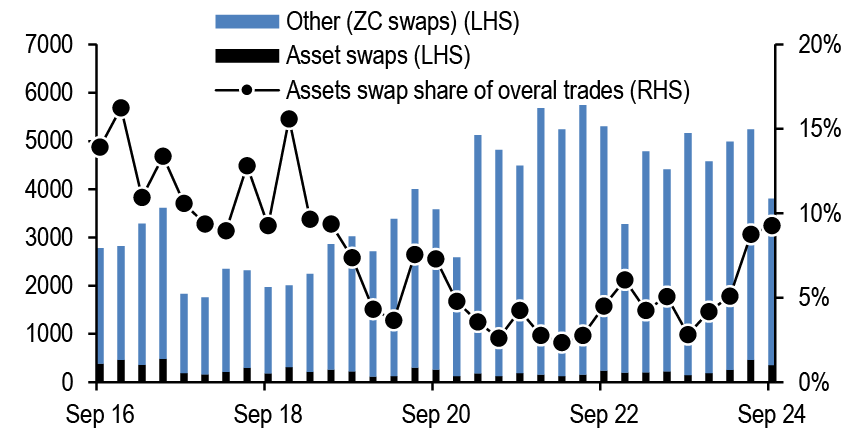
- Inflation swap daily average trading volumes have risen 25% to $4.6bn YTD, now comprising 23.5% of TIPS trading volumes. Much of this rise has occurred in recent months and coincides with a significant increase in the asset swap share of overall inflation swap transaction volumes, to 9% in the current quarter
Market views
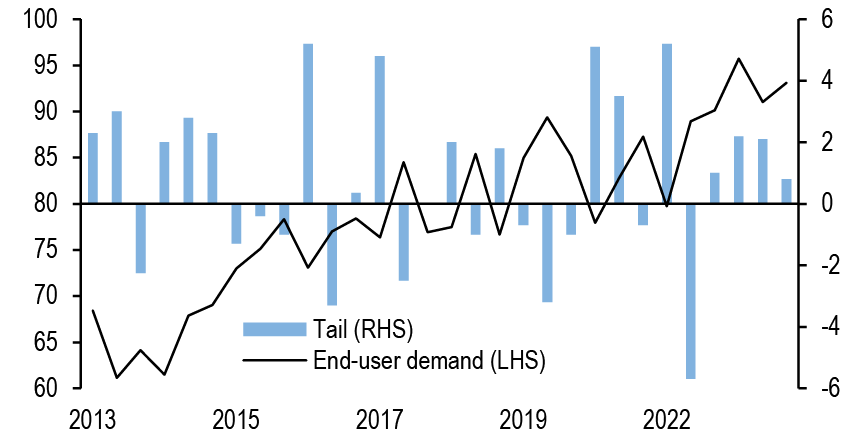
Over the past week, TIPS initially underperformed, but more than recovered over the second half of the week, leaving breakevens 3bp wider across the curve, as jobless claims were stable, Thursday’s 30-year TIPS reopening auction was well-received, and Chair Powell delivered dovish remarks at Jackson Hole. Specifically, the supply cleared just 0.8bp cheap to pre-auction levels, and end-user demand rose to 93.1%, the second highest takedown on record ( Figure 31). With little in the way of inflation news this week, focus was squarely on the labor market data and commentary from Fed officials, including the minutes from the July FOMC meeting. Though the preliminary estimate of the 2024 benchmark for the establishment survey showed total payroll employment was 818K lower than previously thought, a larger revision than we estimated, it is difficult to say exactly how the Fed will interpret it, given that the revision cuts off in March 2024 and the implications for more recent months are not fully clear (see US: Benchmark brings big downward revision to (lagged) jobs, Abiel Reinhart, 8/21/24). Meanwhile, jobless claims rose only slightly in the week ending Aug 17, which is the payroll survey week. Relative to the July survey week, initial claims are down 13k and the four-week average is essentially unchanged, so claims at least aren’t suggesting another step down in job growth for August (see US: Good news from mostly stable jobless claims, Abiel Reinhart, 8/23/24). Overall, the economic data leave us comfortable with the view that data is softening only slowly, with recession risks still relatively low.
At the same time, Fedspeak this week confirmed the Committee is ready to begin cutting at the next meeting, even if the pace of cuts is likely to depend on the incoming data. The July FOMC meeting minutes skewed dovish and showed a Committee more focused on labor market risks than the possibility of a renewed jump in inflation. Importantly, “several” participants had contemplated cutting 25bps at the last meeting, and it was already the case that a “vast majority” were ready to cut at the September meeting, even before the July employment report. Over much of the week, more timely commentary from Fed speakers were perceived as somewhat more hawkish, offering support for a “gradual” or “methodical” pace of cuts. However, Powell's remarks at the Jackson Hole Symposium were the main event of the week, as the Chair stated “the time has come” to adjust interest rates and that the Committee does “not seek or welcome further cooling in labor market conditions.” Whether the FOMC cuts 25bps or 50bps at the September meeting still hinges on the next monthly employment report, though Powell’s comments arguably lower the bar for the Fed to deliver a 50bp cut next month (see Cuts are coming, Michael Feroli, 8/23/24).
Figure 31: End-user demand at Thursday’s TIPS auction was the second highest on record
End-user demand* at 30-year TIPS auctions (%, LHS) versus tail (bp, RHS)
Source: J.P. Morgan
*Reflects direct and indirect bidder participation
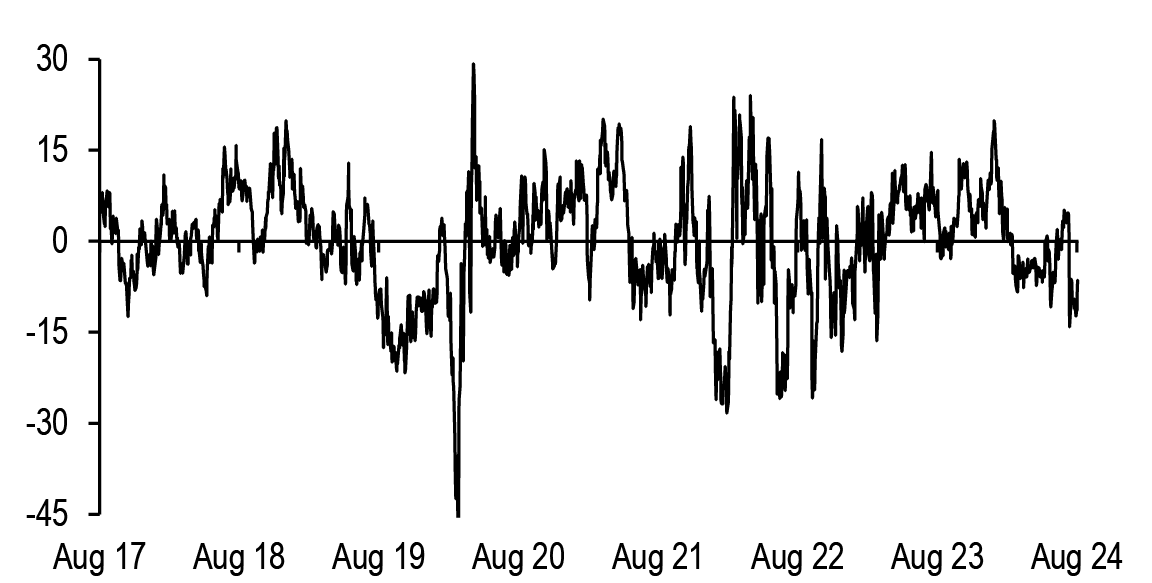
Figure 32: Breakevens remain cheap to our fair value estimate, though the residual narrowed late in the week
Residual on J.P. Morgan 10-year breakeven fair value model*; bp
Source: J.P. Morgan
*1m-forward, seasonally-adjusted breakevens are regressed on the J.P. Morgan Commodity Curve Index (JPMCCI) as well as its square and the 3mx3m/15mx3m OIS curve; regression over the last 7years; R2=93%, SE=9bp
Against this backdrop, breakevens outperformed versus our fair value framework over the week: Figure 32 shows 10-year breakevens now appear roughly 7bp too narrow on this basis, with the residual nearly cut in half over recent sessions. As we look ahead, we think there is room for inflation to outperform further versus other macro markets, particularly given the shift in Fed reaction function articulated by Chair Powell on Friday. As we argued last week, the performance of TIPS as we approach the upcoming easing cycle is likely to depend crucially on the context in which the Fed is lowering policy rates (see TIPS Strategy, 8/16/24).
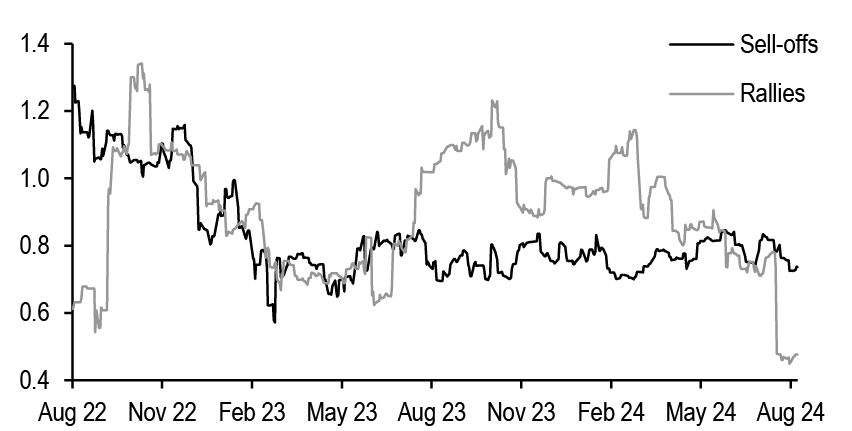
Taking a step back, recall that the Fed reaction function earlier this year made TIPS an attractive way to position long duration, given asymmetric risk/reward. Indeed, for much of the past year the primary risk to Fed expectations was further unanticipated stickiness in inflation, while on the flip side, “immaculate disinflation” suggested the Fed could ease more quickly, even without significant weakening in economic growth. In this environment, real yields exhibited a higher beta to nominal yields in rallies than in sell-offs ( Figure 33). However, this relationship shifted into the summer, as the Fed’s confidence in disinflation waned, which put greater emphasis on evidence of cooling labor markets ( see TIPS Strategy, 6/14/24). Thus, unsurprisingly, Figure 34 shows that the asymmetry of nominal yield betas shifted in the other direction in recent months, punctuated by the sharp underperformance of TIPS as yields fell in the aftermath of the July employment report. Similarly, with uncertainty on labor market and growth back in the driver’s seat, this shift also corresponded with a negative stock-bond correlations reasserting itself. At this juncture, however, with Chair Powell stating that his “confidence has grown that inflation is on a sustainable path back to 2%” and the Committee intending to dial back policy restraint “to support a strong labor market,” TIPS are likely once again to be a more attractive instrument for investors looking to add duration.
Figure 33: In contrast to the dynamic observed for much of the last year, when real yields were more sensitive to nominal yields in rallies...
Rolling 3-month betas of changes in 5-year real yields with respect to changes in nominal yields in nominal rallies versus sell-offs;
Source: J.P. Morgan
Figure 34: ....real yields have exhibited reduced sensitivity to nominal yields in rallies in recent months
Statistics for daily changes in breakevens and real yields regressed on daily changes in nominal yields, run separately for rallies and sell-offs in nominal Treasuries, for the last 3 months
| Sell-offs | Rallies | ||||
| Tenor | Beta | R-sqr | Beta | R-sqr | |
| Breakevens | 5 | 0.26 | 25% | 0.52 | 54% |
| 10 | 0.31 | 40% | 0.52 | 51% | |
| 30 | 0.33 | 47% | 0.46 | 46% | |
| Real yields | 5 | 0.74 | 73% | 0.48 | 49% |
| 10 | 0.69 | 76% | 0.48 | 48% | |
| 30 | 0.67 | 78% | 0.54 | 54% | |
Source: J.P. Morgan
With the fundamental backdrop turning more supportive and valuations still cheap, albeit somewhat less cheap than a week ago, we maintain tactical long exposure in 5Yx5Y inflation swaps. Along the curve, the intermediate sector continues to offer value versus the wings, and forward-starting swaps avoid the negative carry associated with spot breakeven positions in the current environment. Meanwhile, IOTAs broadly remain tight across the curve, although we acknowledge this is particularly so at the front end, and we think there’s room for the IOTA curve to flatten from current levels.
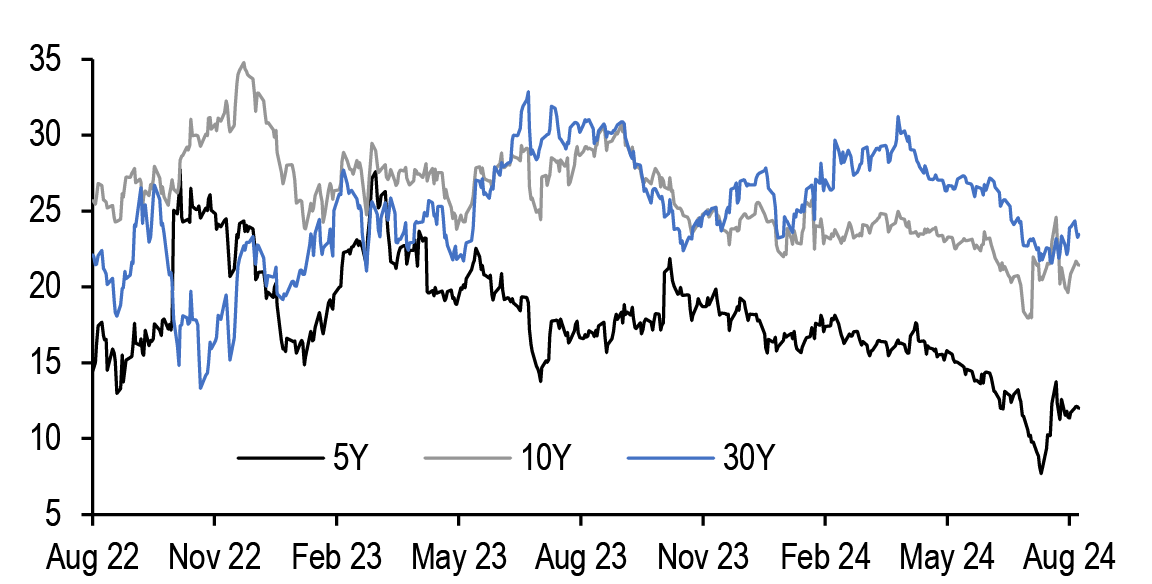
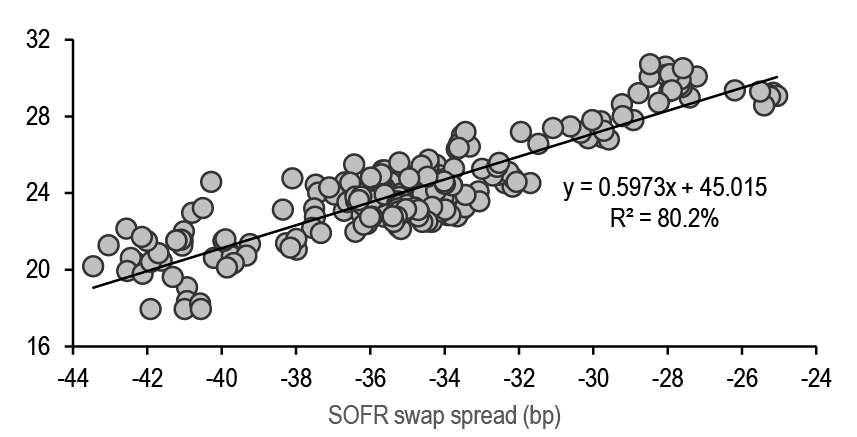
Figure 35 shows that though IOTAs widened in the aftermath of the July payrolls release, they have partially retraced narrower over the last couple of weeks, with the exception of the long end. While the front end through intermediate sectors have likely been supported by ongoing TIPS asset swap demand (discussed further below), the imminent end of the Fed-on-hold period suggests an environment that will be less ripe for carry trading. Additionally, Figure 36 shows that IOTAs have demonstrated an increased sensitivity to SOFR swap spreads over the past year, with swap spreads explaining more than 80% of the variability in 10-year IOTAs over the period. Our interest rate derivative strategists continue to argue for a flatter SOFR swap spread curve, given that ongoing QT and heavy net Treasury supply suggest higher term funding premium (TFP), and front-end spreads continue to appear substantially tight versus fair value (see Interest Rate Derivatives, Srini Ramaswamy, 8/16/24). While these considerations suggest there is more room for IOTA widening at the front end of the curve, we prefer to hold long exposure in inflation swaps relative to cash breakevens. Overall, we maintain longs in 5Yx5Y inflation swaps.
Figure 35: Following a brief widening earlier this month, IOTAs are back to pre-payrolls levels
IOTAs (derived from z-spread differentials) for hot run TIPS; bp
Source: J.P. Morgan
Figure 36: Over the past year, IOTAs have demonstrated a strong relationship with nominal swap spreads
10-year IOTAs regressed on 10-year SOFR swap spreads (bp); regression over the past year; bp
Source: J.P. Morgan
Inflation swap trading activity update
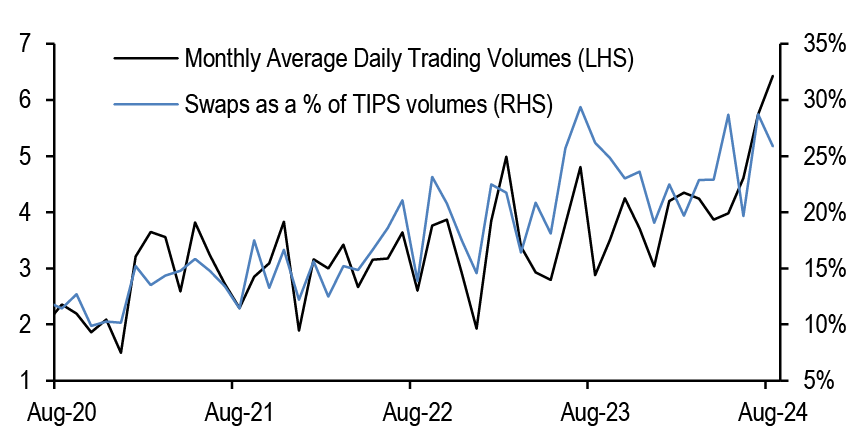
Turning to inflation swap volumes, we can see that trading activity continues to grow at a robust pace thus far this year. Using data from the DTCC swap data repository (SDR) through the middle of August, inflation swap daily trading volumes increased 25% from an average $3.6bn last year to $4.6bn YTD ( Figure 37). Moreover, the growth in the swap market continues to outstrip that of the cash market, with inflation swap daily trading volumes comprising 23.5% of TIPS volumes over the year. Turning to a more granular frequency, Figure 38 illustrates that much of this uptick has occurred over the last few months; while monthly data are quite volatile, it is notable that average daily trading volumes have increased 60% over the past three months since May to $6.4bn MTD.
Figure 37: Inflation swap volumes continue to rise on both outright and relative to the TIPS market YTD
Annual average daily trading volumes of US CPI inflation swaps (LHS; $bn) versus inflation swaps as a percentage of TIPS volumes (RHS; %)
Source: DTCC SDR, J.P. Morgan
Figure 38: More granularly, we observed a notable uptick in volumes in recent months
Monthly average daily trading volumes of US CPI inflation swaps (LHS; $bn) versus inflation swaps as a percentage of TIPS volumes (RHS; %)
Source: DTCC SDR, J.P. Morgan
Quarter-to-date, we estimate that TIPS asset swaps continue to grow as a share of overall transaction volumes, assuming that transactions with maturity dates that match outstanding TIPS reflect asset swap transactions. Figure 39 shows that, while ZC structures continue to comprise the vast majority of overall inflation swap transactions, asset swaps currently constitute 9% of overall transactions, up from 2% during 3Q23. Meanwhile asset swap transaction sizes have also expanded recently, rising 58% over the past two years to $73mn, while ZC inflation swap sizes have only increased 32% to $48mn over the same period. At the same time the maturity structure of the inflation swap market remains roughly consistent over the period, as over half of all transactions have been concentrated in the 0-5 year bucket ( Figure 40).
Figure 39: TIPS asset swaps continue to grow as a share of overall inflation swap transactions
Quarterly inflation swap trade count split by asset swaps and other (LHS, count) and asset swaps share of overall trade count (RHS, %)
Source: DTCC SDR, J.P. Morgan
Figure 40: More than half of all inflation swap transactions are concentrated in the 0-5 year sector
Distribution of US CPI inflation swap trade count based on original maturity; %
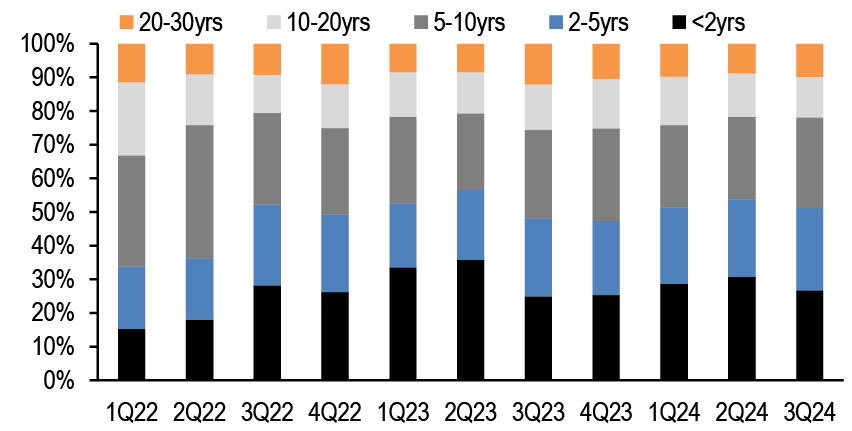
Source: DTCC SDR, J.P. Morgan
Trade recommendations
- Maintain 5yx5y inflation swap longs
- Maintain long 100% risk, or $50mn notional of 5yx5y inflation swap (swap start: 8/20/29, swap end: 8/20/34).
(TIPS Strategy, 8/16/24). P/L since inception: +2.5bp.
Figure 41: Trade performance over the past 12 months
P/L reported in bp of yield unless otherwise indicated
| TRADE | ENTRY | EXIT | P/L | |
| 1Yx1Y inflation swap longs | 6/14/2024 | 7/10/2024 | 17.5 | |
| Jul 24/Jul 25 BE wideners | 5/10/2024 | 5/28/2024 | 11.7 | |
| 10Yx20Y breakeven wideners | 4/12/2024 | 4/26/2024 | 4.7 | |
| Long 5Y TIPS | 3/20/2024 | 4/25/2024 | -31.0 | |
| 6mx1Y breakeven wideners | 4/5/2024 | 4/19/2024 | 7.3 | |
| Old 10s/30s breakeven curve steepeners | 2/23/2024 | 4/12/2024 | -5.6 | |
| Long 1Y inflation swaps (hedged) | 3/8/2024 | 4/5/2024 | 7.0 | |
| 5-year TIPS longs | 2/9/2024 | 3/7/2024 | 9.9 | |
| 10-year energy-hedged BE narrowers | 1/19/2024 | 1/30/2024 | 7.5 | |
| 30-year breakeven narrowers | 11/9/2023 | 12/7/2023 | 21.7 | |
| 5Yx5Y inflation swap shorts | 9/29/2023 | 10/13/2023 | 2.8 | |
| 3Yx2Y breakeven narrowers | 7/28/2023 | 9/12/2023 | 5.3 | |
| AGGREGATE: | ||||
| Number of trades | 12 | |||
| Number of winners | 10 | |||
| Hit ratio | 83% | |||
| Aggregate P/L (bp of yield) | 58.8 | |||
Source: J.P. Morgan
Interest Rate Derivatives
False Fall
- The commencing of rate cuts next month is all but certain, but there is considerable uncertainty around pace. Uncertainty surrounding pace is apparent in option-implied probability distributions, and supported by the tone of recent Fed-speak. Such uncertainty is likely to amplify the sensitivity of yield levels to Fed-speak and/or economic data, making it a key support for jump risk and elevated realized volatility, and is significant enough to warrant a bullish stance on short-expiry swaption volatility despite seemingly rich valuations, in our view
- SOFR and GC rates are normalizing, but front end spreads remain far too narrow. Beyond valuations, one near term catalyst for a correction is likely to come in early September as T-bill net issuance turns negative
- Term funding premium remains narrow relative to fair value, and thus appears biased higher in the near term (due to a correction) as well as the longer term (due to a falling share of price-insensitive UST buyers and eventually higher duration supply). Together with the cheapness of zero-duration spreads, this argues for a flatter spread curve - position for a flatter 5s/30s maturity matched swap spread curve
- Adjusted for the broader term structure, swap spreads appear too wide in the 7-year sector and too narrow in the 20-year sector - initiate 7s/20s swap spread curve steepening exposure, weighted to hedge exposure to rising term funding premium
- We examine the near term and medium Fed expectations that are currently being priced into the swap yield curve. Currently, yield curves anchored in the front end, such as the 2s/5s curve, are fully priced to our Funds rate forecast, while forward OIS rates themselves appear high. This suggests that on a relative basis, outright longs at the front end are preferable to front end curve steepeners
- In contrast, the Fronts/Reds curve does indeed appear fairly priced to our Fed funds forecast, but forward swap curves and back-end spot curves are too flat and therefore underpricing medium term fed expectations. This makes steepeners in these sectors preferable to outright longs in the Reds and/or Fronts/Reds flatteners on a comparative basis
False Fall
New Yorkers are accustomed to many additional seasons on the calendar, one of which is colloquially referred to as "False Fall". Not quite Fall, and not quite Summer, it is a cuspy time when the temperature seems to fluctuate between the two. The US Rates markets appear to be experiencing their own False Fall, with front end yields falling initially, bouncing higher on Thursday and then back lower on Friday. All in all, forward OIS as of mid-2025 traded this week in a ~20bp range and 2- to 5-year yields traded in a ~15bp range, before finishing near the low end of the range (Figure 1).
Figure 1: Swap yields were lower this week on the back of weaker data and a dovish tilt in the FOMC minutes
Selected statistics for SOFR swap yields, YE24 OIS, and 1H25 OIS, 8/16/2024 - 8/23/2024; %
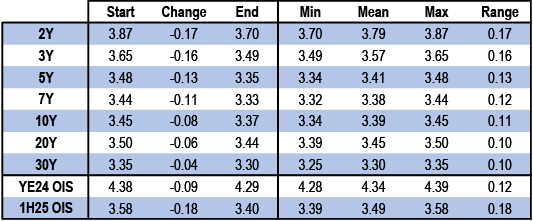
Source: J.P. Morgan.
The catalysts for the decline in yields were many - weak Canadian CPI helped spark the initial move lower, but there were other factors as well. Benchmark revisions to the establishment survey were weaker (-818K) than our expectations (-360K), the FOMC minutes were more dovish than expected especially considering that the meeting took place before the last employment report, and Fed Chair Powell's comments were quite dovish on Friday. But this week was also a reminder of the significant policy uncertainty that continues to permeate the market. As of this writing, markets are pricing in about 100bp of easing by year end. But although there is consensus among Fed speakers that policy is restrictive and easing is now appropriate, there is not yet an obvious consensus on pace. As seen in Figure 2, several speakers appear to be leaning against expectations for 50bp cuts. In other words, the pace of cuts remains undecided, and options markets reflect that. Our favorite metric for policy uncertainty is based on inferring an implied probability distribution from the prices of calls and puts on Z4 (and/or M5) SOFR futures, and then de-constructing those implied distributions into "weights" associated with each policy outcome. Since the weights must sum to one by design, this provides an intuitive way to "read" the information in the tails of the distribution. The point of this exercise is to see if the forwards (which represent an average across outcomes) are averaging across a relatively narrow (indicating policy clarity) or a relatively wide (indicating policy uncertainty) range of policy scenarios. As we can see, the weights on deep cut scenarios are reasonably comparable to the weights on shallow cut scenarios, which suggests that dispersion remains wide and there is more uncertainty around outcomes even at a horizon that is only four months into the future (Figure 3).
Figure 2: Several Fed speakers appear to be leaning against expecting more aggressive rate cuts
Selected Fed-speak excerpts, 8/22/2024 - 8/23/2024
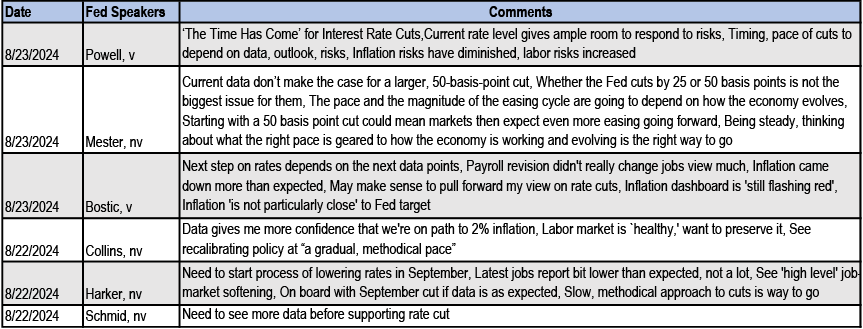
Source: J.P. Morgan., Bloomberg Finance L.P.
Figure 3: Policy uncertainty remains elevated, even at a horizon that is only four months into the future
Total weights on year-end policy rate scenarios representing 1 hike, Shallow Cuts*, and Deep Cuts*, as calculated from a decomposition of the implied probability distribution associated with Dec 2024 SOFR futures**; Feb 2024 – Current
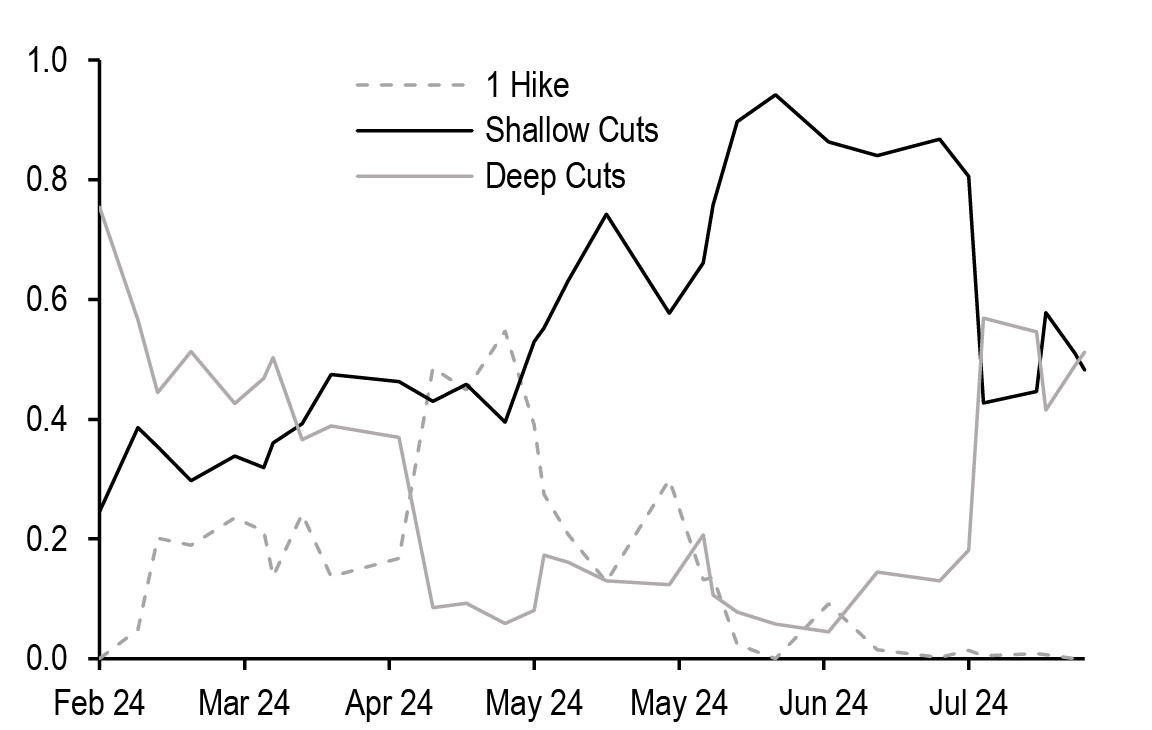
Source: J.P. Morgan., CME* Shallow Cuts correspond to the total weights on the 0 Cut,1 Cut, 2 Cuts, and 3 Cuts scenarios. Deep Cuts correspond to the total weights on the >3 Cuts scenarios. Scenarios outlined in Figure 2 of What’s the rush?.
** We enumerate a list of scenario-specific Normal distributions with fixed standard deviations and means that are separated by 25bp, and then require the implied distribution to be a weighted combination of these individual distributions. The weights are then solved for, by fitting to the observed prices of calls and puts at various different strikes. For more details of our approach, see What’s the rush?
Therefore, it appears likely that policy uncertainty will continue to haunt markets until at least next Payrolls, which will be critical in anchoring expectations. Despite the near certainty of a cut in September, the pace and extent of easing remain uncertain, which likely means that yields will be highly sensitive to new economic or policy information that arises in coming weeks. Indeed, the evidence supports the notion that yields are much more sensitive to Fed-speak in periods of significant policy uncertainty. To see this, we turn to our long-standing "Fed-speak Index", which is constructed by (i) manually identifying key Fed-speak events, and (ii) recording the 15-minute change in 5Y UST yields following the start of the speech, and then (iii) accumulating this change in a cumulative index. This index is designed to convey a sense of direction - i.e., is Fed-speak leaning dovish or hawkish. But we can examine the magnitude of changes in this cumulative index on days where there was a Fed-speak event, grouped by periods of policy clarity versus policy uncertainty over the past six months. We do this in Figure 4, where we show percentile moves in each type of period. For instance, 90% of Fed-speak events produced a change of ~2.8bp or less in periods of policy clarity, but during periods of policy uncertainty the moves were larger and the 90th percentile move is over 5bp. In other words, the current backdrop of policy uncertainty will likely serve to amplify the effect of new information, whether from Fed-speak or from economic data.
We see such a backdrop as conducive to jump risk and supportive of elevated realized volatility in rates. This is quite evident when we look at a decomposition of month-to-date delta hedged returns from long straddle positions in various sectors. As seen in Figure 5, long volatility positions were not just profitable overall, but the portion attributable to delivered volatility (i.e., gamma P/L net of theta) was a significant fraction of the overall return. Thus, policy uncertainty has very tangible consequences and will likely continue to be supportive of a bullish view on volatility. Of course, one must always consider whether current valuations are rich enough to offset the above mentioned supportive factors. In this regard, little has changed from last week. Specifically, in our publication last week (see Hopscotch, 8/16/2024), we examined whether policy uncertainty was significant enough to support a bullish view on volatility despite the fact that our implied volatility fair value models (which do not explicitly incorporate policy uncertainty) pointed to valuations being rich. We addressed this question by building an empirical model for delta hedged returns on volatility positions that explicitly incorporated a measure of policy uncertainty as well as the residual from our implied volatility fair value model. The conclusion then was that policy uncertainty's impact would likely be sufficient to significantly offset the effect of rich valuations, resulting in relatively low carry costs on delta hedged long vol positions. This remains true currently as well. Given this, and given the potential for significant jump risk going into Payrolls and beyond, we remain bullish on volatility in short expiries.
Figure 4: As one might expect, yields have tended to be much more sensitive to Fed-speak in periods of significant policy uncertainty
Size of the Nth percentile absolute change in the Fed sentiment index* on days with one or more Fed-speak events, grouped by policy clarity or uncertainty regime**, for various selected values of N from 10 to 90. Past 6 months; bp
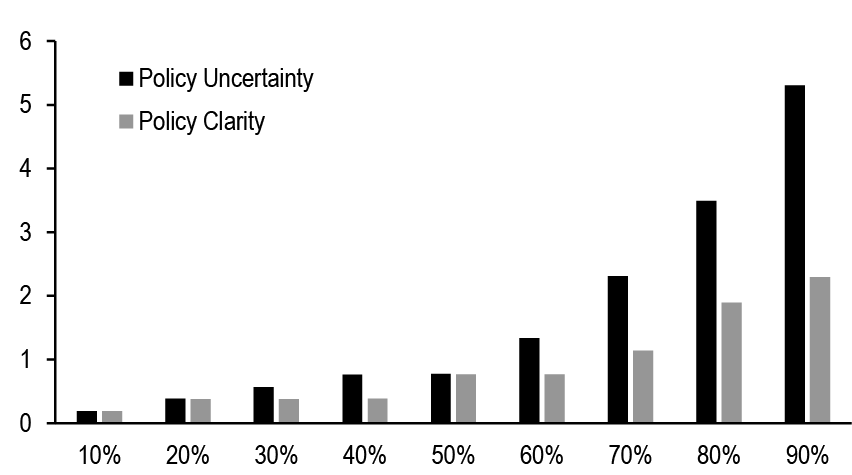
Source: J.P. Morgan, Bloomberg Finance, L.P.* The Fed sentiment index is computed as the cumulative sum of yield changes in 5-year note Treasury futures in the 15-minute period following the first Fedspeak headline on Bloomberg. Fedspeak is defined as any speech, FOMC meeting or FOMC minutes.** Days on which the absolute difference between the total weight on deep cut scenarios and shallow cut scenarios was between 0.25 and 0.75 are classified as days characterized by Policy Uncertainty, while all other days are deemed to have Policy Clarity. For more details see Figure 3
Figure 5: Long gamma positions have been profitable so far this month, as policy uncertainty helped keep delivered volatility elevated
P/L from daily delta-hedged long straddles † between 8/1 and 8/22 , estimated vega P/L*, gamma P/L** and theta P/L*** for the period; bp/notional
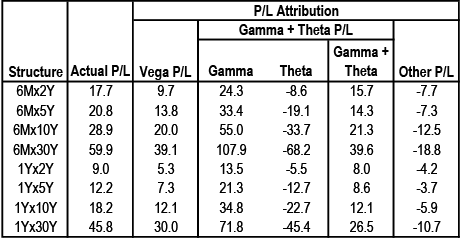
Source: J.P. Morgan.
† Assumed to be delta hedged daily, options are rolled on a monthly basis, assumes no transaction costs
* Vega P/L is estimated as inception vega times change in implied vol (starting implied vol minus aged implied vol on end date)
** Gamma P/L is estimated average gamma x 0.5 x monthly realized volatility x 17 (to represent the time period)
*** Theta P/L is estimated as spot premium minus aged premium at inception
Swap spreads
Swap spreads were once again narrower this week in the front end and the belly of the curve, while remaining flat to slightly wider in longer maturities (Figure 6). These moves came despite a ~5bp decline in O/N GC repo rates and a modest decline in SOFR, suggesting that stressed financing conditions were likely not the main driver behind the narrowing in front end spreads.
Looking ahead, we expect SOFR and GC repo rates to remain in check in the near term, which in turn should help support a normalization in front end spreads. But the catalyst that will likely help spur such a normalization is likely to be a turn in T-bill issuance. As seen in Figure 7, the cheapening in zero-duration spreads has coincided with the surge in T-bill supply, but this should reverse as T-bill net issuance turns negative in September. (A quick note - on any given day, we can regress maturity matched swap spreads in all the benchmark tenors versus modified duration of the corresponding bonds. We define zero-duration-spreads as the intercept from this regression, and we define term funding premium as the negative of the slope. Viewing swap spreads through the lens of these two summary metrics of the term structure offers many advantages. For more details, see Term Funding Premium and the Term Structure of SOFR Swap Spreads).
Figure 6: Swap spreads were narrower this week in the front end and the belly, and modestly wider in longer maturities
Selected statistics for maturity matched SOFR swap spreads, 8/16 - 8/23; bp
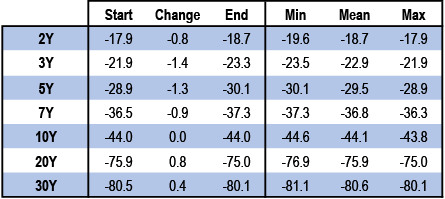
Source: J.P. Morgan.
Figure 7: The cheapening in zero-duration spreads has coincided with the surge in T-bill supply
6 week change in T-bill supply (%, left) and 6 week moving average of the residual** from our fair value model for zero-duration swap spreads* (right, inv., bp)
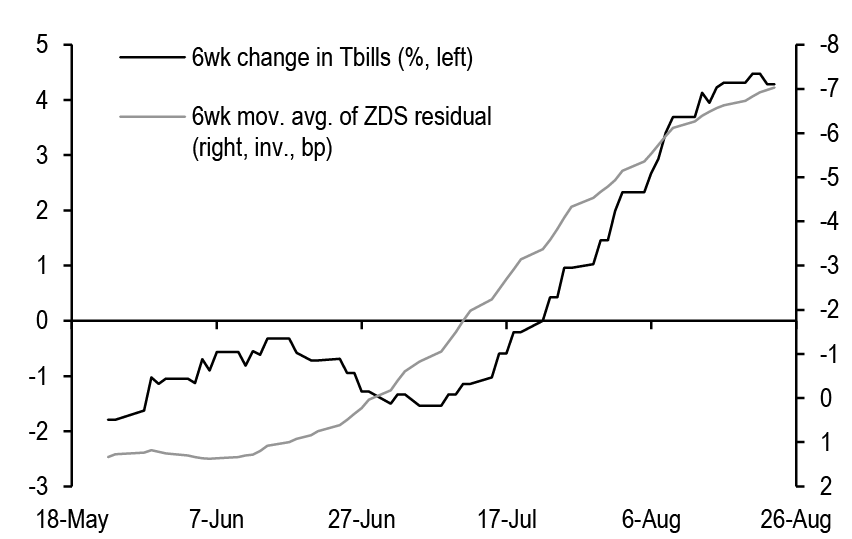
Source: J.P. Morgan.* For details on our methodology for calculating Zero-duration swap spreads, see Term Funding Premium and the Term Structure of SOFR Swap Spreads
** For details on our fair value framework for zero-duration swap spreads, see Interest Rate Derivatives 2024 Mid-Year Outlook
Term funding premium also appears too low relative to fair value, to the tune of ~0.3bp/year, as seen in Figure 8. Moreover, not only is term funding premium likely biased higher in the near term because of this mispricing, it is also likely biased higher in the longer term because of structural reasons (the falling share of price-insensitive investors in the UST market, and eventually higher duration supply). Taken together, this expectation of higher zero-duration swap spreads as well as higher term funding premium points to wider swap spreads at the front end as well as a flatter spread curve. Therefore, we now recommend initiating exposure to a flatter 5s/30s swap spread curve (see Trade recommendations).
Finally, it is worth noting that when we look at swap spreads in each sector in relation to the term structure (i.e., if we assume no changes to term funding premium or to zero-duration swap spreads), we still find that (i) front end swap spreads in the 2- to 5-year sector are currently trading too narrow relative to the term structure, while (ii) longer maturity swap spreads in the 7- to 30-year sector are trading too wide, but (iii) with the exception of 20-year swap spreads which appear too narrow relative to the term structure (Figure 9). Therefore, as a relative value trade, we recommend a weighted 7s/20s maturity matched swap spread curve steepener where the weighting is designed to hedge against a broader rise in term funding premium (which would flatten the overall spread curve - see Trade recommendations).
Figure 8: The residual from our Term Funding Premium model has been fairly mean-reverting and currently appears too narrow
Residual from a regression of term funding premium* versus its drivers**, past 1 year; bp/year
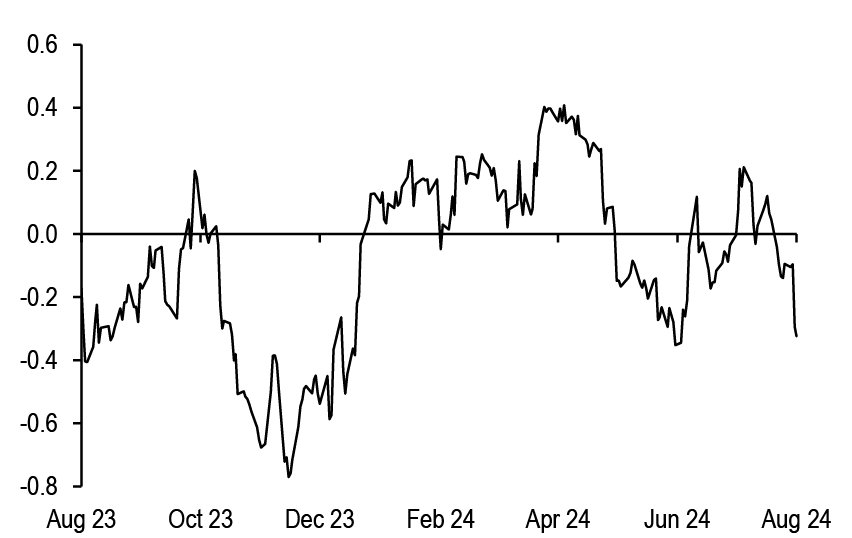
Source: J.P. Morgan.
* For details on our methodology for calculating Term funding premium, see Term Funding Premium and the Term Structure of SOFR Swap Spreads
** For details on our fair value framework for term funding premium, see Interest Rate Derivatives 2024 Mid-Year Outlook
Figure 9: Front end swap spreads are currently trading too narrow relative to the term structure, while longer maturity swap spreads (with the exception of the 20-year sector) are trading too wide
Residual from our fair value model* for maturity matched swap spreads, 8/22/2024; bp
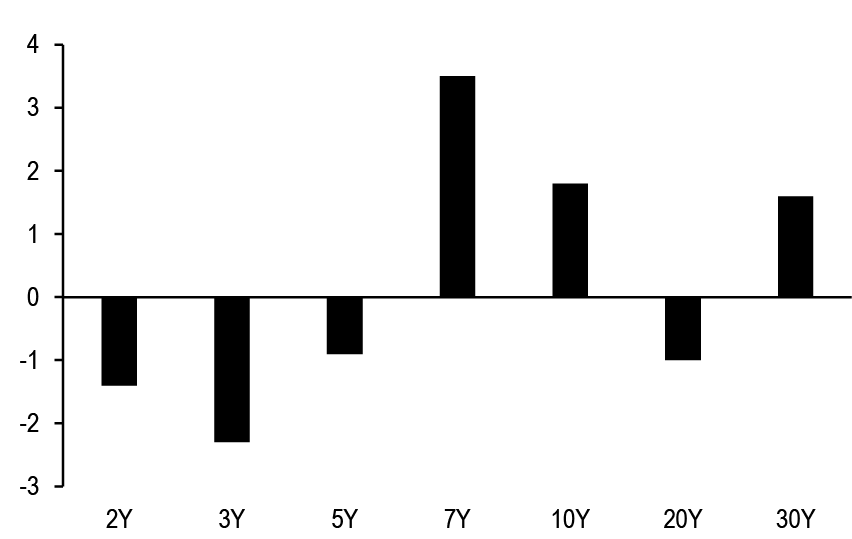
Source: J.P. Morgan.
* Fair values are computed by adding our Term structure baseline swap spread values and our swap spread deviation relative to the term structure of swap spreads across each sector (see Term Funding Premium and the Term Structure of SOFR Swap Spreads for details)
Swap Yield Curve
The swap yield curve steepened this week as yields headed lower, with almost every sector of the curve now steeper relative to week-ago levels. The exception was the very front end, where the 1s/2s curve flattened modestly to the tune of 1bp (Figure 10).
Figure 10: Swap yield curves steepened in most sectors this week
Selected statistics for benchmark swap yield curves, 8/16/2024 - 8/23/2024; bp
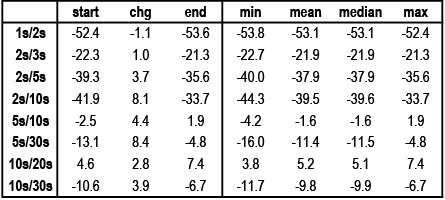
Source: J.P. Morgan.
Our approach to explaining swap yield curve movements and taking curve views has been centered around our swap curve fair value model, which uses 5 different factors (plus a control variable to account for historical periods when the Fed has employed policy guidance as a monetary policy tool) to explain a variety of spot and forward swap curves. These factors include the short rate (3Mx3M forward OIS), medium term policy expectations (3Mx3M / 15Mx3M OIS curve), the size of the Fed balance sheet, and short term as well as long term inflation expectations. As we have noted (see our 2024 Mid-Year Outlook), such a model has been fairly effective in explaining moves in various spot as well as forward swap curves.
In the current context, the most important factors are the first two, which capture the near term as well as the medium term outlook for policy rates, but we include a full set of coefficients in Figure 11. As our economists have noted, most recently on Friday (see Cuts are coming, M. Feroli, 8/23/2024), we expect the Fed to cut rates by 50bp at the next two meetings, followed by 25bp cuts thereafter until we get to a 3% level in the second half of next year. If we assume this forecast will be realized, we arrive at a fair value of around 4.1% for the 3Mx3M OIS rate, and a fair value of -125bp for the 3Mx3M / 15Mx3M forward OIS curve. This compares with the market's pricing of 4.3% and -120bp respectively for these two factors. In other words, the 3Mx3M / 15Mx3M forward OIS curve is fairly priced relative to our forecast for policy rates, but there is room for OIS rates at the very front end to decline from current levels if our funds rate projections are realized.
Figure 11: Our empirical fair value model uses a handful of factors to explain a variety of different spot and forward yield curves, but fed expectations - both near term and medium term - are currently the most important ones
Statistics from regressing* various spot and forward curves against 7 drivers**, R-squared, Standard error, current yield curve level, and current fair value; current value as of 8/22/2024

Source: J.P. Morgan., Federal Reserve H.4.
* Regression from June 2014 to June 2024
** Underlying drivers are: Forward Guidance (number of years of forward policy commitment by the Fed), 3Mx3M OIS rate (%), Fed expectations curve (15Mx3M - 3Mx3M OIS curve as a proxy), size of the Fed balance sheet ($tn), 5Yx5Y inflation swap yield (%), 2Y inflation swap yield (%), intercept shift (0s before 11/1/2023, 1s after)
But we can use this empirical model to also ask what values for these important drivers are being priced into the swap yield curve. Said differently, if we take our empirical swap yield curve fair value model coefficients as a given, we can ask - what values for the 3Mx3M OIS rate and the 3Mx3M / 15Mx3M forward OIS curve would cause current swap yield curves to look fair. In order to avoid assuming a beta between the 3Mx3M rate and 3Mx3M/15Mx3M curve, we answer this question in two stages. First we choose swap curves that have significant coefficients with respect to the 3Mx3M rate, but do not have numerically significant exposure to the forward OIS curve. Two such examples are the 2s/5s and 2s/7s spot swap curves. From each of these, we can calculate the level of 3Mx3M OIS that would cause these swap curves to appear fair at the current levels. We walk through this process in Figure 12 - as can be seen, it would appear that swap yield curves are currently priced to a forward OIS of ~4.15%. This is quite close to levels that would be consistent with our own Fed forecast, but a good ~15bp lower than the current 3Mx3M forward OIS yield. This leads us to our first observation - on a relative basis, outright longs at the very front end are likely more attractive than front end swap curve steepeners, as these swap curves are already priced to more aggressive easing expectations than forward OIS rates themselves.
Next, armed with an estimate for the "implied" 3Mx3M OIS rate that swap curves are pricing in, we turn our attention to medium term Fed expectations (i.e., the 3Mx3M / 15Mx3M curve). To calculate the implied value for medium term Fed expectations that swap yield curves are currently pricing in, we turn to a different set of curves that have numerically significant exposure to medium term Fed expectations but not to 3Mx3M OIS rates. As it turns out, 2-year forward swap curves anchored in the belly are ideally suited to this purpose. Using three such selected curves, and assuming that the 3Mx3M OIS will reach a value of 4.15% (i.e., the estimate from above), we can solve for the value of medium term Fed expectations that would make these curves appear fair. The results of this exercise are shown in Figure 13 - as can be seen, swap curves are pricing in a 3Mx3M / 15Mx3M OIS curve of around -100bp, which is a good bit steeper than our forecast of -125bp as well as the current market pricing (the 3Mx3M / 15Mx3M OIS curve currently stands near -123bp). This leads us our second observation - forward swap curve steepeners are likely more attractive than Fronts/Reds flatteners, as the former is underpricing Fed easing expectations relative to the latter.
Therefore, we recommend that clients favor outright front end longs in place of front end steepeners on a relative basis, and favor forward curve and back end swap curve steepeners over outright duration longs in Reds, when positioning for a more dovish Fed.
Figure 12: Swap curves are currently priced to a forward OIS that is~15bp lower than the current 3Mx3M forward OIS
Current level (%), Mispricing (%)*, Beta to 3Mx3M OIS**, and Implied 3Mx3M OIS (%)*** for the 2s/5s and 2s/7s spot swap yield curves as well as the average, 8/22

Source: J.P. Morgan.
* Mispricing is calculated as Cur. Curve - Fair Value as shown in Figure 11
** Beta with respect to 3Mx3M OIS comes from the regression described in Figure 11
*** Implied 3Mx3M OIS is calculated as Mispricing / Beta wrt 3Mx3M OIS, plus the current level of 3Mx3M OIS.
Figure 13: Swap curves are pricing in a 3Mx3M / 15Mx3M OIS curve of around -100bp, which is steeper than our forecast as well as the current market pricing
Implied* 3Mx3M / 15Mx3M OIS curve for various fwd swap yield curves, 8/22; %

Source: J.P. Morgan.
* Implied 3Mx3M / 15Mx3M OIS curve is calculated as the current mispricing from our fair value model (Figure 11), assuming an implied value for 3Mx3M OIS of 4.15% (Figure 12), divided by Beta wrt 3Mx3M / 15Mx3M OIS curve, plus the current level of the 3Mx3M / 15Mx3M OIS curve.
Trading Recommendations
- Initiate 5s/30s swap spread curve flatteners
The cheapening in zero-duration spreads has coincided with the surge in T-bill supply, but this should reverse as T-bill net issuance turns negative in September. Moreover, term funding premium likely biased higher in the near term due to mispricing, falling share of price-insensitive investors in the UST market and eventual higher duration supply. Taken together, this points to wider swap spreads at the front end and a flatter spread curve and we prefer expressing this through 5s/30s swap spread curve flatteners.
-Pay fixed in 4.25% Jun 30 2029 maturity matched SOFR swap spreads. Buy $100mn notional of the 4.25% Jun 30 2029 (yield: 3.657%, PVBP: $447.1/bp per mn notional), and pay fixed in $97.9mn notional of a maturity matched SOFR swap (coupon: 3.354%, PVBP: $456.7/bp per mn notional) at a swap spread of -30.3bp.
-Receive fixed in 4.625% May 15 2054 maturity matched SOFR swap spreads. Sell $24.7mn notional of the 4.625% May 15 2054 (yield: 4.107%, PVBP: $1813.5/bp per mn notional), and receive fixed in $23.9mn notional of a maturity matched SOFR swap (coupon: 3.305%, PVBP: $1869.0/bp per mn notional) at a swap spread of -80.2bp. - Initiate 7s/20s weighted swap spread curve steepeners
Maturity matched swap spread in the 7Y sector are wide relative to the term structure, while 20Y spreads are narrow relative to the term structure. Therefore, as a relative value trade, we recommend a weighted 7s/20s spread curve steepener where the weighting is designed to hedge against a broader rise in term funding premium (which would flatten the overall spread curve).
-Receive fixed in 4.25% Jun 30 2031 maturity matched SOFR swap spreads. Sell $100mn notional of the 4.25% Jun 30 2031 (yield: 3.702%, PVBP: $611.3/bp per mn notional), and receive fixed in $100.5mn notional of a maturity matched SOFR swap (coupon: 3.33%, PVBP: $608.1/bp per mn notional) at a swap spread of -37.2bp.
-Pay fixed in 4.125% Aug 15 2044 maturity matched SOFR swap spreads. Buy $20.0mn notional of the 4.125% Aug 15 2044 (yield: 4.189%, PVBP: $1336.5/bp per mn notional), and pay fixed in $18.5mn notional of a maturity matched SOFR swap (coupon: 3.441%, PVBP: $1443.2/bp per mn notional) at a swap spread of -74.8bp. - Unwind calendar spread wideners in US Futures
As the roll cycle is over 30% complete, we recommend unwinding this calendar spread at a loss of 0.8 ticks. For original trade write up, see Fixed Income Markets Weekly 2024-08-16. - Unwind calendar spread narrowers in FV Futures
For the same reason as above, we recommend unwinding at a loss of 0.1 ticks. For original trade write up, see Fixed Income Markets Weekly 2024-08-16. - Unwind TU/TY invoice spread curve flatteners (1:0.35 weighted)
This trade has underperformed our expectations and we recommend unwinding at a loss of 6.3bp. For original trade write up, see Fixed Income Markets Weekly 2024-06-07. - Unwind long A+100 1Yx5Y payer swaptions versus selling A-100 1Yx5Y receiver swaptions, delta-hedged daily, to position for a correction in skew
This trade has underperformed our expectations and we recommend unwinding at a loss of 8.5abp. For original trade write up, see Fixed Income Markets Weekly 2024-04-19. - Maintain 10Y swap spread narrowers
P/L on this trade is currently -0.3bp. For original trade write up, see Fixed Income Markets Weekly 2024-08-16. - Maintain 3s/7s swap spread curve flatteners
P/L on this trade is currently -0.5bp. For original trade write up, see Fixed Income Markets Weekly 2024-08-16. - Maintain 0.875% June 2026 / 0.875% September 2026 swap spread curve flatteners
P/L on this trade is currently 0.1bp. For original trade write up, see Fixed Income Markets Weekly 2024-08-16. - Maintain longs in 6Mx5Y swaption implied volatility on an outright basis, delta hedged daily
P/L on this trade is currently -0.4abp. For original trade write up, see Fixed Income Markets Weekly 2024-08-02. - Maintain conditional exposure to a flatter 1s/7s swap yield curve in a selloff using 6M expiry payer swaptions
P/L on this trade is currently -4.4bp. For original trade write up, see Fixed Income Markets Weekly 2024-07-12. - Continue to overweight 6Mx5Y swaption straddles versus 150% of the vega risk in 6Mx30Y straddles
P/L on this trade is currently -1abp. For original trade write up, see Fixed Income Markets Weekly 2024-07-12. - Continue to Pay-fixed in 4.625% Feb ‘26 maturity matched swap spreads
P/L on this trade is currently -1.7bp. For original trade write up, see Fixed Income Markets Weekly 2024-05-31. - Maintain 1:0.75 risk weighted 7s/10s maturity matched swap spread curve steepeners
P/L on this trade is currently -1.3bp. For original trade write up, see Fixed Income Markets Weekly 2024-05-31. - Continue to Pay-fixed in 4.375% Aug ‘28 maturity matched swap spreads
P/L on this trade is currently -1.5bp. For original trade write up, see Fixed Income Markets Weekly 2024-05-31. - Continue to overweight 1Yx10Y straddles versus a gamma-neutral amount of 1Yx15Y straddles
P/L on this trade is currently -2.2abp. For original trade write up, see Fixed Income Markets Weekly 2024-05-03.
- Continue to overweight 6Mx5Y and 6Mx30Y swaption volatility (vega weights of 0.32 and 0.76, respectively) versus selling 6Mx10Y swaption volatility
P/L on this trade is currently 0abp. For original trade write up, see Fixed Income Markets Weekly 2024-04-05.
Closed trades over the past 12 months
P/L reported in bp of yield for swap spread, yield curve and misc. trades, and in annualized bp of volatility for option trades, unless otherwise specified
Note: trades reflect Thursday COB levels, and unwinds reflect Friday COB levels
| Trade | Entry | Exit | P/L |
| Spreads and basis | |||
| 10Y spread narrower | 8/25/2023 | 9/8/2023 | 1.6 |
| 3Y spread widener | 8/18/2023 | 9/22/2023 | (0.2) |
| FV invoice spread wideners by buying FVZ3 and paying fixed in a forward starting swap |
9/8/2023 | 9/29/2023 | (2.2) |
| Initiate 10s/30s swap spread curve flatteners | 9/15/2023 | 10/13/2023 | 0.3 |
| 2Y spread narrowers | 10/13/2023 | 10/27/2023 | 1.2 |
| 5s/10s swap spread curve flatteners, paired with a 10% risk-weighted 5s/10s Treasury curve flattener | 10/13/2023 | 12/8/2023 | 1.2 |
| FV/UXY invoice spread curve flatteners , paired with a 10% risk-weighted FV/UXY Treasury futures curve flattener | 10/13/2023 | 12/8/2023 | 1.7 |
| Initiate swap spread narrowers in the 2Y sector | 11/3/2023 | 12/8/2023 | 3.9 |
| Initiate swap spread wideners in the 5Y sector | 11/3/2023 | 12/8/2023 | (3.2) |
| Initiate 20s/30s swap spread curve flatteners hedged with a 35% risk-weighted 20s/30s Treasury curve flattener | 9/29/2023 | 1/5/2024 | 0.2 |
| Initiate 3s/5s swap spread curve flatteners | 12/8/2023 | 1/5/2024 | 0.9 |
| Initiate swap spread wideners in the 5Y sector | 1/5/2024 | 1/19/2024 | 4.2 |
| Pay in 1.375% Nov ‘31 maturity matched swap spreads paired with 5% risk in 5s/10s OTR Treasury curve steepeners | 1/10/2024 | 1/26/2024 | 2.4 |
| Initiate 5s/30s swap spread curve flatteners | 12/15/2023 | 2/2/2024 | 3.8 |
| Initiate swap spread narrowers in the 30Y sector | 1/5/2024 | 2/2/2024 | 0.2 |
| Maintain a widening bias on swap spreads in the belly but switch to the 2.625% Feb 2029 issue | 1/19/2024 | 2/23/2024 | 2.4 |
| Maintain a widening bias on swap spreads in the belly using the 2.625% Feb 2029 issue, but hedge the narrowing risk from higher implied volatility with a long in 2Yx2Y swaption straddles | 1/19/2024 | 2/23/2024 | 2.7 |
| Initiate 2s/5s (100:60 weighted) maturity matched swap spread curve steepeners | 1/26/2024 | 2/23/2024 | (3.3) |
| Pay-fixed in 2.125% May ‘26 maturity matched swap spreads | 3/15/2024 | 3/22/2024 | 3.6 |
| Pay-fixed in 1.875% Jul ‘26 maturity matched swap spreads | 3/22/2024 | 4/5/2024 | 3.4 |
| Initiate 20s/30s 1.33:1 wtd maturity matched spread curve steepeners hedged with a 30% risk weighted 20s/30s steepener, but use an equi-notional blend of the Nov 53s and Aug 53s to create a synthetic approximate par bond in the 30Y leg | 2/23/2024 | 4/12/2024 | (2.5) |
| Initiate 30Y swap spread wideners | 3/15/2024 | 4/12/2024 | (0.1) |
| Pay in 4% Jan ‘27 maturity matched swap spreads | 4/5/2024 | 4/26/2024 | 2.2 |
| Initiate 10Y swap spread wideners using the Nov ‘33 issue | 3/8/2024 | 5/17/2024 | 0.9 |
| Initiate exposure to a steeper 7s/10s 1:0.75 weighted swap spread curve, and we recommend implementing the 7Y narrower leg with TYM4 invoice spreads | 5/10/2024 | 5/28/2024 | 0.3 |
| Initiate 1:0.9 risk weighted 20s/30s maturity matched swap spread curve steepeners | 5/31/2024 | 6/14/2024 | 3.9 |
| Initiate 5s/10s off-the-run swap spread curve steepeners (100:60 weighted) | 3/8/2024 | 7/12/2024 | (4.7) |
| Initiate 7s/10s swap spread curve steepeners paired with 25% risk in a 7s/10s UST curve steepener | 3/22/2024 | 7/12/2024 | (0.2) |
| Pay in Feb 2037 maturity matched swap spreads versus receiving in USU4 invoice spreads | 6/14/2024 | 7/12/2024 | 0.8 |
| Buy Feb 37s versus selling USU4 Futures | 6/14/2024 | 7/12/2024 | 2.7 |
| Pay-fixed in 1.875 Feb 2027 maturity matched swap spreads | 4/26/2024 | 7/26/2024 | (5.9) |
| Initiate 5s/30s spread curve flatteners | 5/3/2024 | 7/26/2024 | 5.1 |
| Pay-fixed in 4% Feb 2034 maturity matched swap spreads | 5/17/2024 | 7/26/2024 | (6.7) |
| Initiate 10s/30s swap spread curve flatteners | 7/26/2024 | 8/2/2024 | (0.8) |
| Initiate TU/TY invoice spread curve flatteners (1:0.35 weighted) | 6/7/2024 | 8/23/2024 | (6.3) |
| Duration and curve | Entry | Exit | P/L |
| Initiate 2Y forward 1s/10s swap curve steepeners paired with equal risk in a 3M forward 3s/15s swap curve flattener | 08/18/23 | 08/25/23 | 4.7 |
| Sell the belly of the U4/H5/U5 3M SOFR futures butterfly (-0.43:1:-0.64 risk weighted) | 09/08/23 | 09/22/23 | 2.3 |
| Initiate 3M forward 2s/10s swap curve steepeners paired with 110% of the risk in Reds/Greens flatteners | 09/15/23 | 09/22/23 | 4.9 |
| Initiate 3Y forward 2s/10s swap curve steepeners, paired with 1Y forward 1s/5s swap curve flatteners (33% risk weighted) | 09/22/23 | 09/29/23 | 5.0 |
| Initiate 2Y forward 2s/30s swap curve steepeners paired with equal risk in a 3M forward 2s/30s swap curve flattener | 08/25/23 | 10/20/23 | (32.1) |
| Initiate 3Y forward 3s/30s swap curve steepeners paired with 63% risk in a 3M forward 5s/30s swap curve flattener | 09/08/23 | 10/20/23 | (18.3) |
| Initiate M4/Z4 SOFR futures curve steepeners paired with 55% of the risk in H4/Z5 3M SOFR futures curve flatteners | 09/22/23 | 10/20/23 | (9.9) |
| Initiate conditional exposure to a flatter 2s/10s swap yield curve in a rally using 6M expiry receiver swaptions | 09/29/23 | 11/03/23 | (9.2) |
| Initiate 3M fwd 5s/10s swap curve flatteners paired with 2Y fwd 5s/10s swap curve steepeners (50:100 risk weighted) | 10/27/23 | 11/03/23 | 4.6 |
| Initiate conditional exposure to a flatter 5s/10s swap yield curve in a rally using 3M expiry receiver swaptions | 10/27/23 | 11/03/23 | 0.8 |
| Initiate 2Y fwd 2s/5s curve flatteners paired with 25% risk in a 1st/5th SOFR futures curve flattener | 11/03/23 | 11/22/23 | 5.8 |
| Initiate 6M fwd 5s/15s curve flatteners paired with equal risk in 3Y fwd 2s/15s steepeners | 11/03/23 | 11/22/23 | 4.6 |
| Buy the belly of a 40:65 weighted Z4/Z5/Z6 3M SOFR futures butterfly | 11/03/23 | 11/22/23 | 5.6 |
| Initiate 9M fwd 1s/10s flatteners paired with a 50% risk weighted long in March 2025 3M SOFR futures | 11/09/23 | 11/22/23 | 15.8 |
| Initiate 3Mx1Y / Greens weighted flattener (1:0.8 weighted) paired with 80% risk in a 3M forward 2s/10s swap curve steepener | 01/05/24 | 01/26/24 | 2.9 |
| Initiate U5/M6 SOFR futures curve flatteners paired with 110% of the risk in Z5/U6 3M SOFR futures curve steepeners | 12/15/23 | 02/02/24 | 1.6 |
| Buy the belly of a 35:65 weighted H5/H6/Z6 3M SOFR futures butterfly | 12/15/23 | 02/02/24 | 1.9 |
| Initiate 1Yx2Y / 3Mx30Y swap yield curve steepeners paired with 65% risk in a Reds / 10Yx5Y swap yield curve flattener | 01/19/24 | 02/02/24 | 1.1 |
| Receive fixed in the belly of a 6M forward 2s/7s/30s swap butterfly (40:69 weighted) | 01/19/24 | 02/02/24 | 0.1 |
| Initiate conditional exposure to a composite flattener in a selloff by buying 3Mx2Y payer swaptions (100% risk) versus selling 3Mx5Y and 3Mx30Y payer swaptions (24% and 100% risk respectively) | 02/02/24 | 02/23/24 | 14.3 |
| Buy H5 and Z5 3M SOFR futures contracts (30:100 weighted) versus selling U4 3M SOFR futures contracts (100% risk weight) and pay-fixed in 6M forward 10Y swaps (40% risk weight) | 02/09/24 | 02/23/24 | 5.8 |
| Initiate exposure to rising term premium by selling the belly of a 35/65 weighted 3M forward 5s/10s/15s butterfly | 12/08/23 | 03/08/24 | (1.5) |
| Initiate SFRM5 / Blues flatteners paired with a 110% risk weighted 3M forward 2s/10s steepener | 03/01/24 | 03/22/24 | 3.3 |
| Initiate 3M forward 3s/20s swap curve steepeners, paired with 85% of the risk in a SFRM5 / 3Mx10Y curve flattener | 03/08/24 | 04/05/24 | 3.2 |
| Initiate 2Y forward 2s/5s swap curve steepeners paired with 40% risk in 3M forward 2s/5s flatteners | 01/26/24 | 04/12/24 | (11.4) |
| Initiate conditional exposure to a flatter 2s/5s swap yield curve in a selloff using 3M expiry payer swaptions | 03/22/24 | 04/12/24 | 5.2 |
| Initiate conditional exposure to a flatter 18M/5Y swap yield curve in a selloff using 6M expiry payer swaptions | 04/05/24 | 04/12/24 | 3.1 |
| Initiate conditional exposure to a flatter 1s/5s swap yield curve in a selloff using 3M expiry payer swaptions | 02/23/24 | 04/26/24 | (9.4) |
| Initiate 1Y forward 2s/5s swap curve flatteners, paired with weighted longs in H5 and H6 3M SOFR futures (20% and 10% respectively) | 03/22/24 | 04/26/24 | (9.5) |
| Initiate SFRM5 / 3Mx5Y flattener, hedged with a 20% risk weighted long in Reds | 04/05/24 | 04/26/24 | (5.0) |
| Initiate 5th/9th SOFR futures curve flatteners hedged with a risk weighted amount 2Y forward 2s/5s swap curve steepeners | 04/12/24 | 05/03/24 | 3.0 |
| Receive in the belly of a 0.625/1.0/0.375 weighted 3M forward 2s/7s/20s swap butterfly, with an additional 15% risk weighted long in June 2024 3M SOFR futures | 02/23/24 | 05/17/24 | 2.7 |
| Initiate 3M forward 2s/3s swap curve flatteners hedged with a 14% risk weighted long in the M4 3M SOFR futures | 02/23/24 | 05/17/24 | 0.4 |
| Initiate 3M forward 5s/15s swap curve flatteners paired with 70% risk in a 2Y forward 2s/20s swap curve steepener | 03/22/24 | 05/17/24 | 2.8 |
| Buy the belly of a 2s/5s/15s weighted swap butterfly (50:50 weighted) | 04/12/24 | 05/17/24 | 2.4 |
| Initiate 3M forward 1s/3s swap curve flatteners, hedged with a 65% risk weighted long in the 3Mx3M sector and a 25% risk weighted short in the 15Mx3M sector | 05/03/24 | 05/17/24 | 2.1 |
| Buy the belly of a U5/M6/H7 SOFR Futures butterfly (-0.37:1:-0.63 risk weighted) | 03/01/24 | 05/31/24 | (0.7) |
| Initiate a Greens/Blues steepener paired with 55% of the risk in a SFRM5 / 3Mx5Y swap curve flattener | 03/15/24 | 05/31/24 | 2.2 |
| Buy the belly of a Z5/U6/H7 3M SOFR futures butterfly (-0.33:1.0:-0.67 risk weighted) | 04/19/24 | 05/31/24 | 1.8 |
| Initiate 12Mx3M / 3Mx10Y flatteners, paired with 33% risk in a 3Mx2Y receive fixed swap | 05/17/24 | 06/06/24 | 5.7 |
| Initiate 3M fwd 3s/15s flatteners paired with 85% risk in 2Y fwd 3s/30s steepeners | 05/17/24 | 06/06/24 | 4.5 |
| Initiate 3Mx1Y / 2Yx1Y forward swap curve flatteners as a bullish proxy | 05/31/24 | 06/06/24 | 11.5 |
| Initiate 3Mx1Y / 2Yx1Y swap curve flatteners paired with 45% risk-weighted pay-fixed positions in 3Mx5Y swaps | 05/31/24 | 06/06/24 | 0.0 |
| Initiate conditional exposure to a flatter 1s/2s swap yield curve in a rally using 1Y expiry receiver swaptions | 04/05/24 | 06/14/24 | 4.0 |
| Initiate Z5/U6 SOFR futures flatteners paired with H6/Z6 SOFR futures steepeners (0.85:1 risk weighted) | 03/01/24 | 07/12/24 | 1.8 |
| Initiate conditional exposure to a steeper 10s/20s swap yield curve in a selloff using 9M expiry payer swaptions | 03/15/24 | 07/12/24 | 4.0 |
| Initiate 3M forward 10s/15s swap curve steepeners paired with 25% risk in 3M forward 3s/7s flatteners | 04/26/24 | 07/12/24 | 3.5 |
| Initiate 3M forward 10s/30s steepeners (1:1.5 risk weighted) paired with M5/Z5 3M SOFR futures flatteners | 06/07/24 | 07/12/24 | 2.9 |
| Initiate 15Mx3M / 1YX1Y forward swap curve flatteners, paired with 20% of the risk in a long in 18Mx3M and a 24% risk weighted short in 3Mx5Y forward swaps | 05/03/24 | 08/02/24 | (1.3) |
| Receive in 3Mx3Y and 3Mx5Y swaps versus paying in 3Yx1Y and 12Mx3M swaps | 06/14/24 | 08/02/24 | (8.8) |
| Initiate a synthetic 6M forward 2s/10s swap curve steepener, constructed by replacing the 2Y leg with a 6Mx3M / 18Mx3M flattener | 07/12/24 | 08/02/24 | (28.9) |
| Initiate a synthetic 3M forward 5s/30s swap curve steepener, constructed by replacing the 5Y leg with a 3Mx3M / 3Mx2Y flattener | 07/26/24 | 08/02/24 | (18.1) |
| Initiate conditional exposure to a flatter 1s/2s swap yield curve in a rally using 6M expiry receiver swaptions | 07/26/24 | 08/02/24 | (8.8) |
| Options | Entry | Exit | P/L |
| Sell volatility on 5-year tails paired with a pay-fixed swap overlay | 08/18/23 | 08/25/23 | 6.2 |
| Sell 6Mx30Y swaption straddles versus buying 6Mx10Y and selling 6Mx2Y straddles on a suitably weighted and delta hedged basis | 08/04/23 | 09/08/23 | 0.0 |
| Sell 9M expiry single-look YCSO straddles on the 5s/30s curve, versus buying 35% vega-weighted amount of 9Mx2Y swaption straddles | 06/02/23 | 09/08/23 | 2.3 |
| Sell volatility on 30-year tails paired with a pay-fixed swap overlay | 08/25/23 | 09/15/23 | 8.6 |
| Sell 2Yx5Y swaption straddles versus buying 10Yx10Y swaption straddles | 08/25/23 | 09/15/23 | 5.3 |
| Buy 10Yx10Y straddles | 03/17/23 | 09/22/23 | 1.9 |
| Sell 2Yx2Y swaption straddles versus buying a vega-neutral amount of 1Yx10Y swaption straddles | 08/25/23 | 09/29/23 | 3.4 |
| Buy 1Yx10Y straddles versus selling 140% of the vega risk in 1Yx5Y straddles and buying 50% of the risk in 1Yx2Y swaption straddles | 08/25/23 | 10/13/23 | 3.2 |
| Sell 2Yx30Y swaption straddles versus buying a vega-neutral amount of 10Yx10Y swaption straddles | 09/08/23 | 10/13/23 | (4.5) |
| Sell 2Yx2Y swaption straddles versus buying a vega-neutral amount of 7Yx10Y swaption straddles | 09/15/23 | 10/13/23 | 3.0 |
| Sell 6Mx30Y swaption straddles with a pay fixed swap overlay | 09/22/23 | 10/13/23 | (11.6) |
| Sell 1Yx30Y swaptions straddles versus buying a vega-neutral amount of 5Yx30Y swaption straddles, paired with a 1Yx30Y pay-fix swap | 09/22/23 | 10/13/23 | (1.5) |
| Overweight 6Mx7Y swaption volatility versus a vega-neutral amount of 1Yx10Y swaption volatility | 10/13/23 | 11/03/23 | 3.5 |
| Buy 1Yx10Y swaption straddles paired with a receive-fixed swap overlay to hedge against a decrease in implieds due to lower yields | 10/27/23 | 11/03/23 | (1.1) |
| Initiate short gamma exposure in the 6Mx30Y sector | 11/03/23 | 12/08/23 | 7.9 |
| Sell 6Mx30Y swaption straddles versus buying a vega-neutral amount of 1Yx30Y swaption straddles | 11/03/23 | 12/08/23 | 0.4 |
| Initiate long gamma exposure in the 1Yx10Y sector | 12/08/23 | 02/23/24 | (2.1) |
| Initiate long exposure to 2Yx2Y volatility with a suitably weighted short in July Fed funds futures to hedge the downside risk from a fall in Fed-easing expectations | 01/05/24 | 02/23/24 | 2.6 |
| Overweight 2Yx2Y swaption straddles versus a vega-neutral amount of 5Yx5Y swaption straddles | 01/19/24 | 02/23/24 | 3.2 |
| Overweight 6Mx10Y swaption straddles versus selling 110% of the vega risk in 1Yx10Y swaption straddles | 01/26/24 | 02/23/24 | 1.3 |
| Buy 6Mx10Y straddles | 03/01/24 | 03/08/24 | (6.6) |
| Initiate longs in 6Mx10Y swaption implied volatility, delta hedged daily | 03/15/24 | 03/22/24 | (5.1) |
| Overweight 6Mx2Y swaption straddles versus a theta-neutral amount of 6Mx5Y swaption straddles | 01/19/24 | 04/12/24 | (8.8) |
| Sell 2Yx30Y swaption volatility versus buying 50% of the vega risk in 2Yx2Y swaption volatility , and pay fixed in 2Yx 10Y swaps to neutralize the bullish bias in this trade | 02/23/24 | 04/12/24 | 1.5 |
| Buy 6Mx10Y volatility versus 6M forward 6Mx10Y volatility, synthetically constructed via suitably weighted 1Yx10Y and 6Mx10Y swaptions | 04/05/24 | 04/12/24 | 3.2 |
| Buy 2Yx5Y swaption straddles on a delta hedged basis | 04/12/24 | 04/19/24 | 1.0 |
| Sell 6Mx10Y straddles on a delta hedged basis | 04/26/24 | 05/03/24 | 3.1 |
| Sell 6Mx15Y straddles on a delta hedged basis | 05/03/24 | 05/10/24 | (1.6) |
| Sell 1Yx2Y volatility versus buying a theta neutral amount of 1Yx5Y volatility | 05/17/24 | 06/06/24 | 0.6 |
| Initiate Fronts/Green curve flatteners, paired with delta hedged long volatility positions in the 1Yx10Y swaption sector | 05/31/24 | 06/06/24 | 5.6 |
| Initiate exposure to long curve volatility by buying 6Mx2Y and 6Mx10Y straddles (41:60 vega weighted) versus selling 6Mx5Y straddles | 12/08/23 | 06/07/24 | 1.1 |
| Buy 2Yx5Y swaption straddles on a delta hedged basis, versus 6Mx1Y / 18Mx1Y flatteners | 06/07/24 | 06/14/24 | 3.6 |
| Initiate outright shorts in 3Yx30Y swaption implied volatility, but delta hedge monthly or if rates move by over 25bp in either direction since the last delta hedge | 03/08/24 | 07/12/24 | (5.0) |
| Buy 1Yx30Y volatility versus 1Y forward 1Yx30Y volatility, synthetically constructed via suitably weighted 2Yx30Y and 1Yx30Y swaptions | 03/15/24 | 07/12/24 | (2.5) |
| Buy 65% risk weighted 1Yx10Y swaption volatility versus selling 1Y forward 2Yx10Y swaption volatility, synthetically constructed via suitably weighted 1Yx10Y and 3Yx10Y swaptions | 04/12/24 | 07/12/24 | (4.4) |
| Sell 6Mx10Y swaption straddles on a delta hedged basis, paired with a short position in Greens | 06/14/24 | 07/12/24 | 2.2 |
| Buy 1Yx5Y straddles versus selling vega-neutral amount of 5Yx5Y straddles | 07/12/24 | 08/02/24 | 4.7 |
| Buy A+100 1Yx5Y payer swaptions and sell A-100 1Yx5Y receiver swaptions, delta-hedged daily, to position for a correction in skew | 04/19/24 | 08/23/24 | (8.5) |
| Others | Entry | Exit | P/L |
| TU calendar spread narrowers | 8/18/2023 | 8/25/2023 | 0.5 |
| WN calendar spread wideners | 8/18/2023 | 8/25/2023 | (3.5) |
| Position for a widening in WN calendar spreads | 11/9/2023 | 11/22/2023 | 1.8 |
| Buy the USZ3/USH4 weighted calendar spread hedged with USZ3/WNZ3 Treasury futures curve flatteners | 11/9/2023 | 11/22/2023 | 0.2 |
| Position for a narrowing in FV calendar spreads | 11/9/2023 | 11/22/2023 | 0.3 |
| WN calendar spreads narrowers | 2/13/2024 | 2/23/2024 | (0.7) |
| UXY calendar spreads narrowers | 2/13/2024 | 2/23/2024 | (0.8) |
| TU calendar spreads narrowers | 2/13/2024 | 2/23/2024 | (0.3) |
| Sell the 4.75% Nov 2053 WNM4 basis, versus buying payer swaptions | 3/8/2024 | 4/12/2024 | 1.0 |
| Initiate calendar spread wideners in US Futures | 5/17/2024 | 5/28/2024 | (3.0) |
| Initiate calendar spread narrowers in UXY Futures | 5/17/2024 | 5/28/2024 | 0.4 |
| Initiate calendar spread narrowers in FV futures | 5/17/2024 | 5/28/2024 | 1.0 |
| Initiate calendar spread wideners in US Futures | 8/16/2024 | 8/23/2024 | (0.8) |
| Initiate calendar spread narrowers in FV Futures | 8/16/2024 | 8/23/2024 | (0.1) |
| Total number of trades | 140 | ||
| Number of winners | 93 | ||
| Hit rate | 66% |
Short-Term Fixed Income
- Chair Powell’s remarks at the Jackson Hole forum left little doubt that the Fed will soon cut rates. However, as expected, he did not reveal the size of the adjustment
- Our economists still expect a 50bp reduction in both September and November, followed by 25bp cuts thereafter, until reaching 3%
- ON RRP balances have stabilized around the mid to low $300bn level. We suspect there will be limited room to move further lower, in the absence of meaningfully more T-bill supply and given some MMFs’ structural need for liquidity
- Last week’s Liberty Street blog posts conclude that reserves remain abundant as of 1Q24, based on a variety of indicators
- We take a closer look at some of the discussed indicators, namely domestic borrowing in the fed funds market and upward pressure in repo rates
- Domestic bank borrowing in the overnight unsecured market remains minimal as of 2Q24, regardless of whether they are a US G-SIB or a smaller bank
- US banks’ participation in the repo market as a marginal buyer also remains low, relative to prior peaks, which suggests the percentage of overnight Treasury repo transacted at or above IORB is not signaling reserve scarcity
- Near-term catalysts: July personal income (8/30), July JOLTS (9/4), Aug employment (9/6), Aug CPI (9/11), Aug PPI (9/12)
Market commentary
In his clearest signal to date, Chair Powell’s remarks at the Jackson Hole forum left little doubt that the Fed will soon cut rates. In addition to expressing growing confidence in inflation returning to 2%, he emphasized the FOMC’s attentiveness to labor market conditions, adding that the Fed does “not seek or welcome further cooling in the labor market.” However, as expected, he did not reveal the size of the adjustment, only noting “the timing and pace of rate cuts will depend on incoming data, the evolving outlook, and the balance of risks” (see Cuts are coming. M. Feroli, 8/23/24). Meanwhile, comments from Fed officials this week were not as open-ended as Powell’s, but they also suggest that it may be appropriate to begin lowering rates soon ( Figure 42).
Figure 42: Comments from Fed officials this week were not as open-ended as Powell’s, but they also suggest that it may be appropriate to begin lowering rates soon
FOMC commentary over the past week
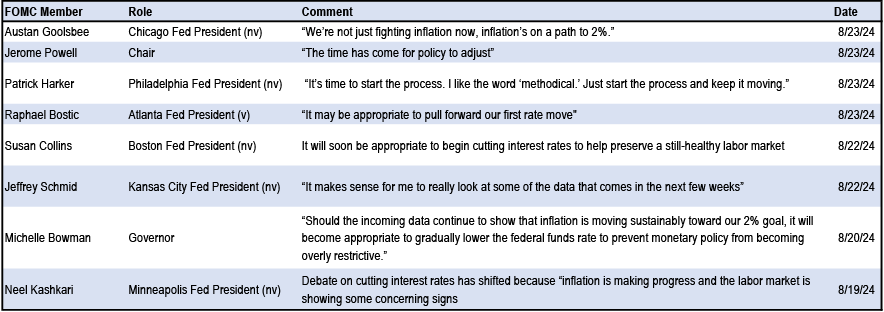
Source: Bloomberg Finance L.P., J.P. Morgan
The minutes from the July FOMC meeting, held before the weak July employment report, echoed a similar dovish sentiment. Several members expressed increased confidence that inflation was moving toward the 2% target, but some participates noted growing risks from continued easing in labor market conditions could lead to more serious deterioration. While only “several” had considered a reduction of 25bp at the last meeting, a “vast majority” were ready to cut at the September meeting, with “many” viewing current policy as restrictive (see July FOMC minutes highlighted labor market risks, A. Reinhart, 8/21/24).
All of this heightens the importance of upcoming labor market data, particularly the August payrolls report, in determining whether the next move will be a 25bp-or-50bp cut. This week’s employment-related data provided evidence that the labor market might not be as strong as what we had thought, but also not severely deteriorating. BLS’ preliminary benchmark revision for the establishment survey revealed that total payroll employment in the year leading up to March 2024 was 818K lower than previously thought, a relatively large revision that was entirely concentrated in private employment. This suggests that average monthly job growth from March 2023 to March 2024 would decrease by about 70k. However, since the revision cuts off in March 2024 and the implications for more recent months are not fully clear, it is difficult to predict how the Fed will interpret this data (see US: Benchmark brings big downward revision to (lagged) jobs, A. Reinhart, 8/21/24). In more recent, higher-frequency data, weekly jobless claims rose slightly by 4k to 232k for the week ending August 10, while the four-week average has remained stable since late June. The growth of continuing claims, which surged between late May and late June, has slowed and might be leveling off (see US: Good news from mostly stable jobless claims, A. Reinhart, 8/22/24). Meanwhile, our economists found little evidence that Hurricane Beryl meaningfully impacted July’s payrolls report and believe that only a small 10-20k would be added to the August payrolls report as jobs were restored after the hurricane (See Focus: Beryl and July jobs, A. Reinart, 8/23/24).
All told, Treasury yields whipsawed once again this week. In the front-end, 2-year yields moved in a wide range, peak to trough, from 3.91% to 4.07%, ultimately closing the week 15bp lower at 3.91%. Our economists still expect a 50bp reduction in both September and November, followed by 25bp cuts thereafter, until reaching 3%. By week’s end, OIS markets are pricing in 104bp of easing by year-end, compared to 95bp last Friday, and about 36% chance of a 50bp cut at the September meeting ( Figure 43).
Figure 43: By week’s end, OIS markets are pricing in 104bp of easing by year-end and about a 36% chance of a 50bp at the September meeting
OIS-implied change in fed funds effective rate by FOMC meeting, as of 8/23/24, and 8/16/24 (bp)
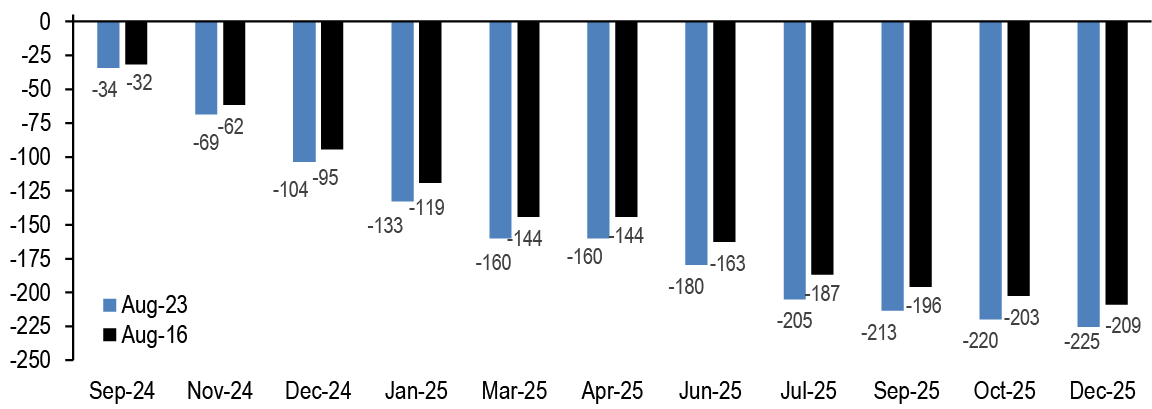
Source: J.P. Morgan
Turning to the Fed’s balance sheet, the meeting minutes didn’t reveal much new information. The SOMA manager noted that repo rates had risen due to increased demand for financing Treasury securities and balance sheet normalization. Meanwhile, the staff projected that ON RRP balances should decline as T-bill issuance increases, though specific idiosyncratic factors for some ON RRP participants might sustain balances. The manager concluded that reserves remained abundant but emphasized that the staff would continue to closely monitor developments in money markets.
To that end, bank reserves have been steady at ~$3.3-3.4tn, mostly flat YTD. Meanwhile, ON RRP balances have fallen by ~$700bn so far this year, as MMFs have shifted towards T-bills and non-Fed repo holdings. Recently, RRP balances have stabilized around the mid to low $300bn level and we suspect there will be limited room to move further lower, in the absence of meaningfully more T-bill supply and given some MMFs’ structural need for liquidity. Consequently, we see QT as being in its final stages, with perhaps a few more months remaining, at which point the Fed’s balance sheet should be around $7tn by year-end, reserves at ~$3.3tn and ON RRP balances slightly below $300bn.
Tracking reserve abundance: insights from the fed funds and repo markets
Last week’s Liberty Street blog posts (see here and here) highlighted several indicators to watch for when the amount of reserves might be transitioning from abundant to ample. Among these indicators are late interbank payments, banks’ intraday overdrafts, domestic borrowing in the fed funds market, and upward pressure in repo rates, as expressed as a share of overnight Treasury repo transacted at or above IORB, assessed in conjunction with the Fed’s daily estimate of fed funds elasticity. Unfortunately, data on these indicators are either not publicly available or are published on a lagged basis, typically around quarter-ends. Based on the above indicators, the staff at the NY Fed concludes that reserves remain abundant as of 1Q24.
Even so, we thought it would be interesting to do a deeper dive into the fed funds market and look at the composition of bank borrowing. As Figure 44 shows, domestic banks have remained largely absent from the overnight market, whether in fed funds or Eurodollar deposits. This is not surprising: in a world where reserves are abundant, domestic banks do not have to borrow in the overnight market to remain funded. However, when access to funding becomes more challenging, as was the case in 2018-2019 and in early 2023, borrowing from the overnight market increases. Meanwhile, FBOs (foreign banking organizations) remain the primary borrowers of fed funds and Eurodollar deposits, though their participation is mostly driven by arbitrage behavior (i.e., borrowing in fed funds/Eurodollars and depositing the proceeds at the Fed to earn IORB). The above is consistent with call reports of banks’ net fed funds borrowing. Indeed, as of 2Q24, domestic banks have not found a need to borrow fed funds on a net basis, regardless of whether they are a US G-SIB or a smaller bank, while FBOs have maintained a steady presence ( Figure 45).
Figure 44: Domestic banks have remained largely absent from the overnight market, both in fed funds and Eurodollar deposits
Fed funds and Eurodollar deposits (OBFR-FF) volumes (LHS, $bn) versus Foreign OBFR volumes as a % of total (RHS,%)
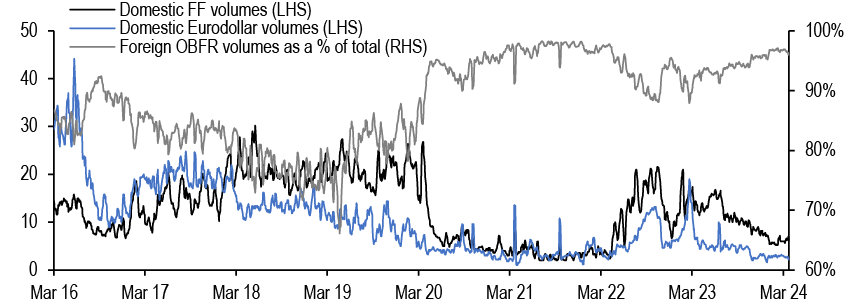
Source: Federal Reserve Bank of New York Fed, J.P. Morgan
We also thought it might be worthwhile to look at how banks’ involvement in repo has evolved, as their participation as marginal buyers of repo not only can help police repo rates on the upside but also signal a decline in liquidity to a point such that overnight Treasury repos trade at or above IORB. This is because banks tend to engage in repo when GC > IORB. To that end, bank call reports show little increased net reverse repo activity on the part of US G-SIBs as of 2Q24, as the GC/IORB spread remained subdued ( Figure 46). This might change in the future as QT continues to drain liquidity out of the system against a backdrop of increased Treasury issuance and elevated dealer inventories. But for now, neither the GC/IORB spread nor US G-SIBs’ net reverse repo activity suggest there is an alarming percentage of overnight Treasury repo transacted at or above IORB that would signal reserve scarcity is approaching.
Figure 45: Domestic banks, whether they are US G-SIBs or smaller institutions, have not needed to borrow fed funds on a net basis, while FBOs have maintained a steady presence
Net fed funds purchased ($bn)
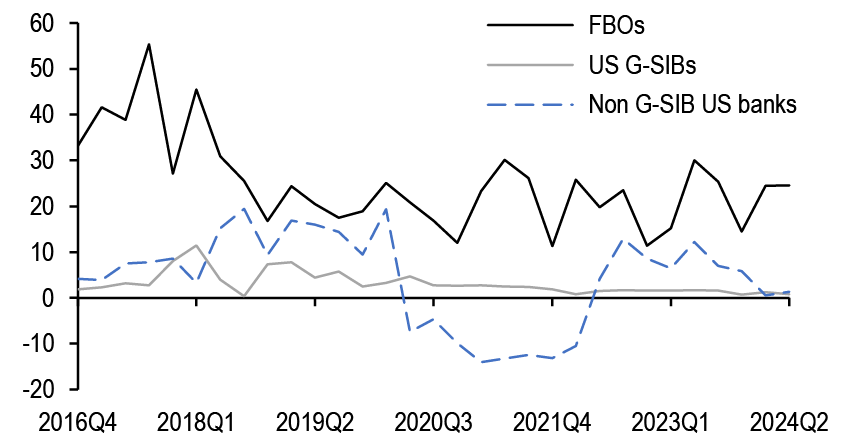
Source: S&P Capital IQ, Bank Call Reports, J.P. Morgan
Figure 46: As of the second quarter, US G-SIBs have shown little increase in net reverse repo activity, as the GC/IORB spread remained subdued
Net reverse repo activity (LHS, $bn) versus GC/IORB spread (RHS, bp)
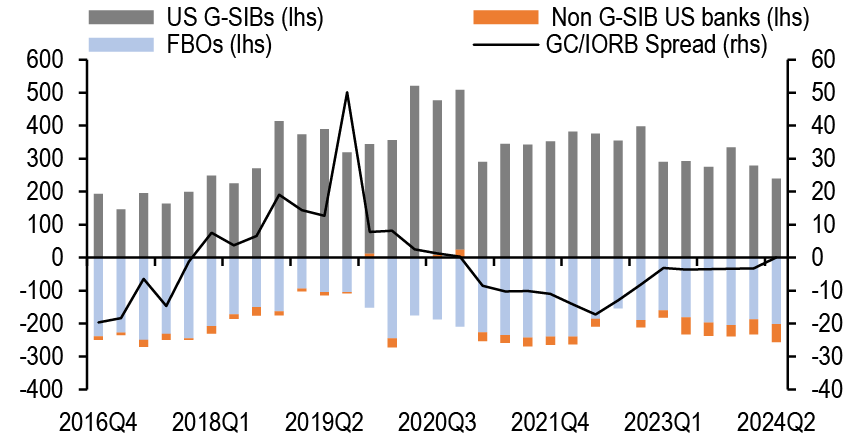
Source: S&P Capital IQ, Bank Call Reports, J.P. Morgan
Excerpted from Short-Term Market Outlook and Strategy, Teresa Ho, August 23, 2024
Agency MBS
Dua LLPA
- Mortgages had a relatively unexciting week, with lower coupons tightening modestly and the rest of the stack close to unchanged
- Along with most spread products, valuations have recovered from the local wides seen early in the month; still, with mortgages continuing to offer historically compelling yields vs. corporates, we think the technical support for the product from money managers can be maintained
- After the early August spike in refi applications, volumes have come down but remain relatively elevated; of note, the MBA conventional refi loan size spike overstates the change in application loan size for GSE eligible loans, as measured by RALI and Optimal Blue
- We take a close look at the call protection offered by stories with higher LLPA charges, namely investor, 2nd home, high LTV, and low FICO
- The higher rates they get come from translating those upfront fees into the rate rather than pure SATO and can be durable upon refinance dependent upon changes in the borrower’s FICO and LTV
- Looking at investor loans (with the longest history of consistent LLPAs to draw from), we show how their rates and prepayments have empirically reflected the behavior implied by the upfront fees
- 2nd home loans now have LLPAs that exactly mirror investor loans, but 100% 2nd pools trade well back of 100% investor
- The historical prepay record, when adjusted for the new fees, doesn’t immediately imply that 2nd homes should be more callable than investor at the same LLPAs, but there are some “known unknowns” as far as differences in underwriting frictions and borrower behavior
Views
- Continue to prefer UIC conventionals, u/w 4.5s&5s
- Prefer seasoning in discounts
- Consider 2nd home pools which trade at payups below comparable investor pools
- Within loan bal, stick to relatively higher cuts to avoid low LTV cashouts
Mortgages had a relatively unexciting week, with lower coupons tightening modestly and the rest of the stack close to unchanged. MBS continue to offer attractive ZVs, somewhat tight OASs (in our model - others see more fair levels), and with IG corporate spreads having fully recovered from their early August widening, support for the sector from money managers is likely to remain robust. Short of a significant shift in the economic data, the market seems to have retracted to the tighter end of the stable range it has traded around this year. Spec payups were perhaps a hair firmer on 5.5s, but generally the moves were not significant.
Figure 47: Higher coupons are starting to recover from their early August widening, and lower coupons are a touch wider
Current, 1m, and 6m Treasury OAS ranges across the TBA stack in our research beta model. The black dots represent the current OAS, the blue boxes represent the 1m range, and the black lines represent the 6m range (as of 4:30PM, 8/22/2024)

Source: J.P. Morgan
Somewhat dovish Fed minutes and the BLS’s 818k downward revision to the level of non-farm payrolls saw a modest bull steepener, with one result being that we now sit at primary rates of ~6.44% on GSE loans (vs. the Aug 5 low of 6.39%) and ~5.47% for VA IRRRLs (actually below the Aug 5 low of 5.61%), according to Optimal Blue data. That hasn’t resulted in another surge in applications, however (see Figure 48 and Figure 49). Evidently, originators picked some of the low hanging fruit earlier in the month, though to be fair the running pace of rate locks is still quite a bit higher than it was two months ago.
Figure 48: Primary rates have edged lower...
GSE rate/term refi lock rates and number of locks
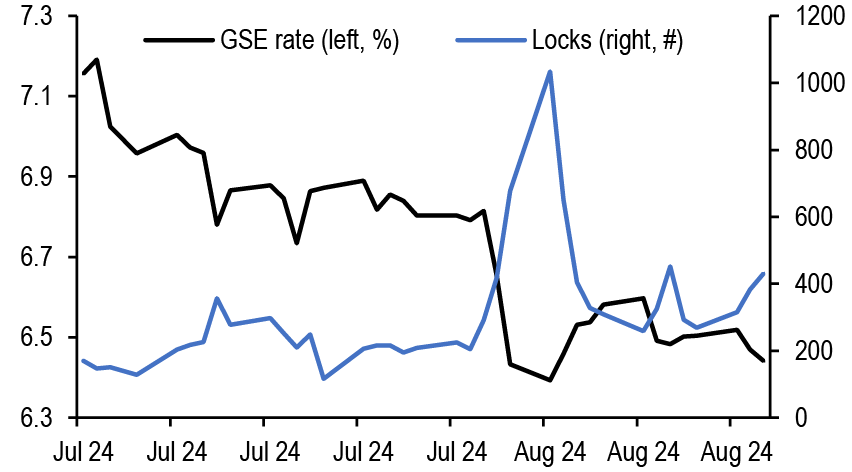
Source: Optimal Blue, https://www2.optimalblue.com/
Figure 49: ...but lock volume is off the early August high
VA rate/term refi lock rates and number of locks
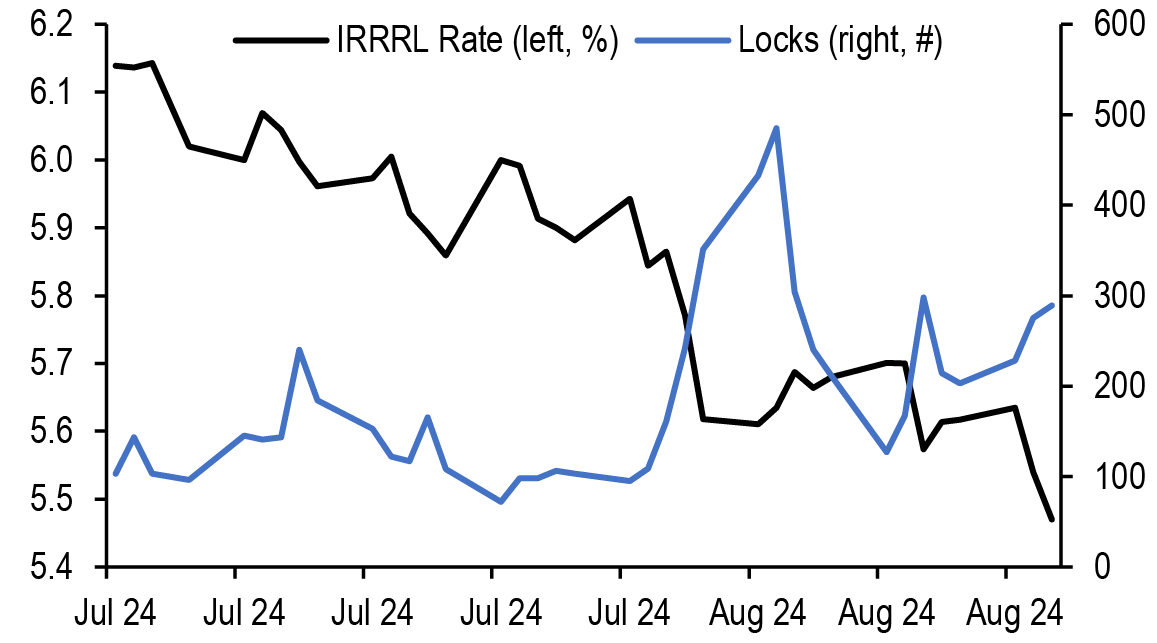
Source: Optimal Blue, https://www2.optimalblue.com/
Most of what we see in the Optimal Blue lock data is consistent with the patterns observed in the RALI and MBA refi indices. The first full week of August (the 5th - 9th) registered the largest increases in application volume across all of these series. One notable discrepancy, however, is in the changes in loan sizes for conventional refi apps. The MBA’s conventional refi application series includes non-conforming loans, which caused their average loan size to surge by $150k between the weeks ending 7/26 and 8/9 ( Figure 50). The series has subsequently dropped to $301k (from a high of $403k) for the week ending 8/16. The information imparted by this swing isn’t particularly useful to MBS investors, however. Since we’re focused on loans in GSE pools, Fannie’s RALI index should tell us much more about how much the average loan size on GSE eligible loans moved; by indexing the ratio of the RALI $ and RALI count, it appears that loan sizes were only up by about 14% in the same period the MBA series implies they were up nearly 60% ( Figure 51). That’s also much more in line with the loan sizes that we see in the Optimal Blue set ( Figure 52).
Figure 50: The MBA conventional refi loan size has been extremely volatile...
MBA conventional refi loan size, $k
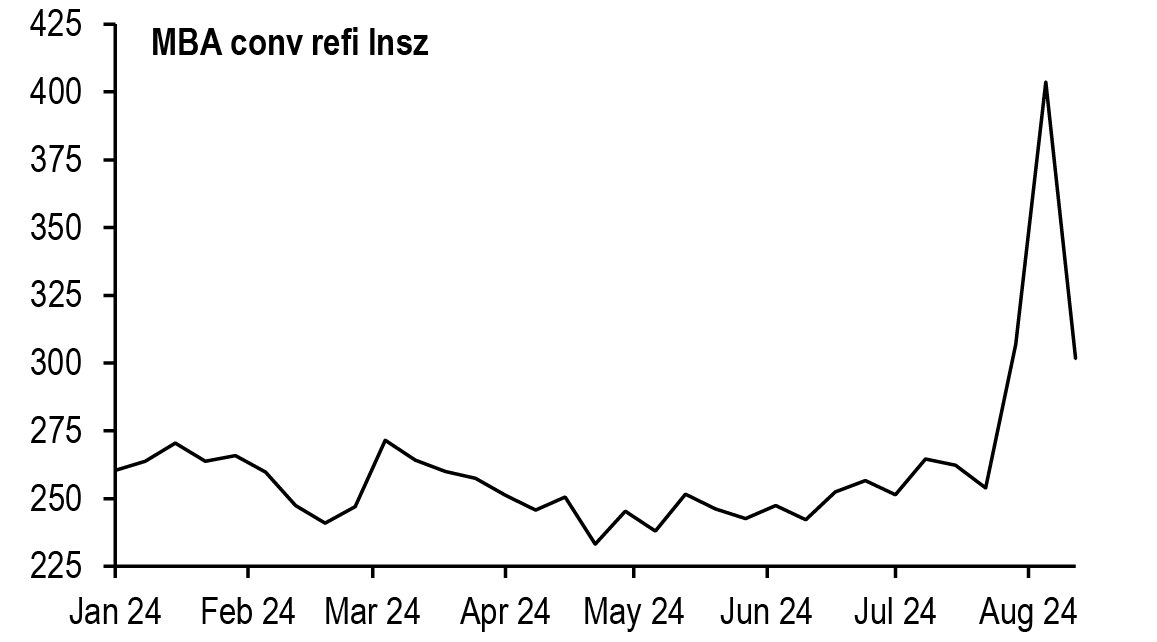
Source: MBA
Figure 51: ...but RALI indicates a much more muted move for conforming loans
Indexed change in MBA conventional refi loan size and RALI implied loan size (ratio of dollar volume and count of applications)
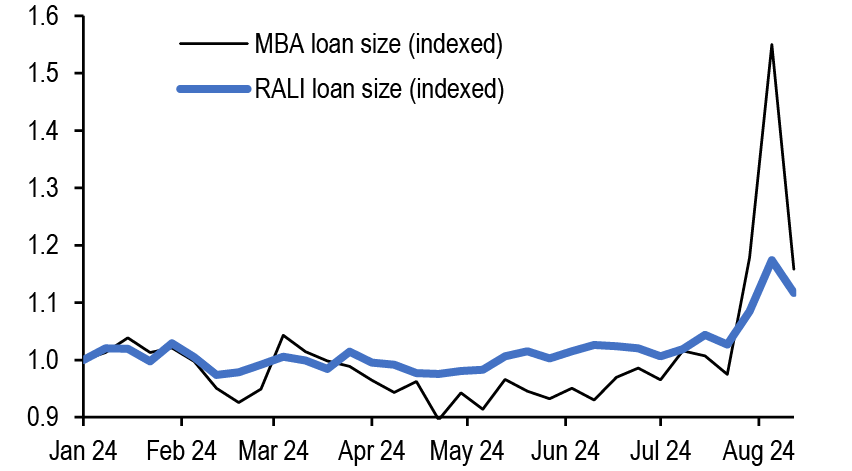
Source: J.P. Morgan, MBA, Fannie Mae
Figure 52: Optimal Blue also shows that the growth in GSE lock size has been on the order of 10-15%
1wk rolling average of VA and GSE refi loan sizes, $k
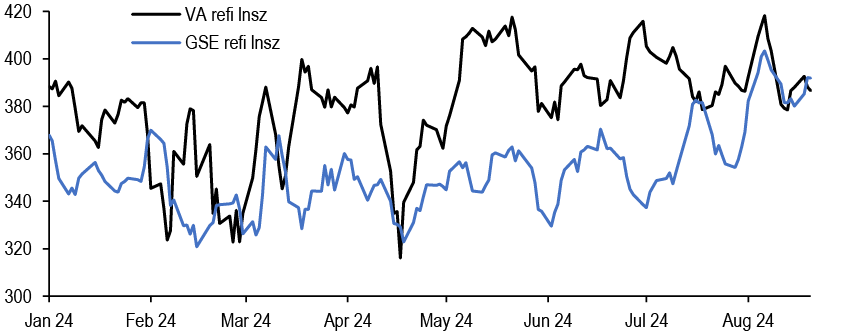
Source: J.P. Morgan,https://www2.optimalblue.com/
Taken all together, we think that this points to the bulk of the expected increase in GSE refi volume being explained by the surge in applications - to estimate the UPB change in refi volume, the additional multiplier provided by the loan size should be more on the order of 10-15%. That still implies a meaningful difference in the rate/term refi volume expected to close in September vs. August (up 80%, but not 150%).
This week, we take a look at the call protection afforded by LLPAs. Generally, the stories with an LLPA angle have a first order elbow shift that can be readily observed in the empirical data for types like investor. However, there are complicating factors, since LLPAs also correlate with borrower characteristics that might imply less propensity to refi or more arduous underwriting.
LLPA-based call protection
A sharp rally and a surging refi index is a good reminder that call risk exists in the mortgage market and that there is a wide menu of spec pool choices that can help mitigate it. In this section, we want to think through the fundamentals of the protection that comes from the Loan-Level Price Adjustments (LLPAs) that are charged based on an individual loan’s characteristic. The most common pool types with protection that comes at least in part from the LLPA Matrix are investors and 2nds (discussed elsewhere in this piece), as well as high LTV and low FICO. Figure 53 gives the key details for each type along with stats based on their actual issuance in pool form this year.
Figure 53: The “big 4” of LLPA spec stories
| LLPA Protection (Based on Limited Cash-out Refinances) | |||
| Spec Category | LLPA level | Elbow Shift (4x mult) | Details/Permanence |
| Occupancy = Investor ($8.3bn 2024YTD) |
1.125-4.125% (LTV Based) 2024 Avg = 1.9% |
30-100bp 2024 Avg = 48bp |
Occupancy category only changes if the owner moves in The LTV (and elbow shift) can move lower with higher home prices or a cash-in refinance The GSEs can (and have) changed general level of LLPAs for the category; the trend has generally been higher for less mission-aligned categories like Inv/2nd homes |
| Occupancy = 2nd Home (since April 2022) ($2bn 2024YTD) |
1.125-4.125% (LTV Based) 2024 Avg = 2.15% |
30-100bp 2024 Avg = 54bp |
Same as above |
| High LTV ($20.7bn 2024YTD) |
0.375-2.5% 2024 Avg = 0.83% |
9-63bp 2024 Avg = 21bp |
Initial LLPA based mostly on FICO Over time, protection degrades as LTVs go lower and FICOs improve (though typically high to start) Have additional incentive to refi under 80LTV to drop PMI |
| Low FICO ($16.8bn 2024YTD) |
0 - 3.875% 2024 Avg = 1.82% |
0-97bp 2024 Avg = 46bp |
Initial LLPA based on FICO + LTV Over time, protection generally degrades as LTVs go lower and FICOs improve, with LLPAs offsetting mortgage insurance costs above 80LTV Have additional incentive to refi under 80LTV to drop PMI |
| LLPA Waiver Categories (a consideration for high LTV/low FICO pools) | |||
| HomeReady/ Home Possible Loans | |||
| Loans to first-time homebuyers with qualifying income ≤100% area median income (AMI) or 120% AMI in high-cost areas | |||
| Loans meeting Duty to Serve requirements (Purchase and limited cash-out refinances, principal residences with total qualifying income ≤100% AMI): Manufactured housing including MH Advantage®, Rural housing - loans in high needs rural regions, Loans to Native Americans on tribal lands, Loans originated by “small financial institutions”, Affordable housing preservation loans – loans financing ENERGY STAR® certified improvements, loans with shared equity |
|||
Source: J.P. Morgan, Fannie Mae, Freddie Mac
How should we think about LLPA protection? We’ll focus on investor loans given their sizable LLPA and long history. At the time of origination, imagine two identical loans at 75LTV, with the only difference being that one is an investment property and the other is owner-occupied. Let’s say the owner loan gets a rate of X%. Then the investment property should get a rate of (X + L)%, where L = the rate equivalent of the LLPA charge for investment properties, which is currently 2.125% upfront. At a 4x mult, not unreasonable lately, L =0.53%. This is where measuring incentive/call protection gets interesting. If X was also the prevailing interest rate at the time of origination, it looks like the owner-occupied loan has 0 incentive while the investor loan has 53bp. Of course, since the same LLPAs apply on rate/term refis, into a 50bp rally we would expect these loans to pay the same (as long as other factors aren’t in play, which we will get to later), even as one shows 50bp of incentive and the other shows 103bp.
We can see this empirically in the origination data ( Figure 54). Narrowing down other characteristics like LTV and FICO so that we get a roughly similar LLPA band between owner and investor, we can look at the rate spread between the two. Over the past 12 years, it has bounced between 30bp and 70bp, with that movement based on both changes in the LLPA charge as well as the multiples being used to price the fee in rate terms.
Figure 54: Seeing the difference in origination rate caused by the LLPA charge for owner versus investor loans
Originated mortgage rate on conventional 30yr investor versus owner loans, controlling for other factors such as LTV (60-70%), FICO (>720), loan size ($250k-$450k), geography (no NY), purpose (purch + rate/term) and units (1 unit) to limit possible differences in LLPA
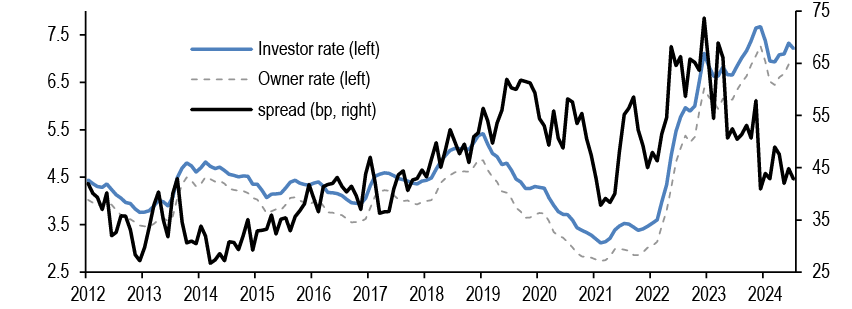
Source: J.P. Morgan, Fannie Mae, Freddie Mac
The current level of 43bp, and the 1.625% charge for 60-70LTV, implies a reasonable 3.8x mult ( Figure 55). Thinking about how that mult (and implied protection) can change into a rally, the rate spread widened out significantly from 2018 to 2020 as coupon swaps compressed and meant that 2018 originated investor loans actually gained another 20bp of elbow shift protection by mid 2019.
Figure 55: The multiple implied by the investor LLPA has typically tracked well with coupon swaps, though we haven’t seen any LLPA mults compress as much as the TBA stack
Translating the spread difference between investor/owner loans into an IO multiple based on the LLPA fee (1.75% before Sep. 2015, 2.125% until 5/1/2023, and then 1.625% for this collateral), along with the current coupon +50 to current coupon +100 multiple
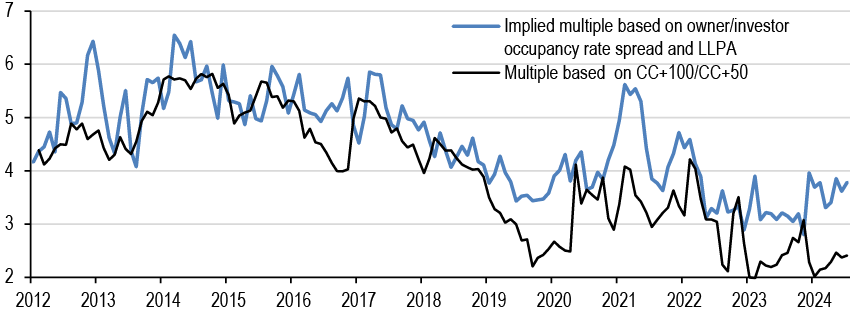
Source: J.P. Morgan, Fannie Mae, Freddie Mac
Interpreting the prepayment data can be trickier, especially during the latest refi wave. One way we can approach it is using a similar cohort originated during the same month like our theoretical example above, in this case, April 2018. Figure 56shows how quickly the owner-occupied speeds ramped up relative to investor during the initial rate drop in 2020. We see this in many spec types, and it seems to boil down to just how capacity-constrained originators were at the start of the rally. That meant prioritizing the biggest loans, and more applicable to investor loans, those with the easiest underwriting process. Beyond their LLPAs, there is a bit more hassle to underwriting investment properties (can’t get an appraisal waiver if rental income is needed to qualify, for example), and that was enough to keep them from matching the speediest loans at the start of the rally. However, as originators bolstered their ranks, the investor cohort eventually paid the same as owners by late 2020. Looking at a 2021 s-curve, this fact is reflected in the neat 50bp elbow curve between the two implied by the LLPAs at the time and a 4x mult ( Figure 57).
Figure 56: The most clean owner loans were far faster than any elbow shift would imply during the initial 2020 rally…
Speeds on April 2018 originated loans (owner vs investor) for UMBS 30yr, >$300k loan size, <75LTV, >720 FICO, 1 unit

Source: J.P. Morgan, Fannie Mae, Freddie Mac
Figure 57: …but the elbow shift eventually re-asserted itself in 2021 as capacity mattered less
UMBS 30yr s-curve observed in 2021 for >$300k, <75LTV, >720 FICO, owner versus investor
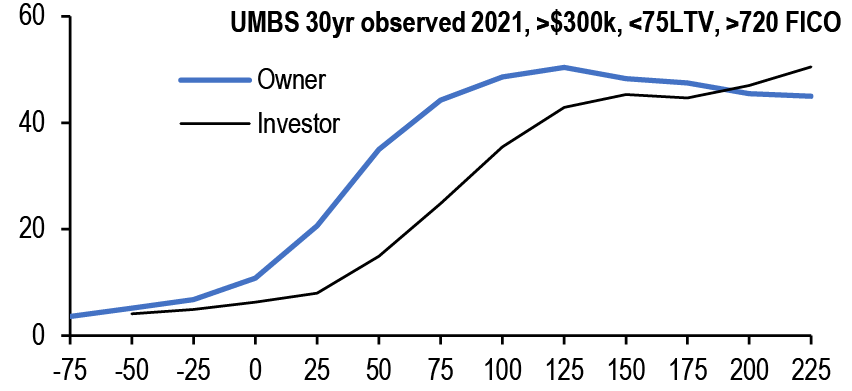
Source: J.P. Morgan, Fannie Mae, Freddie Mac
To wrap-up, in theory the most important aspect of LLPA call protection comes from the implied elbow shift. Now, each category (occupancy, high LTV, low FICO) has its own quirks that goes along with it. In addition, when looking at the refi rate (no cashout), the LLPAs can change as the borrower’s credit profile evolves over the course of the loan. This is particularly true for the LTV and FICO stories, where the protection is often more transient, especially during times of rapid home price appreciation.
Time to go back for Seconds?
Over the past few years, the GSEs have adjusted LLPAs several times, changing levels on the overall FICO/LTV grid and for specific loan characteristics (see MBS Market Commentary: Three Shall Be the Number). After the smoke cleared on these adjustments, 2nd home and investor loans delivered on or after May 2023 emerged with identical LLPAs. Despite this, as well as the fact that 2nd home and investor loan characteristics now broadly mimic one another, investor pools trade at higher payups than 2nd homes ( Figure 58 & Figure 59). Some of this could be perceived differences in underwriting/behavior between the borrower sets or a greater comfort in the long history of investor pools, but the LLPAs and loan stats alone would argue for an increase in payups on 2nd home loans.
In this piece, we’ll explore what is available in the prepay data for comparing the two pool types. To start, we look back at 2021 speeds (when loans had significant incentive, but before the LLPA changes) and consider how they might shift and look with today’s fees. Observing that fully ramped investor and 2nd home s-curves should be similar in today’s environment, we then compare curtailments on ramping loans. Though we find that both 2nd home and investor collateral provide protection against non-spec curtailment spikes, 2nd home curtailment spikes are slightly higher than investor curtailment spikes, so this story is still slightly worse than investor, but only for a tick or two due to these ramp speeds.
Figure 58: New prod 2nd home pool payups are trading 7-14tks back of investor pool payups …
Conventional investor vs. 2nd home average payups for 6s-7s as of 8/22/2024, 1/32s
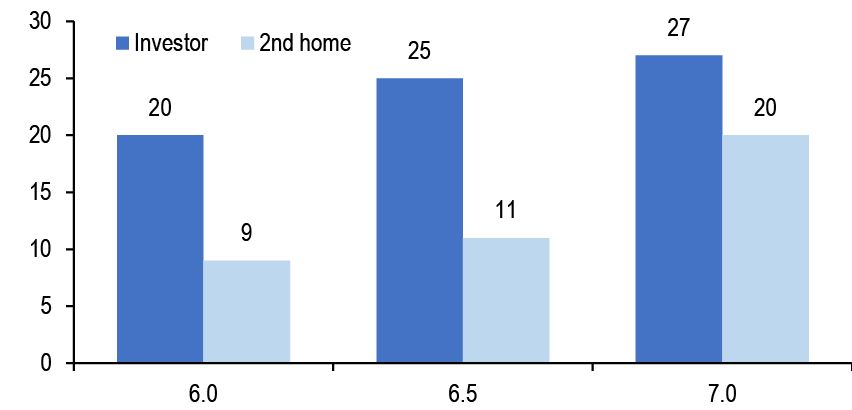
Source: J.P. Morgan
Figure 59: … and this gap cannot be explained by repline differences in loan characteristics, since recent 2nd home and investor collateral eligible for separate pooling looks similar for recent production
UMBS 30 2nd home vs. investor loan stats, for collateral with >50bp incentive, 250k-800k orig. lnsz, FICO > 720, excluding NY, low FICO, and high LTV pools, grouped by issuance years
| Orig. Bal ($bn) | WAC | LTV | Loan size | % 1 unit | SATO | ||
| 2020 - 2021 | 2nd home | 2.7 | 3.8 | 77.1 | 363.6 | 99.9 | 76.0 |
| Investor | 40.1 | 3.8 | 65.7 | 374.2 | 72.3 | 85.0 | |
| 2023 - 2024 | 2nd home | 11.1 | 7.2 | 70.5 | 404.6 | 100.0 | 39.0 |
| Investor | 23.5 | 7.2 | 69.1 | 383.9 | 83.8 | 37.0 |
Source: J.P. Morgan, Fannie Mae, Freddie Mac
The big remaining question mark when considering the call protection of investor versus 2nd home loans is possible underwriting and behavioral differences. For underwriting, it is common for borrowers on investment loans to use their rental income to qualify, adding to the documentation burden and making the process more manual. This friction doesn’t exist on 2nd homes. The behavioral part is harder to ascertain; the change in LLPAs means the historical data isn’t a great guide. On the surface, both sets of borrowers would seem to have ample reason to keep track of refinance opportunities, given their exposure to real estate.
Returning to what we can quantity, looking at the degree of 2ndhome call protection with the new LLPAs is difficult since most loans have been deeply out-of-the-money during the period of 2023. Instead of looking at recent s-curves, we compare ramped 2ndhome and investor s-curves observed in 2021, and then considered how those curves might shift based on today’s LLPAs. At that time, when investor loans had higher LLPAs than 2ndhomes and 2ndhome LLPAs were negligible, there was a clear elbow shift between investors and 2ndhomes ( Figure 60).
Figure 60: When investor loans had higher LLPAs than 2nd homes, there was a clear elbow shift between investors and 2nd homes …
UMBS 30 2nd home and investor 8-30 WALA s-curves observed in 2021, for collateral with 200k-800k orig. lnsz, FICO > 720, excluding NY, low FICO, and high LTV pools, with minimum balances of $500mm and s-curves
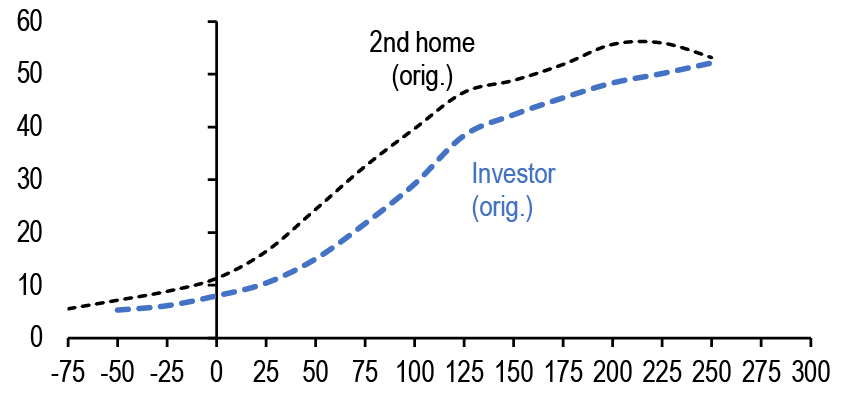
Source: J.P. Morgan, Fannie Mae, Freddie Mac
Figure 61: … but adjusted for LLPAs and LTV, investor and 2nd home eligible collateral eligible for separate pooling would nearly have paid the same
Left-hand chart, without the original investor s-curve, with new 2nd home and investor s-curves adjusted for new LLPAs using investor / 2nd home FICO / LTV / unit distributions, assuming a 5x mult for LLPA changes and 5 pt. lower orig. LTVs for 2nd homes
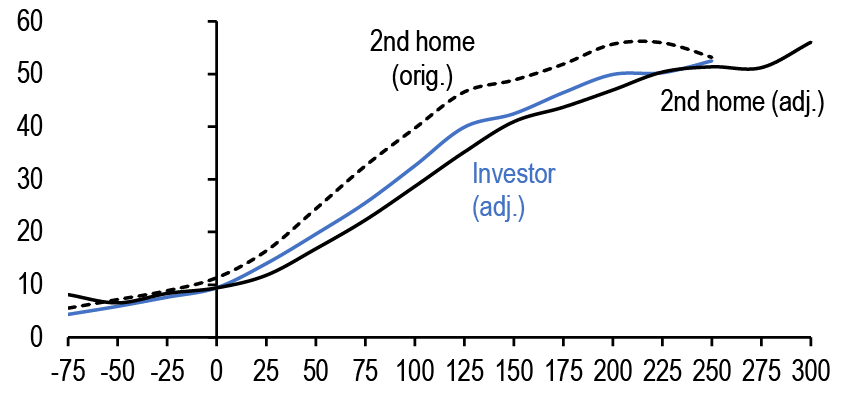
Source: J.P. Morgan, Fannie Mae, Freddie Mac
To reflect potential refi behavior more accurately in the present environment, we first take 2021 2nd home and investor loans and estimate how their LLPAs would change (based on individual stats like LTV/FICO) with the new grid. These changes in fee can be translated into elbow shifts (and plotted into an s-curve) by putting them in rate terms. We choose a 5x mult for this calculation (1% fee = 20bp move in rate incentive) as a reasonable level given what we saw in investor versus owner issued rates during 2021.
Beyond mechanically adjusting these s-curves, we also recognize that the presence of 2nd home LLPAs now affects borrower downpayment behavior in and of itself. For instance, before 2022, a 2nd home borrower could lever up from 75 to 80 LTV without incurring any additional LLPA charge, but now, doing so would mean increasing their rate due to 1.25% more in upfront fees. Borrowers taking out 2nd home loans are motivated to pay more principal than they were before 2022; stepping down an LTV bucket is equivalent to paying points while getting to apply the amount paid directly to principal. Moreover, borrowers taking out loans for 2nd homes likely have primary residences with built up home equity, and they could consider tapping that equity to increase the downpayment on their 2nd home.
With these considerations in mind, we adjust LTVs observed in the 2021 s-curve down by 5 points in addition to adjusting 2021 s-curves based on changes in LLPAs. After this reconstruction, we see that ramped investor and 2ndhome s-curves are roughly in line with one another ( Figure 61). This gives some empirical comfort to the fundamental truth that the LLPAs are the same and should provide equivalent protection as discussed in the earlier section of this piece.
For loans that are still ramping, 2ndhomes and investor collateral both protect against 1-2 WALA curtailment spikes ( Figure 62). When comparing 2ndhomes and investors though, it appears that 2ndhome 1-5 WALA curtailment spikes are slightly faster than those of investor-eligible collateral. At 1-5 WALA, investors pay more in line with 1st time borrowers of owner-occupied homes because they can finance their interest payments with rental income, and thus are under less pressure to pay down their loan at inception.
Figure 62: 2nd home and investor collateral protect against the worst of the 1-4 WALA curtailment spikes, though 2nd home curtailments are slightly faster than investor curtailments
UMBS 30 owner occupied (not first time borrower), 2nd home, investor, and owner occupied (first time borrower) 1 mo. curtailment CPR aging ramps observed Apr.-Jun. 2024, for purchase-only collateral, >250k orig. lnsz, FICO > 720,
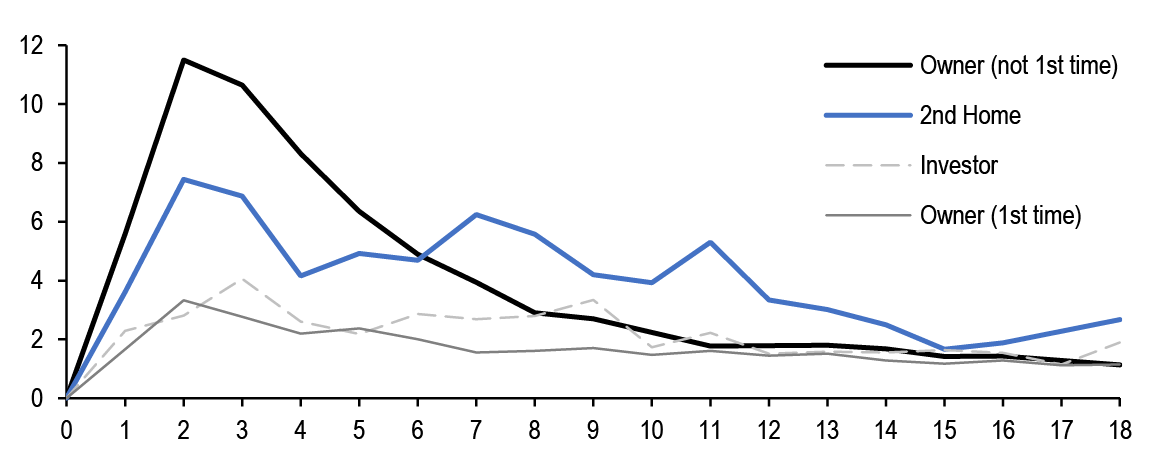
Source: J.P. Morgan, Fannie Mae, Freddie Mac
Our model is currently tuned to slightly faster 2nd home loans speeds roughly equivalent to a 25bp elbow/+0.1 refi multiplier relative to investor loans, using the characteristics of the FNCL 6.5 TBA ( Figure 63 and Figure 64). On this collateral, our model thinks payups should be 23 ticks for investor pools (2 ticks below market) and 14 ticks for 2nd home (3 ticks above). Even with this more aggressive calibration on speeds than LLPAs alone would suggest, the 9 tick model payup gap is 5 ticks larger than the market is currently pricing 6.5s. Pools of course will vary relative to the TBA in other stats (loan sizes are lower) so its worth looking at the exact collateral.
Figure 63: Our model is currently calibrated to 2nd home loans prepaying faster than investor…
FN 6.5 TBA CPR projections in our beta research model, vs. investor and 2nd home (spec types are generated by overriding FN 6.5 occupancy type)
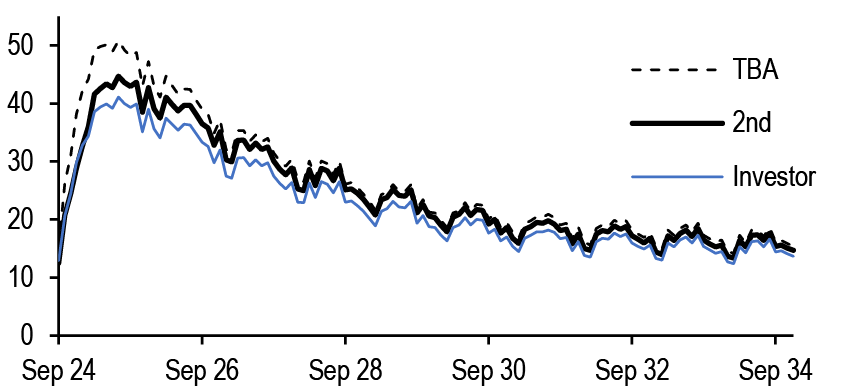
Source: J.P. Morgan
Figure 64: … reflected in a slight elbow shift and higher refi multiplier
FN 6.5 TBA fwd LT CPRs under a range of parallel rate shocks scenarios (flipped to mimic incentive, 0 set at a rates up 100bp scenario), in our beta research model, vs. investor and 2nd (spec types are generated by overriding FN 6.5 TBA occupancy type)
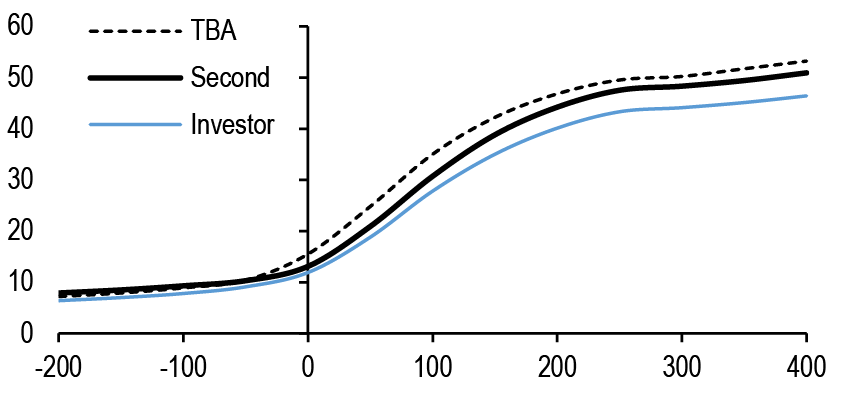
Source: J.P. Morgan
Week in Review
- MBA Weekly Survey: For the week ending August 16, the purchase application index fell 5.2% w/w and was 8% lower than year ago levels, while the refinance index fell 15.2% w/w and was 27.7% higher than the 3-month trailing level (daycount-adjusted, not seasonally-adjusted) ( Figure 62 & Figure 63).
- Freddie Enhanced Primary Survey: For the week prior to August 22, 2024, 30-year conventional conforming fixed-rate mortgages averaged 6.46%, down 3bp from the previous week ( Figure 64).
- Primary dealer specified pool positions rose to $456.5bn (+$4.8bn w/w) as-of close trading August 7. Including TBA positions of -$392.8bn, dealers were long $63.7bn $59.8bn (+$3.9bn w/w) pass-throughs. Other agency MBS holdings rose$0.4bn to $30.8bn.
- Fixed-rate agency gross and net issuances were $95.9bn and $19.0bn, respectively, in July. August gross supply currently stands at $85.9bn ( Figure 65).
- ICI Total Bond Long-term Mutual Fund and ETF Weekly Flows: Inflows were +$6.3bn for the week of August 14, and +$26.2bn for the four weeks leading up to August 14 ( Figure 66).
Figure 65: MBA Purchase Index, calendar year overlay with daycount adjustments
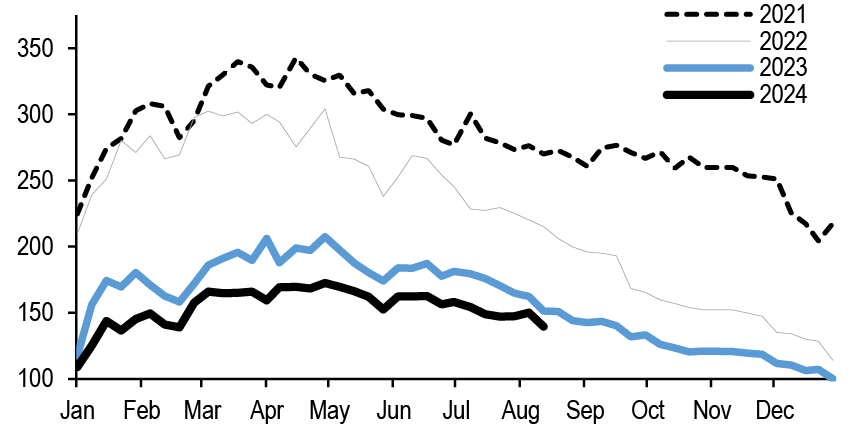
Source: J.P. Morgan, MBA
Figure 66: MBA Refi Indices, seasonally adjusted
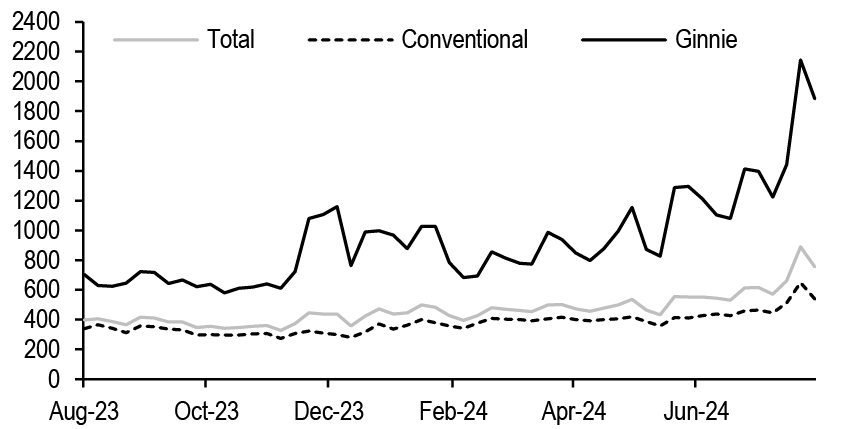
Source: J.P. Morgan, MBA
Figure 67: Primary mortgage rates, %
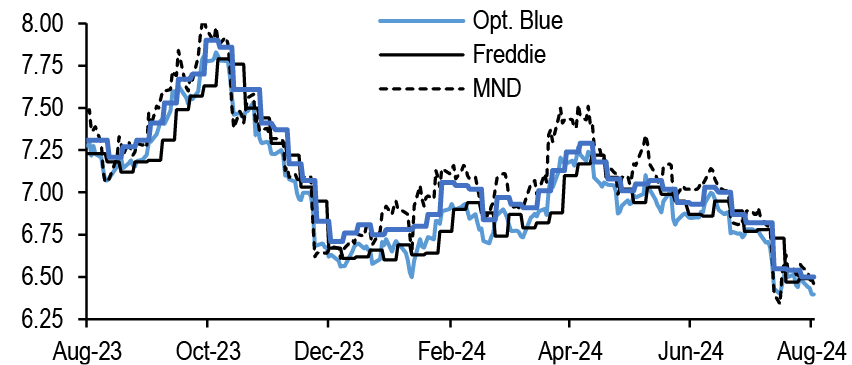
Source: J.P. Morgan, Optimal Blue, Freddie Mac, Mortgage News Daily, MBA
Figure 68: Gross and net fixed-rate MBS monthly issuance, $bn
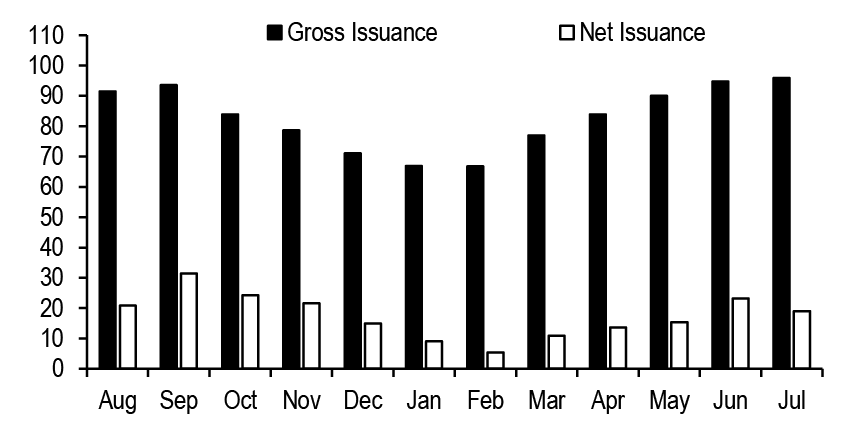
Source: J.P. Morgan
Figure 69: ICI Total Bond Long-term Mutual Fund and ETF Weekly Flows, $bn
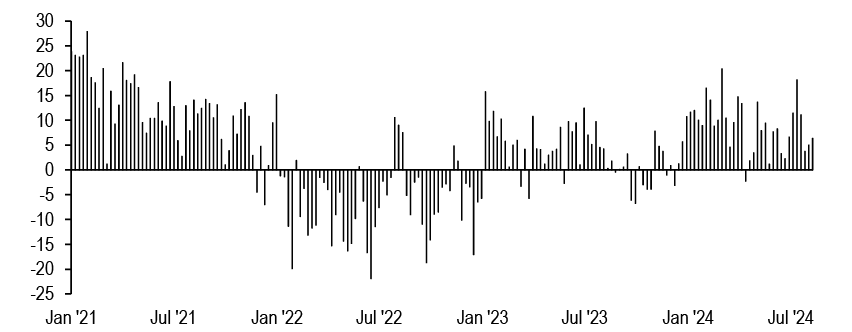
Source: J.P. Morgan, ICI
RMBS Credit Commentary
Non-QM to agency
- AAA non-QM is back to 130bp in the new issue and 6 coupon jumbo PTs are now at 1-04bk, tighter than pre-August rate volatility. We expect spreads to remain rangebound through the last four months of the year as the macro outlook remains challenging and election season quickly approaches
- After we introduced our framework to value the option cost in non-QM, investors were quick to point out the value of the 100bp step-up in the AAA to A coupon
- In other words, there are likely some rate scenarios where the issuer is indifferent between calling the transaction when the collateral price is at a modest discount and paying the 100bp coupon step-up post the four year call
- We implemented a new functionality in MSC that allows us to call the transaction at different collateral prices
- The middle of the coupon stack sees the most impact when the deal is called below par. For example, 6% coupon AAAs structured off 6-7.5 WAC collateral lose 15-30bp of OAS for every 2-point decrease in the collateral price threshold
- Non-QM borrowers are ineligible for agency loans due to a lack of documentation, prior credit event and/or specific loan features. However, can these borrowers eventually qualify and refinance into an agency loan?
- We quantify how non-QM borrowers typically transition to other loan types, providing clarity on borrower refinancing behavior
- Our new non-QM prepayment model will be released in MSC today, August 23rd. We detail how to run the model in MSC
Figure 70: RMBS credit issuance to date...
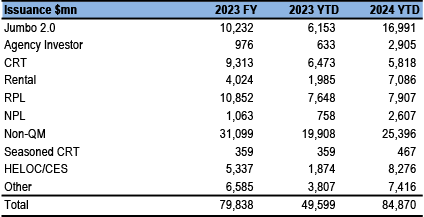
Source: J.P. Morgan, Bloomberg Finance L.P.
Figure 71: ...and spreads
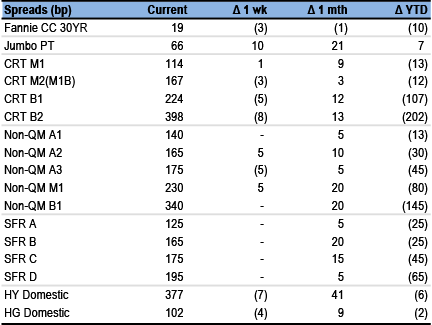
Source: J.P. Morgan
Note: Includes our on-the-run indices. Jumbo is TOAS, non-QM and SFR are spread to treasuries. CRT is SOFR DM@10CPR. HG/HY are spread to treasuries.
Market Commentary
Mortgage credit spreads retraced much of the widening seen in the first week of August. AAA non-QM is back to 130bp in new issue and 6 coupon jumbo PTs are now at 1-04bk, tighter than pre-August rate volatility. We expect spreads to remain rangebound through the last four months of the year as the macro outlook remains challenging and election season quickly approaches.
New issue has continued to be very active throughout the summer. July saw $12bn of new issue RMBS price. August has seen a moderate slowdown with $7bn issued thus far, and the primary market is expected to be light in the last week of the summer.
Non-QM collateral call price vs. option cost
In July, we introduced a framework to value the call option cost in non-QM. In this framework, we run non-QM deals through OAS rate paths, calculate the collateral price at a defined spread in each month post the three-year call date and terminate deals in scenarios where the collateral price is above par. After we introduced this framework, investors were quick to point out the value of the 100bp step-up in the AAA to A coupon. In other words, there are likely some rate scenarios where the issuer is indifferent between calling the transaction when the collateral price is at a modest discount and paying the 100bp coupon step-up post the four-year call. This means that we would be undervaluing the call option cost if we allow deals to be called only when the collateral price is above par. We are currently working on a framework to correctly value the step-up in our non-QM call framework. In the meantime, we have added a new functionality in MSC to allow us to call a given transaction at a different (specified) collateral price.
Figure 72 shows model results when we vary collateral call thresholds, keeping the rest of the framework the same. We terminate deals when the collateral price exceeds $90 to $100, in 2-point increments. The middle of the coupon stack sees the most impact when the deal is called below par. For example, 6% coupon AAAs structured off 6-7.5 WAC collateral lose 15-30bp of OAS for every 2-point decrease in collateral price threshold. Higher coupons, on the other hand, see less of an impact, with AAAs structured off 9 WAC pools losing only 10bp OAS when calling the deal at $98 instead of $100. This is not surprising as the call is in the money across most of the scenarios for higher WAC paper, while cuspy coupons end up losing significant value even with small changes in call assumptions.
Figure 72: The middle of the coupon stack sees the most impact when the deal is called below par
J.P. Morgan non-QM prepayment model run

Source: J.P. Morgan
Non-QM to agency curing
Non-QM borrowers are not eligible for agency loans due to a lack of documentation, prior credit events and/or specific loan features. However, can these borrowers eventually qualify and refinance into an agency loan? Documentation type is a big differentiator of prepayment speeds in non-QM, and its composition has changed over the years. When the non-QM sector first emerged, full documentation borrowers accounted for approximately 30% of originations. Today, this cohort represents only 5% of non-QM loans ( Figure 73). It is likely that a significant portion of full documentation borrowers have refinanced into agency loans, especially following the QM rule change in 2021. In this section, we quantify how non-QM borrowers typically transition to other loan types, providing clarity on borrower refinancing behavior.
Figure 73: Documentation type is a big differentiator of prepayment speeds in non-QM, and its composition has changed over the years
Securitized non-QM originations by loan documentation type
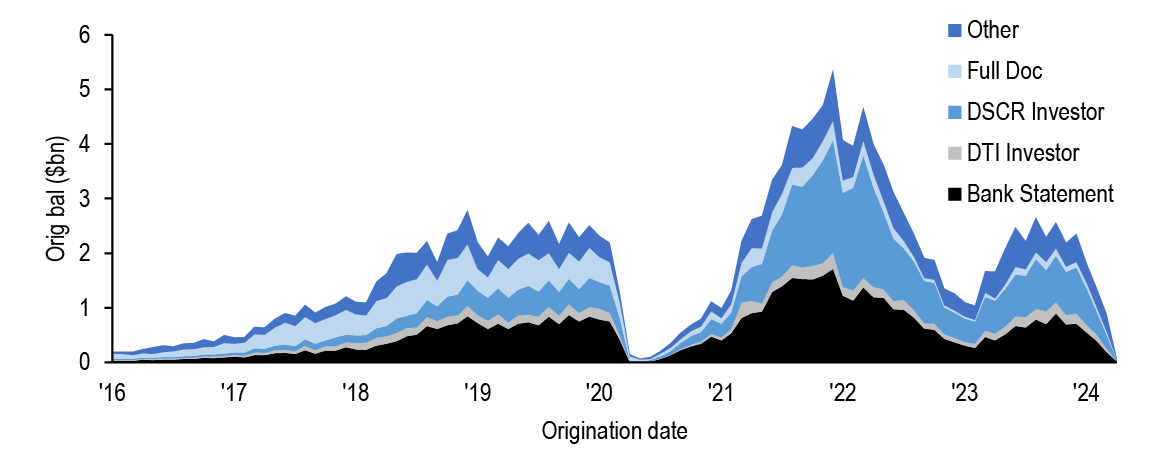
Source: J.P. Morgan, CoreLogic
For this analysis, we use Black Knight’s McDash database to identify non-QM loans and observe what loans borrowers refinance into.1 McDash does not explicitly identify non-QM loans, so we use whole loans with a spread over the jumbo rate >75bps (for jumbo loans) or spread over the conforming rate >75bps (for conforming loans) as a proxy for the sector. Figure 74 shows loan origination balances for the segment we identify as non-QM in McDash versus IMF (‘expanded credit’) and all securitized non-QM. The balance of loans we identify as non-QM in McDash is small, and the proportion where we can identify the loan the borrower transitioned to next is even smaller (see black bars in the figure) – around $600mn to $4bn in each vintage bucket. In some vintages like ‘21 and ‘22, McDash non-QM balances are close to, or higher, than the IMF origination volumes. Nevertheless, as we show below, the loan strats are comparable, and in the absence of more precise ways to identify non-QM, we work with this dataset below, with these caveats.
Figure 74: The balance of loans we identify as non-QM in McDash is small, but in the absence of more precise ways to identify non-QM, we work with this data below
Origination balance by loan vintage for McDash non-QM WL with an identified next loan after being paid in full, all McDash non-QM WL, IMF expanded credit and all securitized non-QM

Source: J.P. Morgan, Black Knight, IMF
Figure 75 shows collateral strats comparing the identified McDash non-QM loans to CoreLogic securitized non-QM loans. Average spread by vintage ranges from 180-242bp over the conforming rate, which is in a similar, if not slightly higher range than securitized non-QM. The vintage-level FICO, LTV and WACs are comparable. Our McDash AOLS are slightly smaller than securitized non-QM, which could mean that we are capturing some additional agency loans.
Figure 75: Loan strats are fairly comparable between the identified McDash non-QM and CoreLogic’s securitized non-QM
Collateral strats for identified McDash non-QM vs. CoreLogic securitized non-QM
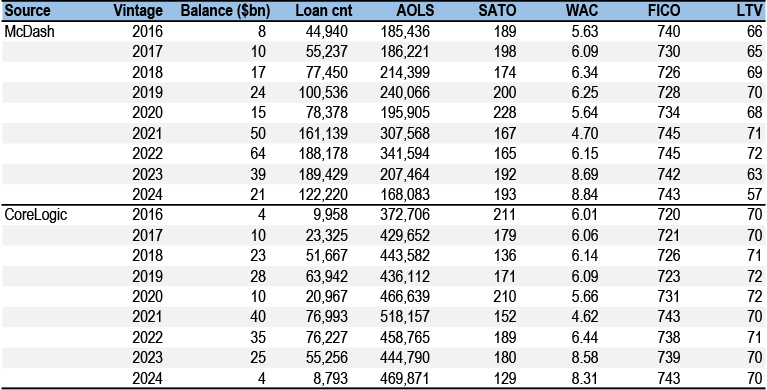
Source: J.P. Morgan, Black Knight, CoreLogic
With this dataset, we look at what kinds of loans non-QM borrowers transitioned to after paying the initial non-QM whole loan in full. We first look at the existing mortgage universe. Purchase loans, which refer to borrowers who sold their prior home, or who are new home owners, have historically accounted for the majority of loan purpose types at roughly 65% of transactions ( Figure 76). In ‘20 and ‘21, however, in the midst of historically low rates, purchase loans accounted for only ~40% of transactions, while rate/term refis increased to 35-45%, exceeding cashout refis.
McDash is only able to identify the agency type of the next loan in refi transactions and not purchase transactions, so we limit our analysis to the former. In refi transactions, earlier vintages saw more borrowers transition to GSE loans, with the share peaking in the 2018 vintage ( Figure 77). Later vintages have seen more of a shift towards WLs, but the volume of borrowers prepaying for refi has also drastically decreased. Across the vintages, borrowers that transition to Ginnie loans from the initial non-QM WL see the largest %-pt decrease in WAC, followed by GSE and then WL.
Figure 76: Purchase loans have historically accounted for the majority of loan purpose types, while refi transactions increased in ‘20 and ‘21
Refi/cashout/turnover split for all mcdash by loan vintage and loan purpose, for all McDash loans
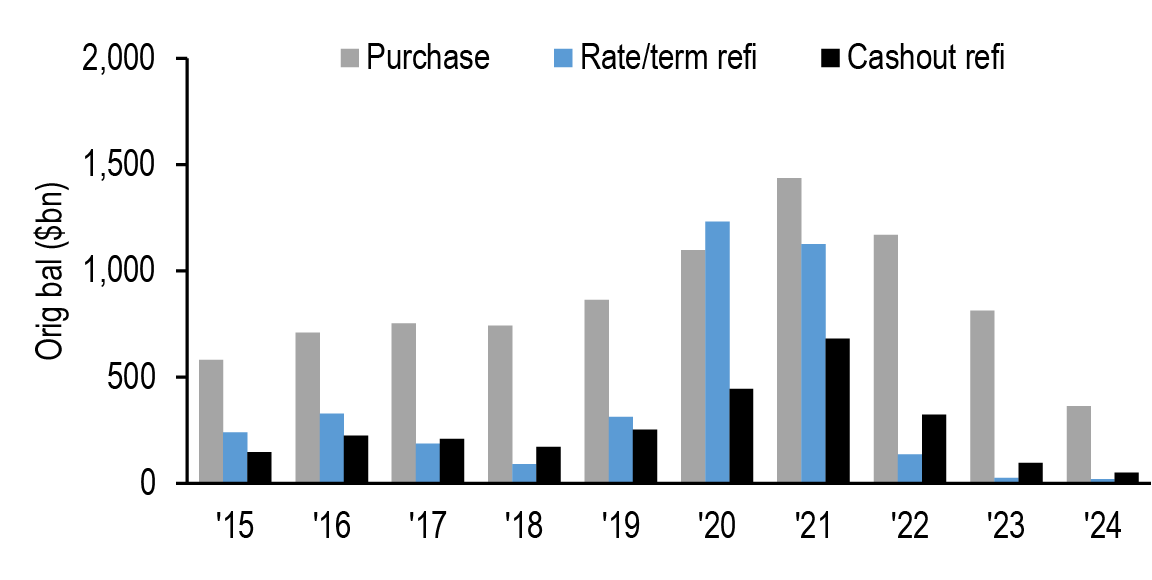
Source: J.P. Morgan, Black Knight
Figure 77: Earlier vintage non-QM WLs saw more borrowers transition to GSE loans after payoff, with that share peaking in 2018 vintage loans
Proportion of loans by loan vintage and next loan type. Only includes borrowers that did refi transactions
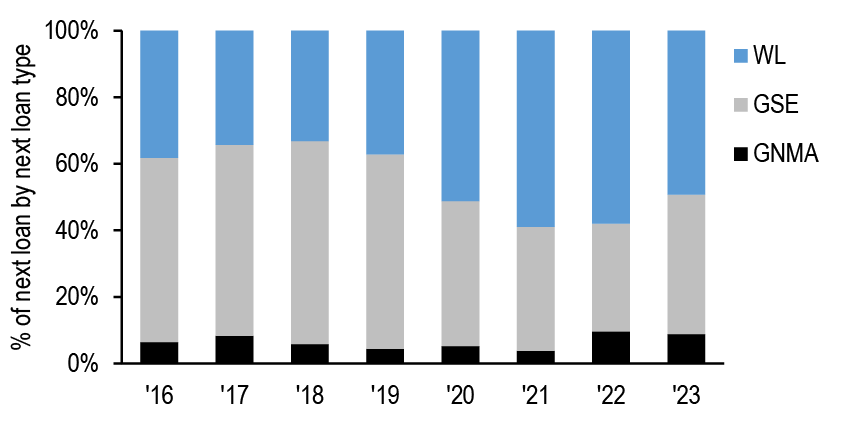
Source: J.P. Morgan, Black Knight
We break this down further. Non-QM borrowers who transition to Ginnies largely do cashout refi transactions, and this share has remained roughly the same over time ( Figure 78). These borrowers could potentially be less financially savvy in terms of refi options, or, more likely, need the cash on hand for other purposes. On the other hand, borrowers who transition to GSE loans largely do a mix of cashout and rate refis ( Figure 79). With very little balance in later vintages, we take these shares with a grain of salt.
Figure 78: Borrowers who transition to Ginnies largely do cashout refi transactions…
Refi transaction type by loan vintage for non-QM WLs that transitioned to a Ginnie loan, share by loan count. Only includes borrowers that did refi transactions
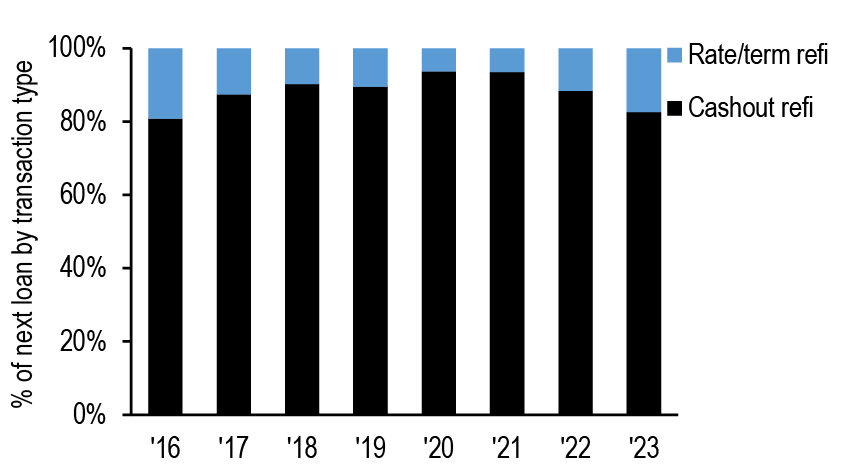
Source: J.P. Morgan, Black Knight
Figure 79: …while borrowers who transition to GSE loans do a mix of rate and cashout refis
Refi transaction type by loan vintage for non-QM WLs that transitioned to a GSE loan, share by loan count. Only includes borrowers that did refi transactions
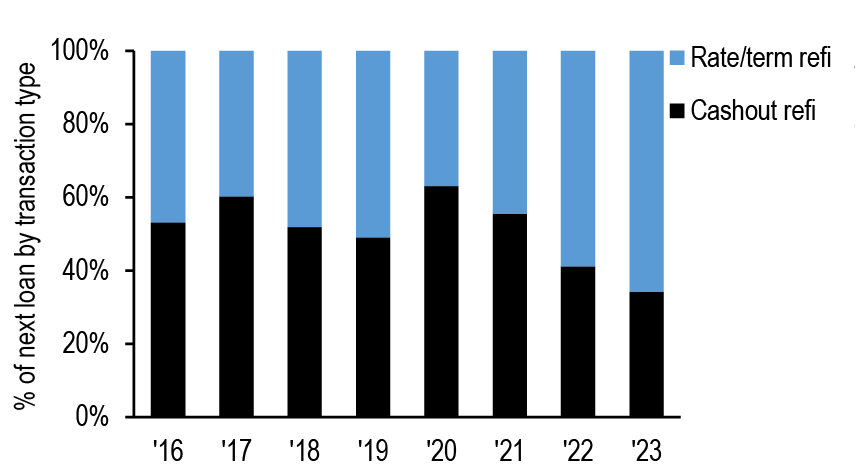
Source: J.P. Morgan, Black Knight
Limitations in the dataset prevent us from further breaking out the data by initial documentation type. Still, we can make some inferences based on what we know from securitization originations. For instance, more recent vintages reflect more investor and bank statement loan performance and fewer full doc loans, and vice versa for earlier vintages, although it is hard to attribute changes in performance to doc type alone given the vastly different economic environments. While the dataset we have remains a fraction of the overall market, this gives us a better understanding of borrower behavior in refi transactions in non-QM.
Non-QM prepayment model will be released today
Our new non-QM prepayment model will be released in MSC at close today, August 23rd. Figure 80 shows the temporary MSC settings required to correctly run the model in MSC. These settings will become the default in the upcoming October MSC release. At that point, users will only need to select Research Settings in the calculator.
For now, please use the settings in the table below. Users will need to set three Environment Variables under Preferences (gear icon, top right of MSC) and add some additional columns and column inputs. Once this is done, users can run both the loan-level and pool-level models. When running OAS, we recommend using the pool-level model, which can be set by using Run Pool Level Model = Yes.
Users will be able to run our non-QM call framework using the following specifications:
- To run our call value framework, (1) select Pricing Call under Additional Outputs and (2) add OAS Call Spread column from Column Configuration.
- To run the call with different collateral price, use the PRICING_CALL_THRESHOLD environment variable.
- Users can also run deals to an immediate three year call by setting CMO Run to Call = Yes.
Figure 80: Our new non-QM prepayment model will be released in MSC as of close today, August 23rd
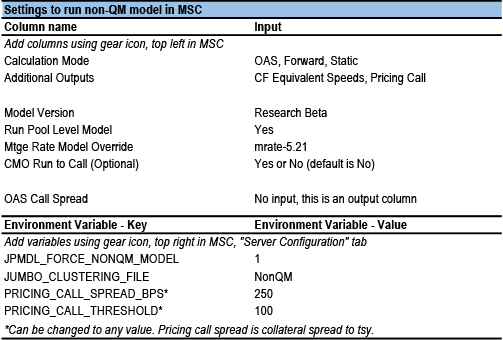
Source: J.P. Morgan
CMBS Weekly
2023 CMBS financials update - operating expense growth moderates but still running hot
- It was a relatively quiet week for CMBS this past week with only two new issue deals pricing. Benchmark CMBS spreads were slightly tighter with 10yr conduit CMBS LCF AAAs 1bp tighter week-over-week at J+102 and 10yr Freddie K A2s 1bp tighter at J+52.
- Full year 2023 conduit CMBS property financial data indicates that net cashflow (NCF) growth has slowed materially compared to the previous two years. This slowdown was due to decelerating top-line revenue growth and operating expense growth, which, while decelerating, remained elevated
- By core property type, we see that lodging and office saw NCF shrink in 2023. We are beginning to see the sticky effects of inflation on an asset class like lodging that is highly operationally levered with an expense ratio of about 70% historically
- We have seen operating expenses grow materially for multifamily when examining Freddie K data but top-line revenues for Freddie K (and conduit CMBS for that matter) loans grew by 6.8%, leading to a relatively healthy bottom-line NCF growth of 6.1% in 2023. This supports the notion that while rent growth on new leases may have decelerated materially, rent growth for lease renewals likely held up much better
- We find that labor-related expenses broadly categorized as payrolls and expenses (property management employee costs) and repairs and maintenance in the OSAR data contributed most to elevated operating expense growth in the multifamily sector over the last few years
- The growth in insurance premiums have been eye-popping and may continue to grow at elevated rates as it appears climate risk is underpriced in the real estate market. Unsurprisingly, metro areas in climate/natural disaster affected areas (broadly Florida and Texas MSAs) have seen the most acute growth in insurance premiums
Figure 81: CMBS spread summary
| This Week | Change | |||
| 1w | 1m | YTD | ||
| Conduit New Issue (UST) | ||||
| 5yr Super-Senior LCF AAA | 114 | 0 | N/A | N/A |
| 10yr Super-Senior LCF AAA | 102 | -1 | 0 | -23 |
| 10yr AS | 155 | -9 | 3 | -40 |
| 10yr AA | 185 | -8 | 3 | -48 |
| 10yr A | 225 | -16 | -2 | -140 |
| Pre-COVID BBB- | 570 | -37 | -33 | -273 |
| 10yr BBB- | 580 | -43 | -38 | -298 |
| 10yr XA | 140 | 2 | 2 | -85 |
| Agency CMBS (UST) | ||||
| Freddie K A1 (10yr) | 50 | -2 | 2 | -8 |
| Freddie K A2 (10yr) | 52 | -1 | 1 | -8 |
| Freddie K Floater (10yr) | 62 | -1 | 4 | -8 |
| Freddie K X1 | 140 | 0 | 0 | -40 |
| Freddie K X3 | 350 | 0 | 0 | -75 |
| FRESB A5H | 115 | -5 | 0 | -10 |
| FRESB A10F | 81 | -2 | 0 | -14 |
| FNA DUS 10/9.5 TBA | 57 | 0 | 4 | -10 |
| FNA DUS SARM | 65 | 0 | 2 | -8 |
| GNR Project Loan (3.5yr) | 130 | 0 | -5 | -25 |
Source: J.P. Morgan
Figure 82: Summary of CMBS issuance and dealer holdings
| YTD Issuance ($bn) | 2024 | 2023 | % Diff. |
| Conduit | 19.9 | 12.5 | 60% |
| SASB | 43.6 | 11.5 | 280% |
| CRE CLO | 4.9 | 3.6 | 35% |
| Other | 0.3 | 1.0 | -73% |
| Total Private Label | 68.6 | 28.5 | 141% |
| Freddie K | 17.7 | 20.0 | -11% |
| Freddie Multi PC | 9.0 | 9.3 | -4% |
| FRESB | 0.8 | 1.1 | -32% |
| Fannie MBS | 24.1 | 31.2 | -23% |
| GNR PL | 5.9 | 6.0 | -3% |
| Freddie Other | 2.2 | 1.1 | 98% |
| Agency CMBS | 59.7 | 68.9 | -13% |
| Total CMBS | 128.3 | 97.3 | 32% |
| YTD Issuance ($bn) | 2024 | 2023 | % Diff. |
| Private Label Fixed | 30.7 | 20.4 | 51% |
| Private Label Floating | 37.9 | 8.1 | 368% |
| Agency Fixed | 56.0 | 61.5 | -9% |
| Agency Floating | 3.9 | 9.3 | -58% |
| Dealer Holdings ($bn) | 8/14/24 | 8/7/24 | 7/17/24 |
| Private Label | 5.21 | 5.33 | 5.72 |
| Agency CMBS | 13.41 | 13.83 | 14.48 |
Source: J.P. Morgan, Commercial Mortgage Alert, Federal Reserve Bank of New York, Fannie DUS Disclose
Note: Dealer holdings reported with a 1-week lag
Weekly market snapshot
Market commentary - upper IG mezz look cheap
It was a relatively quiet week for CMBS this past week with only two new issue deals pricing compared to a more frenetic pace in recent weeks. Benchmark CMBS spreads were slightly tighter with 10yr conduit CMBS LCF AAAs 1bp tighter week-over-week at J+102 and 10yr Freddie K A2s 1bp tighter at J+52. Benchmark CMBS valuations are fair relative to their corporate and mortgage comps as they have been for some time now. Conduit IG mezz tightened more, with AS to single-As tightening by 8-16bp week-over-week versus their corporate comps that were roughly flat. We had noted better relative value in IG mezz in recent weeks (see here and here).
Spread volatility around major economic data releases (particularly employment reports) remain a concern but we view loss risk to IG mezz as very limited under our Base Case loss projections ( Figure 83). Assuming our house view of a slowing economy avoiding a recession materializes, we should continue to see the spread curve bullishly flatten. Given near-term risks to data, we favor the upper IG mezz bonds (AS and AA bonds) that still look cheap to corporate comps but also to the spread curve ( Figure 84).
Figure 83: We continue to see limited writedown risks for conduit IG mezz
J.P. Morgan Conduit CMBS loss model cumulative loss projections
| Vintage / Property Type | Base | Bearish | |
| All 2.0 | 2010-24 | 5.0% | 6.0% |
| Vintage | 2010 | 2.6% | 2.6% |
| 2011 | 2.7% | 2.7% | |
| 2012 | 4.1% | 4.1% | |
| 2013 | 3.8% | 3.8% | |
| 2014 | 4.9% | 4.9% | |
| 2015 | 4.4% | 4.5% | |
| 2016 | 4.9% | 5.2% | |
| 2017 | 5.5% | 6.3% | |
| 2018 | 5.2% | 6.2% | |
| 2019 | 6.9% | 8.4% | |
| 2020 | 6.5% | 8.1% | |
| 2021 | 5.8% | 7.4% | |
| 2022 | 7.6% | 9.9% | |
| 2023 | 4.7% | 6.1% | |
| 2024 | 2.2% | 3.1% | |
| Property Type | Office | 8.8% | 11.8% |
| Retail | 4.3% | 4.3% | |
| Lodging | 3.4% | 3.4% | |
| Multifamily | 1.7% | 1.7% | |
| Industrial | 1.4% | 1.4% | |
| Other | 1.8% | 1.8% | |
| Average Loss | AAA | 0.0% | 0.0% |
| By Original | AA | 0.0% | 0.2% |
| Rating | A | 0.7% | 3.2% |
| BBB+ | 7.7% | 13.1% | |
| BBB | 6.3% | 26.6% | |
| BBB- | 9.8% | 16.4% | |
| BB | 33.9% | 46.3% | |
| B | 55.9% | 62.4% | |
| NR | 81.6% | 83.4% | |
Source: J.P. Morgan
Figure 84: Conduit CMBS upper IG mezz are cheap on the spread curve
Residuals from linear regressions of 10yr conduit CMBS AS and AA Treasury spreads to those of adjacent tranches (bp)
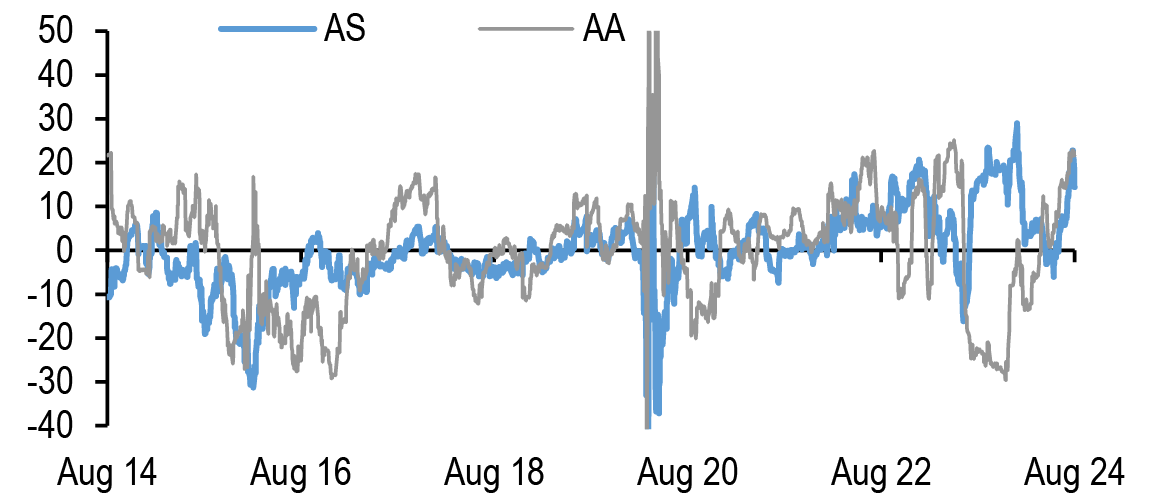
Source: J.P. MorganNote: Modeled spreads linearly regresses 10yr conduit CMBS AS spreads against 10yr conduit CMBS LCF AAA and 10yr conduit CMBS AA spreads over the last 10 years (R2 = 96%,SE = 8.8bp) and 10yr conduit CMBS AA spreads against 10yr conduit CMBS LCF AS and 10yr conduit CMBS A spreads over the last 10 years (R2 = 97%,SE = 12bp).
While Agency CMBS has tightened week-over-week, we still see 5yr Agency CMBS as leaning cheap relative to current coupon Treasury OAS and ZVs ( Figure 85).
Figure 85: 5yr Agency CMBS still leaning cheap relative to current coupon mortgage OAS and ZV
5yr Freddie K A2 (actual) versus modeled spread and difference between actual and modeled spreads (residual), bp

Source: J.P. MorganNote: Modeled spreads linearly regresses 5yr Freddie K A2 spreads against current coupon FNMA 30yr Treasury OAS and current coupon FNMA 30yr Treasury ZV spreads over the last 5 years. R2 = 72.4%,SE = 8.7bp.
Ratings Tracker
Figure 86: Summary of deals with ratings action
Summary of CMBS deals with ratings actions (upgrades and downgrades), August 16, 2024 to August 22, 2024
| Deal Name | Deal Type | CMBX | Upgrade (+) / Downgrade (-) | # of Bonds w/ Ratings Changes | Senior Most Bond w/ Ratings Changes | Notches | Rating Agency |
| BAMLL 2015-ASTR | SASB | N/A | - | 7 | AAA | 2-3 | S&P |
| BMARK 2020-B20 | Conduit | 14 | - | 6 | BB+ | 2-3 | Fitch |
| CGCMT 2017-C4 | Conduit | N/A | - | 3 | BBB- | 2-3 | Fitch |
| CGCMT 2017-P8 | Conduit | 11 | - | 14 | AA- | 2-3 | Fitch |
| COMM 2014-CR16 | Conduit | N/A | - | 4 | B | 1-3 | Fitch |
| COMM 2014-CR17 | Conduit | N/A | - | 4 | B+ | 2-3 | Fitch |
| COMM 2015-CR23 | Conduit | N/A | - | 3 | BBBL | 2 | DBRS Morningstar |
| COMM 2016-667M | SASB | N/A | - | 5 | AAA | 2-3 | S&P |
| DBGS 2018-C1 | Conduit | 12 | - | 5 | BBB | 2 | Fitch |
| FREMF 2019-K103 | Agency | N/A | + | 3 | A+ | 2 | KBRA |
| GSMS 2015-590M | SASB | N/A | - | 4 | AA- | 2-3 | KBRA |
| JPMCC 2020-NNN | SASB | N/A | - | 6 | AA+ | 1-3 | KBRA |
| JPMCC 2021-BOLT | SASB | N/A | - | 4 | AAA | 3-5 | KBRA |
| MSC 2021-230P | SASB | N/A | - | 6 | AAA | 3-6 | KBRA |
| MSSG 2017-237P | SASB | N/A | - | 7 | AAA | 2-3 | KBRA |
| NCMS 2019-FAME | SASB | N/A | - | 9 | Aaa | 2-3 | Moody's |
| TMSQ 2014-1500 | SASB | N/A | - | 5 | Aa2 | 4 | Moody's |
Source: J.P. Morgan, Bloomberg Finance L.P.
Figure 87: CMBS ratings downgrades to upgrades ratio since March 2021
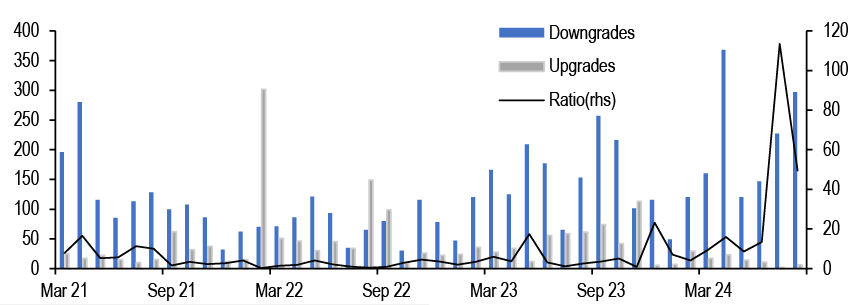
Source: J.P. Morgan, Bloomberg Finance L.P.
Primary Markets
Figure 88: Summary of recently priced deals
Summary of CMBS deals that have priced between August 16, 2024 to August 22, 2024
| Deal Name | Pricing Date | Deal Type | Deal Size ($mn) | Pricing Spread |
| WFCM 2024-C63 | 8/16/2024 | Conduit CMBS | $714 | A1: J+90 A3: J+132 ASB: J+109 A4: J+102 A5: J+104 AS: J+155 B: J+185 C: J+225 |
| BANK5 2024-5YR9 | 8/19/2024 | Conduit CMBS | $910 | A1: J+92 A2:J+116 A3: J+118 AS: J+175 B: J+205 C: J+270 |
| ELMCL 2024-GTWY | 5/22/2024 | Floating-rate SASB | $480 | A: TSOFR+275 B: TSOFR+350 C: TSOFR+500 D: TSOFR+700 E: TSOFR+975 |
Source: J.P. Morgan, Bloomberg Finance L.P.
2023 CMBS financials update - operating expense growth moderates but still running hot
Full year 2023 conduit CMBS property financial data indicates that net cashflow (NCF) growth has slowed materially compared to the previous two years. This slowdown was due to decelerating top-line revenue growth and operating expense growth, which, while decelerating, remained elevated ( Figure 89). In our view, as top-line revenue growth continues to normalize, expense management will become a greater focus going forward.
Figure 89: Conduit CMBS net cashflow growth has moderated substantially on slower revenue growth and elevated operating expense growth
2014-2019 vintage conduit CMBS same-store annual changes in revenues, operating expenses, and net cashflows

Source: J.P. Morgan, Trepp
By core property type, we see that multifamily, industrial, and retail conduit CMBS loans were able to grow NCF in 2023 while lodging and office saw NCF shrink ( Figure 90). Looking back to longer same-store data from 2019, we see that conduit office loans have seen sequential declines in NCF with 2023 full-year NCF now sitting 6% below underwritten levels ( Figure 91).
Figure 90: Multifamily, industrial, and retail properties backing conduit CMBS grew net cashflows in 2023 while lodging and office saw net cashflows shrink...
2014-2019 vintage conduit CMBS same-store year-over-year change in revenues, operating expenses, and net cashflows by property type, as of 2023
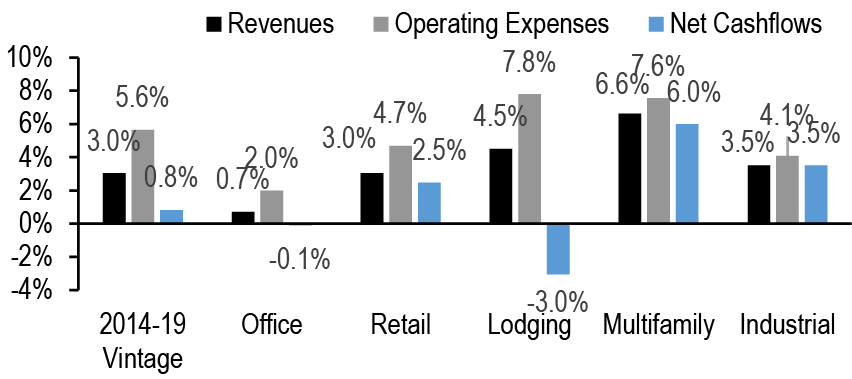
Source: J.P. Morgan, Trepp
Figure 91: ...leading to aggregate office and lodging net cashflows that are now below underwritten levels
2014-2019 vintage conduit CMBS same-store net cashflow changes, cumulatively indexed to underwritten levels = 100
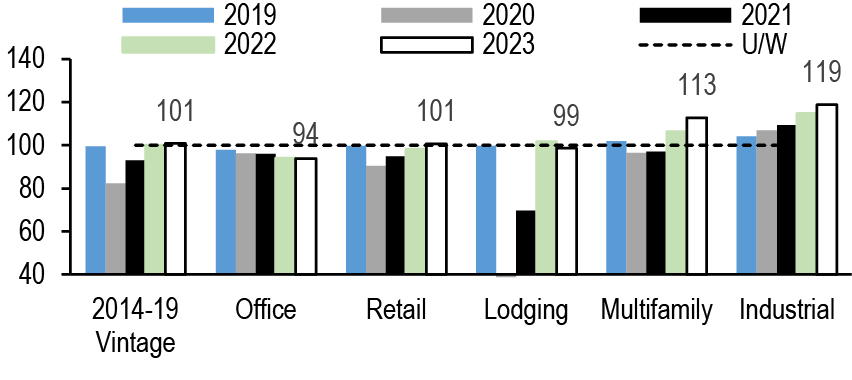
Source: J.P. Morgan, Trepp
The structural ails of the office market are understood but more interestingly, conduit lodging loan NCF is, not only lower in 2023 year-over-year, but is about a point lower relative to underwritten levels as slowing top line revenue growth is met with growing operating expenses ( Figure 92). We had long thought that the inflation pressures posed risks to NCF growth in the lodging market. We are beginning to see the sticky effects of inflation (labor, cost of goods sold) on CRE, especially in an asset class like lodging that is highly operationally levered with an expense ratio of about 70% historically ( Figure 93).
Figure 92: Conduit CMBS loans backed by lodging are seeing net cashflows drag...
2014-2019 vintage conduit CMBS lodging same-store revenue, operating expense, and net cashflow changes, cumulatively indexed to underwritten levels = 100
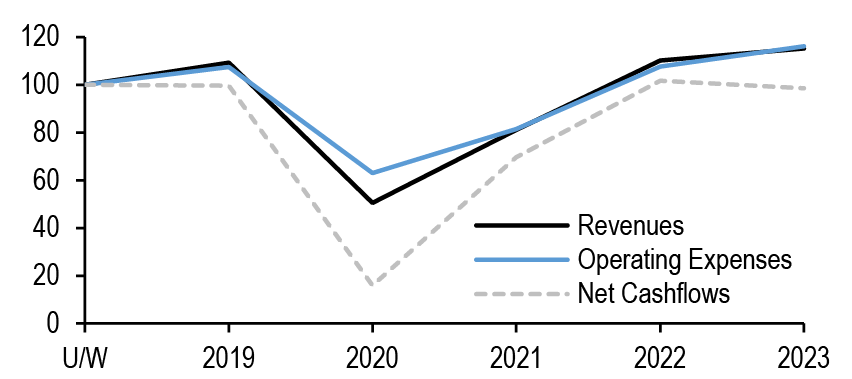
Source: J.P. Morgan, Trepp
Figure 93: ...given high operating leverage as revenue growth slows and expense growth remains high
2014-2019 vintage conduit CMBS same-store operating expense ratio to revenues by property type
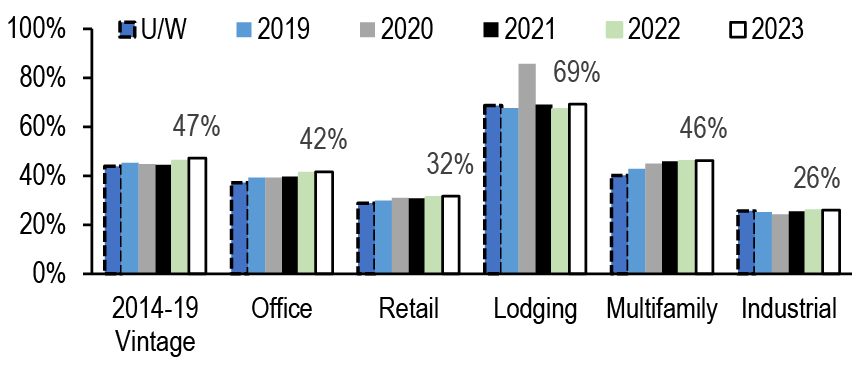
Source: J.P. Morgan, Trepp
Figure 94 shows the sensitivity of NCF growth to revenue growth for the core property types according to their operating leverage (operating expense to revenue ratios) under a hypothetical fixed 6% expense growth scenario. At this expense growth assumption, the breakeven revenue growth for lodging is 4-5%. The other property types, which are less operationally leveraged, have breakeven revenue growth rates of either 1-2% (retail and industrial) or 2-3% (multifamily and office).
Figure 94: Under a 6% expense growth assumption, breakeven revenue growth is in the +1-5% vicinity
Hypothetical NCF growth under different revenue growth assumptions at each property type’s average operating expense ratio and a +6% operating expense growth assumption

Source: J.P. Morgan
Figure 95 shows vintage and property type cuts of conduit CMBS same-store financials performance.
Figure 95: 2014-2019 vintage conduit CMBS same-store revenue, operating expense, and net cashflow changes, cumulatively indexed to underwritten levels = 100
| Vintage | % of Outs | Revenues | Operating Expenses | Net Cashflow | Occ. Rates (Act. Levels, %) | 2023 versus U/W | |||||||||||||||||||||||
| Prop. Type | w/ Data | U/W | 2019 | 2020 | 2021 | 2022 | 2023 | U/W | 2019 | 2020 | 2021 | 2022 | 2023 | U/W | 2019 | 2020 | 2021 | 2022 | 2023 | U/W | 2019 | 2020 | 2021 | 2022 | 2023 | Rev. | Exp. | NCF | Occ. |
| 2014 | 51% | 100 | 117 | 96 | 107 | 119 | 122 | 100 | 119 | 97 | 108 | 124 | 129 | 100 | 102 | 84 | 95 | 102 | 103 | 92 | 88 | 83 | 86 | 87 | 86 | 22% | 29% | 2.8% | -6 |
| Office | 55% | 100 | 107 | 104 | 105 | 105 | 108 | 100 | 118 | 111 | 114 | 120 | 123 | 100 | 95 | 95 | 95 | 91 | 95 | 92 | 87 | 87 | 87 | 85 | 82 | 8% | 23% | -5.5% | -9 |
| Retail | 63% | 100 | 110 | 100 | 103 | 105 | 108 | 100 | 114 | 108 | 112 | 118 | 120 | 100 | 100 | 89 | 91 | 92 | 94 | 95 | 92 | 90 | 91 | 91 | 91 | 8% | 20% | -5.8% | -4 |
| Lodging | 52% | 100 | 135 | 62 | 104 | 147 | 149 | 100 | 116 | 68 | 89 | 121 | 128 | 100 | 105 | 15 | 80 | 123 | 115 | 78 | 74 | 41 | 59 | 71 | 71 | 49% | 28% | 14.6% | -8 |
| Multifamily | 38% | 100 | 111 | 109 | 106 | 120 | 127 | 100 | 124 | 124 | 127 | 144 | 155 | 100 | 104 | 100 | 94 | 106 | 111 | 95 | 93 | 87 | 93 | 90 | 89 | 27% | 55% | 10.9% | -6 |
| Industrial | 48% | 100 | 116 | 115 | 116 | 123 | 120 | 100 | 93 | 94 | 98 | 105 | 104 | 100 | 115 | 114 | 114 | 120 | 118 | 99 | 99 | 98 | 100 | 100 | 99 | 20% | 4% | 17.5% | 0 |
| Other | 26% | 100 | 131 | 131 | 140 | 147 | 149 | 100 | 153 | 151 | 160 | 166 | 178 | 100 | 126 | 127 | 137 | 145 | 141 | 92 | 90 | 88 | 90 | 89 | 88 | 49% | 78% | 41.1% | -4 |
| 2015 | 54% | 100 | 113 | 92 | 103 | 116 | 119 | 100 | 114 | 91 | 102 | 118 | 125 | 100 | 105 | 86 | 98 | 107 | 106 | 91 | 90 | 84 | 86 | 87 | 86 | 19% | 25% | 6.3% | -5 |
| Office | 59% | 100 | 108 | 106 | 106 | 106 | 105 | 100 | 110 | 107 | 108 | 112 | 114 | 100 | 102 | 101 | 100 | 98 | 93 | 92 | 90 | 87 | 83 | 82 | 79 | 5% | 14% | -6.7% | -13 |
| Retail | 65% | 100 | 109 | 102 | 105 | 109 | 112 | 100 | 109 | 105 | 108 | 114 | 120 | 100 | 104 | 96 | 100 | 102 | 104 | 95 | 94 | 92 | 92 | 93 | 93 | 12% | 20% | 4.3% | -2 |
| Lodging | 57% | 100 | 116 | 53 | 85 | 119 | 124 | 100 | 113 | 65 | 84 | 114 | 123 | 100 | 103 | 14 | 69 | 109 | 104 | 76 | 77 | 44 | 63 | 71 | 72 | 24% | 23% | 4.2% | -5 |
| Multifamily | 39% | 100 | 113 | 114 | 120 | 129 | 136 | 100 | 119 | 121 | 127 | 138 | 148 | 100 | 109 | 110 | 114 | 122 | 127 | 95 | 94 | 93 | 96 | 95 | 93 | 36% | 48% | 27.1% | -2 |
| Industrial | 52% | 100 | 117 | 118 | 125 | 133 | 136 | 100 | 103 | 101 | 110 | 116 | 120 | 100 | 109 | 111 | 118 | 126 | 129 | 97 | 97 | 96 | 97 | 97 | 98 | 36% | 20% | 29.1% | 1 |
| Other | 41% | 100 | 123 | 121 | 129 | 139 | 139 | 100 | 136 | 133 | 141 | 151 | 157 | 100 | 113 | 111 | 119 | 129 | 125 | 92 | 91 | 90 | 90 | 89 | 88 | 39% | 57% | 25.0% | -4 |
| 2016 | 59% | 100 | 110 | 84 | 97 | 110 | 115 | 100 | 113 | 87 | 98 | 115 | 123 | 100 | 102 | 78 | 92 | 101 | 103 | 91 | 90 | 84 | 86 | 88 | 88 | 15% | 23% | 2.9% | -4 |
| Office | 64% | 100 | 108 | 107 | 106 | 107 | 107 | 100 | 119 | 120 | 120 | 127 | 128 | 100 | 100 | 98 | 95 | 93 | 93 | 93 | 93 | 90 | 87 | 87 | 85 | 7% | 28% | -6.9% | -8 |
| Retail | 68% | 100 | 103 | 93 | 98 | 102 | 105 | 100 | 105 | 99 | 103 | 108 | 111 | 100 | 99 | 87 | 92 | 95 | 98 | 95 | 93 | 91 | 91 | 92 | 93 | 5% | 11% | -1.6% | -1 |
| Lodging | 64% | 100 | 115 | 46 | 80 | 113 | 123 | 100 | 111 | 60 | 80 | 109 | 121 | 100 | 105 | 7 | 66 | 106 | 110 | 76 | 75 | 41 | 59 | 68 | 70 | 23% | 21% | 9.8% | -6 |
| Multifamily | 40% | 100 | 110 | 111 | 118 | 127 | 134 | 100 | 117 | 120 | 127 | 138 | 152 | 100 | 105 | 103 | 111 | 118 | 121 | 96 | 91 | 92 | 96 | 94 | 94 | 34% | 52% | 21.2% | -2 |
| Industrial | 39% | 100 | 110 | 112 | 115 | 121 | 124 | 100 | 101 | 98 | 101 | 111 | 114 | 100 | 110 | 114 | 116 | 121 | 125 | 98 | 98 | 98 | 99 | 99 | 98 | 24% | 14% | 24.7% | 0 |
| Other | 42% | 100 | 114 | 103 | 112 | 125 | 130 | 100 | 119 | 107 | 109 | 124 | 134 | 100 | 108 | 98 | 111 | 124 | 125 | 92 | 93 | 91 | 91 | 92 | 90 | 30% | 34% | 25.0% | -2 |
| 2017 | 66% | 100 | 103 | 86 | 94 | 104 | 106 | 100 | 108 | 87 | 97 | 111 | 116 | 100 | 98 | 83 | 91 | 96 | 97 | 92 | 92 | 86 | 87 | 88 | 88 | 6% | 16% | -3.3% | -4 |
| Office | 69% | 100 | 105 | 103 | 102 | 101 | 102 | 100 | 109 | 106 | 108 | 113 | 114 | 100 | 101 | 100 | 98 | 93 | 95 | 93 | 93 | 91 | 89 | 89 | 87 | 2% | 14% | -5.4% | -6 |
| Retail | 74% | 100 | 103 | 98 | 102 | 106 | 108 | 100 | 112 | 108 | 113 | 119 | 123 | 100 | 98 | 93 | 97 | 100 | 101 | 95 | 96 | 94 | 94 | 95 | 94 | 8% | 23% | 0.6% | -1 |
| Lodging | 67% | 100 | 103 | 48 | 74 | 99 | 101 | 100 | 105 | 62 | 78 | 102 | 107 | 100 | 94 | 12 | 59 | 86 | 80 | 78 | 77 | 43 | 61 | 69 | 71 | 1% | 7% | -19.6% | -7 |
| Multifamily | 50% | 100 | 109 | 109 | 113 | 123 | 130 | 100 | 114 | 113 | 121 | 133 | 143 | 100 | 103 | 104 | 105 | 113 | 118 | 95 | 94 | 95 | 96 | 95 | 94 | 30% | 43% | 18.0% | -2 |
| Industrial | 48% | 100 | 107 | 110 | 114 | 120 | 125 | 100 | 113 | 114 | 129 | 136 | 140 | 100 | 103 | 105 | 107 | 112 | 117 | 97 | 97 | 96 | 98 | 97 | 97 | 25% | 40% | 17.2% | 0 |
| Other | 61% | 100 | 102 | 97 | 101 | 107 | 111 | 100 | 110 | 107 | 111 | 119 | 127 | 100 | 97 | 92 | 94 | 100 | 102 | 93 | 92 | 90 | 90 | 89 | 89 | 11% | 27% | 1.8% | -4 |
| 2018 | 61% | 100 | 101 | 88 | 98 | 106 | 109 | 100 | 106 | 91 | 101 | 113 | 120 | 100 | 95 | 84 | 94 | 99 | 100 | 92 | 92 | 87 | 89 | 89 | 88 | 9% | 20% | -0.3% | -3 |
| Office | 64% | 100 | 95 | 99 | 100 | 101 | 102 | 100 | 105 | 104 | 107 | 111 | 115 | 100 | 89 | 95 | 97 | 94 | 95 | 93 | 93 | 92 | 89 | 88 | 86 | 2% | 15% | -5.5% | -7 |
| Retail | 71% | 100 | 105 | 96 | 101 | 105 | 109 | 100 | 108 | 104 | 109 | 114 | 121 | 100 | 99 | 88 | 94 | 98 | 101 | 95 | 96 | 94 | 95 | 95 | 95 | 9% | 21% | 0.5% | 0 |
| Lodging | 57% | 100 | 103 | 54 | 84 | 108 | 112 | 100 | 104 | 66 | 85 | 107 | 116 | 100 | 96 | 26 | 78 | 104 | 99 | 77 | 76 | 48 | 65 | 72 | 74 | 12% | 16% | -1.3% | -3 |
| Multifamily | 56% | 100 | 103 | 102 | 103 | 109 | 116 | 100 | 110 | 117 | 123 | 135 | 142 | 100 | 99 | 93 | 91 | 95 | 101 | 95 | 94 | 92 | 96 | 94 | 94 | 16% | 42% | 1.4% | -2 |
| Industrial | 54% | 100 | 101 | 105 | 110 | 116 | 120 | 100 | 113 | 108 | 121 | 128 | 134 | 100 | 98 | 105 | 108 | 114 | 118 | 97 | 97 | 96 | 97 | 98 | 98 | 20% | 34% | 18.4% | 0 |
| Other | 49% | 100 | 104 | 101 | 105 | 109 | 111 | 100 | 112 | 109 | 117 | 122 | 125 | 100 | 98 | 96 | 98 | 101 | 102 | 93 | 92 | 91 | 91 | 89 | 87 | 11% | 25% | 2.1% | -6 |
| 2019 | 63% | 100 | 98 | 82 | 92 | 101 | 105 | 100 | 99 | 84 | 93 | 106 | 113 | 100 | 96 | 81 | 91 | 97 | 99 | 92 | 92 | 87 | 90 | 90 | 90 | 5% | 13% | -1.1% | -3 |
| Office | 70% | 100 | 96 | 91 | 93 | 96 | 96 | 100 | 95 | 94 | 95 | 100 | 102 | 100 | 96 | 90 | 93 | 94 | 94 | 94 | 94 | 93 | 92 | 91 | 90 | -4% | 2% | -6.3% | -4 |
| Retail | 75% | 100 | 99 | 93 | 98 | 103 | 107 | 100 | 105 | 101 | 107 | 110 | 117 | 100 | 96 | 88 | 93 | 100 | 103 | 95 | 95 | 94 | 94 | 95 | 95 | 7% | 17% | 2.7% | 0 |
| Lodging | 73% | 100 | 99 | 51 | 78 | 100 | 105 | 100 | 99 | 61 | 78 | 101 | 110 | 100 | 98 | 25 | 76 | 97 | 94 | 78 | 78 | 48 | 64 | 71 | 71 | 5% | 10% | -6.3% | -6 |
| Multifamily | 55% | 100 | 100 | 95 | 95 | 106 | 116 | 100 | 105 | 114 | 115 | 124 | 135 | 100 | 97 | 84 | 82 | 96 | 105 | 95 | 95 | 90 | 96 | 94 | 94 | 16% | 35% | 4.8% | -1 |
| Industrial | 45% | 100 | 99 | 102 | 104 | 107 | 113 | 100 | 95 | 96 | 105 | 111 | 119 | 100 | 100 | 101 | 102 | 104 | 109 | 97 | 97 | 98 | 98 | 99 | 98 | 13% | 19% | 9.4% | 0 |
| Other | 47% | 100 | 95 | 96 | 103 | 107 | 112 | 100 | 103 | 107 | 111 | 118 | 126 | 100 | 92 | 91 | 99 | 102 | 105 | 94 | 93 | 92 | 94 | 93 | 92 | 12% | 26% | 5.0% | -2 |
| 2014-19 | 60% | 100 | 106 | 87 | 97 | 108 | 111 | 100 | 109 | 89 | 99 | 114 | 120 | 100 | 99 | 82 | 93 | 100 | 101 | 92 | 91 | 85 | 87 | 88 | 88 | 11% | 20% | 1% | -4 |
| Office | 64% | 100 | 103 | 101 | 101 | 102 | 103 | 100 | 109 | 107 | 108 | 113 | 115 | 100 | 98 | 96 | 96 | 94 | 94 | 93 | 92 | 90 | 88 | 87 | 85 | 3% | 15% | -6% | -8 |
| Retail | 70% | 100 | 105 | 97 | 101 | 105 | 108 | 100 | 109 | 104 | 108 | 113 | 119 | 100 | 100 | 90 | 95 | 98 | 101 | 95 | 94 | 92 | 93 | 94 | 94 | 8% | 19% | 1% | -1 |
| Lodging | 62% | 100 | 109 | 51 | 81 | 110 | 115 | 100 | 107 | 63 | 81 | 108 | 116 | 100 | 100 | 16 | 70 | 102 | 99 | 77 | 76 | 45 | 62 | 70 | 71 | 15% | 16% | -1% | -6 |
| Multifamily | 47% | 100 | 107 | 105 | 108 | 117 | 125 | 100 | 113 | 117 | 123 | 134 | 144 | 100 | 102 | 96 | 97 | 106 | 113 | 95 | 94 | 92 | 96 | 94 | 93 | 25% | 44% | 13% | -2 |
| Industrial | 48% | 100 | 106 | 109 | 113 | 119 | 123 | 100 | 104 | 103 | 112 | 120 | 125 | 100 | 104 | 107 | 109 | 115 | 119 | 97 | 97 | 97 | 98 | 98 | 98 | 23% | 25% | 19% | 0 |
| Other | 47% | 100 | 107 | 103 | 109 | 116 | 119 | 100 | 116 | 113 | 119 | 127 | 135 | 100 | 101 | 97 | 103 | 109 | 110 | 93 | 92 | 91 | 91 | 90 | 89 | 19% | 35% | 10% | -3 |
| 2014 | 51% | 100 | 117 | 96 | 107 | 119 | 122 | 100 | 119 | 97 | 108 | 124 | 129 | 100 | 102 | 84 | 95 | 102 | 103 | 92 | 88 | 83 | 86 | 87 | 86 | 22% | 29% | 3% | -6 |
| 2015 | 54% | 100 | 113 | 92 | 103 | 116 | 119 | 100 | 114 | 91 | 102 | 118 | 125 | 100 | 105 | 86 | 98 | 107 | 106 | 91 | 90 | 84 | 86 | 87 | 86 | 19% | 25% | 6% | -5 |
| 2016 | 59% | 100 | 110 | 84 | 97 | 110 | 115 | 100 | 113 | 87 | 98 | 115 | 123 | 100 | 102 | 78 | 92 | 101 | 103 | 91 | 90 | 84 | 86 | 88 | 88 | 15% | 23% | 3% | -4 |
| 2017 | 66% | 100 | 103 | 86 | 94 | 104 | 106 | 100 | 108 | 87 | 97 | 111 | 116 | 100 | 98 | 83 | 91 | 96 | 97 | 92 | 92 | 86 | 87 | 88 | 88 | 6% | 16% | -3% | -4 |
| 2018 | 61% | 100 | 101 | 88 | 98 | 106 | 109 | 100 | 106 | 91 | 101 | 113 | 120 | 100 | 95 | 84 | 94 | 99 | 100 | 92 | 92 | 87 | 89 | 89 | 88 | 9% | 20% | 0% | -3 |
| 2019 | 63% | 100 | 98 | 82 | 92 | 101 | 105 | 100 | 99 | 84 | 93 | 106 | 113 | 100 | 96 | 81 | 91 | 97 | 99 | 92 | 92 | 87 | 90 | 90 | 90 | 5% | 13% | -1% | -3 |
Source: J.P. Morgan, Trepp
Multifamily requires a special mention as the sector has faced some headwinds due to elevated construction deliveries. As we wrote in an earlier weekly, we believe multifamily fundamentals are bottoming out as supply deliveries should wane materially next year and demand should remain durable. However, one often-discussed risk to multifamily, is the growth in operating expenses.
Indeed, we have seen operating expenses grow materially for multifamily when examining Freddie K data ( Figure 96). Operating expenses ballooned by 8.8% in 2022 but moderated to 7.6% in 2023. Interestingly, despite the rapid deceleration of multifamily effective rent growth on new leases in 2023, we found that top-line revenues for Freddie K (and conduit CMBS for that matter) loans grew by 6.8%, leading to a relatively healthy bottom-line NCF growth of 6.1% in 2023. This datapoint further supports the notion that while rent growth on new leases may have decelerated materially into heavy supply deliveries in recent quarters, rent growth for lease renewals likely held up much better, allowing landlords to pass on a good chunk of expense growth to tenants. Still, operating expense ratios to revenues have ticked up over the years as expense growth has exceeded revenue growth in the years following the pandemic.
Figure 96: Freddie K multifamily operating expense growth moderated in 2023 versus 2022 but remain elevated. That said, rent growth kept up in 2023
Freddie K backed multifamily same-store annual changes in revenues, operating expenses, net cashflows, and operating expense to revenue ratio
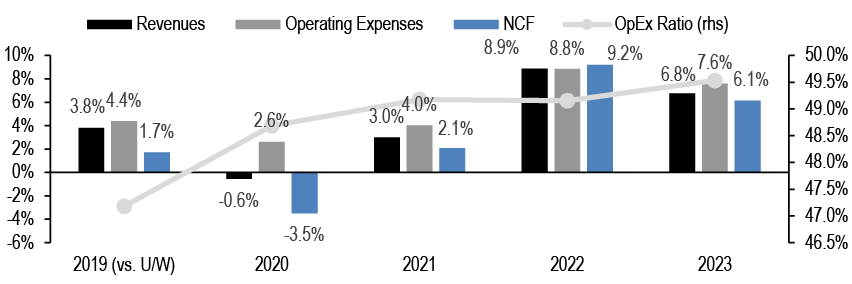
Source: J.P. Morgan, Trepp
What’s driven expense growth in recent years? Using a subset of the Freddie K 2019-2023 same-store financials data that has clean, detailed expense breakouts, we find that labor-related expenses broadly categorized as payrolls and expenses (property management employee costs) and repairs and maintenance in the OSAR data contributed most to elevated operating expense growth over the last few years given the categories' large share (~40%) of total operating expenses ( Figure 97). Combined, the labor-related expenses contributed to about 40% of the total operating expense growth in 2023 of 7.6%.
Figure 97: Labor-related operating expenses and rising insurance premiums have been the largest drivers of Freddie K multifamily operating expense growth
Freddie K backed multifamily same-store annual changes in the largest operating expense categories, their contribution to total operating expenses, and their contribution to the year-over-year 2023 total operating expense growth
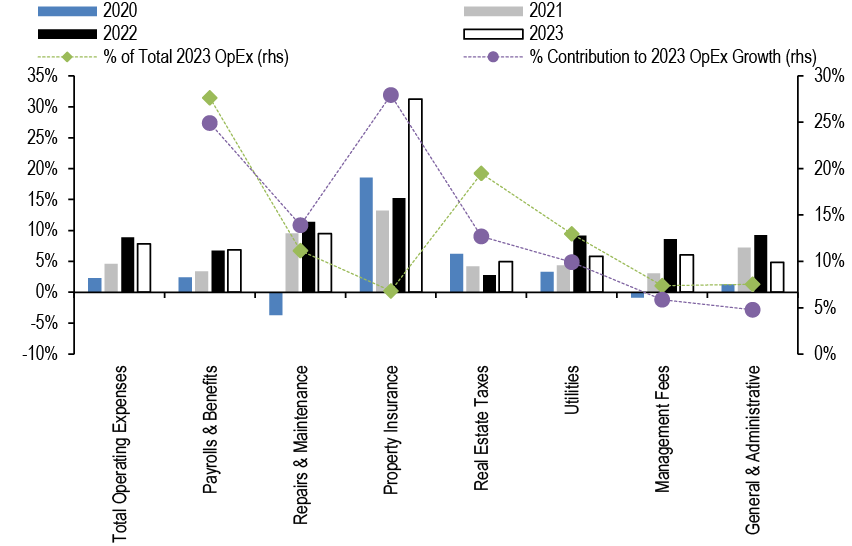
Source: J.P. Morgan, Trepp
The growth in insurance premiums have been eye-popping (a phenomenon that continues to impact real estate broadly given increasing climate/natural disaster risks) but comparatively, insurance premiums still only account for ~7% of total operating expenses (up from ~4% in 2019). However, given how much this category jumped in 2023, it was the single largest contributor to overall operating expense growth at 28%.
Real estate taxes are another large expense item, but the growth rates here have been tamer relative to labor-related costs and insurance premiums. The labor-related and real estate tax expense categories can moderate going forward. Labor costs should track broader employment trends, which is cooling and given the ~20% decline in multifamily property prices since QT began, real estate tax assessment values, at least in theory, should moderate, which may lead to lower real estate tax growth rates.
Insurance premiums may continue to grow at elevated rates as it appears climate risk is underpriced in the real estate market. Unsurprisingly, metro areas in climate/natural disaster affected areas (broadly Florida and Texas MSAs) have seen the most acute growth in insurance premiums ( Figure 98). Here, we use a larger sample of Freddie K loans that captures loans with valid same-store OSAR data over 2022 and 2023 only to increase information value when cutting the data to MSA level. These are also some of the areas where total operating expense growth is being significantly driven by the outsized growth in insurance premiums.
Figure 98: Unsurprisingly, metro areas in climate/natural disaster affected areas (broadly Florida and Texas MSAs) have seen the most acute growth in insurance premiums
Freddie K backed multifamily same-store annual changes in the largest operating expense categories, their contribution to total operating expenses, and their contribution to the year-over-year 2023 total operating expense growth for the largest 30 Freddie K MSAs
| Year-over-year Change | % Contribution to Total OpEx Growth | |||||||||||||||
| MSA | Curr. Bal. ($bn) | % of Total | Total Operating Expenses | Payrolls & Benefits | Repairs & Maintenance | Property Insurance | Real Estate Taxes | Utilities | Management Fees | General & Administrative | Other* | Payrolls & Benefits | Repairs & Maintenance | Property Insurance | Real Estate Taxes | Top 4 |
| New York | 10.2 | 7.6% | 4.3% | 5.2% | -3.2% | 29.0% | 0.8% | 0.3% | 4.2% | 17.9% | 21.2% | 17.2% | -6.6% | 37.6% | 4.9% | 53.0% |
| DC | 6.8 | 5.0% | 3.3% | 2.9% | 6.9% | 17.1% | 2.3% | 4.7% | 0.9% | 7.0% | -12.6% | 10.8% | 17.8% | 16.9% | 9.9% | 55.4% |
| Dallas-FW | 6.7 | 4.9% | 6.7% | 6.6% | 7.7% | 28.2% | 7.0% | 4.9% | 6.8% | 9.0% | -20.5% | 16.3% | 8.5% | 26.0% | 23.4% | 74.2% |
| LA | 5.9 | 4.3% | 10.0% | 4.0% | 27.4% | 29.5% | 3.1% | 9.2% | 3.9% | 12.7% | 10.3% | 5.3% | 27.1% | 13.7% | 4.8% | 50.9% |
| Atlanta | 5.1 | 3.8% | 8.5% | 1.9% | 18.3% | 38.9% | 8.2% | 4.2% | 5.7% | 2.5% | 6.2% | 2.9% | 17.0% | 23.1% | 15.6% | 58.6% |
| Houston | 4.9 | 3.6% | 11.4% | 7.0% | 11.0% | 46.7% | 10.6% | 10.0% | 7.7% | 10.7% | -21.2% | 10.2% | 7.4% | 43.9% | 23.2% | 84.7% |
| Philly | 4.1 | 3.0% | 7.6% | 12.7% | 1.2% | 25.3% | 4.2% | 5.9% | 11.1% | 10.7% | -4.8% | 30.6% | 1.6% | 17.9% | 9.9% | 60.0% |
| Baltimore | 3.9 | 2.9% | 3.2% | 0.0% | 5.2% | 7.1% | 0.1% | 0.0% | -3.7% | 23.0% | 18.0% | 0.0% | 19.2% | 10.4% | 0.5% | 30.1% |
| Phoenix | 3.8 | 2.8% | 6.3% | 8.0% | 6.6% | 21.1% | 2.8% | 4.8% | 3.0% | 10.7% | -3.0% | 29.5% | 10.7% | 13.3% | 4.2% | 57.7% |
| Miami | 3.6 | 2.7% | 13.4% | 6.0% | 17.8% | 46.0% | 8.8% | 9.3% | 4.9% | 16.1% | 10.7% | 5.6% | 11.7% | 37.1% | 16.9% | 71.3% |
| Denver | 3.6 | 2.7% | 6.2% | 13.2% | 10.2% | 24.9% | -3.5% | 2.8% | 1.9% | 1.1% | 3.4% | 36.8% | 15.2% | 20.8% | -6.9% | 65.9% |
| Chicago | 3.5 | 2.6% | 6.4% | 7.2% | 10.4% | 20.8% | 7.8% | 2.9% | 8.6% | 3.2% | -9.9% | 17.9% | 14.1% | 13.4% | 26.0% | 71.4% |
| Seattle | 3.1 | 2.3% | 4.6% | 7.9% | 7.3% | 21.6% | -4.7% | 3.6% | 1.2% | 4.9% | 13.3% | 29.0% | 8.3% | 13.5% | -11.2% | 39.7% |
| San Diego | 2.8 | 2.0% | 1.9% | -0.4% | 12.4% | 3.7% | -0.7% | 1.7% | 6.0% | 12.1% | -16.5% | -3.1% | 40.0% | 4.9% | -4.6% | 37.3% |
| Las Vegas | 2.6 | 1.9% | 6.5% | 3.7% | 5.9% | 24.2% | 7.6% | 3.8% | 4.2% | 8.5% | 10.0% | 11.0% | 10.0% | 17.3% | 12.5% | 50.9% |
| Tampa | 2.3 | 1.7% | 14.2% | 12.1% | 17.0% | 70.5% | 4.1% | 12.7% | 5.4% | 9.8% | -8.0% | 13.3% | 9.5% | 44.1% | 4.3% | 71.2% |
| Boston | 2.3 | 1.7% | 4.4% | 2.7% | 3.4% | 20.0% | 1.0% | 3.0% | 11.3% | 13.1% | -3.9% | 12.3% | 7.4% | 16.4% | 3.3% | 39.4% |
| Austin | 2.0 | 1.5% | 9.2% | 5.1% | 15.3% | 37.5% | 9.4% | 5.1% | 4.6% | 10.2% | -10.0% | 7.4% | 12.5% | 21.2% | 24.8% | 65.9% |
| SF | 2.0 | 1.4% | 5.2% | 8.9% | -2.6% | 26.6% | 7.0% | 10.6% | 2.5% | 0.6% | -28.7% | 43.9% | -3.3% | 31.9% | 31.6% | 104.0% |
| Orlando | 1.9 | 1.4% | 14.4% | 13.4% | 13.4% | 59.7% | 10.1% | 13.1% | 5.1% | 5.8% | -9.0% | 16.2% | 10.5% | 45.3% | 14.8% | 86.9% |
| Riverside | 1.6 | 1.2% | 10.0% | 7.2% | 23.8% | 24.8% | 3.3% | 10.1% | 4.6% | 16.2% | 18.1% | 11.2% | 17.5% | 9.7% | 5.0% | 43.5% |
| Detroit | 1.5 | 1.1% | -0.3% | -1.3% | -7.0% | 15.8% | 1.9% | -0.1% | 7.9% | -0.5% | -12.4% | n/a | n/a | n/a | n/a | n/a |
| Portland | 1.5 | 1.1% | 9.5% | 10.8% | 15.1% | 31.1% | 6.0% | 9.2% | 4.0% | 23.6% | -18.7% | 25.8% | 11.3% | 12.7% | 8.6% | 58.4% |
| San Antonio | 1.4 | 1.0% | 11.4% | 11.1% | 11.0% | 45.1% | 8.6% | 9.4% | 3.6% | 22.2% | -12.3% | 15.0% | 7.0% | 27.6% | 19.2% | 68.8% |
| Kansas City | 1.3 | 1.0% | 14.1% | 10.6% | 8.1% | 42.1% | 14.0% | 13.8% | 8.9% | 14.5% | 11.9% | 15.8% | 6.8% | 25.7% | 15.9% | 64.3% |
| Charlotte | 1.3 | 1.0% | 7.9% | 4.6% | 7.7% | 25.1% | 13.3% | 7.2% | 3.9% | 11.8% | -17.9% | 12.9% | 11.2% | 20.0% | 35.2% | 79.4% |
| Columbus | 1.3 | 0.9% | 3.3% | 4.7% | 3.8% | 14.1% | 4.3% | -3.8% | -3.1% | 5.5% | 3.4% | 27.5% | 11.1% | 23.1% | 21.4% | 83.1% |
| Sacramento | 1.2 | 0.9% | 14.9% | 6.6% | 27.4% | 18.5% | 16.0% | 9.0% | 6.8% | 69.7% | -1.2% | 12.3% | 15.3% | 6.0% | 17.9% | 51.5% |
| San Jose | 1.2 | 0.9% | 10.1% | 8.6% | 3.2% | 26.1% | 14.0% | 16.3% | -1.4% | 0.4% | 2.4% | 22.5% | 2.6% | 15.1% | 51.4% | 91.5% |
| Bridgeport, CT | 1.2 | 0.9% | 18.7% | 27.0% | -8.2% | 39.1% | 12.8% | 19.0% | 34.4% | 41.9% | 24.3% | 36.4% | -4.8% | 17.5% | 37.4% | 86.5% |
| Total | 135.4 | 100.0% | 7.6% | 6.8% | 7.3% | 32.5% | 5.0% | 5.4% | 5.4% | 9.2% | 0.3% | 15.9% | 8.7% | 24.9% | 11.4% | 60.8% |
Source: J.P. Morgan, Trepp
Note: * Includes Advertising & Marketing, Professional Fees, and Other Expenses
Figure 99 shows the expense line items that feed the top 4 OSAR expense categories that contributed the most to total operating expense growth in 2023.
Figure 99: Detailed operating expense line item groupings reported in the CREFC IRP OSAR for the 4 largest expense groupings
| Payrolls & Benefits (P&B) | Repairs & Maintenance ($&M) | Property Insurance (PINS) | Real Estate Taxes (RET) |
| 401K | CAM | Flood Insurance | Real Estate Taxes |
| Bonuses | Cleaning | Hazard Liability | |
| Contract Labor (Carpet Cleaning) | Electrical | Insurance | |
| Contract Labor-Make Ready | Elevator | Property Insurance | |
| Contract Work | Equipment Repairs | ||
| Employee Benefits | Exterminating Service | ||
| Employee Expense | Floor Covering Replacement | ||
| Employee Insurance | HVAC | ||
| FICA | Janitorial | ||
| Health Benefits | Landscaping (Exterior) | ||
| Labor Plumbing | Landscaping/Plants (Interior) | ||
| Manager Salaries | Lawn & Grounds | ||
| Payroll & Benefits | Locks/Keys | ||
| Payroll Taxes | Maid Service | ||
| Salaries | Make Ready | ||
| Salaries Maintenance | Mechanical | ||
| Subcontracted Labor | Painting | ||
| Temporary Help | Parking Lot | ||
| Unemployement Insurance | Parking Lot Lighting Repair | ||
| Worker's Comp | Pest Control | ||
| Plumbing | |||
| Pool | |||
| Repairs & Maintenance | |||
| Rubbish Removal | |||
| Scavenger | |||
| Snow Removal | |||
| Supplies | |||
| Supplies-Cleaning | |||
| Turnover | |||
| Vacancy Preparation | |||
| Water Irrigation | |||
| Water Treatment Exp |
Source: CREFC IRP
Weekly Tracker
Figure 100: Delinquency rate
Conduit CMBS 30-day+ delinquency rate including FC/REO and NP matured (%)
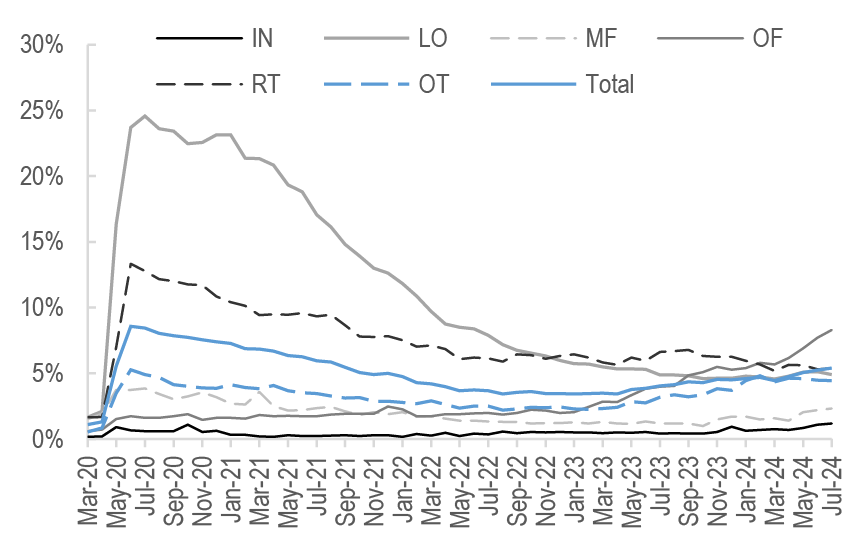
Source: J.P. Morgan, Trepp
Figure 101: Delinquency cure rates
Conduit CMBS 30 day+ delinquency to performing transition rates (%)
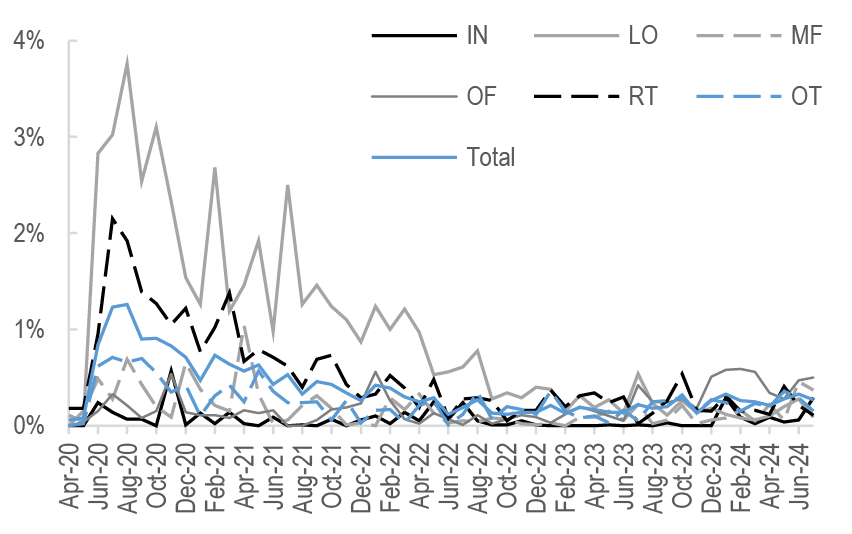
Source: J.P. Morgan, Trepp
Figure 102: Specially serviced rate
Conduit CMBS percentage of loans in special servicing (%)

Source: J.P. Morgan, Trepp
Figure 103: Office RTTO indexed to pre-pandemic levels
Kastle System Back to Work Barometer, weekly
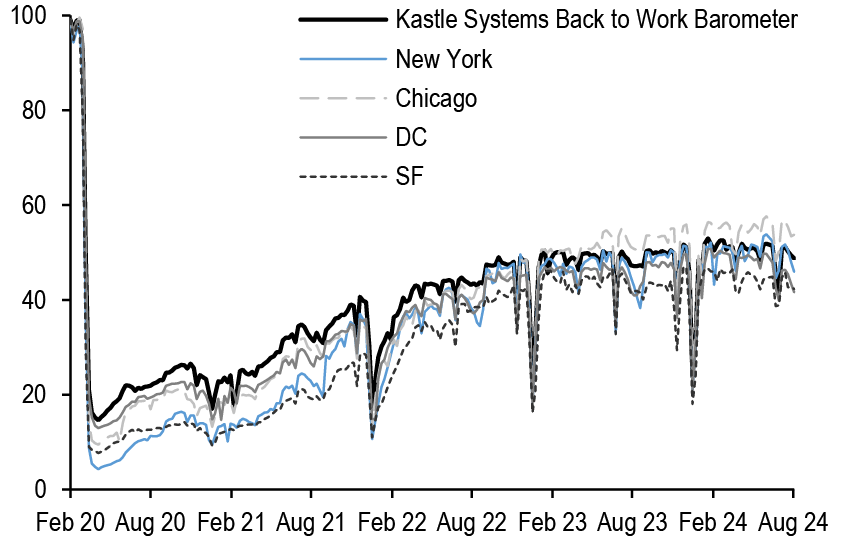
Source: Kastle Systems, Bloomberg Finance L.P.
Cross Sector Spreads
| Current | Changes | 5yr Trailing | Percentile Rank | ||||||||
| Product | Tranche / Bucket | 8/22/24 | -1w | -1m | -1y | Min | Max | 3yr | 5yr | 7yr | |
| Conduit CMBS | 3yr AAA | 90 | -5 | -5 | -48 | 26 | 463 | 25.9% | 48.0% | 62.9% | |
| Treasury Spread (bp) | 5yr AAA | 140 | -3 | -1 | -47 | 47 | 461 | 51.0% | 66.1% | 75.7% | |
| 5yr LCF AAA | 114 | 0 | 2 | N/A | 96 | 120 | 87.7% | 87.7% | 87.7% | ||
| 10yr LCF AAA | 102 | -1 | 0 | -39 | 59 | 340 | 33.4% | 53.4% | 65.6% | ||
| 10yr AS | 155 | -9 | 5 | -58 | 74 | 440 | 37.0% | 56.8% | 69.0% | ||
| 10yr AA | 185 | -8 | 5 | -77 | 90 | 565 | 35.8% | 54.5% | 67.1% | ||
| 10yr A | 225 | -16 | 0 | -214 | 123 | 756 | 27.7% | 43.6% | 58.7% | ||
| 10yr BBB- | 580 | -43 | -36 | -361 | 263 | 1354 | 31.9% | 51.4% | 56.7% | ||
| XA | 140 | 2 | 2 | -150 | 90 | 535 | 20.9% | 34.3% | 49.7% | ||
| Freddie K | 7yr A2 | 47 | -1 | 7 | N/A | 6 | 100 | 53.6% | 69.4% | 77.9% | |
| Treasury Spread (bp) | 10yr A2 | 52 | -1 | 1 | N/A | 10 | 110 | 60.3% | 73.7% | 79.8% | |
| 2020 Vintage B | 154 | 0 | 5 | -55 | 109 | 441 | N/A | N/A | N/A | ||
| 2020 Vintage C | 174 | 0 | 7 | -68 | 158 | 593 | N/A | N/A | N/A | ||
| X1 | 140 | 0 | 16 | N/A | 50 | 400 | 15.2% | 31.0% | 49.9% | ||
| X3 | 350 | 0 | 16 | N/A | 225 | 695 | 23.8% | 36.1% | 54.6% | ||
| SOFR Floater (DM) | 62 | -1 | 20 | N/A | 19 | 90 | 51.7% | 61.2% | 62.2% | ||
| FRESB | A5H (5yr Hybrid ARM) | 114 | -5 | 15 | N/A | 2 | 131 | 76.8% | 85.9% | 89.9% | |
| Treasury Spread (bp) | A10F (10yr Fixed Rate) | 80 | -2 | 6 | N/A | 16 | 126 | 45.0% | 65.1% | 73.1% | |
| Fannie DUS | 7/6.5 TBA | 53 | -2 | 6 | N/A | 7 | 110 | 55.6% | 71.0% | 78.4% | |
| Treasury Spread (bp) | 10/9.5 TBA | 57 | 0 | 4 | N/A | 14 | 135 | 56.3% | 71.8% | 78.2% | |
| SOFR SARM (DM) | 65 | 0 | 18 | N/A | 22 | 95 | 50.3% | 64.9% | 63.4% | ||
| Fannie ACES | 7yr A2 | 50 | -1 | 8 | N/A | 7 | 102 | 53.0% | 71.7% | 78.7% | |
| Treasury Spread (bp) | 10yr A2 | 54 | -1 | 2 | N/A | 12 | 120 | 58.3% | 73.7% | 79.3% | |
| GNR Project Loans | 3.5yr | 129 | -1 | 16 | N/A | 60 | 169 | 37.7% | 62.7% | 73.4% | |
| Treasury Spread (bp) | 7.5yr | 149 | 0 | 1 | N/A | 69 | 202 | 32.5% | 59.2% | 70.9% | |
| 12yr | 145 | 1 | -10 | N/A | 80 | 237 | 29.8% | 58.4% | 70.3% | ||
| Production Coupon | FN/FR 30yr PC (OAS) | 12 | -5 | -9 | -40 | -35 | 115 | 13.6% | 37.2% | 26.7% | |
| FN/FR 30yr PC (ZV) | 99 | -12 | -23 | -52 | -2 | 173 | 27.2% | 55.5% | 68.0% | ||
| ABS | 3yr AAA Credit Card | 48 | 0 | 0 | -2 | 12 | 207 | 40.8% | 59.6% | 73.8% | |
| Treasury Spread (bp) | 3yr AAA Prime Auto | 70 | 0 | 8 | -8 | 15 | 207 | 54.3% | 66.8% | 75.9% | |
| 3yr BBB Subprime Auto | 165 | 0 | 20 | -50 | 72 | 566 | 34.0% | 49.6% | 64.0% | ||
| CLO | AAA | 132 | -1 | 8 | -38 | 101 | 408 | 26.3% | 40.8% | 56.6% | |
| Discount Margin | BBB | 369 | 0 | 7 | -90 | 323 | 972 | 19.7% | 30.7% | 45.2% | |
| BB | 789 | -1 | 13 | -134 | 693 | 1,756 | 32.1% | 42.6% | 58.3% | ||
| JULI (ex-EM) | 3-5yr | 91 | -1 | 3 | -26 | 58 | 407 | 27.3% | 41.9% | 45.0% | |
| Treasury Spread (bp) | 5-7yr | 102 | -1 | 4 | -26 | 71 | 372 | 26.7% | 40.8% | 33.3% | |
| 7-10yr | 116 | 0 | 3 | -34 | 87 | 368 | 25.8% | 39.1% | 32.2% | ||
| 7-10yr A | 100 | 1 | 2 | -30 | 68 | 316 | 25.8% | 41.3% | 40.8% | ||
| 7-10yr REITs | 130 | 0 | 5 | -51 | 98 | 350 | 24.0% | 37.9% | 31.2% | ||
| High Yield | Domestic HY | 362 | 2 | 27 | -59 | 317 | 1,139 | 17.4% | 10.4% | 7.6% | |
| Spread to Worst (bp) | Energy | 283 | 3 | 32 | -55 | 234 | 2,395 | 15.7% | 9.4% | 6.7% | |
| Swap Spreads | 3yr | 5 | -1 | -2 | -8 | -5 | 24 | 2.5% | 2.5% | 2.5% | |
| (bp) | 5yr | -1 | -1 | -1 | -9 | -7 | 15 | 1.7% | 1.7% | 1.7% | |
| 10yr | -15 | 0 | 1 | -17 | -17 | 11 | 2.1% | 2.1% | 2.1% | ||
Cross Sector Spreads (continued)
| Current | Changes | 5yr Trailing | Percentile Rank | ||||||||
| Product | Tranche / Bucket | 8/22/24 | -1w | -1m | -1y | Min | Max | 3yr | 5yr | 7yr | |
| CMBX (bp) | AAA17 | 84 | -3 | 3 | N/A | 74 | 92 | 58.6% | 58.6% | 58.6% | |
| AAA16 | 77 | -2 | 1 | -22 | 70 | 119 | 25.3% | 25.3% | 25.3% | ||
| AAA15 | 75 | -2 | 2 | -20 | 60 | 115 | 28.5% | 28.5% | 28.5% | ||
| AAA14 | 70 | -2 | 1 | -21 | 45 | 109 | 36.6% | 49.3% | 49.3% | ||
| AAA13 | 66 | -2 | 1 | -20 | 42 | 167 | 40.3% | 56.8% | 56.8% | ||
| AAA12 | 62 | -2 | 1 | -19 | 37 | 162 | 42.8% | 61.2% | 66.6% | ||
| AAA11 | 58 | -3 | 0 | -19 | 32 | 146 | 41.6% | 61.3% | 63.8% | ||
| AAA10 | 54 | -4 | -2 | -18 | 26 | 141 | 42.8% | 63.4% | 69.6% | ||
| AAA9 | 49 | -4 | -9 | -18 | 21 | 127 | 36.2% | 59.7% | 67.5% | ||
| AAA8 | 38 | -13 | -14 | -23 | 18 | 117 | 29.1% | 53.4% | 54.7% | ||
| AAA7 | 0 | 0 | 0 | -52 | 0 | 107 | 11.1% | 6.5% | 2.4% | ||
| BBB-17 | 487 | -6 | -12 | N/A | 482 | 583 | 8.3% | 8.3% | 8.3% | ||
| BBB-16 | 577 | -11 | -13 | -182 | 558 | 879 | 9.8% | 9.8% | 9.8% | ||
| BBB-15 | 600 | -11 | -14 | -194 | 375 | 922 | 29.5% | 29.5% | 29.5% | ||
| BBB-14 | 763 | -11 | -13 | -85 | 320 | 985 | 61.4% | 69.1% | 69.1% | ||
| BBB-13 | 903 | 5 | 20 | -46 | 339 | 1,151 | 69.2% | 78.6% | 78.6% | ||
| BBB-12 | 932 | -20 | -14 | -131 | 309 | 1,282 | 61.6% | 75.6% | 79.1% | ||
| BBB-11 | 755 | -17 | 3 | -230 | 302 | 1,174 | 52.2% | 66.9% | 75.9% | ||
| BBB-10 | 1,271 | -20 | -16 | -148 | 297 | 1,819 | 59.9% | 76.0% | 82.8% | ||
| BBB-9 | 1,934 | -14 | 93 | 415 | 301 | 2,005 | 98.5% | 99.1% | 99.3% | ||
| CDX (bp) | 5yr IG | 51 | -1 | 0 | -14 | 44 | 152 | 11.7% | 22.5% | 18.8% | |
| 5yr HY | 330 | -7 | 0 | -100 | 267 | 882 | 16.7% | 34.1% | 34.2% | ||
Asset-backed Securities
August 23, 2024
- ABS spreads held firm on the week, but current strong technicals are scheduled to be tested in September due to a likely packed new issue ABS calendar, along with macroeconomic data and FOMC schedules
- Relatively muted new issue supply lent support to the secondary market this week, allowing dealers to off-load some inventory
- Instances of positive rating actions for senior tranches, even amidst significant credit underperformance of the pool, demonstrate the key structural strength of amortizing ABS transactions
- HERTZ ABS recorded its second outsized monthly depreciation print for the year and is operating on thin margins while Avis displays healthy ABS cushions
Sustained spread momentum amidst slow new issue activity
The summer doldrums caught up with the ABS new issue market this past week, with relatively muted supply. However, the market felt constructive overall as accounts capitalized on pockets of opportunities in the esoteric and high-yield segments. Deals were marketed at wider initial price targets (IPTs) compared to prior months following the volatility from earlier this month. Nonetheless, final pricing tracked well inside of IPTs given the heightened oversubscription levels across deals and tranches. An unsecured consumer loan branch transaction priced its discrete pool offering this week, achieving the tightest spread ever for the program across the capital stack. The BB- rated 2.43-year Class D’s on the offering priced at I +680bp (yielding 10.70%), about 120bp inside of the same tranche on the prior transaction back in February. Light new issue activity lent support to the secondary market this week, allowing dealers to off-load some inventory. The secondary market was strong, and spreads held firm. In particular, the private credit student loan sector, which had been lacking secondary supply for a while, saw strong demand as the bonds caught strong bids. Driven by this renewed interest, our private credit student loan ABS indicative benchmark spreads tightened by 10-15bp across the capital stack, while spreads across other sectors remained unchanged on the week. In terms of credit, July performance on our bankcard ABS index continued to be rock solid, with charge-offs at 2.2% for the index, up 6bp year-to-date and about 10-15bp below the pre-pandemic 2019 average. These low losses coupled with high yields resulted in a record high quarterly average excess spread print of 19.9%. The strong credit performance and robust investor appetite across the capital stack, against the backdrop of a no-recession base case scenario, should help sustain spreads in the upcoming weeks. September will be tested on technicals given a likely packed new issue ABS calendar in addition to macroeconomic data and FOMC schedules.
Rating action review
We review the number of months to the first rating upgrade instance across auto loan and MPL ABS transactions rated BBB and lower by S&P and/or KBRA ( Figure 104 and Figure 105). In an earlier iteration of this publication, we reviewed rating transition trends and highlighted instances of rating downgrades across nonprime auto and MPL transactions.
Starting with the auto ABS sector, we note that S&P has rated roughly 66% of all auto loan ABS transactions since 2018, while KBRA’s rating coverage is approximately 22% for auto loan subordinates. On aggregate, 2019 pools have seen slower upgrades as their performance overlapped with the onset of the pandemic. Rating agencies have taken a more cautious approach for these pools, which had factored down the least at that point in time. Further, the data suggests that the time taken for the first upgrade by vintage varies significantly by issuer. Issuers that have underperformed relative to initial loss expectations have experienced slower upgrades, while benchmark issuers with consistent performance trends and standardized pools have seen quicker upgrade times. Additionally, even for the same CUSIP, the timelines of different rating actions also vary depending on the rating agency.
For example, S&P rated its first non-prime CRVNA deal in 2021 and subsequently, through its first rating action on the shelf, upgraded 5 notes on May 30, 2023, including Class D of CRVNA 2022-N1 from BBB, with an initial loss expectation of 17.5%, to BBB+ within 15 months. However, KBRA, which has been rating CRVNA deals since 2019, initially rated the aforementioned tranche at BBB+ with an initial loss expectation of 14.0% and upgraded it to A- after 26 months of seasoning, citing sufficient credit enhancement.
Notably, EART has recorded significant slowdown in time taken for an upgrade from S&P between 2018 and 2022. 2022 EART transactions (22-1 through 22-5) underperformed compared to initial expectations due to which S&P downgraded class E across all transactions and revised loss expectations upwards from approximately 19% to 22%-23% by first half of 2022. Class D notes of these EART transactions were upgraded a year later in June 2024, despite further upward revisions of expected losses to 22%-24%.
Benchmark non-prime issuers such as AMCAR have generally seen quicker upgrades through successive vintages. Outside of 2019, there was a slight lag in 2021 AMCAR transactions, with the first instances of upgrades on Class Ds occurring in December 2022 at 19 and 21 months of seasoning for 21-1 and 21-2, respectively. However, 21-1 saw Class D upgraded from BBB+ to AA, and 21-2 registered an upgrade from BBB+ to A+, driven by robust performance trends and significant downward revisions to lifetime CNL expectations by S&P.
WLAKE, which has demonstrated consistent performance trends and has no history of downgrades or negative watches, has seen swifter upgrades from S&P. For instance, WLAKE 2022-1 Class D was upgraded by S&P from BBB to AA- at a deal age of 17 months in August 2023. Meanwhile, KBRA upgraded the same CUSIP in a layered approach, first from BBB to A in August 2023 and then from A to A+ in February 2024. It is noteworthy that KBRA initially had a lower loss expectation at 10.2% compared to 12.8% for S&P. KBRA revised loss expectations first in August 2023 to 13.5%, followed by another upward revision to 14.8% in February 2024. Despite these upward revisions, Class D, as well as certain other investment-grade rated tranches, were upgraded at both instances of upward loss revisions.
On the prime side, there has been limited issuance of BBB and lower-rated tranches, as captives typically offer only AAA-rated Class As with limited subordinates (e.g., down to AA/A). S&P has consistently rated pools of CARMX and CRVNA, backed by loans on 100% used vehicles, across the full capital stack. The rating agency has maintained a steady upgrade pace through subsequent vintages for these programs. For instance, the time to the first upgrade for CRVNA (prime) transactions has tracked 14, 22, and 13 months, while for CARMX, it has tracked 21, 19, and 21 months across the 2020, 2021, and 2022 vintages, respectively.
Figure 104: BBB auto loan ABS average number of months to first rating upgrade by S&P & KBRAby vintage
Average # of months to first rating upgrade instance
| S&P | KBRA | |||||||||||
| 2018 | 2019 | 2020 | 2021 | 2022 | 2023 | 2018 | 2019 | 2020 | 2021 | 2022 | 2023 | |
| Non-prime Auto | ||||||||||||
| ACAR | 18 | 16 | 17 | 17 | 15 | 29 | 25 | 19 | 14 | 16 | ||
| ACMAT | 17 | 12 | 12 | |||||||||
| AFIN | 17 | |||||||||||
| AMCAR | 19 | 24 | 14 | 20 | 17 | |||||||
| AUTOC | 12 | |||||||||||
| AVID | 19 | 14 | 21 | 16 | 12 | |||||||
| CNART | 29 | 26 | 22 | 20 | ||||||||
| CPS | 16 | 28 | 16 | 18 | 21 | 30 | 23 | |||||
| CRUSA | 37 | |||||||||||
| CRVNA | 23 | 15 | 14 | 27 | 25 | 26 | ||||||
| DRIVE | 15 | 27 | 21 | 16 | ||||||||
| DTAOT | 16 | 20 | 21 | 21 | 16 | 24 | 30 | 19 | 15 | 18 | 18 | |
| EART | 16 | 19 | 15 | 20 | 25 | 12 | 18 | |||||
| FCAT | 17 | 23 | 21 | 20 | 15 | 45 | 38 | 46 | 34 | |||
| FCRT | 14 | 17 | 43 | 25 | 22 | 19 | ||||||
| FHF | 17 | |||||||||||
| FIAOT | 19 | 23 | 15 | 22 | 16 | 28 | 37 | 29 | 31 | 22 | ||
| GCAR | 18 | 19 | 15 | 16 | 18 | 22 | 24 | 29 | 20 | 19 | 15 | |
| GSAR | 12 | |||||||||||
| LADAR | 12 | 12 | ||||||||||
| LBZZ | 13 | 18 | ||||||||||
| ODART | 37 | |||||||||||
| PART | 6 | 31 | 15 | 29 | ||||||||
| SAFCO | 12 | |||||||||||
| SDART | 14 | 18 | 20 | 23 | ||||||||
| SKOP | 35 | 25 | ||||||||||
| TAST | 12 | 12 | 15 | 12 | ||||||||
| TMCAT | 38 | 27 | 36 | 30 | ||||||||
| UACST | 13 | 15 | 11 | 12 | 16 | 13 | ||||||
| USAUT | 18 | 17 | 19 | |||||||||
| VEROS | 27 | 19 | 12 | 15 | ||||||||
| WLAKE | 15 | 14 | 16 | 18 | 16 | 13 | 24 | 18 | 24 | 12 | 17 | |
| WOSAT | 15 | 18 | 19 | 19 | ||||||||
| Prime Auto | ||||||||||||
| BWSTA | 26 | |||||||||||
| CARMX | 22 | 20 | 21 | 19 | 21 | |||||||
| CPART | 30 | 26 | 17 | 15 | ||||||||
| CRART | 28 | |||||||||||
| CRVNA | 14 | 22 | 13 | 28 | 23 | 18 | ||||||
| LADAR | 17 | |||||||||||
| PNFED | 16 | |||||||||||
| SCART | 16 | |||||||||||
| UART | 13 | |||||||||||
| WLAKE | 12 | 12 | ||||||||||
Source: J.P. Morgan, S&P, KBRA
More recently, there has been an uptick in prime issuance activity for subordinate bonds, with more bank and credit union originated paper. For the most part, these issuances are fairly new and less seasoned and have yet to see notable upgrades on the BBB-rated tranches. Performance has been largely robust across these segments, with the exception of Oregon Community Credit Union’s OCCU 2022-1 transaction. In November 2023, S&P placed Classes C (A rated) and D (BBB rated) on CreditWatch with negative implications following worse-than-expected performance. The rating agency highlighted that the performance of loans originated in Washington state were major contributors to the overall weaker performance. Subsequently, OCCU amended the sale and servicing agreement and made a capital contribution of $750,000 into the transaction’s non-amortizing reserve account, which increased the credit enhancement to levels commensurate with the current ratings. In May 2024, S&P revised the lifetime expected CNL on the transaction to 3.8% from the initial 2.3% and affirmed Classes C and D at their initial ratings.
On the other end of the spectrum, PenFed, which comprises higher quality collateral and has less concentrated pools relative to other credit unions, saw its 22-A Class D upgraded from BBB+ to AA in 16 months of seasoning. S&P also revised the lifetime loss expectation for the PNFED 22-A transaction to 0.70%, down from the initial expected CNL of 1.5%. UART 21-1 Class D was another credit union prime auto originated transaction that saw an S&P rating upgrade from BBB to A in just 13 months since issuance. In March 2022, at the time of this first upgrade, S&P also revised its ECNL for Unify’s UART 21-1 to 1.8% from 2.9% at closing. Westlake priced its debut prime auto loan deal, WLAKE 2023-P1, in August 2023. Class D of the transaction, with 4.4% initial hard credit enhancement, was rated BBB+ and KBRA's lifetime loss expectation base case tracked at 2.2%. Subsequently, KBRA upgraded the tranche to A+ when credit enhancement built to 9.9% and revised the pool loss expectation upward to 2.8% at 12 months of seasoning in August 2024.
Turning to marketplace lending (MPL) ABS, we note that KBRA has rated 94% of new issue volume since 2016 and is the sole rating agency on 67% of bonds. Similar to the trend seen in autos, the time to upgrade had generally shortened across MPL assets for 2020 vintages compared to prior years, driven by robust credit trends supported by pandemic stimulus. However, with the underperformance in late 2021 and 2022 vintages and several downgrades recorded in the sector, that trend has mostly normalized.
For instance, KBRA upgraded LDPT 21-A and 21-B Class Bs from BBB- to AA- and BBB, respectively, in July 2022, about a year from issuance. Despite the fact that loss expectations for 21-B were revised up from 15.1% to 16.0% by KBRA, the upgrade for Class B was driven by credit enhancement build-up at levels commensurate with a BBB rating. However, LDPT 22-A Class C saw its first upgrade from BBB- to BBB after 20 months, due to significantly weaker pool performance and overcollateralization erosion, which resulted in delayed enhancement build-up for tranches at the top of the stack. Prior to this upgrade, KBRA had already downgraded the lowermost Class E from B to B- in March 2023 and had placed Class D, which was BB- rated, on watch for downgrade. Additionally, KBRA updated the lifetime expected cumulative net loss (CNL) to 19.0% from 15.0% at closing, and the agency’s expectation is currently at 26.0% for the pool. LDPT transactions since 22-A have not seen a single instance of an upgrade. On the contrary, they have experienced significant downgrades, with most outstanding LDPT transactions underwater and facing unrealized write-downs on subordinate tranches.
Figure 105: KBRA MPL ABS average number of months to first rating upgrade by vintage
Average # of months to first rating upgrade instance
| KBRA | ||||||
| 2018 | 2019 | 2020 | 2021 | 2022 | 2023 | |
| BBB | ||||||
| AVNT | 11 | 19 | 38 | |||
| CLUB | 17 | 28 | ||||
| CSABS | 19 | |||||
| FREED | 15 | 18 | 33 | 21 | ||
| LDPT | 14 | 14 | 11 | 20 | ||
| MFT | 25 | 36 | 44 | |||
| PAID | 19 | 26 | 26 | 18 | ||
| PMIT | 15 | 20 | ||||
| REACH | 21 | 16 | 28 | 24 | ||
| SCLP | 39 | |||||
| THRM | 12 | 22 | 27 | |||
| UPGR | 12 | 20 | ||||
| UPST | 14 | 20 | 26 | 20 | ||
| BB | ||||||
| AVNT | 20 | 19 | 38 | |||
| CLUB | 31 | 37 | 32 | |||
| CSABS | 19 | |||||
| FREED | 26 | |||||
| LDPT | 24 | 17 | 13 | |||
| PAID | 34 | |||||
| PMIT | 15 | 35 | ||||
| REACH | 21 | 32 | 35 | 22 | ||
| THRM | 25 | 32 | ||||
| UPGR | 24 | |||||
| UPST | 23 | 25 | 35 | |||
| B | ||||||
| AVNT | 38 | |||||
| CSABS | 43 | |||||
| LDPT | 17 | 13 | ||||
| PMIT | 39 | |||||
| UPGR | 36 | |||||
| UPST | 39 | 39 | ||||
Source: J.P. Morgan, KBRA
Upstart, through its UPST shelf, was a frequent ABS issuer up until the 23-3 transaction, which priced in October last year. In March 2023, KBRA downgraded UPST 22-1 Class C (from BB- to B-) and Class B (from BBB- to BB+). This marked the first instance of an investment-grade rated MPL tranche being downgraded to a high-yield rating. Subsequently, given continued deteriorating pool performance, the rating agency downgraded 22-1 Class C to a distressed CCC rating in November 2023, and there has been no new issuance since. Given the underperformance across UPST 2022 transactions, there have not been any upgrades for the vintage. However, the program has witnessed consistent upgrades in earlier vintages, even for initially non-investment-grade rated tranches. For context, UPST has not structured or issued single-B rated Class D tranches since the 2019-1 transaction.
Similar to autos, there have also been instances of multi-notch upgrades which have resulted in a delayed first upgrade action. For instance, initially rated BBB- tranches for the 22-2 and 22-3 PAID (Pagaya) deals have seen their first rating upgrade from BBB- to A/A- in 24-30 months, despite significant upward revisions to losses (from 14%-16% at closing to 21% recently). The 23-1 transaction, which is so far the only 2023 transaction to see a rating upgrade at the BBB- tranche, was upgraded to BBB in 18 months, and the rating agency adjusted losses from 17.9% to 20.0% for the pool.
Marlette, the provider of Best Egg personal loans, has been a programmatic ABS issuer through its MFT shelf since 2016. Prior to the 2020 transactions, MFT had a three-class structure with Class A, B, and C rated in the single-A, BBB, and BB categories, respectively. Since then, it has moved to a four-tranche structure with the addition of a AAA tranche at the top. Marlette’s MFT ABS programs have among the highest advance rates at the BBB level. Given that BBB is at the very bottom of the stack, as opposed to non-investment-grade rated tranches for other active issuers such as UPST and LDPT, the time to upgrade for MFT has lagged behind peers, and there has been no BBB upgrade since 2020. On March 1, 2024, KBRA placed the BBB- Class D rated notes of MFT 2023-1 and 2023-2 on watch negative. Subsequently, on May 29th, the rating agency downgraded both notes from BBB- to BB, citing higher-than-expected cumulative net loss (CNL). KBRA revised its lifetime loss estimates upwards for both transactions to 12.25% (from 9.25% for 23-1 and 9.70% for 23-2). Current cumulative net losses on MFT 23-1 and 23-2 stand at 6.6% and 5.9%, respectively, both under their respective current CNL trigger thresholds of 7.8% and 6.3%. This rating action marked the first-ever instance of a downgrade for a 2023 consumer ABS transaction.
In summary, rating agencies have taken a more cautious approach when actual or realized losses have trended higher than their initial base case forecasts. In such cases, upgrades have been delayed, even when credit enhancement has built up substantially, as rating agencies have waited for more performance data to ascertain revised expected cumulative net losses (ECNLs). This delay has sometimes resulted in multi-notch upgrades as support continued to build in the interim. Instances of positive rating actions for senior tranches, even amidst significant credit underperformance of the pool, demonstrate the key structural strength of amortizing ABS transactions. While upgrades for the 2022 vintage have lagged due to post-pandemic credit normalization, we expect the pace of upgrades to revert in recent vintages as rating agencies have calibrated for higher initial base case losses and sponsors have tightened credit boxes, which should support better credit performance.
Rental car ABS August review
We evaluated the monthly noteholder reports from August for rental car ABS, with a focus on HERTZ. Both AESOP (Avis) and HERTZ ABS were compliant with all asset coverage tests. According to the August monthly ABS noteholder report (which covers the July performance month), AESOP’s mark-to-market (MTM) test came in at 105.1% and the asset disposition test at 100.9% (measurement month average). For Hertz, the MTM tracked at 100.3% for the current month (100.4% for the minimum 12-month trailing) and the disposition ratio came in at 100.2% for the current month (102.6% for the minimum 12-month trailing).
Post a steady performance spree of recording near-minimum required monthly depreciation rates for three consecutive months, HERTZ reported yet another significant depreciation print for August reporting ( Figure 106). In its most recent ABS monthly remit report reflecting July performance, Hertz reported a weighted average depreciation rate (for risk vehicles) of 2.4%, resulting in a base rent payment of $343 million, up $95 million from the prior month. This also represents the highest print for the new HVF trust (HVF III, which launched in mid-2021). This outsized expense was a result of depreciating 75,883 units, or 17% of risk vehicle net book value (NBV), by 5.5% for the month. Notably, while the earlier episode of higher rent payment in April this year was largely driven by depreciating the Tesla fleet, which accounted for 6.3% of the fleet then, the current high depreciation print is a result of broader weakness. The fleet consisted of 75,883 units depreciated at 5.5%, of which Tesla's contribution was 11,862 units (about 2.7% of the total fleet currently). As part of the 2Q24 earnings call, management had guided making $50million-$100 million of ABS payments. The aforementioned current base rent payment (monthly depreciation charge) at $343 million, about $90-$100 million in excess of steady-state monthly payments (assuming minimum mandated ABS depreciation rates), represents the top end of that guidance. This was driven by weakness in market value quotes (i.e., drop in residuals) for the HERTZ fleet by NADA and Black Book for July, which are used as references to determine FMV for the ABS trust.
Hertz noted in the earnings report that 30% of their global fleet was tracking depreciation per unit (DPU) of $325 or less, while the remainder of the fleet was at a DPU of $660. The average capitalized cost of units depreciated at a higher rate of 5.5% was $35,596 compared to $31,962 for the entire fleet (entire risk portion of the fleet), which Hertz would potentially look to dispose of in the upcoming months as part of its ongoing fleet refresh. The monthly mark-to-market ratio (100.3%) and disposition ratio (100.2%) for July were just above 100%. This indicates that the outsized depreciation was required by HERTZ to meet the minimum ABS mandated thresholds in order to not trip the trigger thresholds and was not voluntary in our view.
Figure 106: Hertz ABS performance snapshot

Source: J.P. Morgan, ABS deal documentsNote: Disposition and MTM test correspond to one month average; Disposition ratios for February 2024, December 2023 and January 2022 reporting are calculated using the cumulative disposition proceeds since most recent measurement month ended to aggregate NBV of eligible non-program vehicles with disposition date in related month, for other reporting months total levels for measurement month considered
We also reviewed FMV month-on-month sequential declines by OEM for the HERTZ ABS fleet ( Figure 107). These calculations are based on average FMVs per unit from June through July as reported in the HERTZ ABS remits. We further drilled down to the top 9 OEMs that accounted for about 92% of the HERTZ ABS trust in July. Based on our analysis, Tesla recorded the highest monthly decline in terms of FMV at -7.1% with a weight of 3%, followed by Ford at -3.1% with a 16% weight, and GM at -2.8% with a 24% weight. While the Tesla monthly decline for the HERTZ fleet was the highest, its contribution to total depreciation was subdued given the lower weight. In contrast, Ford and GM contributed more heavily to the decline due to their higher weights in the trust. Directionally, these declines in the HERTZ trust align with broader market trends, although the broader trends do not explicitly account for depreciation. Also, HERTZ presumably has a lower quality fleet compared to the aggregate market, with higher capitalized cost vehicles as discussed above.
Figure 107: July OEM trends for HERTZ ABS versus aggregate
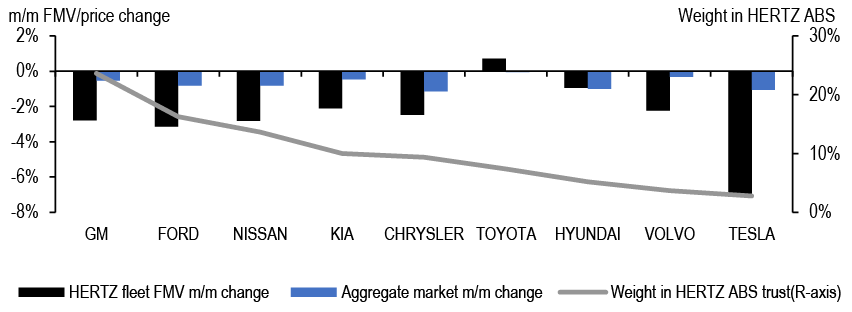
Source: J.P. Morgan, HERTZ ABS deal documents, CarGurus
Note: M/M corresponds to changes in July 2024 from prior month. FMV change only for risk vehicles in the HERTZ HVFIII ABS fleet. Weights derived from risk NBV levels. Aggregate market data corresponds to make-wise average listing prices from Cargurus.
While Hertz is operating the trust on razor-thin margins, Avis management, presenting at the recently held J.P. Morgan Automotive Conference, reiterated the robust cushions within the AESOP trust. 2 They highlighted a $1 billion equity cushion in the fleet and an additional $1.2 billion of capital availability from unissued D-tranche notes. For context, Avis last offered the non-investment-grade BB-rated D notes as part of its AESOP 2022-4 transaction in July 2022 and has retained Class Ds since then. This part of the stack offering would be more expensive (on an all-in yield basis) compared to other unsecured forms of funding for Avis. The management also highlighted that Avis could weather up to a 12% incremental pricing decline before having to invest cash towards its ABS facilities.
Week in review
Six ABS transactions totaling $2.8bn across equipment, consumer MPL, consumer branch, student loan and auto lease ABS priced this week, bringing 2024 year-to-date ABS supply to $222.4bn compared to $172.6bn over the same period last year. August supply stands at $16.3bn versus $23bn over August 2023. Looking to the forward calendar, we presently see no deals in pre-marketing. Spreads held firm on the week across most ABS asset classes and tightened by 0-15bp for private credit student loan.
Data appendix
Figure 108: ABS supply
$bn
| 2020 | 2021 | 2022 | 2023 | 2023 YTD | 2024 YTD | |
| Credit Cards | 4 | 17 | 32 | 23 | 13.1 | 15.6 |
| Bank/Charge | 4 | 17 | 30 | 21 | 11.8 | 13.1 |
| Retail | 0 | 0 | 2 | 2 | 1.4 | 2.5 |
| Autos | 98 | 132 | 110 | 146 | 99.1 | 120.5 |
| Prime Loan | 46 | 50 | 50 | 73 | 50.0 | 56.0 |
| Non-prime Loan | 28 | 43 | 33 | 34 | 24.1 | 29.3 |
| Lease | 19 | 27 | 16 | 23 | 14.5 | 22.4 |
| Fleet & other | 6 | 13 | 11 | 16 | 10.6 | 12.8 |
| Student Loans | 17 | 26 | 7 | 7 | 4.3 | 7.2 |
| FFELP | 5 | 8 | 0 | 0 | 0.0 | 0.0 |
| Private Credit | 12 | 18 | 7 | 7 | 4.3 | 7.2 |
| Equipment | 13 | 19 | 22 | 21 | 13.2 | 20.1 |
| Floorplan | 4 | 1 | 1 | 4 | 3.6 | 4.9 |
| Unsecured Consumer | 9 | 17 | 16 | 14 | 9.3 | 11.9 |
| MPL | 4 | 8 | 9 | 8 | 5.2 | 4.7 |
| Branch & other | 5 | 9 | 7 | 7 | 4.1 | 7.2 |
| Miscellaneous | 34 | 55 | 56 | 41 | 29.9 | 42.1 |
| Total ABS | 179 | 267 | 244 | 256 | 172.6 | 222.4 |
| % 144A | 57% | 61% | 50% | 56% | 56% | 61% |
| % Floating-rate | 4% | 5% | 4% | 7% | 6% | 9% |
Source: J.P. Morgan.
Figure 109: Other ABS supply
$bn
| 2020 | 2021 | 2022 | 2023 | 2023 YTD | 2024 YTD | |
| Franchise/Whole Bus. | 4.8 | 13.7 | 6.6 | 1.7 | 0.8 | 7.1 |
| Data Center | 2.6 | 6.2 | 1.0 | 5.9 | 3.7 | 5.2 |
| Device Payment | 4.4 | 3.1 | 5.3 | 4.5 | 3.0 | 4.5 |
| Fiber | 0.2 | 1.3 | 1.2 | 4.0 | 4.0 | 3.7 |
| Solar | 2.7 | 3.2 | 4.0 | 4.2 | 2.9 | 3.5 |
| Stranded Ast | 2.3 | 21.2 | 7.8 | 6.2 | 3.5 | |
| Timeshare | 1.9 | 2.4 | 2.6 | 2.5 | 1.6 | 2.4 |
| Insurance | 2.2 | 1.1 | 2.3 | 2.4 | 1.9 | 2.2 |
| Aircraft | 2.6 | 8.5 | 1.1 | 0.7 | 1.7 | |
| Containers | 7.3 | 5.6 | 0.8 | 0.3 | 0.3 | 1.7 |
| SBL | 0.4 | 1.0 | 1.7 | 1.1 | 0.7 | 0.8 |
| Railcar | 0.5 | 2.8 | 0.9 | 0.2 | 0.6 | |
| Trade Rec. | 0.3 | 0.5 | ||||
| Taxes | 0.5 | 0.1 | 0.3 | 0.2 | 0.5 | |
| Healthcare | 0.4 | 0.4 | 0.4 | 0.4 | 0.3 | |
| PACE | 0.3 | 0.8 | 0.5 | 0.7 | 0.6 | 0.3 |
| Miscellaneous | 4.0 | 2.3 | 6.3 | 4.1 | 3.7 | 3.8 |
| Total Other ABS | 34.4 | 55.2 | 56.0 | 40.8 | 29.9 | 42.1 |
Source: J.P. Morgan.
Figure 110: ABS spread performance
bp
| Benchmark | Current | 1-week | 10-week | |||
| 8/22/2024 | Change | Avg | Min | Max | ||
| Credit Card - Fixed Rate | ||||||
| 2-yr AAA | Treasury | 45 | 0 | 44 | 42 | 47 |
| 3-yr AAA | Treasury | 48 | 0 | 48 | 46 | 50 |
| 5-yr AAA | Treasury | 53 | 0 | 54 | 51 | 57 |
| 10-yr AAA | Treasury | 78 | 0 | 79 | 76 | 82 |
| B-Piece (5-yr) | Treasury | 85 | 0 | 84 | 81 | 88 |
| C-Piece (5-yr) | Treasury | 132 | 0 | 129 | 125 | 135 |
| Credit Card - Floating Rate | ||||||
| 2-yr AAA | SOFR | 48 | 0 | 44 | 43 | 48 |
| 3-yr AAA | SOFR | 55 | 0 | 54 | 53 | 58 |
| 5-yr AAA | SOFR | 80 | 0 | 79 | 78 | 83 |
| 10-yr AAA | SOFR | 110 | 0 | 109 | 108 | 113 |
| B-Piece (5-yr) | SOFR | 105 | 0 | 112 | 105 | 113 |
| C-Piece (5-yr) | SOFR | 153 | 0 | 157 | 153 | 158 |
| Auto - Prime | ||||||
| 1-yr AAA | Treasury | 48 | 0 | 41 | 36 | 48 |
| 2-yr AAA | Treasury | 62 | 0 | 56 | 52 | 62 |
| 3-yr AAA | Treasury | 70 | 0 | 66 | 62 | 72 |
| 3-yr AA | Treasury | 100 | 0 | 94 | 85 | 100 |
| Student Loans (FFELP) | ||||||
| 3-yr AAA | SOFR | 95 | 0 | 93 | 90 | 95 |
| 7-yr AAA | SOFR | 112 | 0 | 111 | 110 | 112 |
| Private Credit Student Loan | ||||||
| 3-yr AAA | SOFR | 115 | 0 | 106 | 100 | 115 |
| Unsecured Consumer MPL | ||||||
| 1-yr AAA | Treasury | 90 | 0 | 83 | 75 | 95 |
| 3-yr AA | Treasury | 145 | 0 | 134 | 125 | 150 |
| 3-4yr A | Treasury | 185 | 0 | 174 | 170 | 190 |
| 3-4yr BBB | Treasury | 265 | 0 | 250 | 240 | 275 |
| 3-4yr BB | Treasury | 490 | 0 | 472 | 460 | 500 |
| Auto - Subprime | ||||||
| 1-yr AAA | Treasury | 65 | 0 | 61 | 55 | 65 |
| 2-yr AAA | Treasury | 80 | 0 | 76 | 65 | 85 |
| 3-yr AA | Treasury | 100 | 0 | 93 | 85 | 105 |
| 3-yr A | Treasury | 120 | 0 | 115 | 107 | 130 |
| 3-yr BBB | Treasury | 165 | 0 | 153 | 145 | 175 |
| 3-yr BB | Treasury | 350 | 0 | 349 | 340 | 380 |
Source: J.P. Morgan.
Figure 111: Fixed-rate AAA ABS (3-year) spreads to Treasury
bp
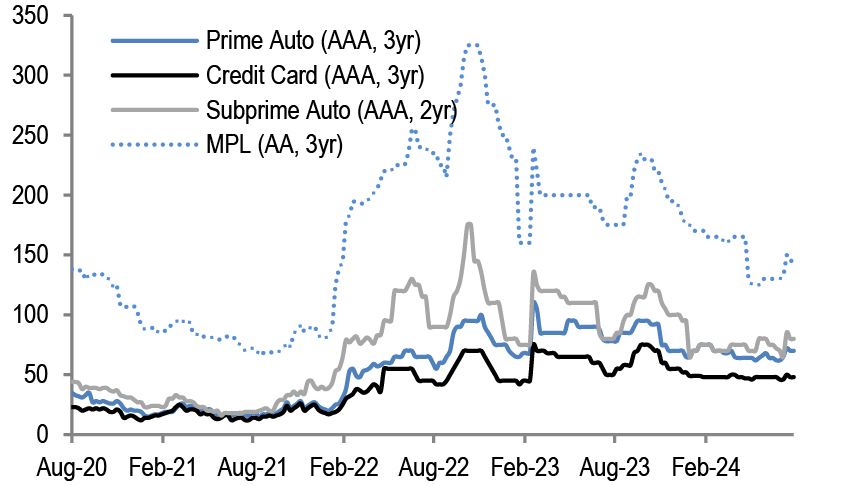
Source: J.P. Morgan.
Figure 112: Floating-rate AAA ABS (3-year) spreads to SOFR
bp
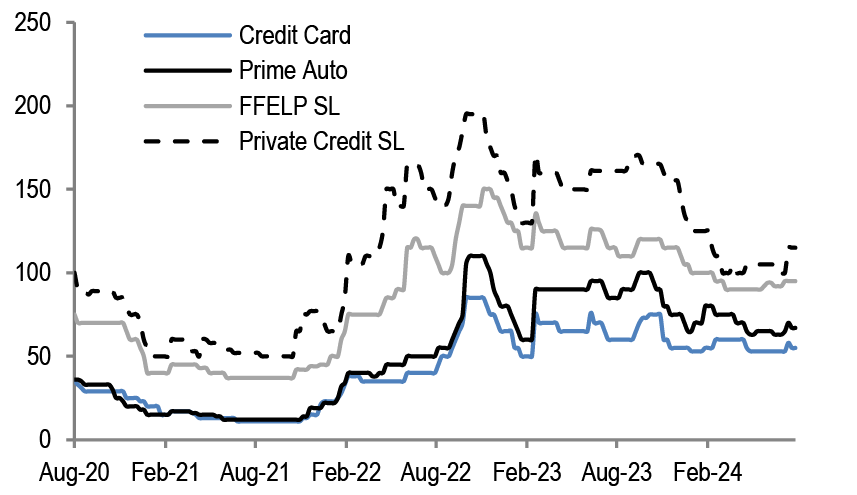
Source: J.P. Morgan. Note: Spreads to LIBOR till June 29, 2023 and to SOFR since then.
Figure 113: AAA cross sector spreads (3-year) to Treasury/SOFR
bp
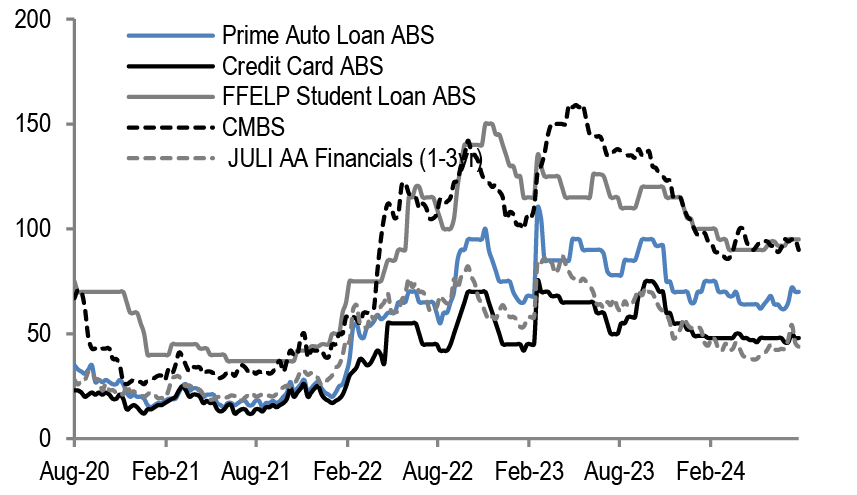
Source: J.P. Morgan. Note: FFELP Student Loan ABS spread to LIBOR till June 29, 2023 an to SOFR since then.
Figure 114: BBB subprime auto ABS (3-year) and MPL unsecured consumer ABS (3-4year) vs. BBB financials to Treasury
bp
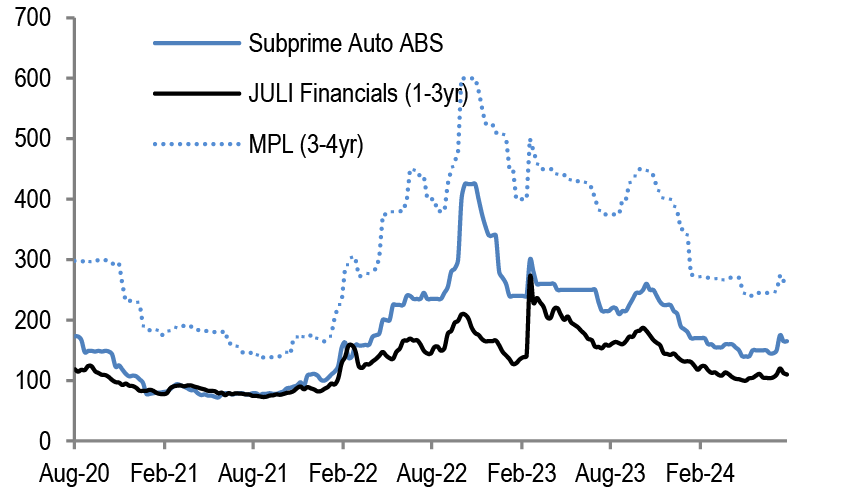
Source: J.P. Morgan.
Figure 115: ABS secondary trading weekly TRACE volume
$bn
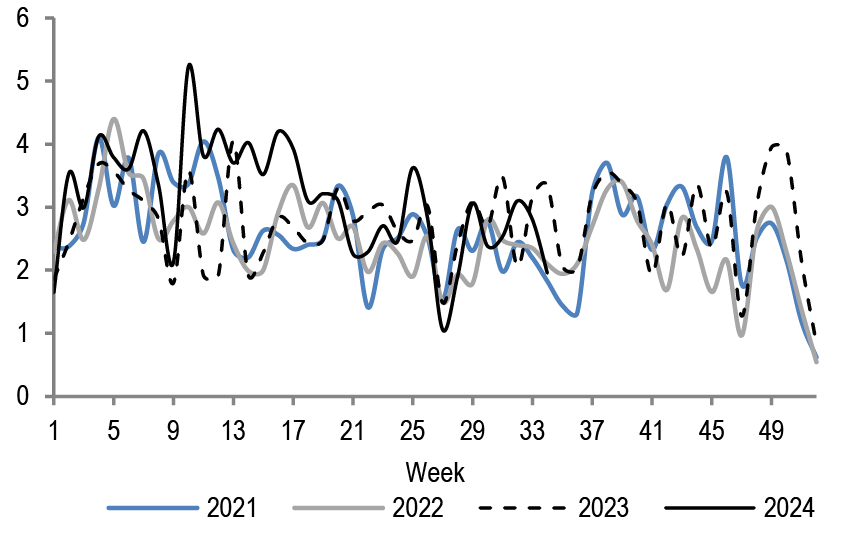
Source: J.P. Morgan, TRACE
Corporates
- JULI spreads have been stable in the 110-112bp range over the past 5 days despite declining yields, which are at a low of 5.07% since February 2023. Historically, August sees spread widening due to lower liquidity and anticipation of heavy September supply, but this month spreads have widened by only 1bp MTD. Stable spreads despite lower yields are attributable to earlier widening in June and July, improving economic data, and a reversal of the equity selloff.
- High-grade credit is on track for a fourth consecutive month of positive returns, with a 2.0% MTD return. Partly because of this, fund flows have been robust averaging $5.3bn/week this month. Trading volumes have been surprisingly high MTD, averaging $34.6bn/day, 67% higher than the 4-year average. August supply has been active with $103bn priced, surpassing the 4-year average of $85bn, leading to a revised gross issuance forecast of $1.5tr for the full year ($400bn to come over the remaining four months).
- Looking ahead, the focus is on the August labor market report due on September 5th. A slowdown in July non-farm payroll growth and a jump in the unemployment rate led to market selloffs and expectations for more aggressive Fed cuts. Subsequent benign economic data have reversed most of the early August selloff. Still, JPM expects slower growth in 2H24 (1.2% vs. 2.1% in 1H24). If this proves to be correct, labor markets will continue to be a focus, and fears of growth slowing too much will likely keep volatility elevated. We remain comfortable with our HG bond spread forecast of 110bp at YE, which is near the current level. We believe still attractive yields, a continuation of positive returns, relatively lighter supply in the coming months and the start of Fed cuts will be supportive of spreads, while slower growth and a trend towards lower yields limit meaningful further spread tightening.
- Inside, we also discuss the upcoming month-end index rebalance, the outperformance of Financials versus Non-Financials in the recent rally, major and minor selloffs in HG and how ‘buying the dip’ has fared, no slowdown in demand for HG credit from Japan and room for 10s30s curve to steepen.
Holding pattern
JULI spreads have been in a tight 110-112bp range over the past 5 days in a period of light economic and corporate data releases. Spreads have been stable recently despite steadily declining yields. These are now at a low since February 2023 of 5.07%, as of Wednesday’s close. Despite yields down 24bp MTD and supply above the usual pattern for the month, spreads have widened by only 1bp, or 1.1% MTD. Historically, spreads have widened by an average of 3.1% in August over the past four years, the second highest after February's average widening of 3.6%. A typically weak August for spreads is, we believe, driven by a desire to lighten positions in what is historically a lower liquidity month and in anticipation of the heavy supply that is typical in September. Stable spreads this month despite the lower yields is partly due to spreads widening in both June and July, which are typically months of spread tightening. The improving economic data after the first week of the month and subsequent full reversal of the equity selloff has, of course, contributed to stable spreads despite the lower yields as well. HG credit is on track for a fourth consecutive month of positive returns, a trend last seen from April to July 2021. MTD, the index has returned 2.0%. Trading volumes have also remained elevated throughout the month, averaging $34.6bn/day, a 67% higher pace than the 4y average of $20.8bn/day. Fund flows have been robust averaging $5.3bn/week this month, likely driven by the positive returns. This compares with $6.3bn/week in July and $4.4bn/week in 2Q. Finally, supply has remained active with $103bn priced in August, surpassing the past 4y average of $85bn. This makes August the 7th month out of 8 this year when supply has exceeded the prior averages, and we thus revise our gross issuance forecast modestly up to $1.5tr (discussed in detail below).
Looking forward the focus is on the August labor market, which will be reported on September 5th. A renewed focus on the labor market began with Powell’s speech at the July 31 FOMC meeting, at which he highlighted that the Fed’s attention was turning more towards the 2nd part of its mandate as inflation trends were moving in the right direction. A couple of days later the sharp slowdown in July non-farm payroll growth and a jump in the unemployment rate led to a sharp selloff in markets and an expectation for more aggressive Fed cuts. After this data JPM moved from expecting 50bp of cuts by YE to 125bp, for example. Subsequently the economic data have been more benign, with retail sales strong and jobless claims coming down from their recent peak, and markets have unwound most of the early August selloff. Still, JPM expects growth in 2H24 to be meaningfully slower than in 1H24 (1.2% vs. 2.1%). If this is right, it is likely that the labor market will continue to cool, and fears that growth may slow too much will remain part of the dialogue. HG bond spreads near 110bp are not back to the 99bp tights of this cycle, but they are certainly not pricing in much recession risk either. 110bp is our YE forecast, as JPM’s base-case economic forecast is for slow but positive growth along with aggressive Fed easing and lower UST yields. This backdrop should be one in which spreads remain near their current level.
Figure 116: Spreads have been stable this month, atypical of August being the second-worst month for spreads historically

Source: J.P. Morgan. Note: Figures are spread changes as a % of the overall spread
Figure 117: August to be a 4th consecutive month of positive returns, a trend last seen from April to July 2021
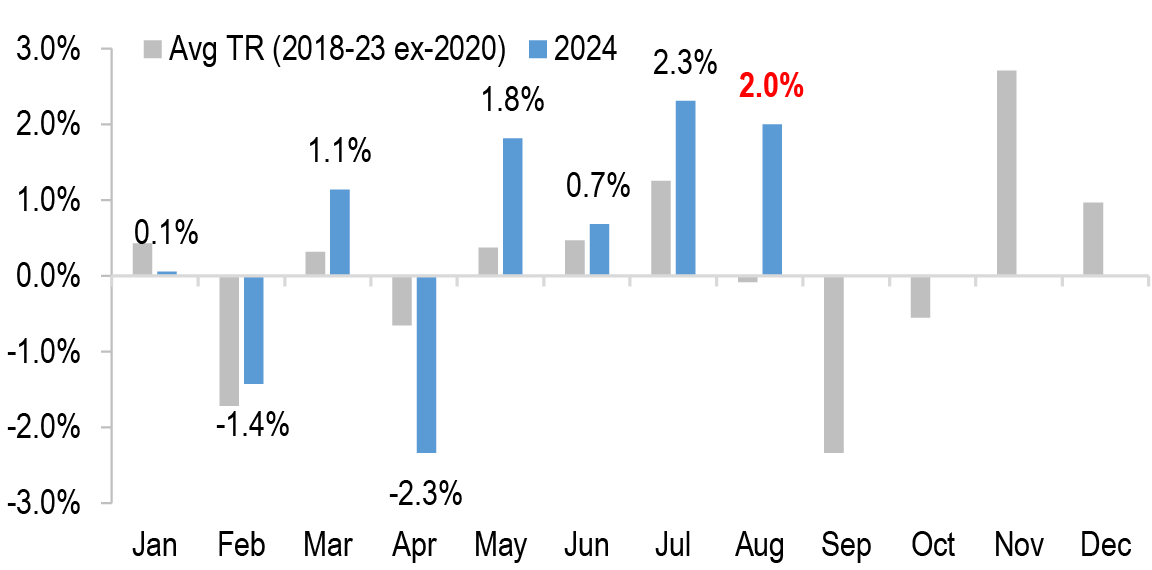
Source: J.P. Morgan.
Rapidly declining yields are increasing spreads as a percent of yields
HG bond yields have declined every month since April, and this trend has accelerated recently. MTD yields are 24bp lower, following declines of 19bp, 4bp and 27bp in May, June and July, respectively. The current yield level of 5.07% is the lowest since February 2023. For most of this time the decline in yield has been driven by ‘good’ developments, specifically lower inflation with steady growth. Earlier this month the decline in yields was driven by ‘bad’ news as weak labor market and growth data spurred fears of recession and a Fed behind the curve. There has been little correlation between yields and spreads over the past few months except in early August, when the drop in yields was driven by these growth fears. The recent decline in yields has occurred with somewhat steady spreads, such that spreads as a percent of yields have risen. This is not a measure that we ascribe much value to as it has not been helpful in predicting spreads – it has trended down for most of the past 5 years. However, if the expected Fed cuts in September cause a rush for duration exposure by some, which we believe is likely, the percentage gap between the yield on offer in HG credit vs. treasury markets will be near the widest it has been in 2024. This may steer the marginal duration buyer more towards credit versus rates products. This is much more likely if the expected Fed cuts next month are driven more by success on inflation than by fears of a labor market slowing too quickly. Today’s jobless claims report and Friday’s Jackson Hole speech by Powell will be important benchmarks in this determination.
Figure 118: JULI yield has not dipped below 5.0% since Feb’23
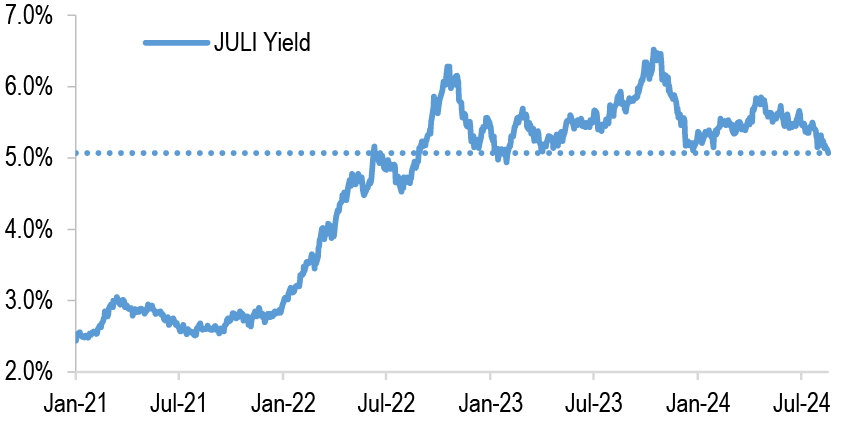
Source: J.P. Morgan.
Figure 119: Spreads as a % of yields has risen with the recent move lower in yields
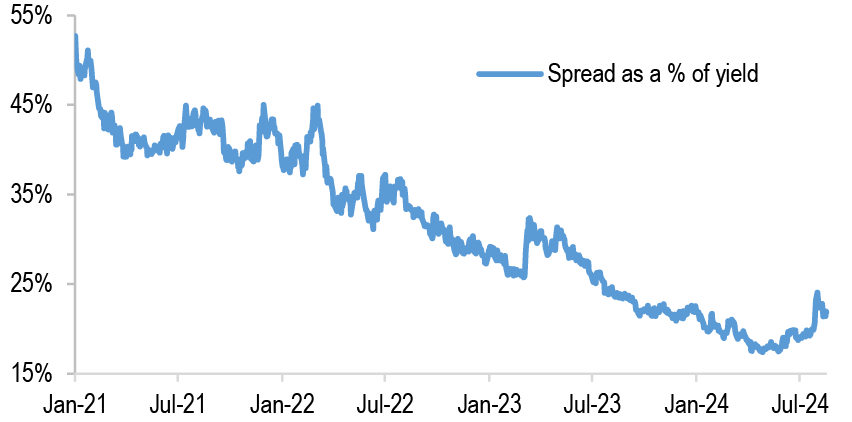
Source: J.P. Morgan.
Revising our gross issuance forecast up modestly to $1.5tr, which leaves $400bn till YE
With August supply likely nearly done, we review and moderately revise our issuance outlook for the remaining four months of the year. There has been $1.1tr of debt issued YTD including ~$102bn MTD. This is $17bn ahead of the past 4y August average of $85bn – the 7th month out of the 8 this year in which supply has exceeded the historical monthly pattern. We revise our full-year gross issuance forecast to $1.5tr (from $1.45tr previously), which leaves $400bn to come before YE. While our issuance forecast is the sum of the sector analysts’ forecasts, the full-year figure is consistent with the historical trend. Over the past 10 years about 71% of full-year supply has come in the first 8 months of the year. If this 71% figure proves correct in 2024, it implies that supply will total $1.56tr, which is modestly higher than our revised forecast. Given the heavy issuance YTD as companies focused on getting ahead of the election, a slightly slower than typical last four months is a reasonable assumption, in our view. All of the increase in our full-year supply forecast comes in Non-Financial sectors (2024F of $929bn, YTD $683bn) as the Financials supply full-year forecast is unchanged at $571bn (YTD $415bn). The table below shows the remaining supply expectations by sector. Also below we use the historical pattern of supply by month to ‘allocate’ the ~$400bn remaining in our forecast over the four remaining months. This leads to an estimate of $149bn of supply in September, about $20bn over the $127bn 4yr historical average for September. Note that these are not monthly supply forecasts, but simply an extrapolation of historical patterns of issuance. Under the revised $1.5tr gross issuance forecast, 2024F net issuance will be $680bn.
Figure 120: We revise our gross issuance forecast to $1.5tr, and thus expect $400bn for the remainder of the year
| Sectors | 2024F Gross Issuance | Of which M&A related | 2024 YTD Issuance | YTD as % of total forecast | Remaining Issuance |
| Financials | 571 | 15 | 415 | 73% | 156 |
| Banks | 427 | 0 | 299 | 70% | 128 |
| US banks | 195 | 0 | 146 | 75% | 49 |
| Yankee Banks | 232 | 0 | 153 | 66% | 79 |
| Finance Companies | 67 | 9 | 54 | 80% | 13 |
| Insurance | 77 | 6 | 62 | 80% | 15 |
| Non-Financials | 929 | 200 | 683 | 74% | 246 |
| Automotive | 85 | 0 | 71 | 84% | 14 |
| Basic Industries | 54 | 6 | 32 | 60% | 22 |
| Capital Goods | 87 | 22 | 63 | 72% | 24 |
| Consumer | 105 | 48 | 53 | 51% | 52 |
| Energy | 94 | 21 | 79 | 84% | 15 |
| Healthcare/Pharma | 138 | 47 | 117 | 85% | 20 |
| Media/Entertainment | 26 | 5 | 20 | 78% | 6 |
| Property/Real Estate | 28 | 0 | 23 | 81% | 5 |
| Retail | 36 | 24 | 27 | 76% | 9 |
| Technology | 97 | 27 | 61 | 63% | 36 |
| Telecoms | 22 | 0 | 16 | 74% | 6 |
| Transportation | 32 | 0 | 16 | 49% | 16 |
| Utilities | 126 | 0 | 104 | 83% | 22 |
| Total | 1,500 | 215 | 1,098 | 73% | 402 |
Source: J.P. Morgan.
Figure 121: YTD supply has exceeded the historical pattern in almost every month, and we expect this to continue through YE
The grey dashed bars are estimates based on historical pace and not our forecast

Source: J.P. Morgan.
Expecting a moderately active month-end as index grows the most in 7 months
We appear to be headed towards a moderately active month-end in August as supply has been significantly above average. However, typical summer seasonality and lower fund inflows on the passive side may impact activity.
The duration extension this month is +0.08yrs, above the LTM average of 0.07y (Figure 9) as yields are 24bp lower on the month along with a material pickup in long-end supply; 30yr issuance is 23% of the MTD total, which is the highest proportion since May 2023.
The index is expanding by $38bn par, the most since January 2024. This is because issuance has exceeded the average for August by 21% (Figure 10). On the month, 107 bonds / $90bn par are entering, 61 bonds / $55bn par are exiting plus $3bn net more across 23 bonds due to taps/tenders/buybacks.
The pace of fund inflows MTD is $5.3bn/week, higher than the YTD pace of $4.7bn/week (+13%). However, the pace of passive inflows has fallen MoM with the share falling to 41% this month, lower than the YTD average of 45% (Figure 11). This decline coupled with typical summer seasonality could dampen month-end trading activity.
Figure 122: Index Duration extension: +0.08yrs this month, modestly higher than the LTM average
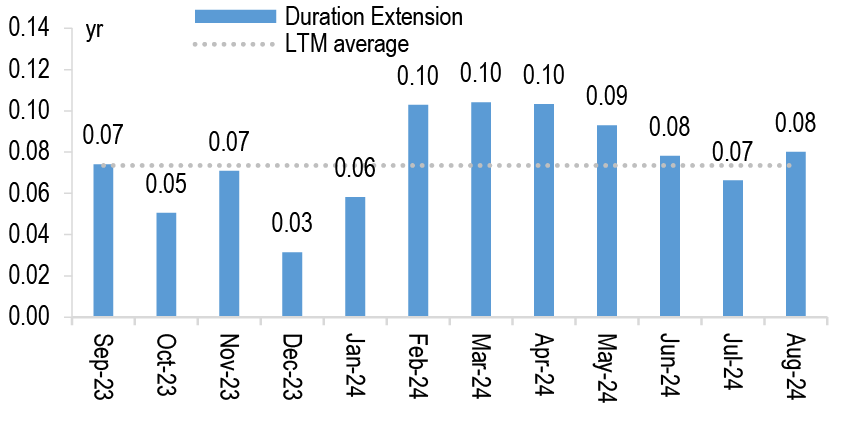
Source: J.P. Morgan, Bloomberg Finance L.P.
Figure 123: Index Net Growth: The index is expanding by $38bn par this month
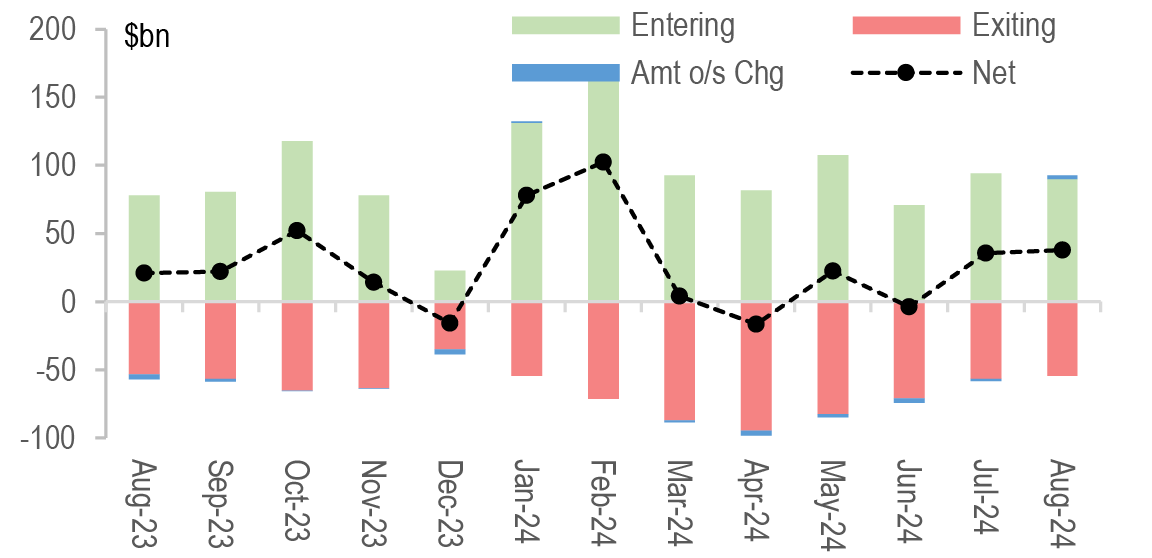
Source: J.P. Morgan, Bloomberg Finance L.P.
Figure 124: Monthly Fund flows: Active vs Passive Funds
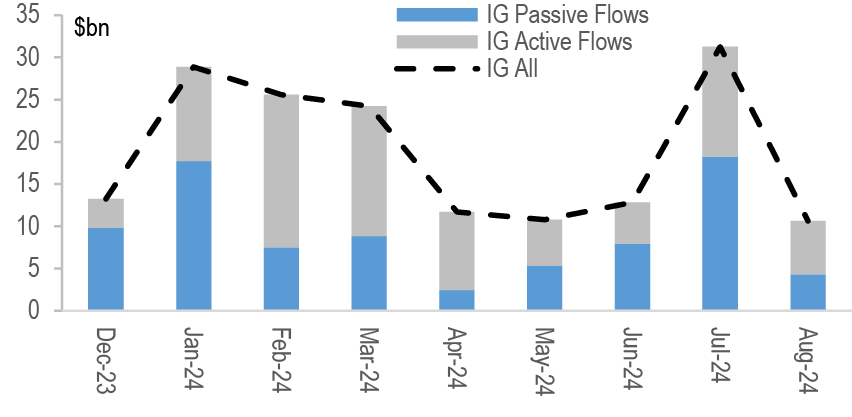
Source: J.P. Morgan, EPFR. Note that monthly flows are a sum of the weekly flows only.
Figure 125: Trading volumes: Month-end vs. rest-of-month average
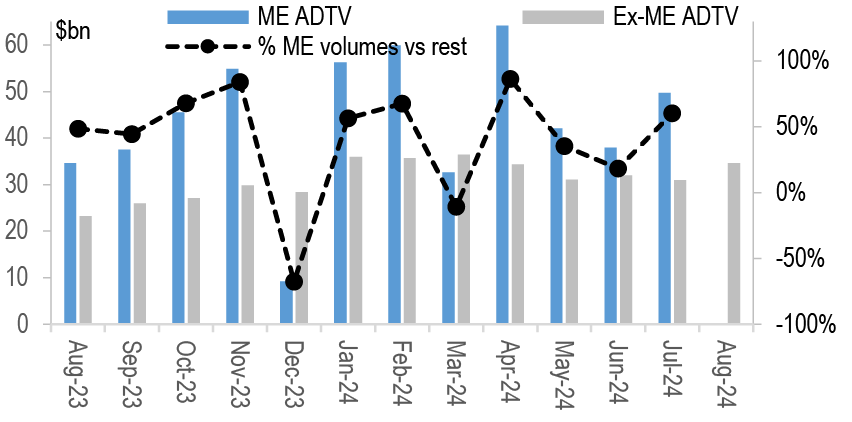
Source: J.P. Morgan, TRACE.
Slowly and steadily Financials are outperforming
It has been two weeks since spreads hit a YTD high of 125bp, after which they have rallied 15bp, closing at 110bp yesterday. An interesting facet of this rally has been the narrowing gap between Financials and Non-Financials. Financials outperformed Non-Financials by 2.6bp over the last two weeks, leaving them trading wider by 8.7bp, the narrowest this gap has been in over 2 years. For context, this gap was 1.6bp wider at 10.4bp at the end of May, when JULI spreads were at a multi-year tight of 99bp, 13bp tighter than today.
US Banks have led the outperformance, tightening 20bp over the past two weeks, outperforming Non-Fins by 6bp on a duration-adjusted basis. US banks now trade flat to Non-Fins for the first time since early March'23, i.e., right before the Regional Banking crisis. Yankee banks also contributed as they tightened by 15bp, outperforming Non-Fins by 2bp (duration-adjusted). Within Non-Financials the biggest spread laggard has been Utilities as they tightened by 10bp, which is 2bp less than the Non-Financials average. The outperformance of Financials has been led by the short and intermediate parts of the curve which have seen 4-5bp of compression, while the 30yr Fins/Non-Fins gap has remained stable through this period. A possible cause for the underperformance of Non-Financials has been the disproportionately higher supply recently. While Financial supply is typically light in August, this has been especially evident this month. MTD, 90% of the supply has come from Non-Financials, which compares with the past 4-year average of 67% (ex-2020). September supply has historically been more balanced between Financials and Non-Financials, so perhaps the recent outperformance trend will pause next month. As well, if our supply forecasts prove correct, 44% of the remaining supply YTD will come from Financials, which is up from 38% YTD – so supply trends beyond September may also limit further compression in this relationship.
Figure 126: Financials have outperformed Non-Financials in the recent rally, narrowing the spread pickup to a 2y low
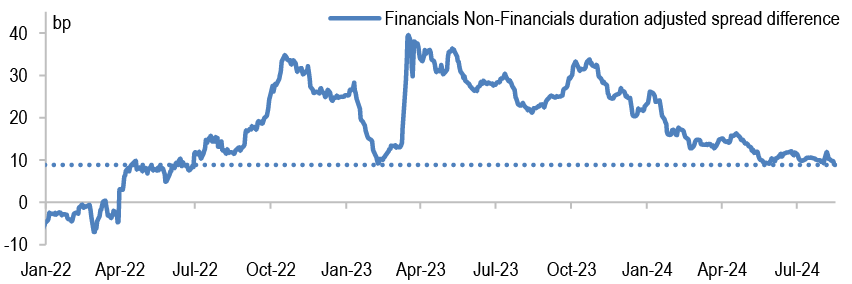
Source: J.P. Morgan.
Figure 127: US banks now trade flat to non-Financials for the first time since just before the Regional Banking crisis

Source: J.P. Morgan.
Figure 128: US Banks led the outperformance among Financials while Utilities has been the laggard among Non-Financials
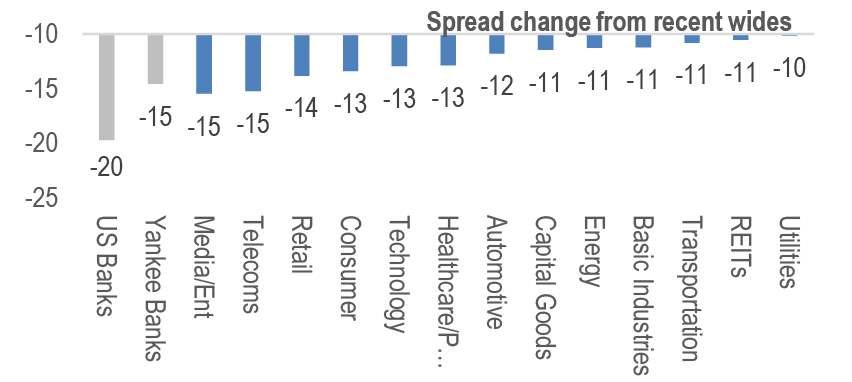
Source: J.P. Morgan.
Little correlation between rates and spreads in the recent rally, now a period of no data and supply
MTD there has been almost no correlation between UST yields and HG bond spreads. Spreads ended Wednesday at 111bp, just 1bp above the 15bp range (110-125bp) MTD, while UST 10yr yields ended in the middle of their 20bp (3.79-3.99%) over the same time period. Dealers ended with positions estimated at the lower end of their 3m range even as $103bn of supply came to market – evidence of strong demand. This is a reminder that the ‘yield buyer’ story is not so simple as there are more buyers at higher yields and fewer at lower yields. The JULI yield on Wednesday closed at 5.07%, a YTD low, and yet spreads are 14bp below the YTD peak. The outperformance of spreads vs. rates MTD is logical, as for spreads the question is really whether the data support a recession call or not. With the data recently not supportive of this call, the technicals take over and push spreads tighter. For rates there are arguably many more factors driving pricing, including inflation, supply, fiscal deficit, Fed timing, etc. Market behavior over the next week will be interesting as it will play out in a relative black hole of data, with few important economic data releases, few corporate earnings reports and no HG bond supply (with exceptions; NVDA reports on 8/28). This will be an interesting test given the low levels of yields coming into this period and the expectation that supply in September will be active, as is usually the case, which are potential negative drivers. On the other side, the strong demand as discussed above, with light primary issuance, is a positive driver of spreads over the next two weeks.
Figure 129: Little correlation between rates and spreads in August
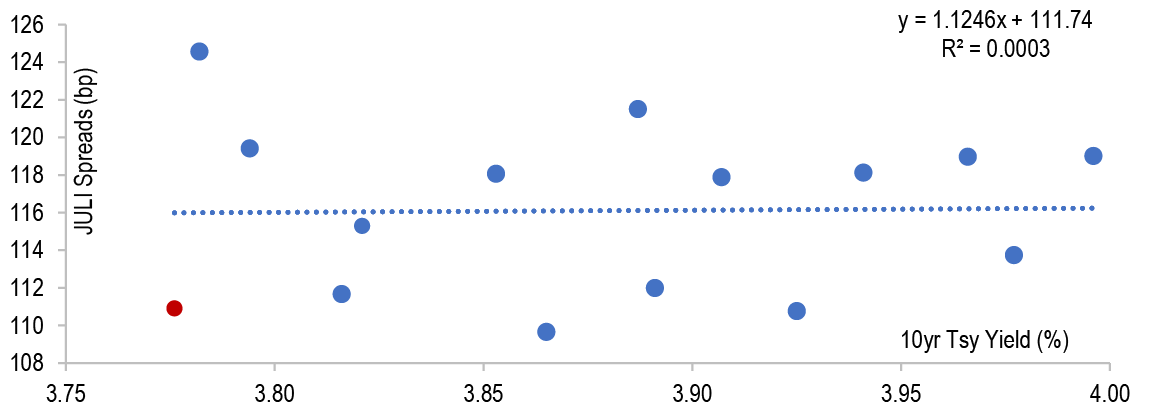
Source: J.P. Morgan.
When in doubt, buy the dip in HG credit – 70% of the time, it works every time
HG spreads have staged a rapid comeback from the wides of 125bp last Monday, now tighter by 10 bp to 115 bp and just 5 bp wide from where spreads closed the day on FOMC day July 31st prior to the selloff. In recent conversations with market participants, there has been some degree of skepticism as to the durability of this ongoing rally in spreads. There are good arguments on both sides, but a statistical analysis of moderate to major selloffs since the inception of our JULI index in 2000 seems to indicate that buying the dip in spreads has been the correct trade 70% of the time in the short term. For the purposes of this thought exercise, we define a ‘selloff’ as a point at which spreads hit a 3m wide looking back and that point subsequently remained the widest point for spreads over the following 1 month. As well, we restrict the definition to only points at which the peak spread was at least 15bp wider than the tightest spread over the prior 3-month period. To state the obvious, this type of model can only be used to analyze past data and not as an ongoing trading strategy as one wouldn’t know in the midst of a selloff what the wide point actually is until it is firmly in the rearview mirror, but the takeaways are still instructive. By this definition, we capture 37 moderate to major selloffs since 2000, with the most recent one being the 25 bp widening to 175 bp during the regional banking crisis in March 2023 (the current selloff wouldn’t be captured by this model until at least 1 month past the recent peak).
Figure 130: There have been 37 moderate to major HG selloffs since 2000
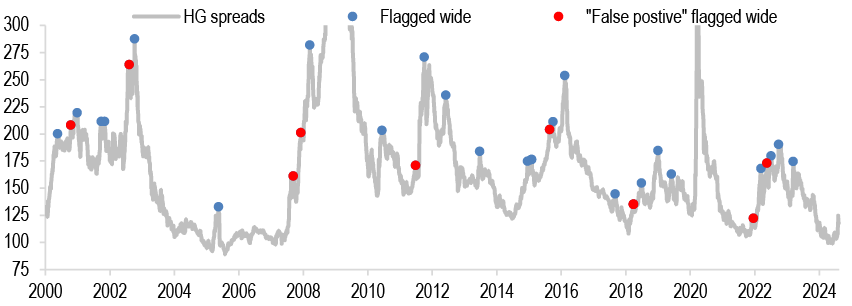
Source: J.P. Morgan
To look for where this model didn’t work, we extend the forward window from 1 month to 3 months. Of these 37 instances when spreads widened materially and subsequently rallied over the next 1 month, in just 11 instances, or 30% of the time, an even bigger selloff followed within 3 months in which spreads widened by at least 5bps more than the prior identified selloff wides (points marked in red). The most recent example of this was in May 2022, when spreads initially widened 23bps to 173 bp only to rally and then sell off once again to 180bp in July 2022 after the market mispriced Fed hiking expectations. Across all these ‘false positive’ cases, the average wider wide over that next 3m period was 25 bp wider than the initial flagged wides (we note that in a few select cases the ultimate wide in the subsequent selloff was slightly beyond the 3m look-forward window).
In the instances when this model did work (70% of the time), if one bought the widest point, the subsequent tight over the following 3 months was on average 46bp tighter. The most recent example of this scenario was again in March 2023, when the wide was 175bp and the subsequent tight within 3 months was 150bp. Below, we categorize these selloff events by year, and it’s interesting to note that there have been only 3 years with more ‘false positives’ than not (2007, 2018 and 2021). Also, for 10 of the 23 years, there was only one major/moderate selloff per year as per our definition.
Time will tell over the next 3 months in which category the current selloff will end up, but historically speaking it seems relatively clear that most dips in HG are meant to be bought in the short term. That said, it’s also quite clear from the chart above that this analysis and its conclusions are not necessarily indicative of the broader direction of spreads longer term.
Figure 131: Annual history of identified selloffs and subsequent retracements
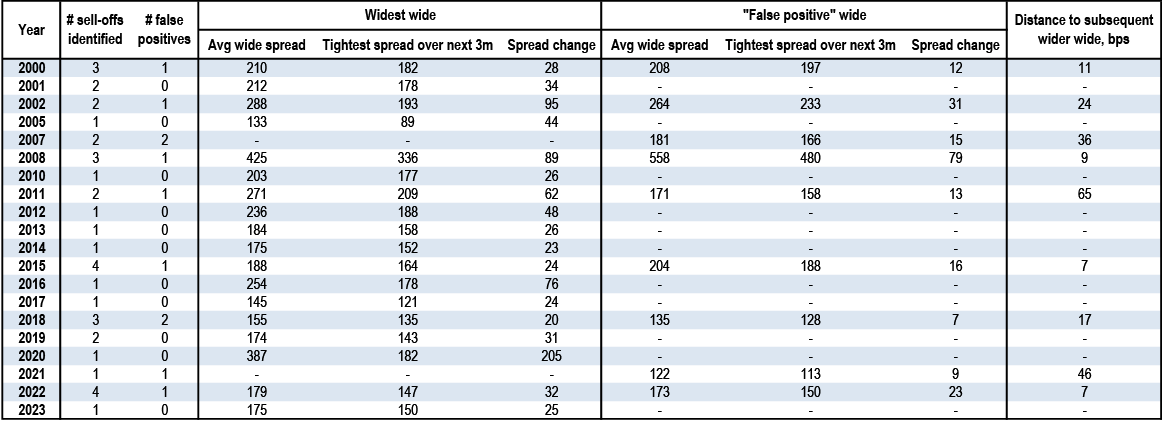
Source: J.P. Morgan.
If UST 30yr yields are heading lower then the 10s30s spread curve should steepen further
Spread curves have flattened significantly over the last few days from their recent peaks, but the 10s30s curve has been a notable laggard in this ongoing rally. While 3s5s and 5s10s curve are 2-3bp flatter WoW, 10s30s is nearly unchanged and remains at 21bp, which is 82% of its YTD range. This, however, makes sense in the context of the broader move lower in yields. 30y UST yields are currently at 4.2%, or ~40bp lower over the last 3 months. Over this period, the 10s30s Non-Fins spread curve has steepened 3bp from 18bp to 21bp currently. So where to from here, if indeed the Fed embarks on a cutting cycle and the UST 30yr tracks towards JPM YE 24 forecast of 3.90%? Looking at the recent past as a guide, in 1H23, when UST 30yr yields were on average ~3.75% or 40 bps lower than the current yield, the 10s30s curve averaged ~27bp with a range of 22-32bp.
Figure 132: Over time, there tends to be an inverse relationship between UST 30yr yield levels and the 10s30s spread curve
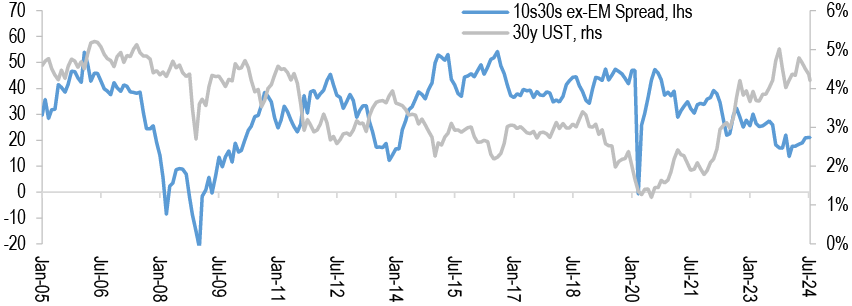
Source: J.P. Morgan
Another approach is to run a longer-term regression of the 10s30s spread curve (monthly over the past 20 years for which we have data) on UST 30yr yields and the overall JULI spread. This regression gives a similar result to the first approach as it currently shows that the curve is 12bp too flat and should be at 33bp (chart below). Yet another way to look at this is by bucketing 30y treasury yields over this same extended period of time (in 50bp increments), which shows the 10s30s spread curve has historically averaged 35bps when 30y treasury yields are between 4% and 4.5% (second chart below). The clear conclusion from all of the above is that lower UST yields equate to steeper 10s30s spread curves and the current starting point is quite flat relative to historical norms.
Why the 10s30s spread curve is so flat is a topic of much debate, but one potential factor is the relative dearth of long-end supply in recent years. This trend, however, is reversing, with long-end supply in 2024 at 17% of the total, on track to be a 3-year high. This is especially true MTD with the share of 30yr supply at 23% so far, the highest in 16 months. Whether or not we get lower UST 30yr yields in the weeks ahead is clearly a function of the upcoming inflation and especially labor data, but if we do, then the 10s30s spread curve has room to steepen from current levels.
Figure 133: A regression approach also suggests 10s30s too flat
Shaded areas are where UST 30yr = 4-5%
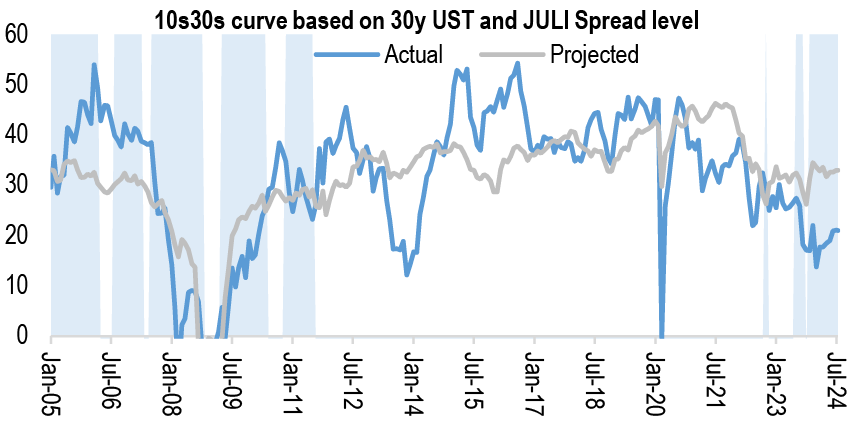
Source: J.P. Morgan
Figure 134: 10s30s has historically averaged 35bp when UST 30yr near current levels
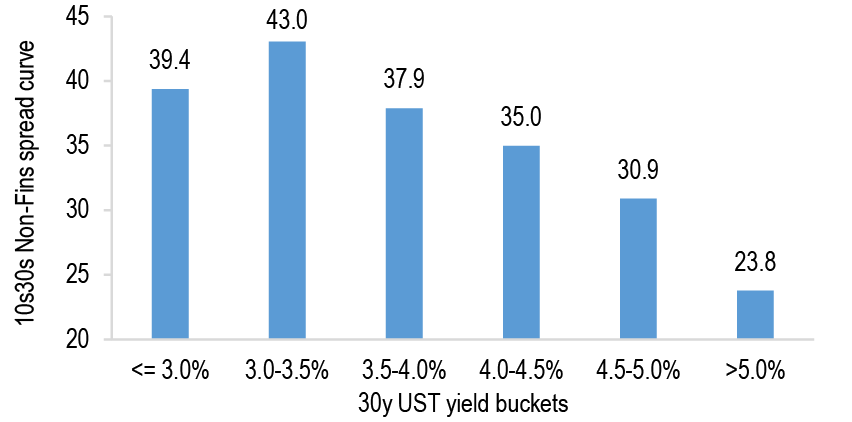
Source: J.P. Morgan
No correlation between Japan equity volatility and Japan demand for US HG
On August 5th the Nikkei 225 equity index in Japan fell 12.4% as investors grew concerned around the possibility of a great carry trade unwind. This selloff spurred many inquiries from US investors as to the potential for Japanese investors to pare down their cross-currency exposures in US credit, which, given that they own 4-5% of the US IG market, has the potential to be a market-moving event. As such, it’s worth analyzing the aftermath to better understand their behavior.
We have written repeatedly in recent months (most recently here and here) about how JPY rate and FX gyrations shouldn’t necessarily have negative implications for their US HG demand, and indeed last week demonstrated this again as overnight net buying actually rose materially to $323mn/day last week, up 47% versus the YTD pace. There wasn’t a single day of net selling last week, and in fact Tuesday night was the largest net buying day since July 5th (this TRACE dataset includes other Asia-based investors, but we believe Japan is the primary driver nowadays). What explains this in our view is simply that the relative value proposition of US HG to Japanese investors was largely unaffected by the equity volatility, and if anything it improved as this volatility drove JGB yields lower on the week (see Foreign Demand Monitor highlights, below, for more details). Most importantly, despite the slight dovish shift in BoJ rhetoric amidst the volatility last week, the thesis for policy convergence between the BoJ and the Fed remains intact, and as such the FX forward markets are still suggesting hedging costs will fall substantially from here (from 5.4% today to 3.77% in 9m from now, see chart below), which in turn should keep demand from Japan elevated in the coming months.
Figure 135: The USD HG yield pickup for JPY investors was largely unaffected by Japan equity
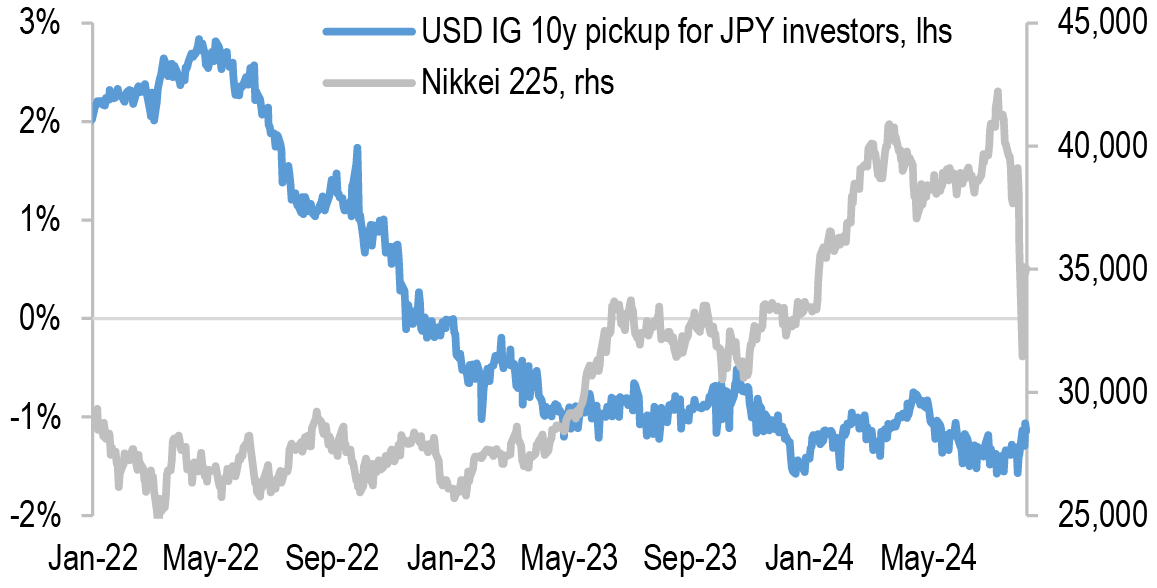
Source: J.P. Morgan, Bloomberg Finance L.P.
Figure 136: JPY hedging costs still on track to fall substantially in the coming months
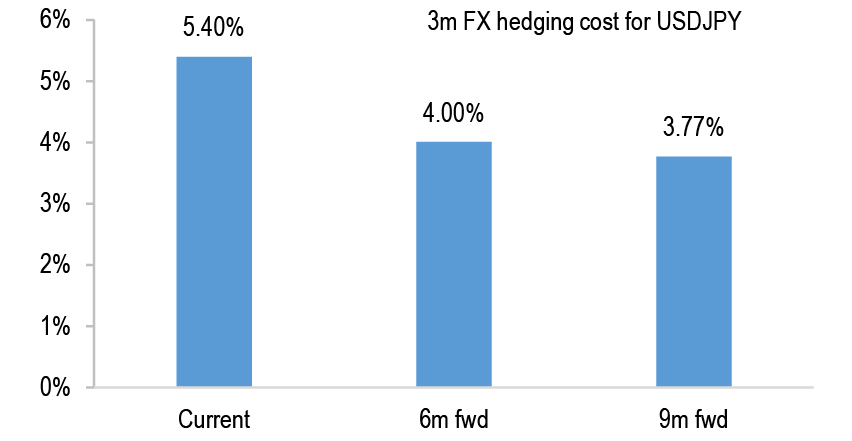
Source: J.P. Morgan, Bloomberg Finance L.P.
There are also some additional observations to be drawn from the overnight flows recently: About half of the net buying was focused in the 5-10y part of the curve, about 9% more than the YTD average. This seems to have been part of an extension trade as 1-5yr net buying was also substantially below average by a similar magnitude (9% below the YTD average). Also, buying was centered around higher-quality Bank names. While there was no sector that saw net selling, among Non-Financials, Healthcare/Pharma and Media/Entertainment (led by META) saw notable two-way flows.
Figure 137: Overnight buying last week suggests an extension trade is under way
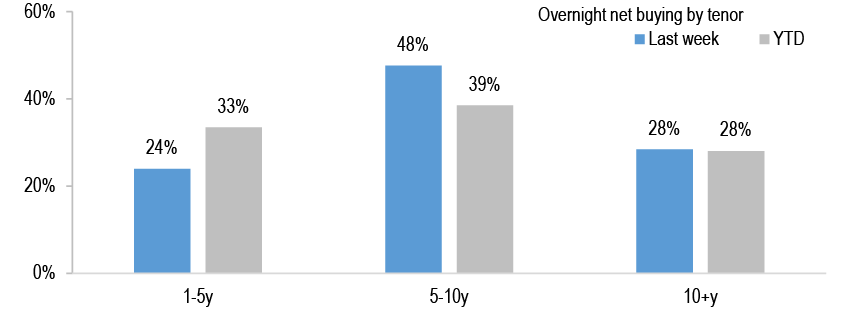
Source: J.P. Morgan
This report was excerpted from Credit Market Outlook Strategy: Holding pattern, Eric Beinstein.
High Yield
- High-yield bond yields are at a low since August 2022 and spreads are 60bp inside early August’s high amid a Goldilocks narrative of growth without inflation. High-yield bond yields and spreads decreased 12bp and 5bp over the past week to 7.53% and 364bp, respectively, which are 18bp lower and 1bp higher in August. And high-yield bond spreads of 364bp are now well inside the August wide of 424bp, whereas yields (7.53%) too are 48bp below August 5th’s high. And tightening 52bp, 59bp, 63bp off the wide, BB spreads are tighter by 3bp while B and CCC spreads are now wider by 9bp and 33bp in August, respectively. The HY index is up +1.21% in August which boosts 2024’s gain to +6.11%. Meanwhile, August high-yield issuance totals $18.1bn ($6.2bn ex-refi). And HY new-issue volume totaling $203.1bn ($44.3bn non-refi) year-to-date compares with $110.3bn ($40.2bn ex-refi) of issuance YTD23.
- Leveraged loans are providing carry-like gains in August (+0.44%) and the % of loans trading above Par has recovered to 42% amid improving growth sentiment, moderating retail outflows ($319mn vs -$3.8BN prior two weeks), robust CLO origination ($13bn ex-refi/resets MTD), and the lightest capital market activity of 2024 ($25bn August). Leveraged loan yields and spreads (to 3yr) decreased 12bp and 3bp over the past week to 8.33% and 479bp, which are 23bp lower and 4bp higher in August, respectively. And leveraged loans are up +0.4% in August which has YTD gains at +5.8%. Meanwhile, August issuance is at a YTD low $25.8bn ($9.0bn ex refi/repricing). Year-to-date, institutional loan issuance totals $811bn which includes $433bn of repricing (53%), $285bn of refinancing (35%), and $93bn of non-refi/repricing (12%).
- The ratings profile for the HY bond index is near its most benign level on record. In 2024, the universe of BBs has expanded by 420bp versus a 440bp contraction in Single Bs and a modest 20bp expansion in CCCs.As such, 50% of the HY index is now BB, 37% Single B, and 13% CCC.Notably, BBs are now 374bp below the historic peak (54%) in June 2021, albeit remain 966bp above the long-term average weighting (40%). As well, the weighting of CCCs in the HY index is 158bp above the historic low in January 2023 albeit remain 451bp below the long-term average (18%). And even one notch above CCC, 11.0% of the HY bond market is rated B3 and 9.5% rated B- which is running 357bp and 231bp below the long-term average, respectively. Conversely, the ratings mix for the loan universe is considerably weaker versus bonds due to more aggressive capital markets and a historic downgrade wave. Specifically, 23% of the Loan index is BB, 66% Single B, and 7% CCC with the balance (4%) NR.As such the universe of Single B loans is near its historic high whereas the % of BBs are at a historic low. And one notch below CCC, 16.4% and 23.3% of Loans are rated B3/B- which is at or near a historic peak. Notably, the 28.2% of the loan market rated B- or lower is at a historic high and almost double where it stood pre-pandemic.
Credit Strategy Weekly Update
High-yield bond yields are at a low since August 2022 and spreads are 60bp inside early August’s high amid a Goldilocks narrative of growth without inflation. The real-time indicators of US GDP growth have improved since the weak payroll report, and the inflation data has moderated enough to warrant a Fed rate cut in September. Meanwhile, capital market activity has stalled until post Labor Day whereas retail inflows totaling $1.9BN over the past week recouped most of the exodus over the preceding two weeks. And 2Q earnings managed to match elevated consensus. High-yield bond yields and spreads decreased 12bp and 5bp over the past week to 7.53% and 364bp, respectively, which are 18bp lower and 1bp higher in August.And high-yield bond spreads of 364bp are now well inside the August wide of 424bp, whereas yields (7.53%) too are 48bp below August 5th’s high. Yields are now at a low since August 2022. And tightening 52bp, 59bp, 63bp off the wide, BB spreads are tighter by 3bp while B and CCC spreads are now wider by 9bp and 33bp in August, respectively.The HY index is up +1.21% in August with CCCs (+1.30%) outperforming BBs (+1.25%) and Single Bs (+1.09%). And from a sectoral basis there is dispersion with Telecom (+4.25%) and Technology (+1.66%) outperforming and Autos (+0.26%) and Media (+0.34%) lagging.
High-yield bond yields are at a low since August 2022 and spreads are 60bp below early August’s high
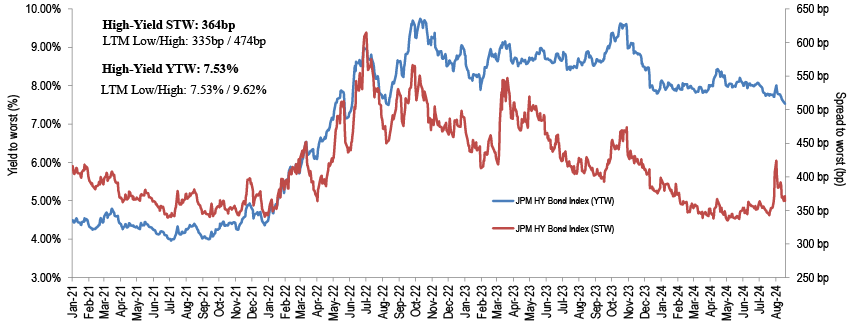
Source: J.P. Morgan.
By rating, BB bond yields are now 6.12% (-11bp w/w), B yields are 7.43% (-14bp w/w) and CCC yields are 12.97% (-16bp w/w). And BB spreads are now 224bp (-4bp w/w, -15bp YTD), B spreads are 353bp (-7bp w/w, -14bp YTD), and CCC spreads are 908bp (-9bp w/w, +36bp YTD). HY/IG spreads of 266bp (-4bp w/w, -6bp YTD) are now 9bp below their 12M average, while BBB/BB spreads of 103bp (-3bp w/w, -6bp YTD) are 9bp below the 12M average and 16bp above their low since April 2019. And the HY index is providing a +6.11% gain in 2024 with CCCs (+8.99%) outperforming Single Bs (+5.81%) and BBs (+5.51%). Industries outperforming year-to-date include Healthcare (+9.67%) and Autos (+8.90%) and underperforming are Cable/Sat. (+0.67%) and Media (+1.85%). Meanwhile, one deal priced this week for $300mn which has August high-yield issuance at $18.1bn ($6.2bn ex-refi). HY new-issue volume totaling $203.1bn ($44.3bn non-refi) year-to-date compares with $110.3bn ($40.2bn ex-refi) of issuance YTD23.
High-yield issuance totaling $18.1bn in August boosts year-to-date volume to $203bn
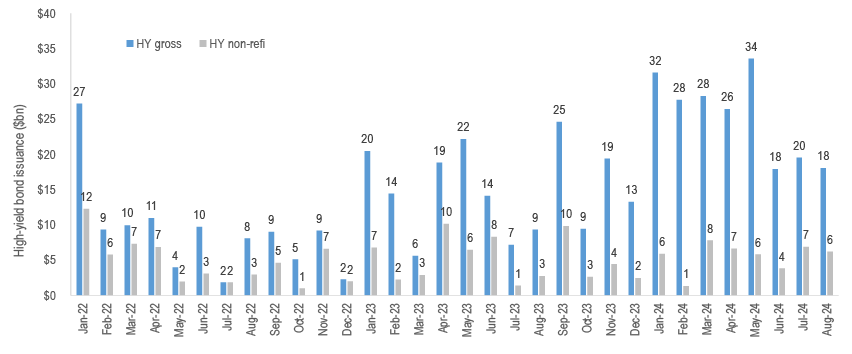
Source: J.P. Morgan.
Leveraged loans are underperforming high-yield bonds for a fourth consecutive month in August
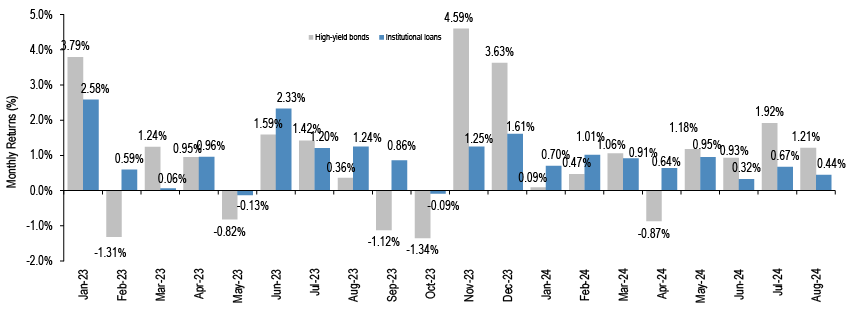
Source: J.P. Morgan.
Leveraged loans are providing carry-like gains in August (+0.44%) and the % of loans trading above Par has recovered to 42% amid improving growth sentiment, moderating retail outflows ($319mn vs -$3.8BN prior two weeks), robust CLO origination ($13bn ex-refi/resets MTD), and the lightest capital market activity of 2024 ($25bn August). Loan prices increased $0.00 over the past week to $96.83 (or +$0.08 ex-McAfee) with Ba1/Ba2/Ba3 prices rising $0.08 to $99.75, B1 prices increasing $0.12 to $99.17, B2 prices increasing $0.26 to $98.56, B3 prices rising $0.03 to $95.72, and Caa1/Caa2/Caa3 prices decreasing $0.32 to $79.18. Leveraged loan prices are down $0.23 in August after recovering $0.48 off the 8/5 low of $96.35. Leveraged loan yields and spreads (to 3yr) decreased 12bp and 3bp over the past week to 8.33% and 479bp, which are 23bp lower and 4bp higher in August, respectively. Leveraged loan spreads (3yr) of 479bp compares to a 52-week low and high of 469bp and 573bp, respectively. And the yield-to-3yr for the leveraged loan index of 8.33% is now 80bp above the HY bond index (7.53%), which is comparable to an average 108bp above over the past year.Meanwhile, the sub-$80, $80-$89.99, $90-$94.99, $95-$97.99, $98-$98.99, $99-$99.99, and $100+ buckets for Loans are now at 2.66%, 4.08%, 5.19%, 8.38%, 5.78%, 31.56%, and 42.35%—the % of leveraged loans trading above Par is 22% below its high in mid-May.
The % of loans trading above par has recovered to 42%
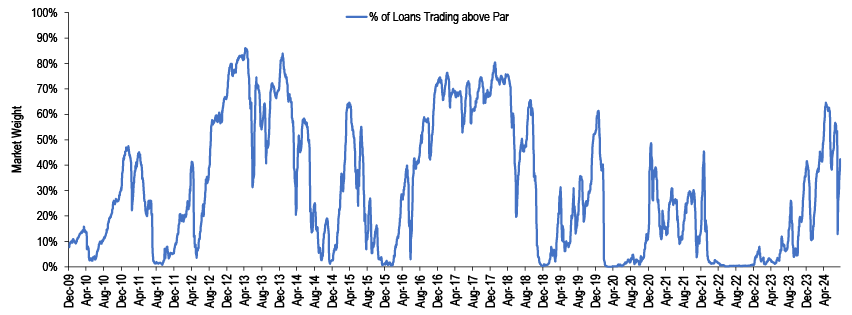
Source: J.P. Morgan.; S&P/IHS Markit
The Leveraged Loan index is providing a gain of +0.44% in August which is underperforming bonds by 77bp for a fourth consecutive month. And from a sectoral basis there is little dispersion with Telecom (+1.90%) and Metals/Mining (+0.58%) outperforming and Food/Beverages (-0.05%) and Broadcasting (+0.10%) lagging. The Leveraged Loan index is providing a +5.79% gain in 2024.YTD, Moody’s rated BB, B1, B2, B3, and CCC-rated loans are returning +5.20%, +5.74%, +5.38%, +6.17%, and +9.82%, respectively. Industries outperforming year-to-date include Telecom (+8.39%) and Utility (+7.74%) and underperforming are Broadcasting (+1.36%) and Cable/Sat. (+3.47%). Meanwhile, CLO volume totals $36.7bn in August ($13.0bn ex-refi/resets) and totals $124.9bn ($280.6bn gross) YTD. August issuance is at a YTD low $25.8bn ($9.0bn ex refi/repricing).As such, year-to-date, institutional loan issuance totals $811bn which includes $433bn of repricing (53%), $285bn of refinancing (35%), and $93bn of non-refi/repricing (12%).
Institutional loan issuance totals a YTD low $25bn in August
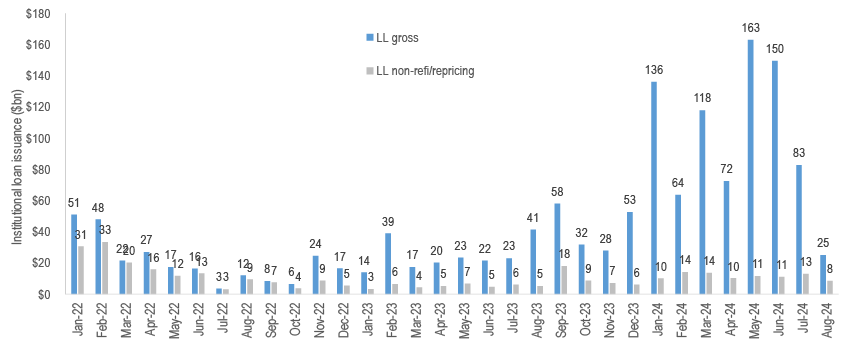
Source: J.P. Morgan.
This report was excerpted from, Credit Strategy Weekly Update, Nelson Jantzen, August 23rd, 2024
CLO
Supply and Liquidity Trends
- Eight months into the year and there’s been a record pace of gross ($279bn) and new ($125bn) US CLO supply fueled by strong market technicals and demand. However, the primary market has begun to slow over the last few months though remaining steady, with $12bn of new supply in August MTD and $13bn in July. We anticipate that there will be a strain on new issuance over the coming months given challenging loan sourcing, rising recession risks, and Fed rate cuts, and spreads could soften as investors proceed with caution around market volatility (link). The pace of refis/resets has picked up, but YTD issuance of $154bn hasn’t quite surpassed the levels seen in 2021 ($161bn YTD).
- In 2024 YTD, there have been 111 US managers that have issued at least one new issue deal, of which 74% have been active in the BSL primary market, 14% in the PCLO primary market, 11% both BSL/PCLO, and 2% Infrastructure. There are 14 managers that were active in 2023 and supplied a total of $8.8bn (or 8%) of last year’s supply but have not yet issued this year ( Figure 138). Market activity and AUM continue to grow and there are now 180 US outstanding managers, making it difficult for new managers to enter given that the market has become concentrated despite AAA manager tiering compressing to ~10bp.
- In the European primary market, there has also been a record pace of new supply totaling €33bn YTD. The average deal size has jumped up to €419mm compared to €377mm last year, and there was a European deal for €631mm which is a historical record ( Table 1). The manager base is smaller in Europe, with 70 EUR outstanding managers which can make barriers to entry slightly less difficult. Even so, there have been only 2 debut managers this year compared to 7 debut managers in 2023.
- Given the momentum in refi/reset activity that we have seen, with July being the third heaviest month of all-time ($27bn) and June being the second heaviest ($28bn), we also consider manager trends here. There are 102 US managers that have refi’d/reset a deal this year compared to only 42 last year as volume has picked up considerably from $23bn in 2023FY . In Europe, refi/reset activity of €13bn has been strong but not record-breaking and remains well below the peak of €58bn in 2021FY. There are also 8 US managers and 5 EUR managers that have refi’d/reset a deal for the first time this year ( Table 2).
- US CLO BWIC volumes total $33.8bn YTD which is slightly down y/y (-3%) and compares to $55bn in 2023FY. While CLOs held in through the macro volatility in early August, we saw secondary spreads reprice wider with a variety of buyers emerging. Overall trading volumes were heightened, totaling $1.2bn weekly BWIC volumes the first week (vs $1bn YTD average) and we also observed the 2nd largest IG TRACE day of the year (8/6) at $1.6bn.
Supply and Liquidity Trends
New Issue Supply Trends
Eight months into the year and there’s been a record pace of gross ($279bn) and new ($125bn) US CLO supply fueled by strong market technicals and demand. However, the primary market has begun to slow over the last two months though remaining steady, with $12bn of new supply in August MTD, $13bn in July, and $10bn in June relative to $24bn in May. We anticipate that there will be a strain on new issuance over the coming months given challenging loan sourcing, rising recession risks, and Fed rate cuts, and spreads could soften as investors proceed with caution around market volatility (link). The pace of refis/resets has picked up, but YTD issuance of $154bn hasn’t quite surpassed the levels seen in 2021 ($161bn YTD). Given the focus on supply over the past few months, we dive into manager trends in issuance.
In 2024 YTD, there have been 111 US managers that have issued at least one new issue deal, of which 74% have been active in the BSL primary market, 14% in the PCLO primary market, 11% both BSL/PCLO, and 2% Infrastructure. There are 14 managers that were active in 2023 and supplied a total of $8.8bn (or 8%) of last year’s supply but have not yet issued this year ( Figure 138). On the other hand, there are 15 active managers that did not issue in 2023 but have become active again this year. Market activity and AUM continue to grow and there are now 180 US outstanding managers, making it difficult for new managers to enter given that the market has become concentrated despite AAA manager tiering compressing to ~10bp. So far this year, there has been only 1 debut manager (PCLO) come to the US market this year following 6 debut US managers in 2023.
In the European primary market, there has also been a record pace of new supply totaling €33bn YTD. The average deal size has jumped up to €419mm compared to €377mm last year, and there was a European deal for €631mm which is a historical record ( Table 1). The manager base is smaller in Europe, with 70 EUR outstanding managers which can make barriers to entry slightly less difficult. Even so, there have been only 2 debut managers this year compared to 7 debut managers in 2023.
Figure 138: Historical % of Supply of 2024 YTD Issuing CLO Managers
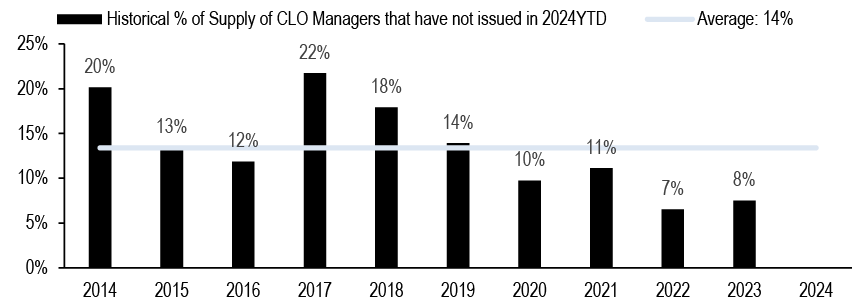
Source: J.P. Morgan. Based on current manager universe after acquisitions/name changes. As of August 20th, 2024.
Refi/Reset Supply Trends
Given the momentum in refi/reset activity that we have seen, with July being the third heaviest month of all-time ($27bn) and June being the second heaviest ($28bn), we also consider manager trends here. There are 102 US managers that have refi’d/reset a deal this year compared to only 42 last year as volume has picked up considerably from $23bn in 2023FY ( Table 2). The average refi/reset supply by US manager is $1.5bn across an average 4 deals. In Europe, refi/reset activity of €13bn has been strong but not record-breaking and remains well below the peak of €58bn in 2021FY. There are 27 managers that have refi’d/reset a deal which is +22 higher than last year. The average supply by manager is €477mm with a max deal size of €503mm. There are also 8 US managers and 5 EUR managers that have refi’d/reset a deal for the first time this year.
Table 1: US BSL and EUR New Issue Supply Stats
US ($mm) and EUR (€mm)

Source: J.P. Morgan. Based on current manager universe after acquisitions/name changes. US includes PC/MM and BSL CLOs. As of August 20th, 2024.
Table 2: US BSL and EUR Refi/Reset Supply Stats
US ($mm) and EUR (€mm)

Source: J.P. Morgan. Based on current manager universe after acquisitions/name changes. Excludes PCLOs. US includes PC/MM and BSL CLOs. As of August 20th, 2024.
Secondary Trading Update
US CLO BWIC volumes total $33.8bn YTD which is slightly down y/y (-3%) and compares to $55bn in 2023FY. While CLOs held in through the macro volatility in August, we saw secondary spreads reprice wider with a variety of buyers emerging. Overall trading volumes were heightened, totaling $1.2bn weekly BWIC volumes the first week (vs $1bn YTD average) and we also observed the 2nd largest IG TRACE day of the year (8/6) at $1.6bn.
US CLO BWIC volumes are typically concentrated in IG (74% of total trading activity) rather than Mezz (16%) and Equity (10%). By tranche, trading activity remains largely concentrated in AAA, accounting for 46% of volumes YTD, which is in line with historicals (avg 44%) even though AAA volumes are trending lower y/y , down -17%. There has been a jump up in YTD BB volumes (+34% y/y), Single-B volumes (+187% y/y) and Equity volumes (+17% y/y). Trading volumes have been muted in 2H24, averaging $166mm per day compared to $224mm in 1H24.
Figure 139: Indicative AAA Bid/Offer Spread

Source: J.P. Morgan. As of July 31st, 2024.
Table 3: 2024 US and European Monthly BWIC Volumes by Original Rating
| 2024 YTD US BWIC Volumes ($mm) | ||||||||
| Month | AAA | AA | A | BBB | BB | B | EQ | Total |
| January | 2,381 | 773 | 188 | 805 | 911 | 76 | 682 | 5,814 |
| February | 2,300 | 672 | 291 | 645 | 453 | 56 | 335 | 4,752 |
| March | 2,812 | 389 | 170 | 199 | 415 | 64 | 359 | 4,408 |
| April | 1,396 | 756 | 193 | 520 | 607 | 67 | 604 | 4,144 |
| May | 1,750 | 646 | 115 | 285 | 849 | 122 | 764 | 4,530 |
| June | 2,226 | 337 | 129 | 459 | 673 | 113 | 271 | 4,209 |
| July | 1,879 | 290 | 309 | 365 | 359 | 40 | 354 | 3,596 |
| August MTD | 947 | 259 | 179 | 260 | 469 | 34 | 194 | 2,341 |
| Total | 15,690 | 4,121 | 1,574 | 3,538 | 4,735 | 573 | 3,563 | 33,793 |
| % by Rating | 46% | 12% | 5% | 10% | 14% | 2% | 11% | 100% |
| 2024 YTD EUR BWIC Volumes (€mm) | ||||||||
| Month | AAA | AA | A | BBB | BB | B | EQ | Total |
| January | 697 | 284 | 76 | 126 | 356 | 120 | 256 | 1,915 |
| February | 415 | 86 | 64 | 253 | 330 | 150 | 236 | 1,534 |
| March | 436 | 189 | 40 | 111 | 249 | 168 | 142 | 1,336 |
| April | 470 | 51 | 81 | 171 | 227 | 141 | 68 | 1,210 |
| May | 256 | 55 | 87 | 72 | 151 | 68 | 160 | 850 |
| June | 607 | 155 | 134 | 143 | 162 | 78 | 37 | 1,318 |
| July | 316 | 115 | 60 | 129 | 119 | 66 | 74 | 879 |
| August MTD | 414 | 65 | 65 | 36 | 51 | 58 | 15 | 704 |
| Total | 3,611 | 1,002 | 607 | 1,040 | 1,647 | 850 | 988 | 9,745 |
| % by Rating | 37% | 10% | 6% | 11% | 17% | 9% | 10% | 100% |
Source: J.P. Morgan. AAA includes JrAAA volumes. 2024 Monthly BWIC Volumes by Original Rating. As of August 20th, 2024.
Municipal Markets Weekly
Fall Muni Buying Opportunity, Historical muni ratio during initial Fed cut, Sector performance during easing cycles, Chicago GO
- Chair Powell’s remarks at Jackson Hole left little doubt that the Fed will soon be cutting rates. Jobless claims, PMIs, and existing home sales data printed in line with consensus expectations. We also received benchmark payrolls revisions and the July FOMC minutes, which both suggested worries have tilted more toward employment risks.
- Chair Powell’s dovish tone supports our forecast for 50bp cuts at each of the next two meetings, but the August employment report is still two weeks away, valuations are no longer cheap, and dealer positioning is elevated, so our rates team stay neutral duration, and hold 5s/30s steepeners to express their core view.
- We expect tax-exempt net-supply will be a considerable headwind in September (+$8bn) and October (+$15bn) and that absolute yield levels will generally decline as the Fed moves on with the easing cycle. When we consider the expected market cheapening in the fall, coupled with the view that absolute rates will fall over the Fed easing cycle, we conclude that the next two months could offer the best opportunity to buy bonds of the year and possibly the rate cycle.
- Issuance is set to come in around $9.1bn next week, or 1.0x the trailing 5yr average for the equivalent non-jobs reporting week. Expected tax-exempt supply of $9.0bn would be 1.3x the average, while taxable issuance of $145mn would be just 8% the average.
- LSEG Lipper reported municipal fund inflows for the 8th consecutive week (+$501mn), bringing YTD inflows to +$18.9bn (+$12.8bn open-end funds/+$6.1bn ETFs).
- Despite generally strong municipal market performance in easing cycles, historical data indicates munis underperformed Treasuries in the period surrounding each initial rate cut by Fed. On average, in the comparable week over the past six tightening cycles, the 10yr municipal/UST ratio has cheapened by 1.7ppts, while UST yields have rallied by 38bps before the first cut.
- This week, long-end (10-year and longer) Muni/UST ratios have reached their YTD highs, and it will likely remain challenging for munis to outperform Treasuries until the first rate cut next month.
- Given the expected near-term challenging market conditions, we believe investors should be adding duration, especially in long-term 4s, housing, AMT bonds, and idiosyncratic risk.
- Looking at the STDEV of monthly returns over past easing cycles suggests that yield and total return oriented investment constructs would be active in more volatile leasing, special tax, and education (which is 80% Higher-Ed) sector bonds.
- Chicago’s local tax receipts in 1H24 were +6% above budgeted estimates for the period, and +4% higher vs. 1H23 collections, but some economic indicators suggest future pressure. The 2025 budget is expected to be released in the coming weeks, with eyes on what measures will be used to address anticipated gaps.
- We prefer the after-tax total return prospects of deep discount deep discount Chicago GO’s versus 5.5% structure. In a 25bps rally scenario, 4’s of 2044 outperform 5.5% of 2023, by 205-193bps in after-tax return over 1-3yr holding periods.
Cheaper municipal valuations and the expectation for lower absolute rates as the Fed’s easing cycle proceeds could mean that the next couple of months offer the best opportunity to buy bonds of the year and possibly the rate cycle
As we approach what promises to be an eventful fall, we brace for a volatile rates backdrop with outsized market reactions to the release of non-consensus economic data as we approach the expected first rate cut, and against the backdrop of a particularly loud election season. Within the municipal space, generally higher issuance is expected to persist up until the week of the election, with market reception governed by the pace of fund flows and the changeable nature of ETF flows in particular.
We expect tax-exempt net-supply will be a considerable headwind in September (+$8bn) and October (+$15bn) and that absolute yield levels will generally decline as the Fed moves on with the easing cycle. When we consider the expected market cheapening in the fall, coupled with the view that absolute rates will fall over the Fed easing cycle, we conclude that the next two months could offer the best opportunity to buy bonds of the year and possibly the rate cycle.
Figure 140: We expect net supply will be a considerable headwind over the next two months, before easing in November and December
Net supply, $bn
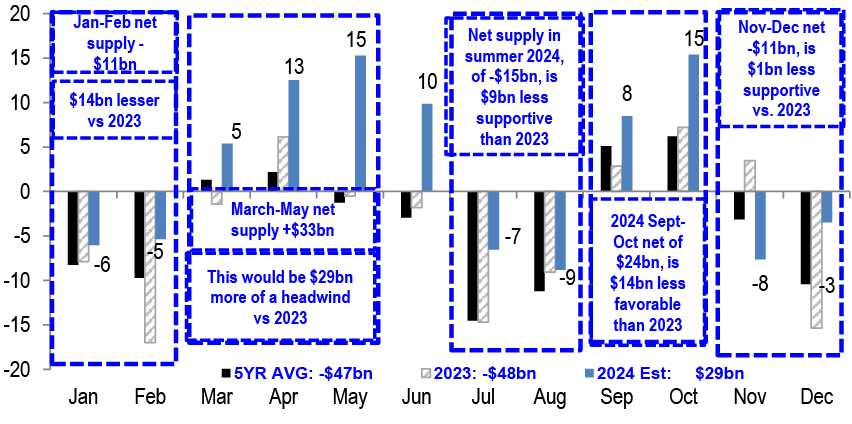
Source: Bloomberg Finance L.P., J.P. Morgan. Note: tax-exempt bonds only.
The HG municipal scale was bumped by 2-5bps across the curve today, as Treasuries rallied 4-10bps on Chair Powell’s remarks at the Jackson Hole forum. With these moves, HG muni yields ended the week down by 13-12-2-2bps in 2-5-10-30yrs, respectively, but still lagged Treasuries by 2-0-7-3bps in 2-5-10-30yrs, respectively.
Figure 141: HG muni yields ended the week down by 13-12-2-2bps in 2-5-10-30yrs, respectively, but still lagged Treasuries by 2-0-7-3bps in 2-5-10-30yrs, respectively.
WTD yield change, bps

Source: Refinitiv, ICE, J.P. Morgan. Note: as of 8/22/2024
Next week, tax-exempt supply is estimated at ~$9bn (1.3x the 5yr avg for the week), largely continuing the elevated pace of primary market volume seen since May, against a backdrop of broadly supportive fund flows (LSEG inflows for 8 consecutive weeks), somewhat better dealer positions (although still heavy), and lighter late summer attendance. Looking beyond August, we see continued opportunities to buy bonds in the fall, given the prospect of weaker pre-election related municipal market technicals.
Figure 142: Investors will continue to allocate mid-August reinvestment next week, which should be supportive of performance given some stability in the UST market
| Period | Redemption and Coupon Payments ($bn) | Tax-Exempt Supply ($bns) | 10yr UST Yield Change (bps) | Fund Flow ($bn) | 10Yr Ratio Change (%) | IG Muni Total Return (%) |
| May 1-14 | 17 | 18 | -24 | 0.5 | 1.4% | 1.1% |
| May 15-31 | 11 | 24 | 7 | -0.3 | 7.5% | -1.3% |
| June 1-15 | 20 | 23 | -30 | 0.7 | -2.7% | 1.8% |
| June 16-30 | 9 | 21 | 27 | -0.4 | -2.1% | -0.2% |
| July 1-14 | 28 | 11 | -25 | 1.1 | 2.1% | 0.6% |
| July 15-30 | 7 | 24 | 3 | 1.7 | -0.4% | 0.3% |
| August 1-15 | 27 | 24 | -18 | 1.4 | 0.3% | 0.7% |
| August 16-31 | 15 | 18 | -6 | 0.6 | 1.2% | 0.04% |
| September 1-14 | 17 | 17 | ||||
| September 15-30 | 5 | 19 | ||||
| October 1-14 | 20 | 21 | ||||
| October 15-30 | 4 | 23 |
Source: Refinitiv, LSEG Lipper, Bloomberg Finance L.P., J.P. Morgan. As of 8/22/2024.Note: The above does not include reinvestment capital from current calls.
Through Thursday, tax-exempt bidwanted volume reflected a well funded market as offerings were down 17% in aggregate versus the five-week average. Bonds for sale were down 19-28% in 5yrs and longer on the curve, while offers were up 4% in 0-5yrs on the curve. With the the heavy primary calendar and lighter summer staffing, secondary purchases were down 5% on the week, while up a modest 3% in 5-10yrs, and falling 5-9% throughout the rest of the market.
As noted in our morning intelligence report on Thursday, based on a 21% tax rate, the taxable equivalent yield for 30yr AA 4% tax-exempts provides a 44bps spread pickup over similar structure corporates, and the widest since December of 2023 (50bps).
Spread, bps

Source: ICE, J.P. Morgan
Note: As of 8/22/2024
Yield and Spread Charts
In July, AAA HG muni yields ended the month down by 26-14-2-4bps in 2-5-10-30yrs, underperforming Treasuries by 12-19-22-9bps in the 2-5-10-30yrs, respectively. MTD AAA HG muni yields are lower by 40-33-13-11bps in 2-5-10-30yrs, but lag Treasuries by 2-2-17-16bps in 2-5-10-30yrs, respectively. Absolute yields continue to look attractive in the context of the trading range over the past three years and our longer-term projections for lower rates this year.
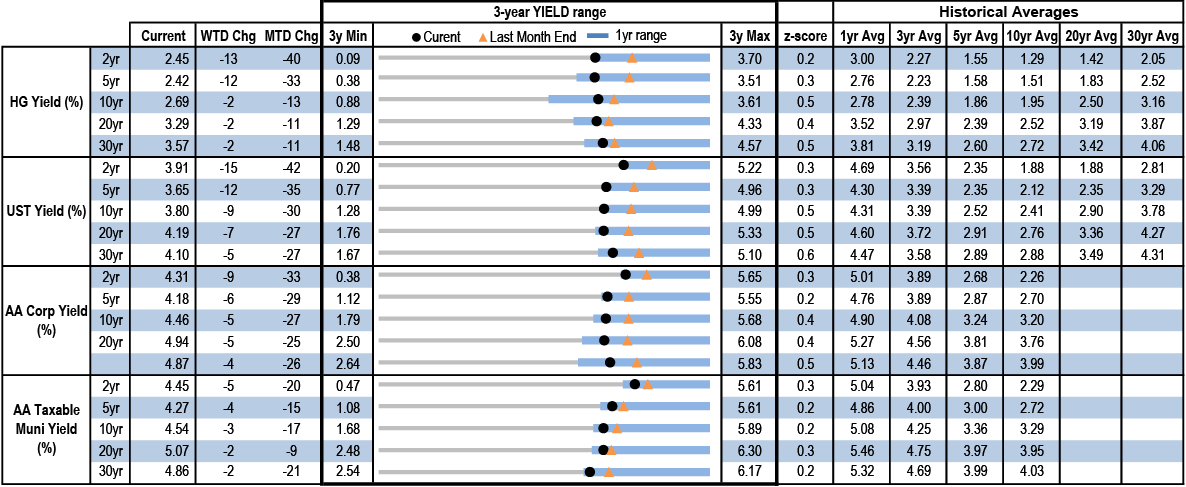
Source: Refinitiv, ICE, J.P. Morgan. Note: HG muni and UST yields as of 3pm 8/23/2024, other data as of 8/22/2024
In July, 5-10-30yr IG municipal ratios cheapened by 2-3%, save for the 2yr spot, which was flat. MTD ratios are cheaper by another 2-3ppts in 10-30yrs, while richer by 3ppts in 2-5yrs spots thus far this month. While we expect cheaper ratios in the fall, current levels on tax-exempts represent value versus taxable municipals and corporates in most areas of the curve versus 1-3-5-10yr average ratios. Ratios on 30yr AA tax-exempts closest to the cheaper end of the range versus taxable alternatives.
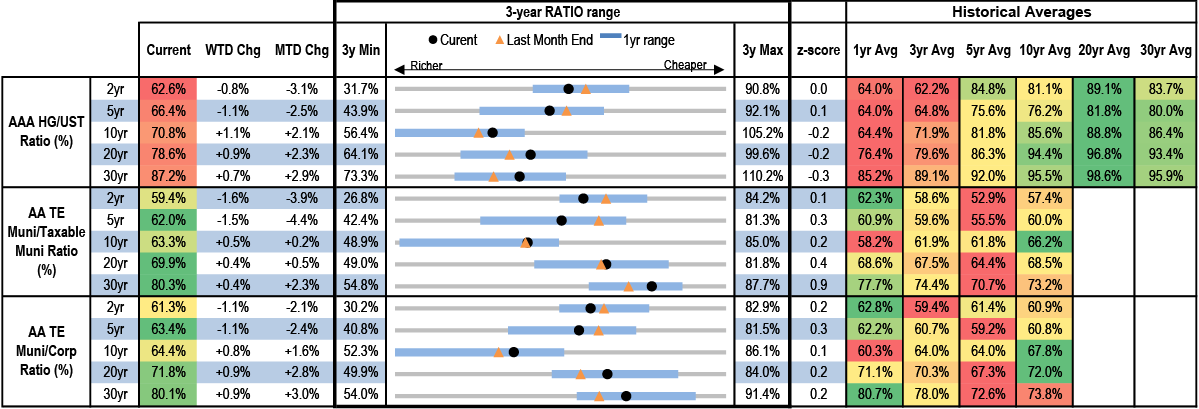
Source: Refinitiv, ICE, J.P. Morgan. Note: conditional formatting is based on current value and historical averages. Red indicates rich and green indicates cheapNote: HG/UST ratios as of 3pm 8/23/2024, other data as of 8/22/2024
Based on a 21% tax rate, the taxable equivalent yield for 30yr AA 4% tax-exempts provides44bps of spread pickup over similar structure corporates. 30yr AA taxable munis also only offer modest spread versus similar structure US Corporates.
Figure 143: Based on a 21% tax rate, the taxable equivalent yield for 30yr AA 4% tax-exempts provides a pick-up over similar structure corporates

Source: ICE, J.P. Morgan. As of 8/22/2024
Taxable municipal market spreads to corporates have narrowed considerably in 2024. 30yr AA taxable and A rated taxable munis offer modest spread versus similar structure US Corporates. The yield on 30yr AA taxable municipals (4.86%) has rallied since October but remains high relative to most periods over the past ten years.
Figure 144: The yield on 30yr AA taxable municipals has rallied since October, but remains high relative to most periods over the past ten years
Yield, %

Spread, bps

Source: ICE, J.P. Morgan
Note: As of 8/22/2024
Economic data flow was light this week, instead headlined by Chair Powell’s remarks at Jackson Hole, which left little room for doubt that the Fed will soon be cutting rates
The section below contains excerpts from J.P. Morgan’s Daily Economic Briefings (latest here) and our economists’ commentary linked herein.
Chair Powell’s remarks at the Jackson Hole forum overall leaned a little dovish, as he stressed the FOMC’s attentiveness to labor market conditions. After the remarks, our economists continue to look for the Fed to start off the easing cycle with a 50bp cut next month, though that will depend in part on the August jobs report. As Powell noted, “The current level of our policy rate gives us ample room to respond to any risks we may face, including the risk of unwelcome further weakening in labor market conditions.” If the August jobs report validates the July weakness then we believe they should quickly make use of that ample room (Cuts are coming, Michael Feroli, 8/23/24)
Earlier this week, jobless claims, PMIs, and existing home sales data printed in line with consensus expectations. We also received benchmark payrolls revisions and the July FOMC minutes this week, which both suggested worries have tilted more toward employment risks. These reports are summarized below:
- The benchmark revision reduced the March 2024 level of nonfarm payrolls by 818k—the largest revision (upward or downward) since 2009. These data suggest that job growth averaged around 170-180k per month over the year through March versus the previously reported average of 242k (Benchmark brings big downward revision to (lagged) jobs, Abiel Reinhart, 8/21/24).
- The July FOMC meeting minutes confirmed that a September rate cut was likely even before recent signs of labor market weakness. Prior to the release of the weak July jobs report, the “vast majority” of committee members already held the view that if data continue to come in as expected the FOMC will be on track to begin easing at the next meeting. “Several” committee members even saw a case for cutting rates in July. On the balance of risks, a “majority” thought “risks to the employment goal had increased” and “many” thought inflation risks had decreased (July FOMC minutes highlighted labor market risks, Abiel Reinhart, 8/21/24).
- Existing homes sales rose 1.3% in July, in line with expectations, remaining near their cycle lows as low affordability and inventory continue to weigh on sales. Lower mortgage rates could stimulate sales later this year, but there’s no sign of that so far in the weekly mortgage purchase applications data (Existing home sales still stuck on the floor, Abiel Reinhart, 8/22/24).
- Initial claims rose just slightly to 232k in the latest weekly read, in line with expectations, and the four-week average has stayed within a narrow range since June. Continuing claims also ticked up slightly, but the four-week average is showing signs of leveling off after its May-June increase. Overall, claims data at least are not suggesting another step down for job growth in August (Good news from mostly stable jobless claims, Abiel Reinhart, 8/22/24).
- The US all-industry flash PMI for August (54.1) was basically unchanged from July (54.3) in a sign of stability for the growth picture, although there were a couple of negatives in the latest data. In particular, the manufacturing index fell to its lowest level (48.0) since December and the all-industry employment index slipped to 48.9, which with the exception of April is the lowest in this cycle (All-industry PMI stable in August; a couple weak details, Abiel Reinhart, 8/22/24).
The view from our rates team: Chair Powell’s dovish tone supports our forecast of consecutive 50bp cuts at each of the next two meetings, but the August employment report is still two weeks away, valuations are no longer cheap, and dealer positioning is elevated, so our rates team stay neutral duration for now. Powell’s comments support further long end steepening, and they recommend holding 5s/30s steepeners to express their core view. Most front-end curves appear too steep relative to their drivers, but 3s/7s offers value for those who want to position for a quicker and more aggressive easing cycle (Treasuries Weekly, Jay Barry et al., 8/23/24).
Supply is set to come in around $9.1bn next week, or 1.0x the trailing 5yr average for the equivalent week, headlined by a $2.6bn sale for the State of California
Issuance is set to come in around $9.1bn next week, or 1.0x the trailing 5yr average for the equivalent non-jobs reporting week. Expected tax-exempt supply of $9.0bn would be 1.3x the average, while taxable issuance of $145mn would be just 8% the average.
The negotiated calendar is expected to be headlined by the State of California, with a $2.6bn deal, and Chicago O’Hare International Airport with a $1bn sale.
Figure 145: Historical and forecast weekly municipal issuance
Weekly Issuance, $bn’s
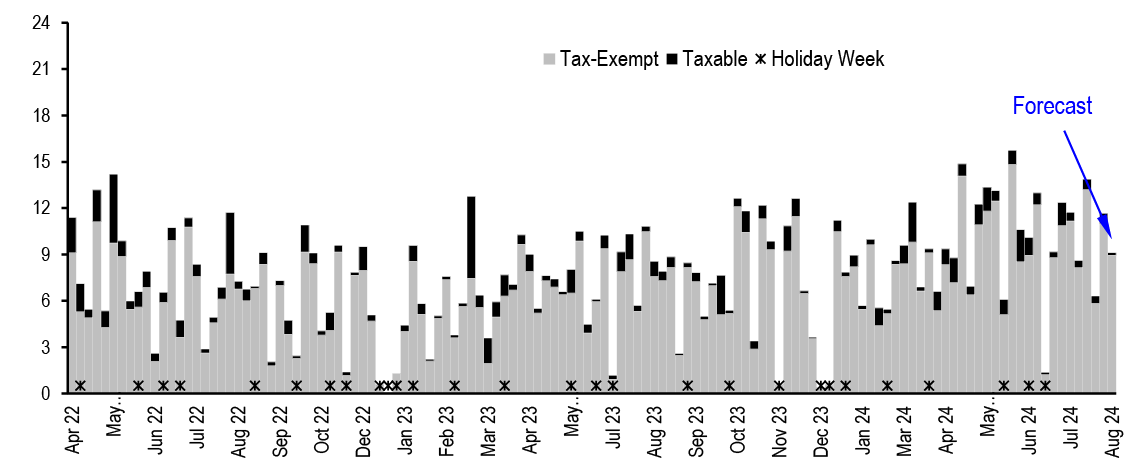
Source: IPREO, Bloomberg Finance L.P., J.P. Morgan
LSEG Lipper reported municipal fund inflows for an 8th consecutive week
LSEG Lipper reported municipal fund inflows for the 8th consecutive week, totaling +$501mn for the weekly period ending August 21st (+$432mn open-end funds/+$69mn ETFs). Flows were positive across the board, but concentrated in Long Term (+$410mn) and High Yield funds (+$355mn) (which are not mutually exclusive).
| Weekly Only Reporters | Fund Flows ($mn) | ||
| Week ended August 21, 2024 | Total | Open-end Funds | ETF Funds |
| All term muni | 501 | 432 | 69 |
| Investment Grade | 146 | 97 | 49 |
| High Yield | 355 | 335 | 20 |
| Long Term (10yr+) | 410 | 378 | 32 |
| Intermediate (5-10yr) | 14 | (24) | 38 |
| Short / Intermediate (3-5yr) | 25 | 36 | (11) |
| Short (1-3yr) | 51 | 41 | 10 |
| National funds | 470 | 428 | 42 |
| New York | (2) | (1) | (0) |
| California | 16 | 5 | 11 |
| Tax-exempt money market | 2,076 | ||
| Taxable money market | 17,585 | ||
| Taxable Fixed Income | 5,416 | (848) | 6,264 |
| US & Global Equity | 7,951 | (5,116) | 13,067 |
Source: LSEG Lipper Global Fund Flows, J.P. Morgan. Note: Figures shown on this table are weekly reporters only. Data refreshed on 8/22/24, 2pm read.
Flows for the full month of July totaled +$6.6bn (+$3.5bn open-end funds/+$3.2bn ETFs), bringing year-to-date inflows to +$18.9bn (+$12.8bn open-end funds/+$6.1bn ETFs). Please see our Municipal Weekly Fund Flows Update for additional detail.
| Weekly and Monthly Reporters | July Monthly Flow $mn | YTD Flow $mn | ||||
| Combined | Open End Mutual Fund | ETF | Combined | Open End Mutual Fund | ETF | |
| All term muni | 6,649 | 3,464 | 3,185 | 18,856 | 12,803 | 6,053 |
| Investment Grade | 4,806 | 1,686 | 3,120 | 8,567 | 2,558 | 6,008 |
| High Yield | 1,843 | 1,778 | 66 | 10,289 | 10,245 | 45 |
| Long Term (10yr+) | 5,072 | 2,590 | 2,482 | 21,670 | 16,982 | 4,688 |
| Intermediate (5-10yr) | 1,364 | 999 | 365 | 1,914 | 423 | 1,491 |
| Short / Intermediate (3-5yr) | 69 | 63 | 7 | (1,971) | (1,461) | (510) |
| Short (1-3yr) | 144 | (188) | 332 | (2,757) | (3,141) | 384 |
| National funds | 6,314 | 3,260 | 3,054 | 18,046 | 12,566 | 5,480 |
| New York | 31 | 15 | 16 | 198 | 91 | 107 |
| California | 370 | 255 | 116 | 1,660 | 1,195 | 465 |
Source: LSEG Lipper Global Fund Flows, J.P. Morgan. Note: Figures shown on this table are combination of weekly and monthly reporters. Figures are as reported on 8/22/24 at 2pm, and may evolve as more month-end data is reported.
YTD fund flow, $bn

Source: LSEG Lipper Global Fund Flows, J.P. Morgan. Note: Figures shown on this table are combination of weekly and monthly reporters. Data refreshed on 8/22/24 at 2pm. Includes all weekly and monthly flows recorded to date. Data may be updated in future business days of the month.
Historical data indicates munis followed the broader market rally during each initial rate cut by Fed, but underperformed the UST market overall. We believe next two months are the best buying opportunities
On Friday morning at the Jackson Hole symposium, Chair Jerome Powell announced that the time has come for the Federal Reserve to cut its key policy rate, the only question remaining is whether it will be a 25bps or 50 bps cut. As such the projected first rate cut is now within a month, with the next FOMC meeting on September 17-18.
Last week (LINK) we examined absolute municipal market performance in the context of easing cycles and found that, generally speaking, municipal bonds had strong annual returns during most easing cycles. This conclusion is consistent with our observation of fund flows during Fed easing cycles. As we discussed in 8/2/2024 publication, we found that municipal mutual funds experienced sustained inflows in all six of the last easing cycles, dating back to 1992.
In the following, we explore how munis have historically performed relative to Treasuries, specifically from a ratio perspective, before and after the Fed’s first rate cut.
As illustrated in Figure 146, we pulled historical weekly 10yr Treasury yield change and 10yr Muni/UST ratio change, from the weekly periods prior to and just after the first rate cut of the past six Fed easing cycles. In the figure below, the trendline indicates the average change in the 10yr ratio, while the bars show the weekly change in the 10yr UST yield over the corresponding week. For example, this week, we are 4 weeks from the projected first easing of the cycle. On average, in the comparable week over the past six tightening cycles, the 10yr municipal/UST ratio has cheapened by 1.7ppts, while UST yields have rallied by 38bps before the first cut.
Moreover, from the chart, we see that Treasuries consistently rallied starting as early as 11 weeks prior to each first rate cut of the cycle, and the rally generally continued for one or two week after the first cut on average. For the Muni/UST ratios, the black trendline remained positive, indicative of municipal underperformance, from 9 weeks prior to the first Fed cut until 2 weeks after. This is consistent with then market’s behavior in July and thus far in August, where the rally in the municipal market could not keep pace with the Treasury market.
Figure 146: Historical data shows Treasuries consistently rallied starting as early as 11 weeks prior to each first rate cut by the Fed. Municipals have historically lagged the UST market, which is consistent with then market’s behavior in July and thus far in August
Weekly Treasury yield change, bps (left) and Weekly Muni/Treasury ratio change, % (right)

Source: Refinitiv, J.P. Morgan
We are now 4 weeks away from the September 18th FOMC meeting. This week, long-end (10-year and longer) Muni/UST ratios have reached their YTD highs ( Figure 147). Our analysis shows that it remains challenging for munis to outperform Treasuries until the first rate cut next month. We also pointed out on this Thursday (link), based on a 21% tax rate, the taxable equivalent yield for 30yr AA 4% tax-exempts provides a 50bps spread pickup over similar structure corporates ( Figure 148), and the widest since December of 2023 (50bps).
Figure 147: Muni/UST ratios hit YTD high in 10yr and longer part of the curve this week
Muni/UST ratios, %
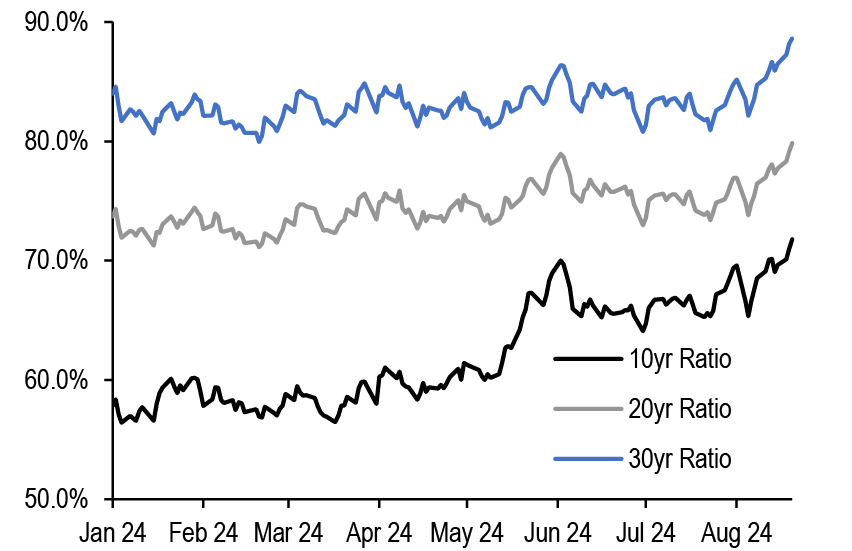
Source: Refinitiv, J.P. Morgan. Note: as of 8/21/2024
Figure 148: Based on a 21% tax rate, the TEY for 30yr AA 4% tax-exempts provides a 50bps spread pickup over similar structure corporates, and the widest since Dec 2023
TEY spread over corporates, bps
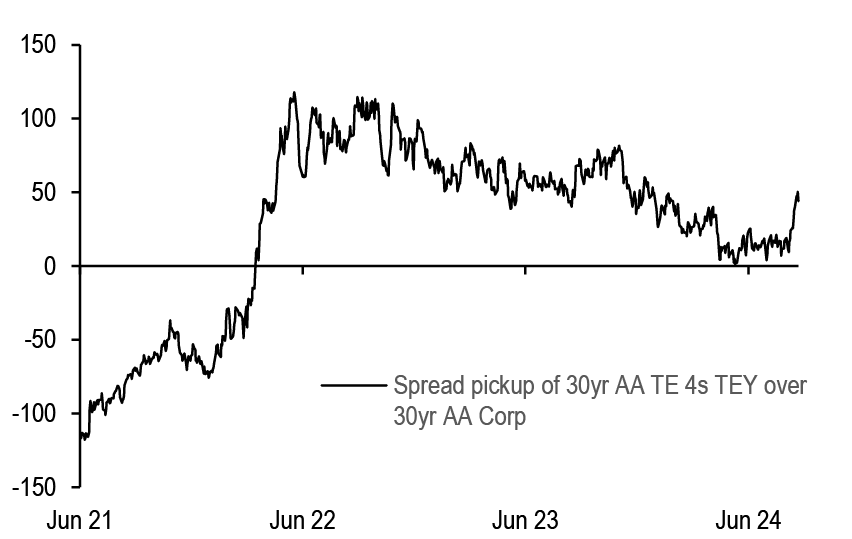
Source: ICE, J.P. Morgan. Note: as of 8/22/2024
Based on these observations, coupled with the prospect of weaker election-related municipal market technicals, we believe the next two months present the best buying opportunities for investors to add duration, especially in long-term 4s, housing, AMT bonds, and idiosyncratic risk.
Sector performance during prior Fed easing cycles
In last week’s publication, we drill down into sub-sector upgrade/downgrade ratio trends, highlighting relative muni sector ratings changes in periods of economic stress over the past 20-years. Not surprisingly, our analysis suggests that heightened credit scrutiny of all credits may be beneficial in cyclical downturns.
In terms of broad observation, upgrades exceeded downgrades for Muni Utility Districts (MUD), Counties, Special Districts, and W&S in 15 of the 20 periods shown; Cities were net positive in 12 of 20 of the periods presented. Conversely, upgrades rarely exceeded downgrades in the health-care sector, and Higher Education sectors also showed downgrades exceeding upgrades on average, over the periods shown.
We also suggested that investors with dedicated credit resources may lean into more idiosyncratic sectors as a means of performance differentiation, by positioning solid spread sector credits. The matrix below shows average 12-month forward Bloomberg Municipal Index sector performance in periods where the Fed was easing. It is notable that in two of the 5 easing cycles for which we have data, the healthcare sector, despite relative poor performance from a ratings perspective, showed the top performance among the index sector shown below. It is also the case that healthcare sector bonds had the lowest performance in one of the periods covered. Naturally, the longer duration structure of the sector played a role in directional performance for healthcare bonds.
Looking at the standard deviation of monthly returns over the easing cycles suggests that yield and total return oriented investment constructs would be active in more volatile leasing, special tax and education (which is 80% Higher-Ed) sector bonds. Also of note is that for sectors showing data across each of the five easing cycles, on average, the more conservative Local and State GO, and Water & Sewer sectors posted the top average performance.
Figure 149: Sector performance during prior Fed easing cycles
| Sector | 1yr Forward Return (%) | Index WAM (yrs) | 1yr Forward Return (%) | Index WAM (yrs) | 1yr Forward Return (%) | Index WAM (yrs) | 1yr Forward Return (%) | Index WAM (yrs) | 1yr Forward Return (%) | Index WAM (yrs) | Average | Standard Deviation |
| State GO | 5.3% | 10.9 | 0.0% | 10.2 | 5.9% | 9.5 | 5.6% | 10.5 | 4.2% | 9.9 | 4.2% | 1.3% |
| Local GO | 5.6% | 12.4 | -0.6% | 12.2 | 5.9% | 11.4 | 6.2% | 11.8 | 4.7% | 12.5 | 4.3% | 1.4% |
| Hospital | 7.0% | 20.7 | -3.0% | 19.1 | 7.1% | 20.3 | 1.6% | 18.9 | 4.4% | 18.1 | 3.4% | 1.9% |
| Housing | 6.4% | 22.1 | 0.8% | 21.5 | 5.2% | 21.2 | 4.4% | 22.1 | 3.6% | 20.3 | 4.1% | 1.5% |
| Education | 5.5% | 12.0 | -0.9% | 12.7 | 6.3% | 16.2 | 5.2% | 16.7 | 4.1% | 14.5 | 4.1% | 1.6% |
| Water & Sewer | 5.7% | 17.0 | -1.1% | 16.1 | 6.2% | 15.8 | 5.7% | 16.7 | 4.7% | 14.5 | 4.2% | 1.5% |
| Transportation | 6.0% | 16.5 | -0.8% | 16.0 | 5.9% | 15.1 | 3.8% | 14.5 | 3.8% | 15.1 | 3.7% | 1.6% |
| Electric | 5.7% | 15.9 | -0.9% | 14.7 | 5.9% | 13.0 | 4.6% | 13.1 | 4.4% | 13.5 | 4.0% | 1.4% |
| Leasing | 5.8% | 12.1 | 4.2% | 12.2 | 3.8% | 12.4 | 4.6% | 1.6% | ||||
| Special Tax | 6.1% | 11.1 | 4.2% | 14.6 | 3.3% | 13.0 | 4.5% | 1.6% | ||||
| Tobacco Index | -2.1% | 16.8 | 5.4% | 13.0 | 1.7% | 2.6% | ||||||
| IDR/PCR | 5.8% | 20.6 | -0.2% | 17.7 | 4.4% | 23.2 | -2.7% | 18.9 | 4.8% | 10.2 | 2.4% | 2.2% |
Source: Bloomberg Finance L.P., J.P. Morgan.
Chicago’s local tax receipts in 1H24 came in above budget, but some economic indicators suggest future pressure. The 2025 budget is expected to be released in the coming weeks, with eyes on what measures will be used to address anticipated gaps
As the DNC wraps up this week in Chicago, we thought it would be topical to provide a brief update on the city. The City’s fiscal 2025 (12/31 year-end) budget is expected to be released in the coming weeks, with eyes on what strategies will be employed to close anticipated 2025 and outyear gaps (ie. structural changes vs. one-time measures).
Year-to-date local tax revenues are performing well
Both S&P and Moody’s point out the importance that the City’s revenue growth/stability be sustained, as outyear cost pressures relating to public safety, pensions, and asylum seekers are substantial and options to cut spending are constrained. Positively, we find that the local tax collections for 1H24 have come in above budget. That said, some revenues experience a lag between the time the underlying economic activity occur, according to the City’s Office of Budget and Management. In terms of the detail, Chicago’s local tax receipts in 1H24 were +6% above budgeted estimates for the period, and +4% higher vs. 1H23 collections ( Figure 151). For context, local tax revenues increased by 2% in 2023, and are budgeted to increase by another 2% in 2024 ( Figure 150). Local taxes typically account for just under half of the City’s general fund revenues.
The City also relies on state-level taxes for general fund revenues (roughly 20% in fiscal 2023). The City’s total revenue collections in 1H24 are off -3.4% from budgeted estimates and down -1.9% from 1H23, due primarily to weakness in these state-level collections.
Figure 150: Local tax revenues increased by 2% in FY23, and were budgeted to increase by another 2% in 2024...
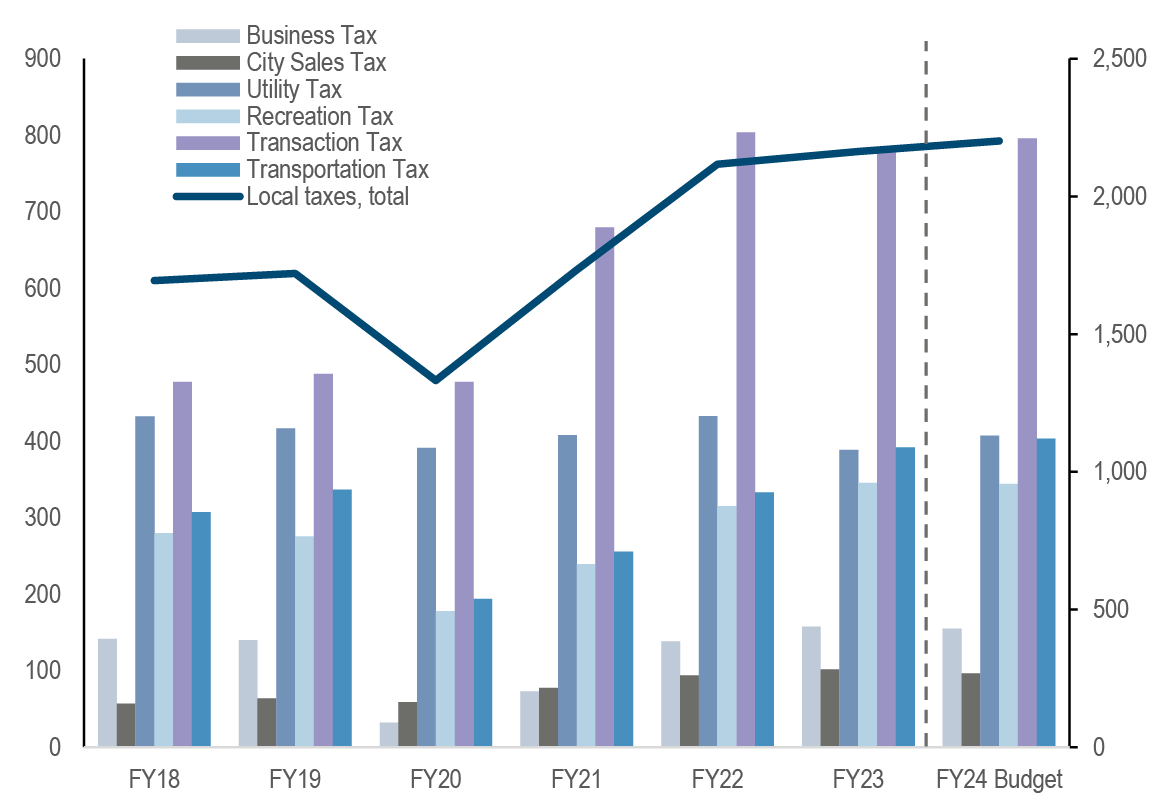
Source: City of Chicago financial statements and budget documents, J.P. Morgan
Figure 151: ….so far in FY24, receipts are tracking +6% above budget and +4% higher vs. 1H23
Jan-Jun 2024 local tax receipts, $000s
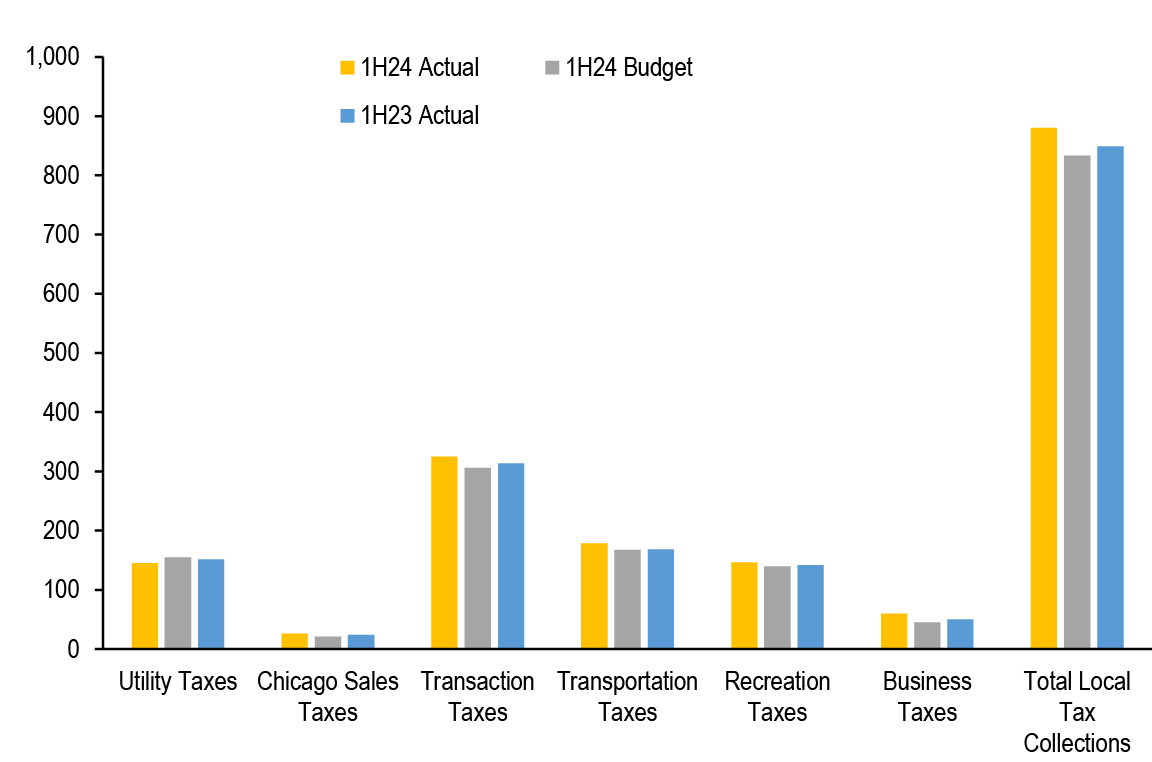
Source: City of Chicago Monthly Revenue Report, J.P. Morgan
Rating agencies cite pension progress, although the combined funded ratio is just 23%
The City currently has $6.7bn of GO debt outstanding ($4.9bn tax-exempt/$1.8bn taxable). For context, NYC is the only other city with more GO debt outstanding ($39.2bn); the third largest is Houston, TX ($4.6bn). The City’s GO ratings currently vary across rating agencies (Baa3/BBB+/A-/A by Moody’s/S&P/Fitch/Kroll). Figure 152 provides context for S&P, Moody’s and Fitch’s current ratings.
Figure 152: City of Chicago GO recent rating actions

Source: S&P, Moody’s, Fitch, J.P. Morgan
As highlighted in the matrix above, Fitch and Moody’s cited Chicago’s pension progress in their 2023 and 2022 upgrades, respectively.
- Indeed, the City has meaningfully increased its pension contributions over the last decade, from $470mn in FY14 to $2.6bn in FY23 ( Figure 154). And recall, in fiscal 2023, the city adopted a pension funding policy that is designed to prevent its reported net pension liability from growing if plan assumptions are met.
- Still, net pension liabilities across the City’s four pension funds totaled a marked $37.2bn as of FYE23, with a combined funded ratio of just 23% (see Figure 153). This burden clearly continues to weigh on the City’s credit.
Figure 153: The City’s four pension funds have a combined funded ratio of just 23.0%...
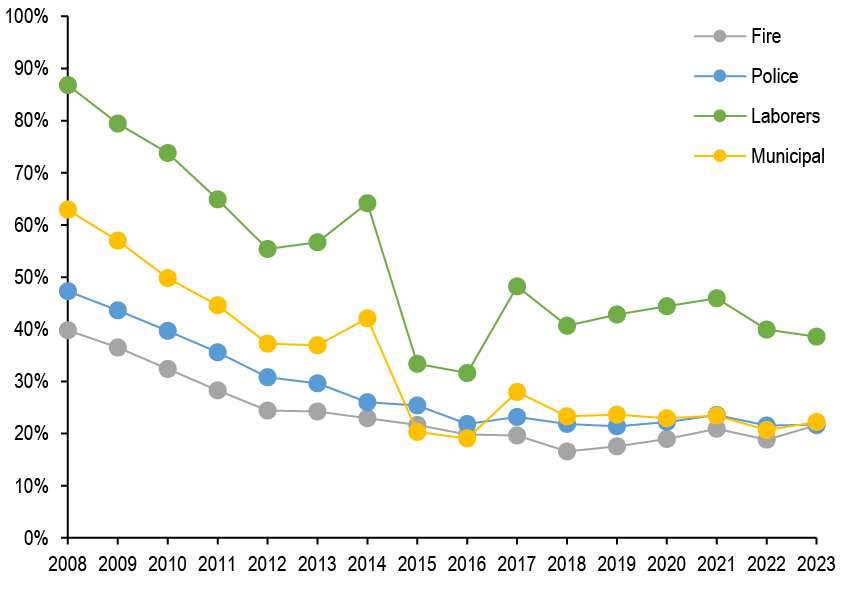
Source: City financial statements and budget documents, J.P. Morgan
Figure 154: ...encouragingly, Chicago has meaningfully ramped up its pension contributions in recent years
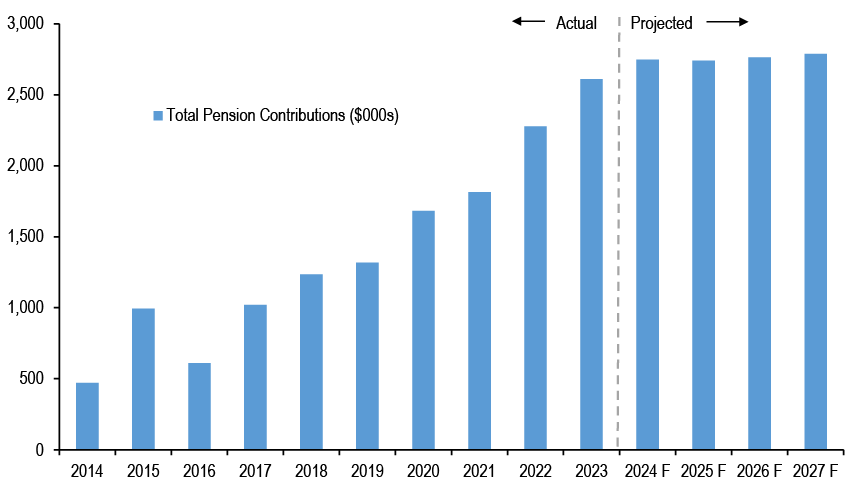
Source: City financial statements and budget documents, J.P. Morgan
Below, we provide context around a few topics in recent headlines:
(1) Office market weakness: Chicago’s office market continues to show weakness, with an availability rate of 20.0% as of 2Q24, up +6% from 4Q19 and vs. 16.7% nationally (although on a relative basis, this rate is similar to that in other large markets, like DC and Dallas), according to CoStar data. Our colleagues point out that across the largest five CMBS office metro areas, Chicago is the severe underperformer in terms of serious delinquencies (Office Market Monitor, Chong Sin et al., 8/8/24). Key takeaway: Chicago’s direct revenue exposure to a decline in office valuations is limited, due to its property tax levy method, by which the City determines a specific dollar amount for its property tax levy and the Cook County clerk adjusts the rates accordingly to generate that sum. The indirect risk to revenues is that a a decline in the City’s commercial market AV would likely shift a greater share of the burden to residential taxpayers, which could lead to reduced political willingness to increase property taxes in the future, according to Moody’s.
(2) Influx of asylum-seekers: Since the end of 2022 through May 2024, Chicago has accommodated over 43,000 asylum seekers, per city financials. Excluding federal and state grants, the City spent $54mn on costs associated with new arrivals in 2023, and has spent another $29mn so far in 2024, according to the City’s Open Data Portal. Key takeaway: These costs represent just a fraction of the City’s general fund revenue base ($4.7bn in 2023). Still, the added expenses simply layer on top of the City’s already high fixed costs and further constrain budgetary flexibility.
(3) Crime: Certain violent crime statistics in Chicago improved during 1H24 compared to 1H23, including homicides (-12%), although the count (271) was still the highest among 68 other major cities surveyed by the Major Cities Chiefs Associations. Additionally, other forms of violent crime, like aggravated assault (+6%) were up in Chicago, vs. -5% lower in other surveyed cities. Crime impacts livability. For example, the city has attributed its population decline to out-migration and its correlation to crime (State of the Economy, City of Chicago, 6/20/23).
- Population trend: Chicago is the third most populous city in the U.S., with a population of about 2.7 million, putting it between (1) NYC (8.3mn), (2) LA (3.8mn) and (4) Houston (2.3mn) and (5) Phoenix (1.7mn).
- The recent population trend is negative (-3.0% from Apr 2020-Jul 2023) and unfavorable relative to that of the State of Illinois (-2.1%), the U.S. (+1.0%), and other large cities (LA -2.0%/Houston +0.6%/Phoenix +2.6%), save for NYC (-6.2%), based on Census Bureau data.
- The broader Chicago Metro population (9.4mn) has also stagnated, down by an average annual -0.1% over 2012-2022, based on the latest data available from the Bureau of Economic Analysis (BEA). This trend is roughly in line with the NYC (+0.1%) and LA (-0.1%) metro areas, which all lag that of Dallas (+1.8%), the 4th most populous MSA.
The City’s latest economic indicators are downbeat
- In June, employment was down -0.7% y/y in the Chicago area, versus -0.1% lower in Illinois and +1.6% higher nationally ( Figure 156), according to BLS data. Relative to June 2019 (ie pre-pandemic), employment in the Chicago MSA is down 2.1%.
- The unemployment rate in the Chicago area was 6.2% in June, up more than a full percentage point from June 2023 (4.7%) and the trailing 5yr average for the month (5.2%, ex-2020), based on the latest BLS data (not seasonally adjusted). This performance is unfavorable relative to unemployment rate changes in the state of IL (+1.3pp oya/+0.9pp vs. the avg), the U.S. (+0.5pp oya/flat vs. the avg), and other large MSAs, like NYC (+0.1pp/-0.3pp), LA (+0.8pp/+0.1pp) and Dallas (+0.4pp/+0.1pp) (see Figure 155).
- The city’s central location and international airport make it a hub for distribution and logistics (State of Illinois Economic Forecast, Moody’s Analytics, Feb 2024). That said, while passenger traffic at O’Hare continues to improve, its post-pandemic recovery lags that of other international airports. In terms of the detail, total enplanements at O’Hare Intl Airport in 1H24 were up +8.4% vs. 1H23, and in 2023, enplanements were up +7.3% vs. 2022, or 87% recovered vs. pre-pandemic (2019) levels. This post-pandemic recovery lags that of other international airports, like ATL (95%), DFW (109%), MIA (115%), JFK (100%), and EWR (106%), save for LAX (83%), according to Fitch. Meanwhile, Chicago Midway Airport has more than fully recovered (111%).
Figure 155: Unemployment rates for Chicago and selected areas
Unemployment rates (%)
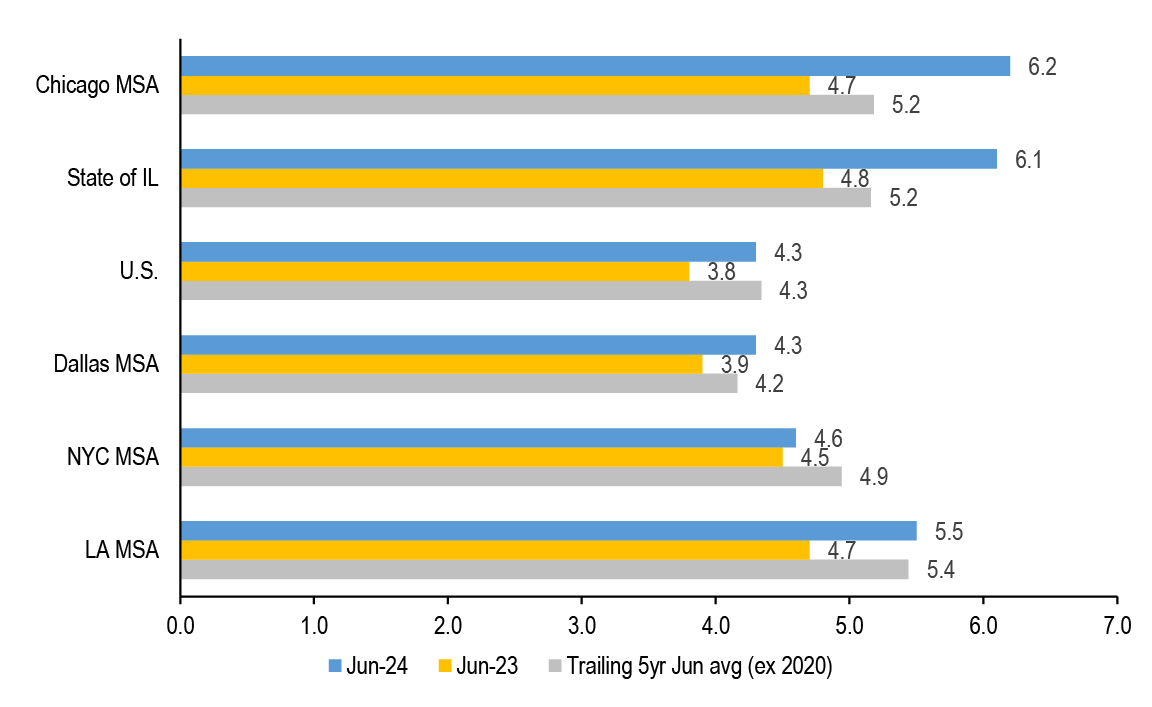
Source: U.S. BLS, J.P. MorganNote: Data are not seasonally adjusted. 5yr avg reflects the average unemployment rate for the month of June in 2018, 2019, 2021, 2022 and 2023.
Figure 156: Over-the-year changes in employment in Chicago vs. Illinois and the U.S.
12-month percent changes in employment (%)
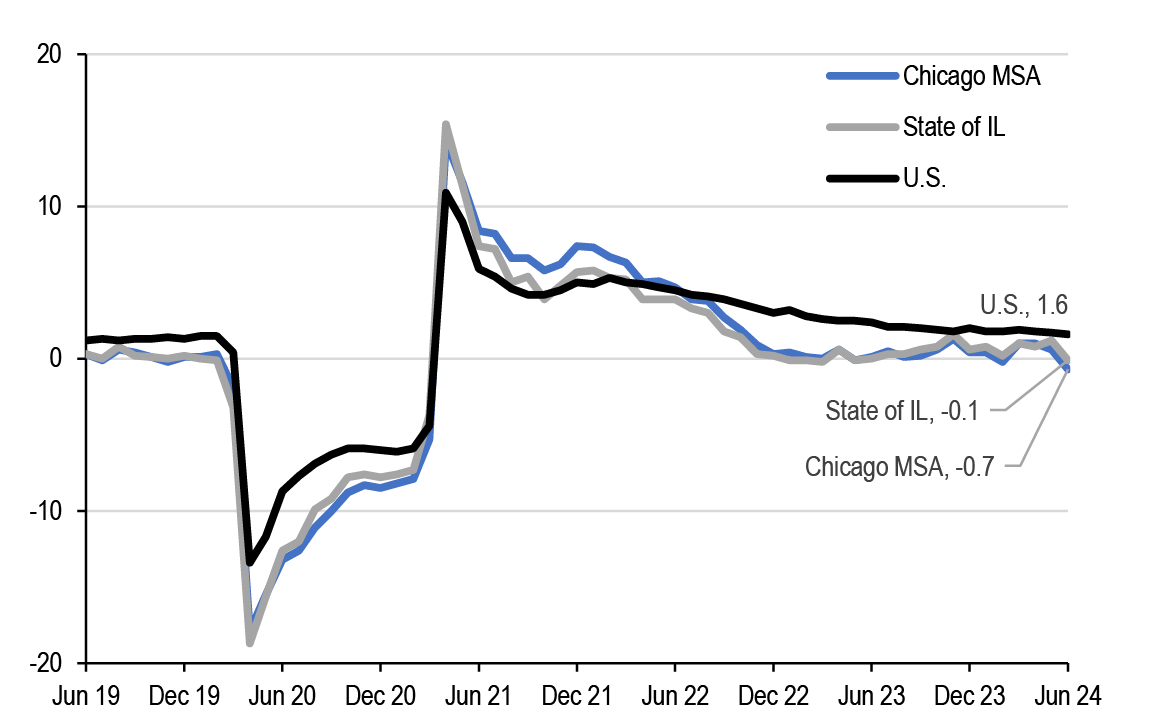
Source: U.S. BLS, J.P. MorganNote: Data are not seasonally adjusted
We prefer deep discount Chicago GO’s versus 5.5% structure
While looking at trade levels on Chicago GO’s, we came across some interesting structural comparisons across their securities. In our 3/1/2024 publication, we talked about after tax return of lower coupon structure bonds. Specifically, we discussed how using the Constant Yield method, holders of deep discount deminimis structures assume lesser accretion in the early years of ownership, and therefore lower ordinary income tax if bonds are sold in these early years.
Looking across the outstanding universe of Chicago GO bonds, we found two securities with similar maturities, but one at a deep discount and the other at a premium. As shown in Figure 157, 4% Chicago GO’s currently trade at a 50bps spread to their 5.5% coupon bond.
Figure 157: We picked two Chicago GO bonds to compare their after tax total return. The 4% coupon bond is currently 50bps wider than the 5.5% coupon bond
| CUSIP | Ultimate Borrower | Cpn | Maturity | Next Call | Purchase Yield | Purchase Price |
| 167486P86 | City of Chicago IL | 5.5 | 1/1/2043 | 1/1/2030 | 4.131 | 106.517 |
| 167486K81 | City of Chicago IL | 4 | 1/1/2044 | 1/1/2032 | 4.624 | 92.075 |
Source: Bloomberg Finance L.P.,J.P. Morgan. Note: yield and price as of 8/21/2024.
In Figure 142, below, we compare the after-tax returns on the 4% and 5.5% coupon structures over 1-3-5yr holding periods, in the rates unchanged and market rally scenarios (-25bps, -50bps), and lagged when rate sold off. Given our view that an easing cycle is in the offing, and that the Fed will continue easing through 2025 and 2026, we favor the after tax performance of the 4% structure. Additionally, shorter holding periods resulted in greater outperformance. For example, in a 25bps rally, the 4’s of 2044 outperform by 205-193bps over 1-3yr holding periods, versus just 71bps over a 5yr holding period.
Figure 158: Deep discount Chicago GO’s outperform their 5.5% bonds, in a rallying rate environment over shorter holding periods. In a 25bps rally, the 4’s of 2044 outperform by 205-193bps over 1-3yr holding periods, versus just 71bps over a 5yr holding period
| Sell at 50bps Rally | |||
| 1yr After tax | 3yr After tax | 5yr After tax | |
| 5.5s 2043 Mat 2030 Call | 5.52 | 4.25 | 3.94 |
| 4s 2044 Mat 2032 Call | 9.29 | 5.75 | 4.99 |
| Sell at 25bps Rally | |||
| 1yr After tax | 3yr After tax | 5yr After tax | |
| 5.5s 2043 Mat 2030 Call | 4.80 | 4.13 | 3.93 |
| 4s 2044 Mat 2032 Call | 6.85 | 5.06 | 4.64 |
| Sell at same yield | |||
| 1yr After tax | 3yr After tax | 5yr After tax | |
| 5.5s 2043 Mat 2030 Call | 4.09 | 4.00 | 3.92 |
| 4s 2044 Mat 2032 Call | 4.47 | 4.38 | 4.30 |
| Sell at 25bps sell off | |||
| 1yr After tax | 3yr After tax | 5yr After tax | |
| 5.5s 2043 Mat 2030 Call | 3.39 | 3.88 | 3.91 |
| 4s 2044 Mat 2032 Call | 2.21 | 3.77 | 4.01 |
Source: Bloomberg Finance L.P., J.P. Morgan. Note: after tax return is calculated using Bloomberg’s FIHZ function. using a 40.8% tax rate. Reinvestment assumption of 2.22% (5yr avg. SOFR).
BAB ERP tracker
In 2024 alone, we have identified ~40 unique issuers that have either called BABs (25 issuers, affecting $11.1bn of debt), posted conditional calls (7 issuers, set to impact $1.7bn of debt), or announced that they are considering financing plans in this regard (12 issuers, potentially impacting $6.4bn of debt). Totaling YTD calls and notices of potential redemptions, BAB ERP activity would total $19.2bn for the year. Please note that this list is constantly evolving.
Figure 159: BAB ERP tracker
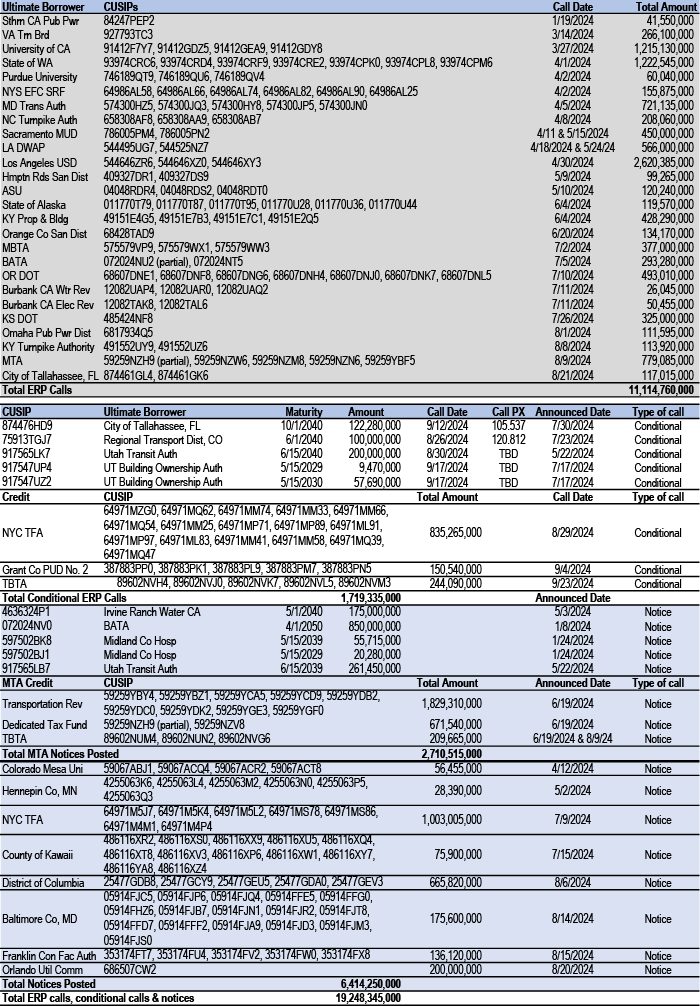
Source: EMMA, J.P. Morgan
Markets at a glance
Figure 160: YTD, muni yields across the HG curve are down by 7bps in the 2yr spot and up 14-41-15bps in 5-10-30yrs, respectively
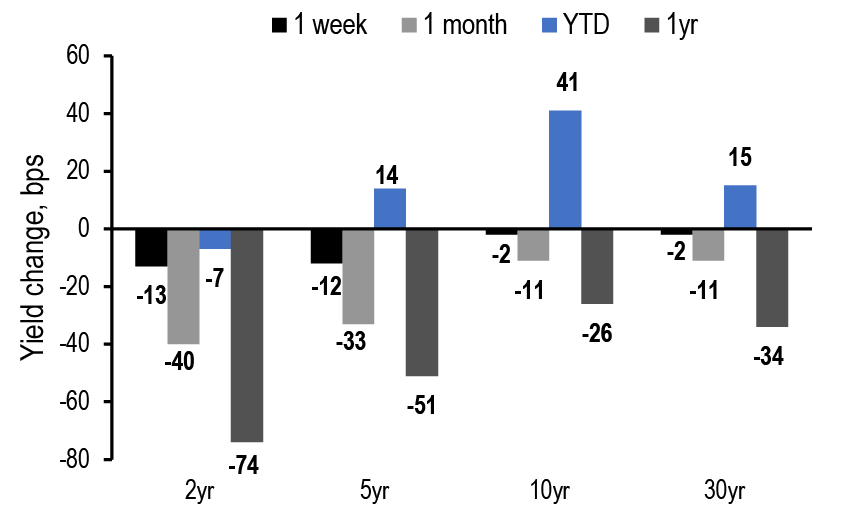
Source: Refinitiv, J.P. Morgan. Note: As of 8/23/24
Figure 161: We project a 10yr municipal high-grade yield of 2.10% by YE24
| 3Q24 | 4Q24 | 1Q25 | 2Q25 | ||
| Treasury | 8/23/2024 | Forecast | Forecast | Forecast | Forecast |
| 2yr | 3.91 | 3.60 | 3.20 | 2.75 | 2.35 |
| 5yr | 3.65 | 3.40 | 3.10 | 2.75 | 2.45 |
| 10yr | 3.80 | 3.75 | 3.50 | 3.30 | 3.15 |
| 30yr | 4.10 | 4.10 | 3.90 | 3.80 | 3.70 |
| AAA Tax-exempt | |||||
| 2yr | 2.45 | 2.35 | 1.95 | 1.75 | 1.40 |
| 5yr | 2.42 | 2.30 | 1.90 | 1.75 | 1.50 |
| 10yr | 2.69 | 2.60 | 2.10 | 2.05 | 1.90 |
| 30yr | 3.57 | 3.55 | 3.10 | 3.05 | 2.90 |
| AAA / TSY Ratios | |||||
| 2yr | 63% | 65% | 61% | 64% | 60% |
| 5yr | 66% | 68% | 61% | 64% | 61% |
| 10yr | 71% | 69% | 60% | 62% | 60% |
| 30yr | 87% | 87% | 79% | 80% | 78% |
Source: Refinitiv, Bloomberg Finance L.P., J.P. Morgan
Figure 162: Gross and net supply
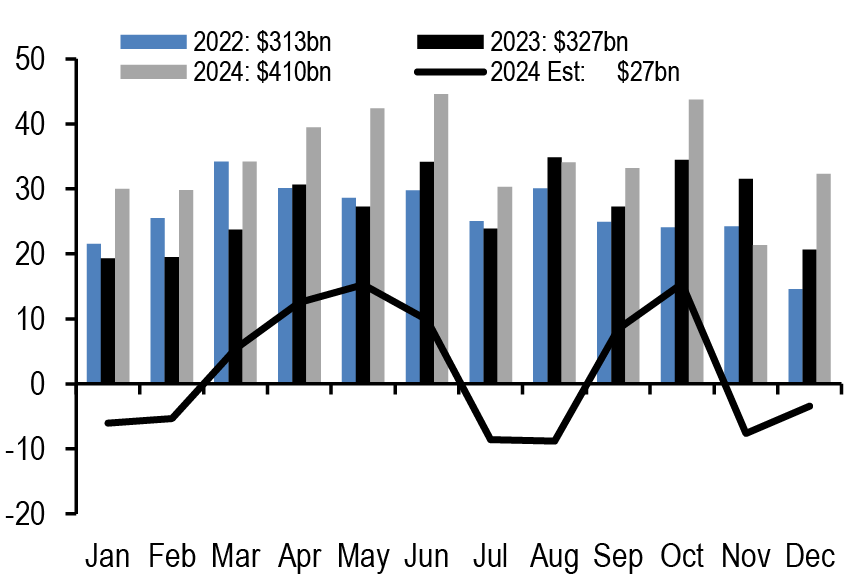
Figure 163: Tax-exempt AA Muni/Corp ratios
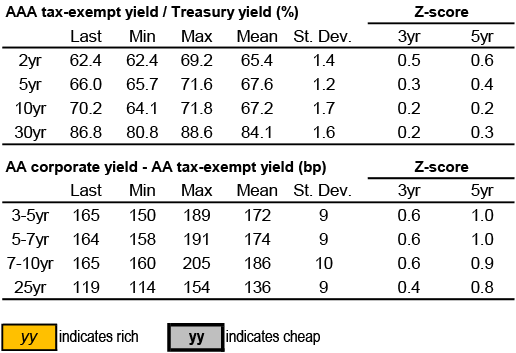
Source: Refinitiv, J.P. MorganNote: Values over last 3 months displayed, as of 08/22/24
YTD Issuance and Trading Trends
Figure 164: YTD issuance by maturity bucket relative to 2023 and the past 10yrs
Proportion of issuance, %
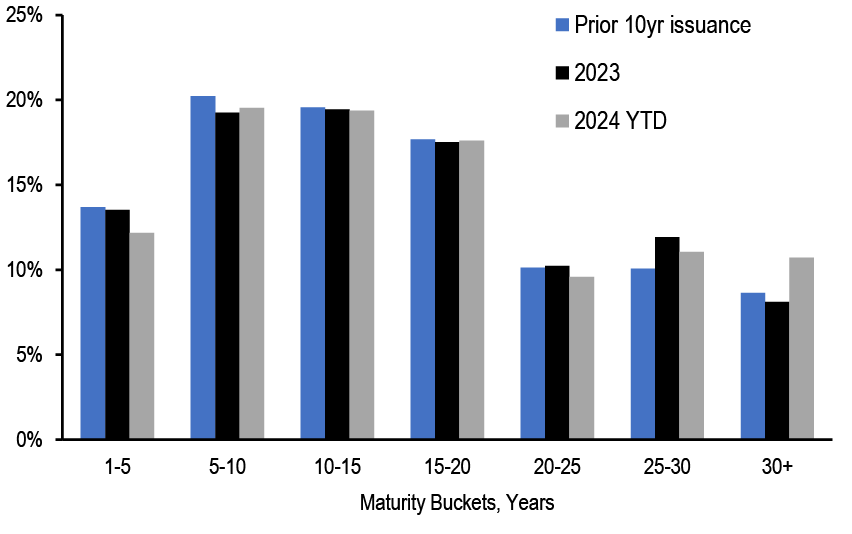
Figure 165: YTD issuance by coupon bucket relative to 2023 and the outstanding market
Proportion of issuance, %
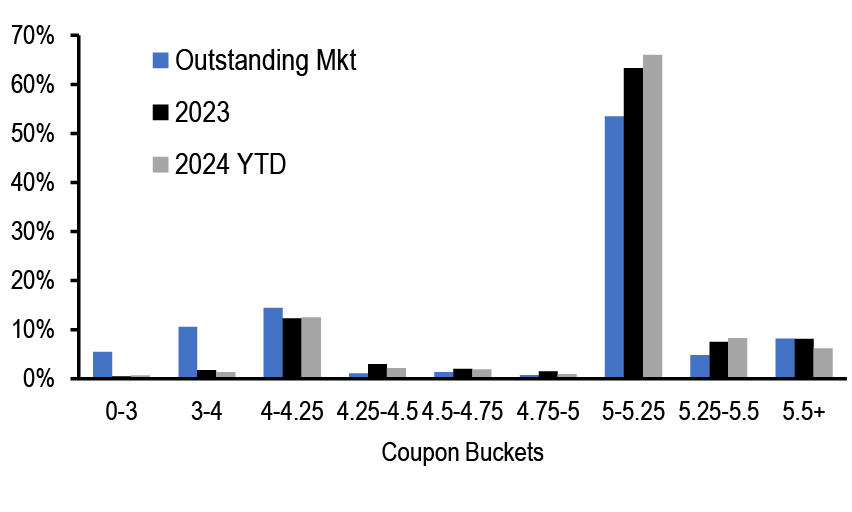
Figure 166: YTD issuance by purpose
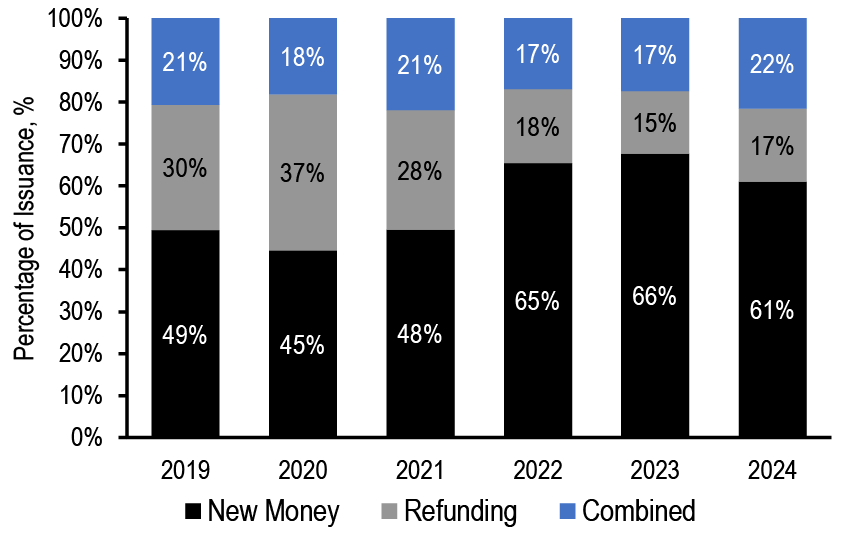
Source: Bloomberg Finance L.P., J.P. Morgan
Note: Long term bonds only
Figure 167: 5%-5.25% coupon bonds have accounted for the majority of YTD trading volume
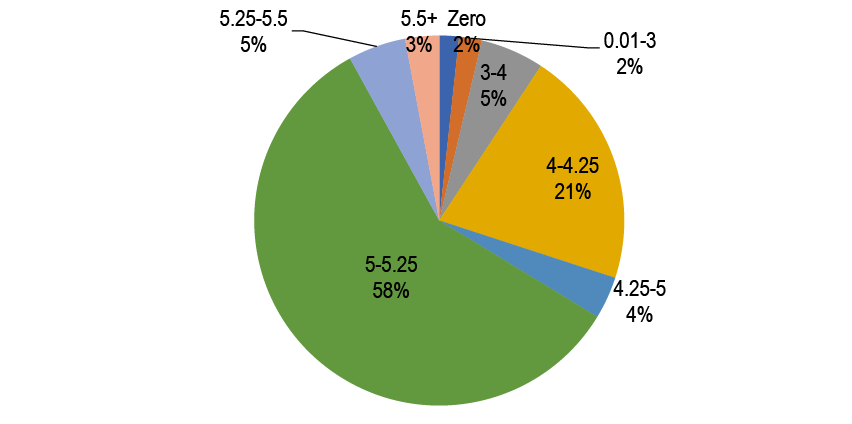
Source: MSRB, ICE, J.P. Morgan
Note: Long term, fixed coupon, tax-exempt bonds
YTD total return and curve spreads
Figure 168: YTD total returns

Figure 169: The 2s/30s curve is 2.5 sigma above its one year average
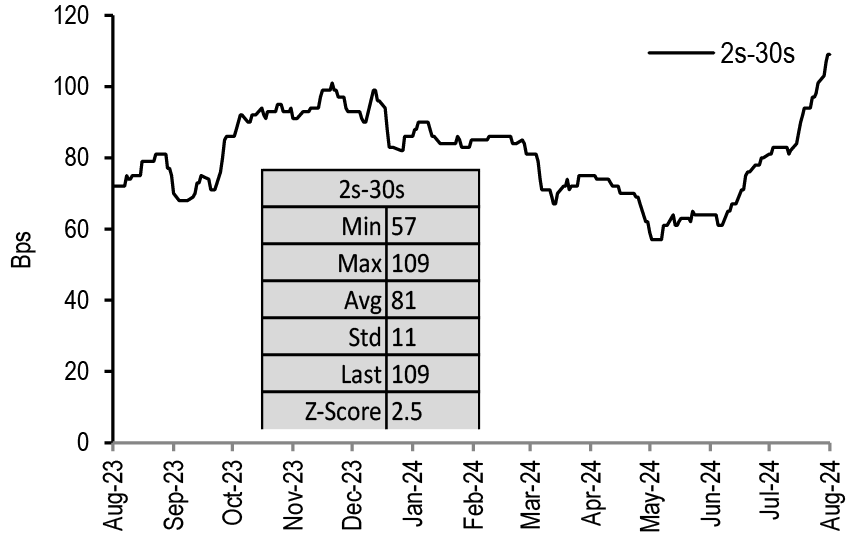
Figure 170: The 10s/30s curve is 1.2 sigma below its one year average
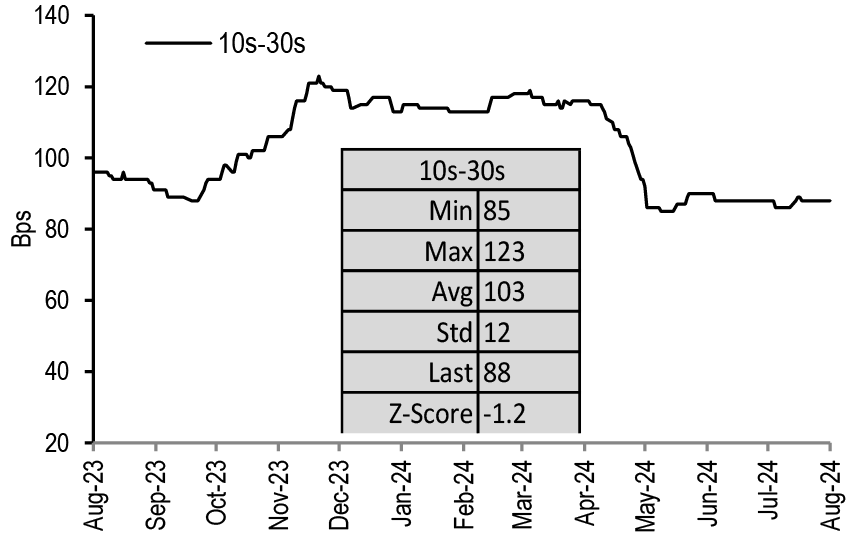
Figure 171: The 5s/10s curve is 4.1 sigma above its one year average
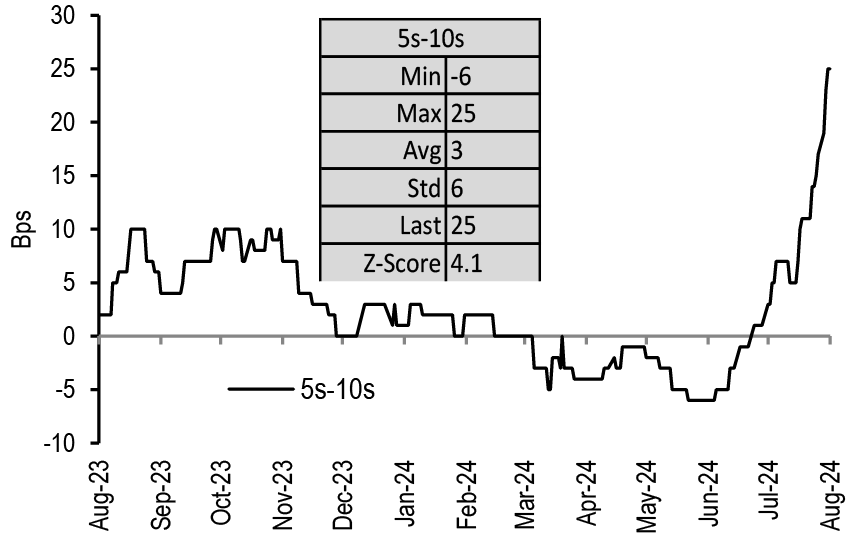
Source: Refinitiv Lipper, Bloomberg Finance L.P., J.P. Morgan. Note: As of 08/22/24
Figure 172: The 10s/20s curve is 1.5 sigma below its one year average
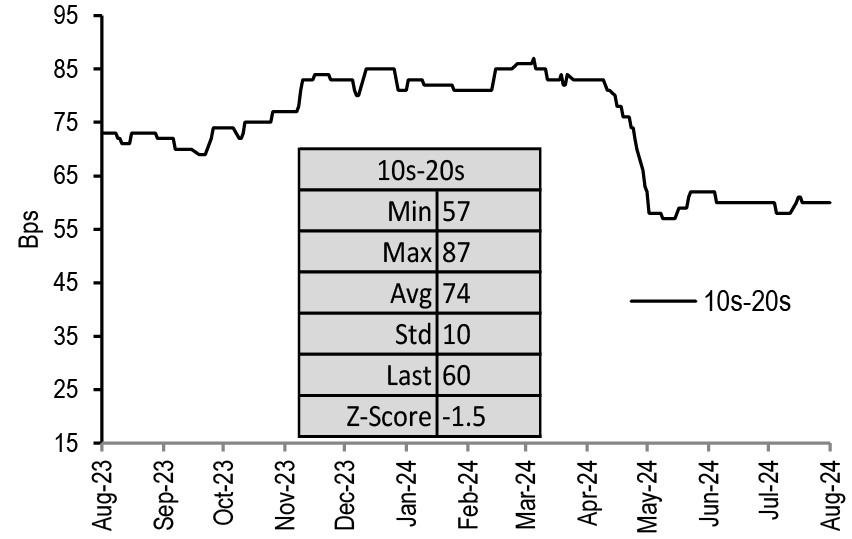
Total return by state and sector
Figure 173: The average YTD total return for Bloomberg municipal bond indices by state is 1.5%

Figure 174: Year-to-date, the broader municipal market has returned 1.2%
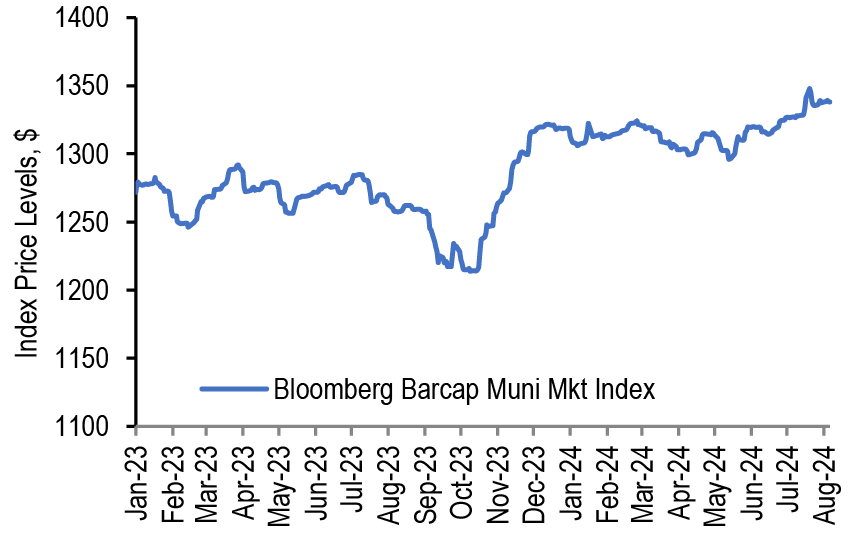
Figure 175: The Bloomberg muni index has returned 2.7% in the last three months
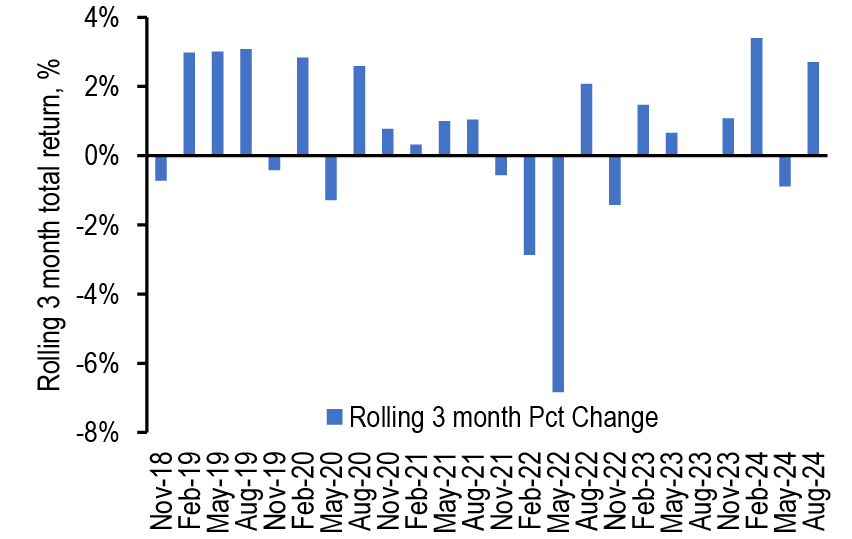
Figure 176: On a YTD basis, the HY muni index is outperforming
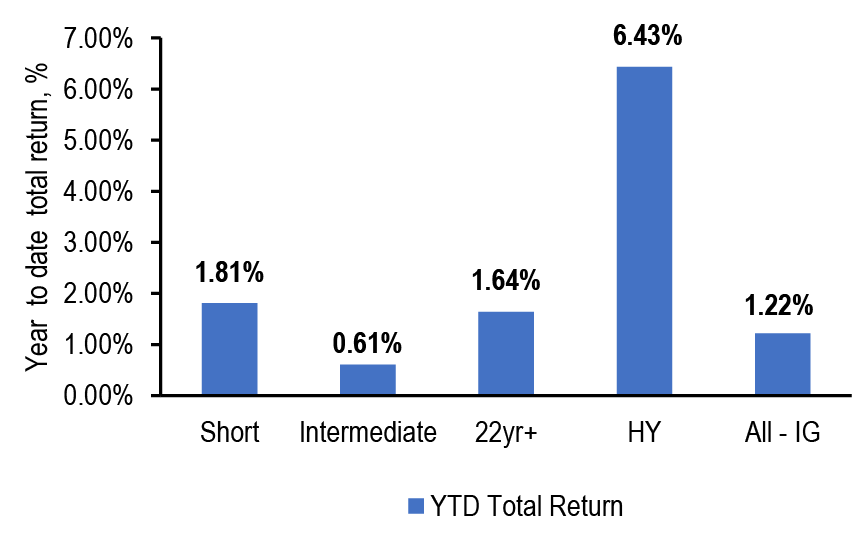
Source: Bloomberg Finance L.P., J.P. Morgan, as of 08/22/24. Note: Total return calculated as the percentage change in index levels. Bloomberg Municipal bond total return indices used
Figure 177: YTD returns turned positive by sector
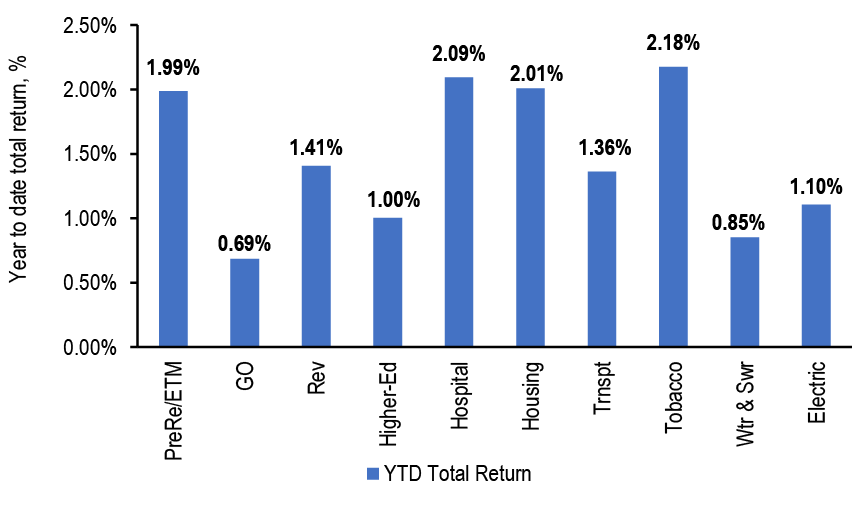
Glossary of Publication Topics
Sector Overviews
- Airports: 04/13/2018, 04/20/2018, 09/06/2019, 05/15/2020,06/11/2021, 01/10/2022, 02/11/2022, 08/19/2022, 07/28/2023
- Bond Insurance: 03/18/2016, 6/23/2017, 10/27/2017
- Charter Schools: 01/25/13, 03/15/24, 03/22/24
- Double-Barreled Bonds: 05/13/2016, 6/24/2016, 05/13/2022
- Energy: 01/29/2016, 02/05/2016, 02/19/2016, 04/23/2021, 02/11/2022
- Environmental, Social, Governance (ESG) Bonds:06/01/2018, 10/22/2021
- Gas prepay: 3/10/2017, 06/07/2019, 3/10/2023, 3/24/2023
- Housing: 1/20/2017, 10/20/2017, 07/26/2019, 08/02/2019, 12/10/2021,5/3/2024
- Healthcare: 04/29/2016, 1/27/2017, 3/03/2017, 1/19/2018, 1/28/2019, 2/1/2019, 01/24/2020, 10/16/2020, 01/22/2021, 08/27/2021, 06/03/2022, 06/10/2022, 9/23/2022, 4/28/2023, 01/19/2024
- Higher Ed: 5/19/2017, 9/14/2018, 07/24/2020, 07/16/2021, 08/05/2022, 04/05/24
- High/Enhanced Yield: 9/8/2017, 9/15/2017, 7/27/2018, 8/03/2018, 05/08/2020, 05/15/2020, 06/05/2020, 06/12/2020, 08/28/2020
- Local Government Credit: 4/07/2017, 11/10/2017, 06/18/2021, 10/29/2021, 11/04/2022
- Low beta/defensive: 08/25/2017
- Office: 04/14/2023, 05/12/2023, 07/07/23, 03/11/24
- Pensions: 11/03/2017, 10/12/2018, 10/19/2018, 10/26/2018, 04/05/2019, 04/17/2019, 08/16/2019, 08/23/2019, 10/18/2019, 07/30/2021, 11/05/2021, 10/28/2022, 09/29/23
- Pre-refunded bonds: 1/29/2018
- Primary and secondary (K-12) education: 11/02/2018
- Public Power/Electric: 2/09/2018, 02/19/2021, 07/09/2021, 03/18/2022
- U.S. Ports: 04/15/2016, 05/20/2016, 11/18/2016, 04/06/2018, 10/15/2021
- Secured Credits: 08/07/2015, 09/18/2015, 09/25/2015
- Special Tax Bonds: 05/01/2015, 07/31/2015, 09/25/2015, 01/29/2016, 5/5/2017, 09/29/2017, 5/18/2018, 04/26/2019, 05/03/2019, 01/31/2020, 05/20/2022
- States: 11/13/2020, 2/5/2021, 09/24/2021, 02/25/2022, 03/04/2022, 07/08/2022
- SIFMA/Floating Rate notes: 03/15/2016, 08/26/2016, 3/31/2017, 4/28/2017, 04/13/2018, 9/14/2018, 02/20/2019, 04/26/2019
- Taxable bonds: 5/11/2018, 12/14/2018, 03/29/2019, 05/31/2019, 09/27/2019, 04/03/2020, 07/10/2020, 07/24/2020, 08/14/2020, 08/21/2020, 10/16/2020, 10/23/2020, 08/06/2021, 10/22/2021, 11/12/2021, 04/08/2022, 06/03/2022, 07/29/2022, 08/05/2022
- Toll Roads: 9/16/2016, 5/12/2017, 09/15/2017, 07/10/2020, 07/15/2022
- Tobacco: 11/20/2015, 12/15/2017, 7/27/2018, 03/29/2019, 05/07/2021, 08/19/2022, 08/26/2022, 5/10/24, 5/17/24
- Water & Sewer: 05/06/2016, 6/24/2016, 02/02/2018, 12/17/2021, 7/14/23, 5/31/24
Specific Credits
- Assured Guaranty: 03/18/2016, 6/23/2017, 10/27/2017
- National Public Finance Guarantee Corporation: 6/23/2017, 10/27/2017
- Chicago & related credits: 9/23/2016, 2/10/2017, 04/13/2018, 10/25/2019, 02/07/2020, 06/12/2020, 10/23/2020, 02/19/2021, 10/01/2021, 05/13/2022, 10/14/22
- Detroit: 05/14/2021
- Dallas/Fort Worth & related credits: 6/02/2017, 08/04/2017, 04/13/2018
- Houston & related credits: 02/19/2016, 6/02/2017, 08/04/2017, 09/01/2017
- New York City & related credits: 03/31/2015, 6/17/2016, 9/9/2016, 8/17/2018, 08/23/2019, 06/12/2020, 05/21/2021, 04/08/2022, 04/22/2022, 05/20/2022, 01/20/2023
- Puerto Rico: 3/17/2017, 5/5/2017, 5/12/2017, 6/02/2017, 09/22/2017, 5/04/2018, 9/7/2018, 02/22/2019, 04/26/2019, 05/10/2019, 05/17/2019, 02/21/2020, 03/05/2021, 04/30/2021, 01/28/2022, 02/04/2022, 03/11/2022, 03/18/2022, 03/31/2023, 07/28/2023
- Santee Cooper / MEAG / Westinghouse Bankruptcy: 3/17/2017, 3/24/2017, 3/31/2017, 9/21/2018, 9/28/2018
- State of Alaska: 07/28/2017, 06/15/2018
- State of California & locals: 03/02/2018, 03/09/2018, 06/08/2018, 02/05/2021, 04/29/2022, 05/06/2022, 01/27/2023
- State of Connecticut & locals: 8/18/2017, 5/18/2018, 10/4/2019, 05/01/2020
- State of Illinois & related credits: 9/29/2017, 7/13/2018, 1/11/2019, 03/01/2019, 05/31/2019, 07/26/2019, 02/28/2020, 05/01/2020, 02/19/2021, 05/20/2022
- State of New York: 5/16/2014, 09/29/2017, 2/8/2019, 02/10/2023
- State of New Jersey & locals: 6/17/2016, 8/05/2016, 3/24/2017, 3/31/2017, 4/27/2018, 5/04/2018, 03/15/2019, 05/01/2020, 05/21/2021, 06/04/2021
- State of Pennsylvania: 7/15/2016
- State of Texas & locals: 08/04/2017, 08/16/2019, 03/12/2021, 03/19/2021, 02/03/2023
- State of Wisconsin & locals: 03/15/2015, 9/30/2016
- U.S. Virgin Islands & Guam: 07/15/2016, 07/29/2016, 2/24/2017
Defaults/Distressed Munis
- Chapter 9/Distressed locals: 10/31/2014, 11/21/2014, 06/30/2015, 07/08/2016, 04/26/2019, 01/31/2020, 02/07/2020
- Defaults: 11/20/2015, 06/24/2016, 07/08/2016, 08/26/2016, 8/24/2018, 04/23/2020, 07/24/2020, 09/24/2021, 02/11/2022, 03/11/2022, 07/29/2022, 01/6/2023, 01/05/24
- GO Security/Statutory Lien: 10/2/2015, 11/4/2016
Tax Policy
- AMT: 03/16/2018, 5/18/2018, 10/19/2018, 06/14/2019, 04/01/2022, 05/20/2022, 12/9/2022, 07/28/2023, 02/02/2024
- De minimis: 03/02/2018, 06/14/2019, 03/25/2022, 05/06/2022, 05/13/2022
- State and local tax (SALT) deduction cap: 1/26/2018, 7/6/2018,4/16/2021, 10/22/2021, 02/09/24
- Tax swapping: 1/24/2014, 10/28/2016, 2/09/2018, 10/12/2018, 11/15/2019
- Tax reform: 2/28/2014, 12/16/2016, 4/28/2017, 5/05/2017, 6/16/2017, 09/29/2017, 10/272017, 11/03/2017, 11/10/2017, 1/26/2018
Other Federal Public Policy
- BABs: 02/23/24, 03/01/24,06/21/24
- COVID-19: 03/06/2020, 03/13/2020, 03/20/2020, 03/27/2020, 04/03/2020, 04/17/2020, 06/26/2020, 07/31/2020, 01/08/2021, 02/26/2021, 09/17/2021
- CARES Act: 04/03/2020, 01/21/2022
- American Rescue Plan: 03/26/2021, 04/09/2021, 05/21/2021, 01/21/2022
- Inflation Reduction Act: 08/05/2022, 08/19/2022, 08/26/2022
- Infrastructure spending: 04/09/2021, 05/14/2021, 07/16/2021, 08/06/2021, 09/17/2021, 01/21/2022
- Fed facilities/Municipal Liquidity Facility: 8/11/2020
- Regulatory reform/High-Quality Liquid Assets: 04/01/2016, 07/14/2017, 03/09/2018, 8/24/2018
- Health-care reform/Medicaid funding: 3/10/2017, 3/17/2017, 3/24/2017, 6/23/2017, 07/28/2017, 11/22/2017
- Trade war and tariffs: 04/06/2018, 06/07/2019
Periodic Updates
- 2024 election: 6/7/24
- Coupon performance: 04/08/2016, 9/21/2018, 03/15/2019, 06/14/2019, 06/28/2019, 10/18/2019, 08/20/2021, 04/01/2022, 08/26/2022, 09/09/2022
- Federal Reserve Flow of Funds: 01/10/2020, 03/27/2020, 06/26/2020, 09/25/2020, 12/11/2020, 06/18/2021, 09/24/2021, 12/17/2021, 03/18/2022, 06/10/2022, 09/16/2022, 12/16/2022 , 12/15/2023, 03/15/24
- Make-Whole Call: 04/22/2016, 07/12/2019
- Outflow cycle: 10/29/2021, 11/05/2021, 03/11/2022, 04/01/2022, 04/29/2022, 05/06/2022, 05/13/2022, 09/16/2022
- Short call bonds: 08/28/2015, 12/11/2015, 03/04/2016, 3/3/2017, 3/10/2017, 08/04/2017, 03/26/2021, 10/01/2021, 06/10/2022
- Taxable advance refunding: 09/13/2019, 10/25/2019, 10/16/2020, 10/01/2021
- Total Return & Performance: 05/13/2016, 06/10/2016, 5/19/2017, 07/07/2017, 11/10/2017, 02/23/2018, 1/4/2019, 01/10/2022, 04/08/2022
- Sovereign Government Relative Value: 09/09/2016, 01/19/2018, 8/17/2018
- State and Local revenues: 04/13/2018, 9/21/2018, 1/11/2019, 05/17/2019, 06/21/2019, 09/20/2019, 01/10/2020, 04/17/2020, 09/11/2020, 09/18/2020, 11/13/2020, 01/29/2921, 06/18/2021, 11/12/2021, 03/25/2022, 09/09/2022, 11/10/22, 2/24/2023, 02/23/24,06/12/24
- Appropriation debt: 8/19/2016, 01/26/2024
Municipal Market Outlook
Weekly Updates
- Economic and policy updates
- Next week’s supply, fund flows
- Comparisons versus Corporates, Treasuries, and Global Sovereigns
- Full year gross, net-supply estimates, and interest rate forecast
Emerging Markets
- In EM fixed income, we are MW GBI-EM local rates, CEMBI and EMBIGD.
- EM bond flows were -$304mn (-0.08% of weekly AUM, up from -$1.4bn).
EM credit spreads closed tighter on the week. EMBIGD at 395bp tightened by 4bp while CEMBI did so by 3bp to settle at 226bp. GBI-EM yield rose by 3bp to 6.27%. In terms of flows, Overall retail outflows considerably declined to -$304mn this week (from -$1.4bn). Outflows were led by hard currency fund outflows, which fell to -$196mn this week (from -$697mn), while local currency fund outflows fell to -$107mn (from -$703mn, the 20th week of outflows in a row). ETF inflows accelerated to +$49mn (from -$535mn), while non-ETF outflows fell to -$352mn (from -$865mn). Within local currency, EM ex-China saw outflows of -$68mn (from -$558mn), and China-focused funds outflows of -$40mn (from -$145mn). On the hard currency side, AsiaXJ funds saw outflows of -$140mn (from -$269mn), while “broad” EM funds saw outflows of -$56mn (from -$428mn).
EM Client Survey: Marginal risk addition in EM sovereigns and local rates
Modest increase in sovereign exposure and local rates, with EM FX positioning largely unchanged during the month of August. Investors increased their OW stance on EM sovereigns and EM local rates. Furthermore, exposure to EM FX remained broadly flat with a modest UW bias. Meanwhile, EM corporates saw a small decline in overall UW positioning.
Outflows have sharpened over the last month amidst a backdrop of spiking volatility and market gyrations. EM bond funds saw a cumulative USD -4.3bn in outflows over the four weeks to August 14; hard currency has been leading the latest bout of outflows, accounting for USD -2.7bn out of the total. Momentum remains negative, with weekly outflows increasing consistently over the last four weeks. EM bond funds have seen USD -14.8bn in outflows YTD. Looking ahead, we expect moderate outflows to continue over the short term, as the market awaits more visibility on the state of the US economy and the potential start and pace of Fed easing. Primary market activity has been muted throughout July.
Views on U.S recession odds and EMBIGD spreads. Overall, investors maintain a sanguine view around the prospects of the U.S eluding a recession between 2024 and 2025. north of 80% of participants believe that the probability of a U.S recession by year’s end is below 40%. This number trends lower when changing the timeframe to the 2H25, but remains fairly high. In a recession scenario, more than half of investors see EMBIGD spreads widening more than of 50bp.
For further detail, see EM Client Survey: Marginal risk addition in EM sovereigns and local rates; G. Lalaguna et al, August 23, 2024
Forecast & Analytics
Interest rate forecast
| Actual | 3Q24 | 4Q24 | 1Q25 | 2Q25 | |
| 23-Aug | 30-Sep | 31-Dec | 31-Mar | 30-Jun | |
| Rates (%) | |||||
| Effective funds rate | 5.33 | 4.85 | 4.10 | 3.60 | 3.10 |
| SOFR | 5.31 | 4.85 | 4.10 | 3.60 | 3.10 |
| 2-yr Treasury | 3.91 | 3.60 | 3.20 | 2.75 | 2.35 |
| 3-yr Treasury | 3.73 | 3.45 | 3.05 | 2.60 | 2.25 |
| 5-yr Treasury | 3.65 | 3.40 | 3.10 | 2.75 | 2.45 |
| 7-yr Treasury | 3.71 | 3.45 | 3.20 | 2.85 | 2.55 |
| 10-yr Treasury | 3.81 | 3.75 | 3.50 | 3.30 | 3.15 |
| 20-yr Treasury | 4.19 | 4.15 | 3.95 | 3.75 | 3.60 |
| 30-yr Treasury | 4.10 | 4.10 | 3.90 | 3.80 | 3.70 |
| Spreads (bp) | |||||
| Fed funds/2yr | -142 | -125 | -90 | -85 | -75 |
| 2s/10s | -11 | 15 | 30 | 55 | 80 |
| 2s/5s | -26 | -20 | -10 | 0 | 10 |
| 5s/10s | 16 | 35 | 40 | 55 | 70 |
| 5s/30s | 45 | 70 | 80 | 105 | 125 |
| 10s/30s | 30 | 35 | 40 | 50 | 55 |
Source: J.P. Morgan
Swap spread forecast*
| Actual | YE24 | |
| 23-Aug-24 | 31-Dec-24 | |
| SOFR Swap Spread (bp) | ||
| 2-year SOFR swap spread (bp) | -19 | -6 |
| 5-year SOFR swap spread (bp) | -30 | -22 |
| 10-year SOFR swap spread (bp) | -44 | -37 |
| 30-year SOFR swap spread (bp) | -80 | -79 |
* Forecast uses matched-maturity spreads
Source: J.P. Morgan
TIPS real yield & breakeven forecast
| Actual | 3Q24 | 4Q24 | 1Q25 | 2Q25 | |
| 23-Aug-24 | 30-Sep-24 | 31-Dec-24 | 31-Mar-25 | 30-Jun-25 | |
| Breakevens (bp) | |||||
| 5Y | 202 | 195 | 200 | 200 | 200 |
| 10Y | 213 | 205 | 200 | 210 | 210 |
| 30Y | 215 | 210 | 210 | 210 | 215 |
| Real yields (%) | |||||
| 5Y | 1.63 | 1.45 | 1.10 | 0.75 | 0.45 |
| 10Y | 1.68 | 1.70 | 1.50 | 1.20 | 1.05 |
| 30Y | 1.97 | 2.00 | 1.80 | 1.70 | 1.55 |
| Curves (bp) | |||||
| 5s/10s BE | 10 | 10 | 0 | 10 | 10 |
| 10s/30s BE | 2 | 5 | 10 | 0 | 5 |
| 5s/10s yld | 4 | 25 | 40 | 45 | 60 |
| 10s/30s yld | 29 | 30 | 30 | 50 | 50 |
Source: J.P. Morgan
Economic forecast
| %ch q/q, saar, unless otherwise noted | ||||||||||
| 23Q4 | 24Q1 | 24Q2 | 24Q3 | 24Q4 | 25Q1 | 25Q2 | 2023* | 2024* | 2025* | |
| Gross Domestic Product | ||||||||||
| Real GDP | 3.4 | 1.4 | 2.8 | 1.3 | 1.0 | 1.8 | 1.8 | 3.1 | 1.6 | 1.9 |
| Final Sales | 3.9 | 1.8 | 2.0 | 1.5 | 0.9 | 1.4 | 1.6 | 3.5 | 1.6 | 1.8 |
| Domestic Final Sales | 3.6 | 2.4 | 2.7 | 1.9 | 1.3 | 1.6 | 1.6 | 3.2 | 2.1 | 1.9 |
| Business Investment | 3.7 | 4.4 | 5.2 | 2.1 | 3.4 | 4.1 | 3.4 | 4.6 | 3.8 | 4.6 |
| Net Trade (% contribution to GDP) | 0.3 | -0.7 | -0.7 | -0.4 | -0.4 | -0.3 | -0.1 | 0.3 | -0.5 | -0.1 |
| Inventories (% contribution to GDP) | -0.5 | -0.4 | 0.8 | -0.3 | 0.1 | 0.4 | 0.2 | -0.4 | 0.1 | 0.1 |
| Prices and Labor Cost | ||||||||||
| Consumer Price Index | 2.7 | 3.8 | 2.8 | 1.3 | 2.5 | 2.2 | 2.1 | 3.2 | 2.6 | 2.3 |
| Core | 3.4 | 4.2 | 3.2 | 1.9 | 2.5 | 2.5 | 2.4 | 4.0 | 3.0 | 2.4 |
| Employment Cost Index | 3.8 | 4.8 | 3.7 | 3.0 | 2.8 | 2.7 | 2.9 | 4.2 | 3.6 | 2.9 |
| Unemployment Rate (%, sa) | 3.7 | 3.8 | 4.0 | 4.3 | 4.5 | 4.5 | 4.6 | - | - | - |
| * Q4/Q4 change | ||||||||||
Source: J.P. Morgan
Financial markets forecast
| Credit Spread | Current | YE24 |
| 10-year SOFR swap spread (bp) | -44 | -37 |
| FNMA 30yr 6% Front Tsy OAS (bp) | 24 | 25 |
| 10yr conduit CMBS LCF AAA | 102 | 95 |
| 3-year AAA card ABS to Treasuries (bp) | 48 | 40 |
| JULI spread to Treasuries (bp) | 110 | 110 |
| High Yield Index | 363 | 380 |
| Emerging Market Index | 395 | 400 |
| Local currency: GBI-EM yield (%) | 6.27% | 5.58% |
cont.
| Current | YE24 | |
| S&P 500 (level) | 5635 | 4200 |
| Brent ($/bbl) | 79 | 83 |
| Gold ($/oz) | 2513 | 2281 |
| EUR/USD | 1.12 | 1.05 |
| USD/JPY | 144 | 149.5 |
Source: J.P. Morgan
Gross fixed-rate product supply*

Treasury client survey

Source: J.P. Morgan
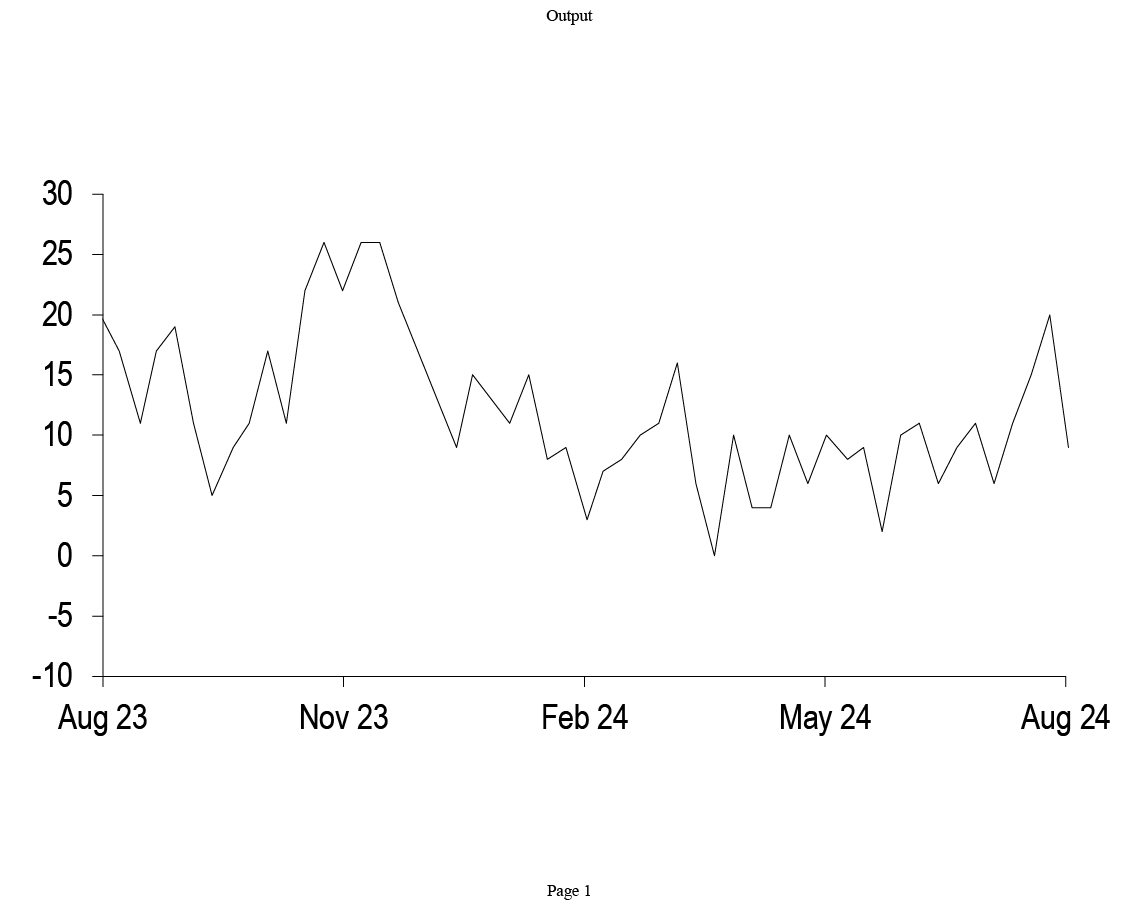
Source: J.P. Morgan
Treasury net issuance forecast
J.P. Morgan projection of net Treasury issuance to private investors, Federal Reserve purchases of Treasuries, and expected change in Treasuries held by private investors; $bn
| Year | Net privately-held borrowing | Fed secondary market purchases | Net change in privately-held debt | |||
| Bills | Coupons | Bills | Coupons | Bills | Coupons | |
| CY 2019 | 77 | 1133 | 169 | 77 | -92 | 1056 |
| CY 2020 | 2547 | 1752 | 157 | 2184 | 2390 | -432 |
| CY 2021 | -1195 | 2898 | 0 | 957 | -1195 | 1942 |
| CY 2022 | -37 | 1638 | 0 | 75 | -37 | 1563 |
| CY 2023 | 2047 | 1107 | 0 | 0 | 2047 | 1107 |
| CY 2024 | 400 | 1909 | 0 | 0 | 400 | 1909 |
Source: J.P. Morgan, US Treasury, Federal Reserve Bank of New York
T-bill weekly net issuance
Weekly net issuance of T-bills, historical and JPM projections; $bn
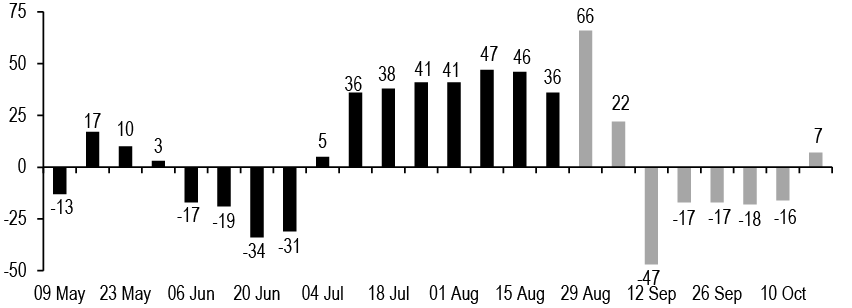
Source: J.P. Morgan
Dealer inventories
Primary dealer positions in Treasuries*, with 5-year statistics; $bn
| Maturity | Last | 1w chg | 5y avg | 5y min | 5y max | 5y z-score |
| T-bills | 81 | -8 | 53 | -4 | 119 | 1.1 |
| <2y | 14 | -10 | 33 | -17 | 96 | -0.7 |
| 2-3y | 16 | 2 | 5 | -14 | 18 | 1.9 |
| 3-6y | 70 | -8 | 29 | -2 | 78 | 2.4 |
| 6-7y | 21 | -3 | 13 | -4 | 29 | 1.2 |
| 7-11y | 32 | 0 | 4 | -10 | 32 | 3.5 |
| >11y | 48 | 0 | 46 | 27 | 62 | 0.3 |
| 11-21y | 27 | -3 | ||||
| >21y | 35 | 0 | ||||
| TIPS | 23 | -1 | 13 | 1 | 25 | 1.7 |
| FRNS | 22 | -5 | 7 | -14 | 29 | 2.2 |
| Total | 328 | -33 | 203 | 76 | 361 | 2.1 |
Source: Federal Reserve Board of New York
*Latest data as of 8/14/2024
Investor position technical indicators
Current value of various position indicators* versus 1 month ago; 1-year z-score
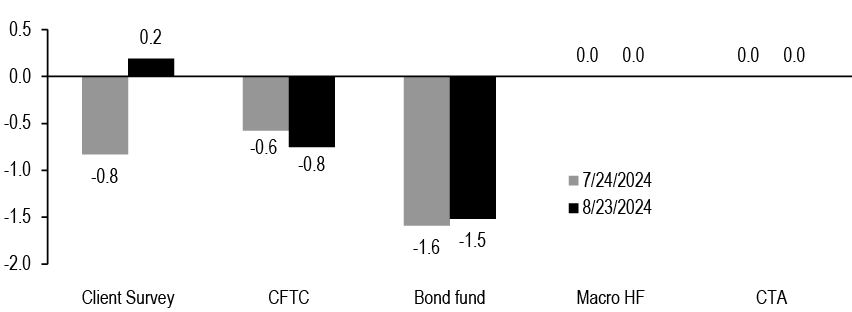
Source: CFTC, Bloomberg Finance L.P, SG, HFR, J.P. Morgan
* JPM Client Survey refers to a 4-week moving average of our Treasury Client Survey Index; (Longs+Neutrals)/(Shorts+Neutrals), see Survey Says: Using the Treasury Client Survey to predict rates moves, 7/21/23for more details. CFTC refers to the non-commercial net longs in UST and SOFR futures contracts reported by the CFTC. CTA beta is the four-week partial beta of SG CTA Index to 10-year UST yields. Real money beta is the eight-week partial beta of excess returns of the 20 largest actively managed US core bond funds to 10-year UST yields. Macro HF beta is the six-week partial beta of HFRX Macro/CTA Index to 10-year UST yields
Treasury market functioning metrics
Various metrics of Treasury market functioning; units as indicated
| Indicator | Today | 1w chg | 1y avg | 1y min | 1y max | 1y z-score |
| Duration weighted mkt depth*; $mn | 213 | -16.8 | 215 | 94 | 308 | -0.1 |
| 10y price impact**; 32nds | 0.7 | -0.1 | 0.8 | 0.4 | 1.1 | -0.4 |
| 1m GC/OIS; bp | 18.9 | 4.3 | 7 | 0.7 | 18.9 | 3.5 |
| UST curveRMSE***; bp | 0.0 | -1.5 | 1.4 | 0.0 | 1.7 | -7.3 |
| 10s/3x old 10s ASW; bp | -0.5 | 0.1 | -1.1 | -3.1 | 0.7 | 0.7 |
| 30s/3x old 30s ASW; bp | 1.1 | -0.6 | -0.3 | -2.1 | 1.8 | 1.6 |
Source: J.P. Morgan, BrokerTec
* Market depth is the sum of the three bids and offers by queue position, averaged between 8:30 and 10:30am daily
** Price impact defined as the average move in order book mid-price against a $100mn flow in traded notional. See Drivers of price impact and the role of hidden liquidity, J. Younger et al., 1/13/17 for more details.
*** Root Mean Square Error of J.P. Morgan par fitted Treasury curve (see The (par) curves they are a-changin’, 7/23/24)
Select Federal Reserve balance sheet items
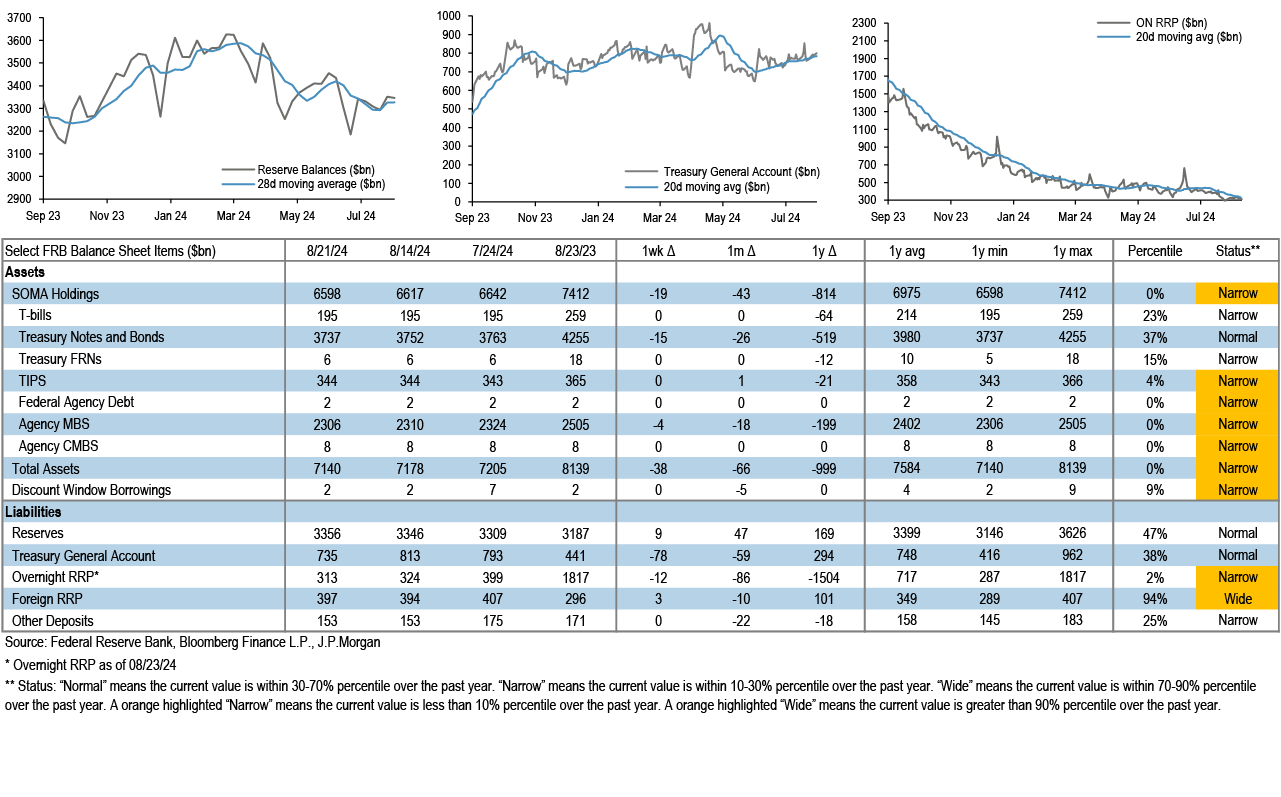
Money market funds
Assets under management ($bn)
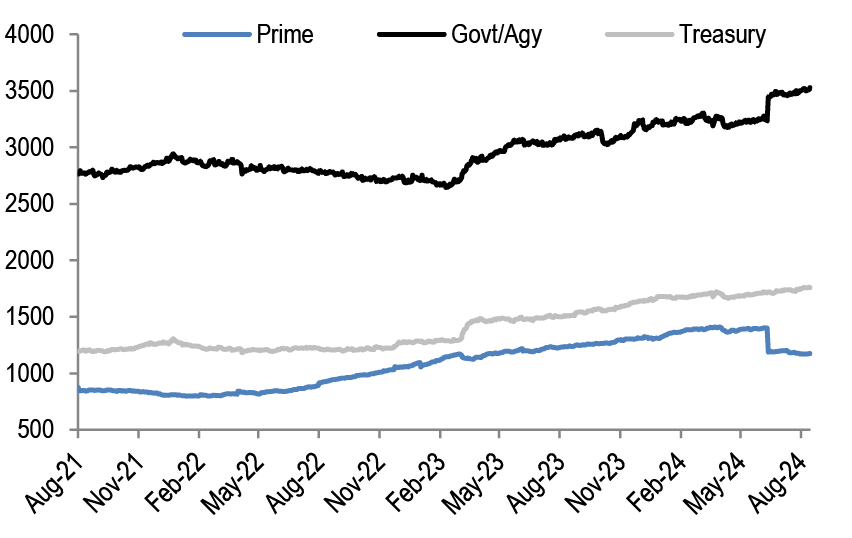
Weighted average maturity (days)
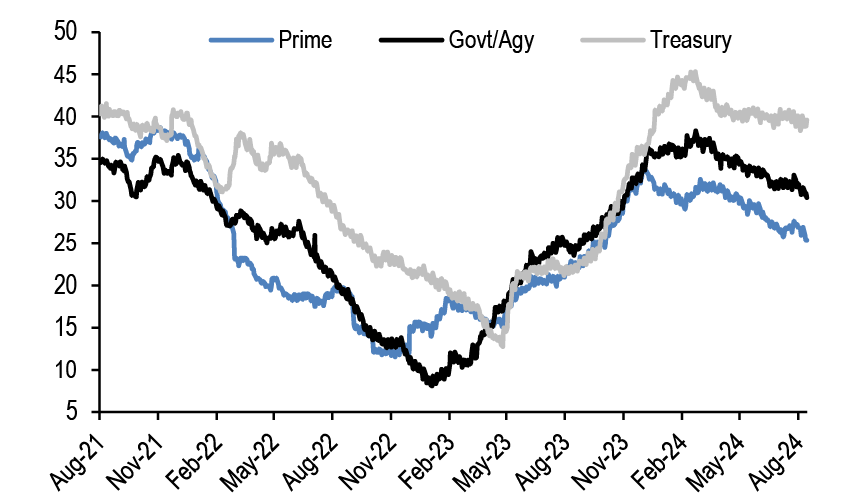
Source: Crane Data, J.P. Morgan
US funds flows
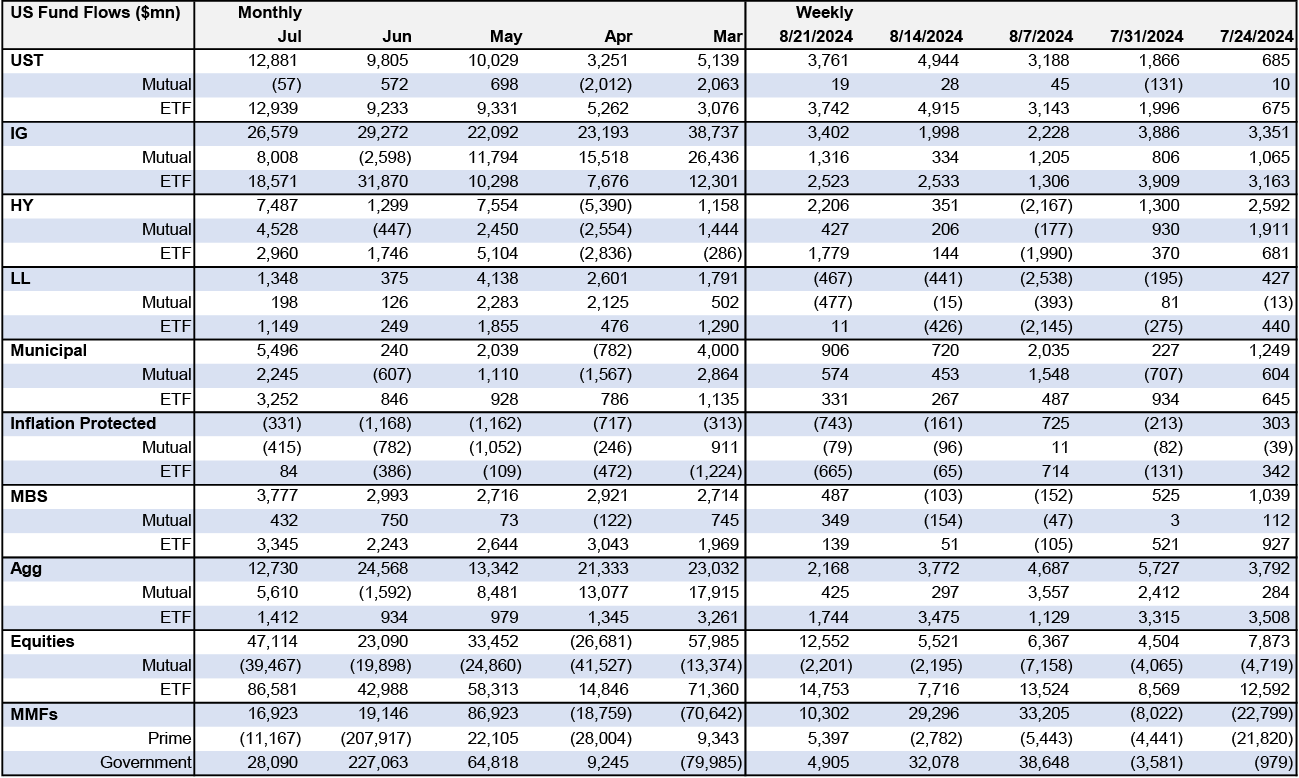
Source: EPFR, Crane Data, J.P. Morgan
Market Movers Calendar
| Monday | Tuesday | Wednesday | Thursday | Friday |
|---|---|---|---|---|
| 26 Aug Durable goods(8:30am) Jul 6.5% Ex. transportation -0.1% Dallas Fed manufacturing(10:30am) Aug
San Francisco Fed President Daly speaks(2:00pm) |
27 Aug FHFA HPI(9:00am) Jun, 2Q S&P/Case-Shiller HPI(9:00am) Jun, 2Q Richmond Fed survey(10:00am) Aug Consumer confidence(10:00am) Aug 101.0 Dallas Fed services(10:30am) Aug
Auction 2-year note $69bn |
28 Aug Auction 2-year FRN (r) $28bn Auction 5-year note $70bn
Fed Governor Waller speaks(1:15am) Atlanta Fed President Bostic speaks(6:00pm) |
29 Aug Real GDP(8:30am) 2Q second 2.9% Advance economic indicators(8:30am) Jun Trade balance -$98.0bn Wholesale inventories 0.4% Retail inventories 0.9% Initial claims(8:30am) w/e Aug 24 225,000 Pending home sales(10:00am) Jul -1.0%
Auction 7-year note $44bn
Atlanta Fed President Bostic speaks(3:30pm) |
30 Aug Personal income(8:30am) Jul 0.2% Real consumption 0.2% Core PCE deflator 0.12% (2.6%oya) Consumer sentiment(10:00am) Aug final 68.0 |
| 2 Sep Labor Day, markets closed |
3 Sep Manufacturing PMI(9:45am) Aug final ISM manufacturing(10:00am) Aug Construction spending(10:00am) Jul |
4 Sep International trade(8:30am) Jul JOLTS(10:00am) Jul Factory orders(10:00am) Aug Beige book(2:00pm) Light vehicle sales Aug |
5 Sep ADP employment(8:15am) Aug Productivity and costs(8:30am) 2Q Initial claims(8:30am) w/e Aug 31 Services PMI(9:45am) Aug final ISM services(10:00am) Aug
Announce 3-year note $58bn Announce 30-year bond (r) $22bn Announce 10-year note (r) $39bn |
6 Sep Employment(8:30am) Aug
New York Fed President Williams speaks(8:45am) |
| 9 Sep Wholesale trade(10:00am) Jul Consumer credit(3:00pm) Jul |
10 Sep NFIB survey(6:00am) Aug QFR(10:00am) 2Q
Auction 3-year note $58bn |
11 Sep CPI(8:30am) Aug QSS(10:00am) 2Q
Auction 10-year note (r) $39bn |
12 Sep PPI(8:30am) Aug Initial claims(8:30am) w/e Sep 7 Federal budget(2:00pm) Aug
Auction 30-year bond (r) $22bn Announce 20-year bond (r) $13bn Announce 10-year TIPS (r) $17bn |
13 Sep Import prices(8:30am) Aug Consumer sentiment(10:00am) Sep preliminary |
| 16 Sep Empire State survey(8:30am) Sep |
17 Sep Retail sales(8:30am) Aug Business leaders survey(8:30am) Sep Industrial production(9:15am) Aug NAHB survey(10:00am) Sep Business inventories(10:00am) Jul
Auction 20-year bond (r) $13bn |
18 Sep Housing starts(8:30am) Aug FOMC meeting(2:00pm) Sep TIC data(4:00pm) Jul |
19 Sep Current account(8:30am) 2Q Initial claims(8:30am) w/e Sep 14 Philadelphia Fed manufacturing(8:30am) Sep Existing home sales(10:00am) Aug Leading indicators(10:00am) Aug
Auction 10-year TIPS (r) $17bn Announce 5-year note $70bn Announce 2-year note $69bn Announce 7-year note $44bn Announce 2-year FRN (r) $28bn |
20 Sep |
Source: Private and public agencies and J.P. Morgan. Further details available upon request.
- 1
McDash has a “next loan” table that identifies the loan characteristics of a subsequent loan linked to the borrower’s original loan. This is property-linked, meaning that we can only identify the “next loan” in the case of refi transactions on the same property. - 2
Please see 2024 J.P. Morgan Automotive Conference Takewaways (August 12, 2024) from our Auto Equity and Credit Research teams for a summary of the discussions with various senior management and industry experts