Equity Strategy
Open UW in Banks, add to Healthcare; Peripheral views; Earnings season update
- We are advising to open a short in European Banks, we move the sector from Neutral to UW. Banks have been one of the best performers in the past 6 months, second only to Energy, are ahead nicely ytd, up 8% vs SXXP at 1%, to be cumulatively ahead by 60% since Sept 2020. Now that most of the Banks sector Q3 earnings updates are out of the way, we believe that it is a good time to move UW in Europe.
- If the bond yields are in the process of peaking this quarter, as we suspect – see our recent report on locking in the duration trade, then Banks could start to struggle. After all, the Banks rally was underpinned by the sharp move up in bond yields over the past 3 years, with German 10 year moving from -0.5% to 3%, and US 10 year from 1% to 5%. Any potential fall in yields, or the ECB cuts next year, will reduce Banks’ profitability.
- Further, Banks’ deposit base is likely to fall, and with rising deposit betas their net interest income is likely peaking now. The unwind of PEPP, TLTROs and QT, along with a potential change in reserve requirements, could be the concerns. From the regulatory side, the sector might not enjoy as favourable a backdrop as it did recently, with buybacks and capital return to shareholders as good as they get. Also, the risk of punitive taxes is elevated – it is being discussed in a number of countries.
- Finally, Banks remain much more levered than any other sector, and are a beta play on overall activity. Banks could suffer if economies enter contraction, and if some of the very benign credit backdrop changes next year, with spreads widening and delinquencies rising. Regionally, we maintain our preference for Japanese over US and European banks. We are using the funds to upgrade Healthcare, from Neutral to OW. The sector has lagged this year, but could benefit from high USD exposure, low beta and the long duration angle.
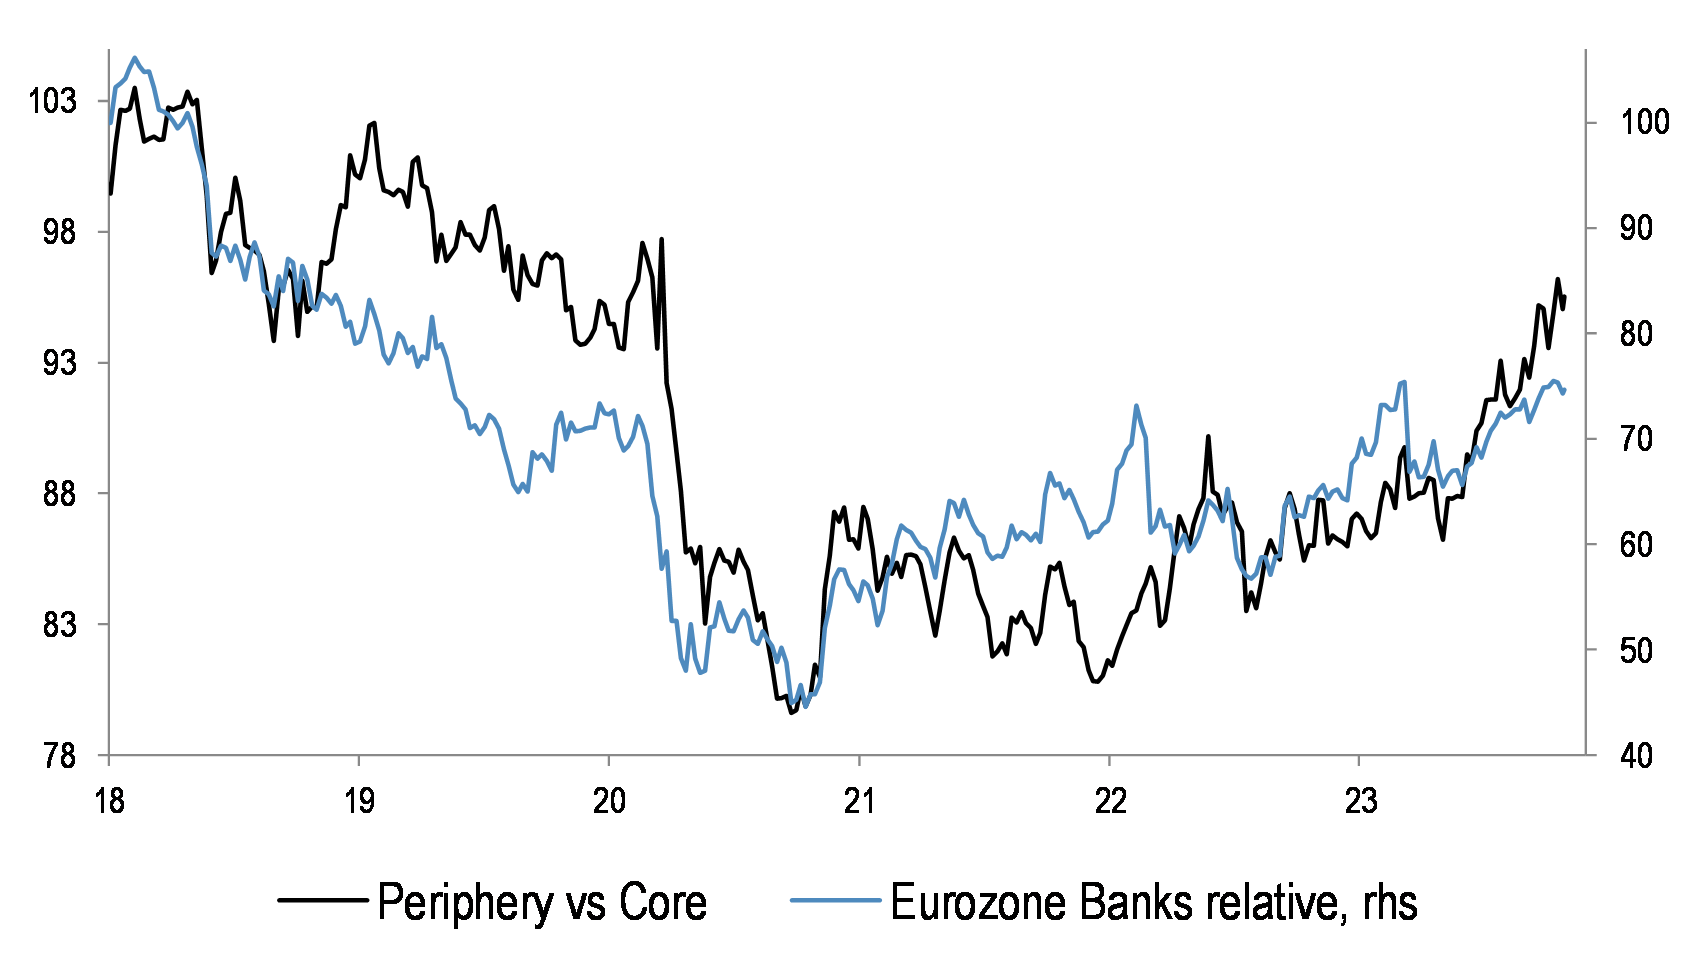
- If Banks start to lag, then the periphery could fall behind core markets. Periphery nicely outperformed the core for a while, Italy is top European performer ytd, up 15%, but Banks relative and peripheral markets relative performances remain very strongly correlated. Within periphery, one could open the Spain vs Italy trade. Spain could benefit from greater Latam exposure, where we remain constructive on Mexico and Brazil, while Italy could see some further widening in government spreads.
- Looking at the current reporting season, we note an increased share of profit warnings, and topline deterioration – bottom chart. After a long string of robust bottom-up results, it appears that earnings are starting to be more challenging – see our Q3 preview for more details.
- We remain bearish on the market direction, and our sector positioning stays the barbell of commodities – led by Energy, and the bond proxies – such as Utilities and Staples, which are catching up post the earlier poor performance. This is likely to continue if the long duration trade takes hold, and if the earnings momentum for the overall market deteriorates.
European Banks have outperformed the market by 60% over the past 3 years, helped by rising earnings and bond yields… this could be changing…
…periphery likewise was ahead of the core in the last 3 years… if Banks stop working, periphery will too…
…the latest reporting season is showing the worst topline surprises in Europe on recordSource: Datastream, J.P. Morgan, Bloomberg Finance L.P.
Anamil Kochar (anamil.kochar@jpmchase.com) of J.P. Morgan India Private Limited is a co-author of this report
Open UW in Banks, add to Healthcare; Peripheral views; Earnings season update
Figure 1: Stoxx600 sectors last 6m performance
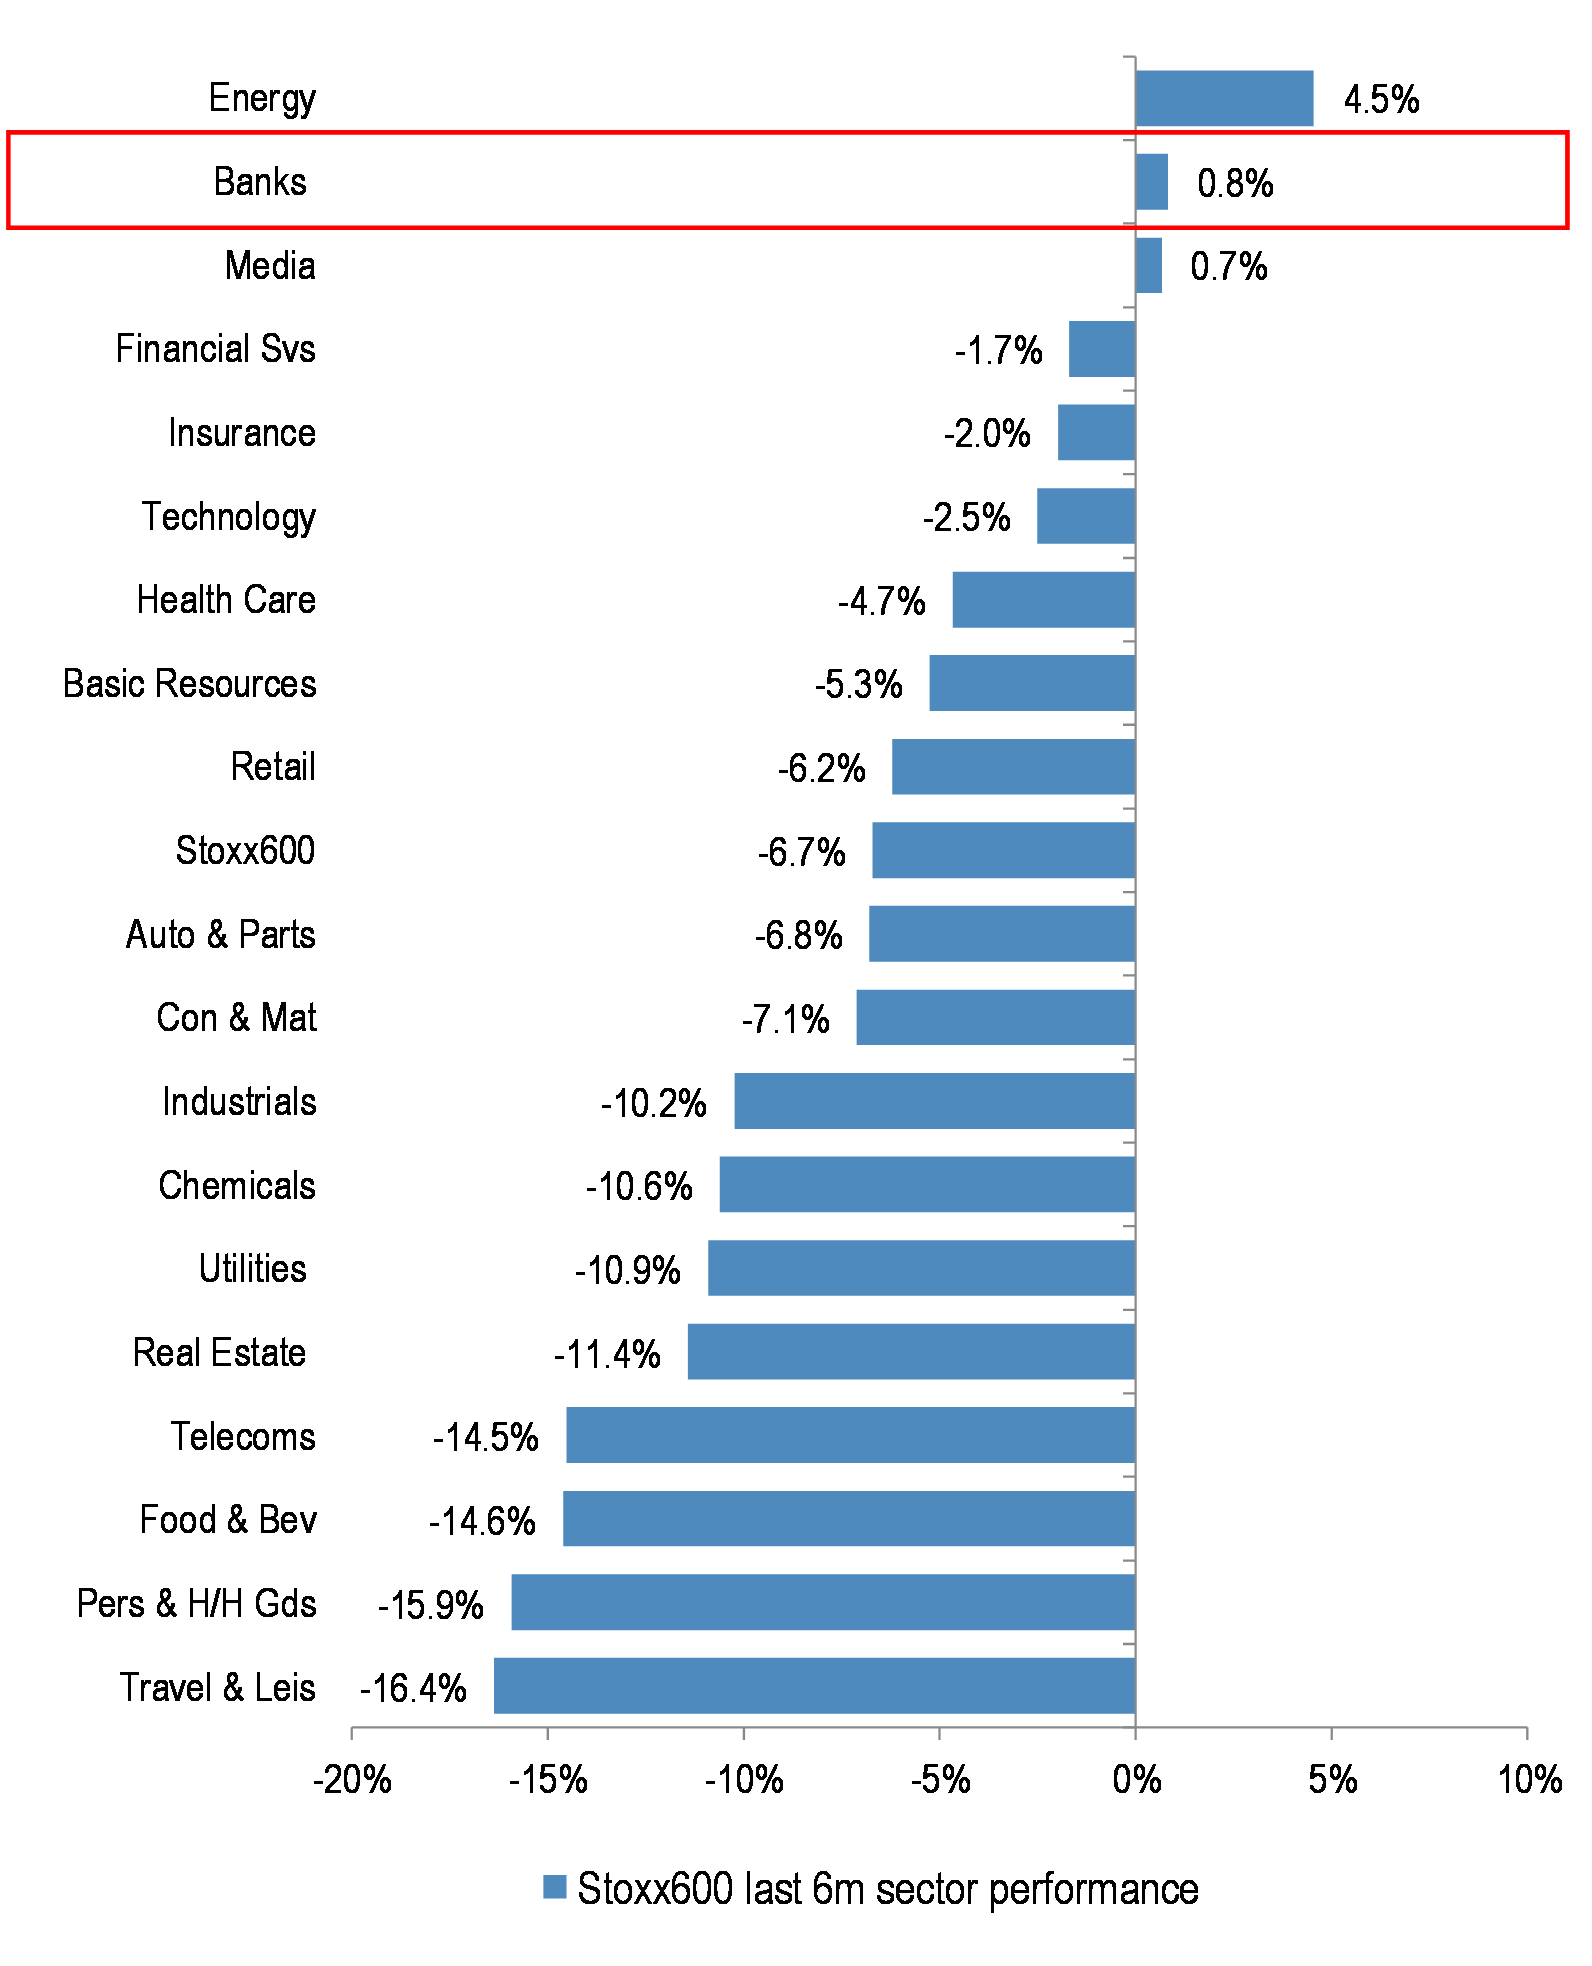
European Banks have been one of the best performing sectors in the last 6 months, only behind Energy.
Figure 2: Eurozone Banks relative
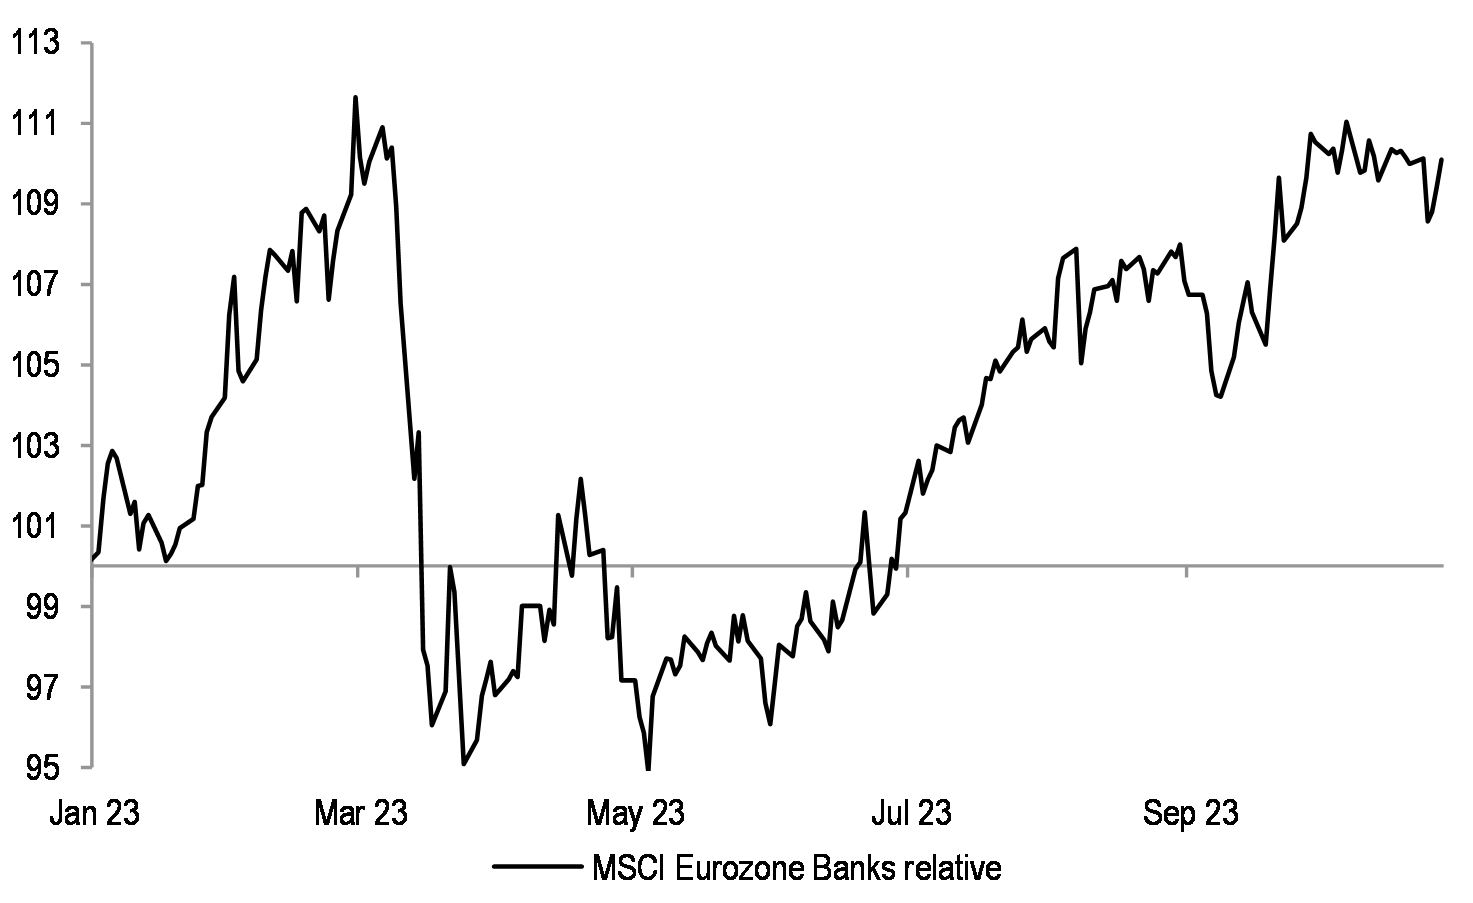
Eurozone Banks in particular are trading around ytd relative highs at present.
Figure 3: MSCI Europe Banks relative and EPS relative
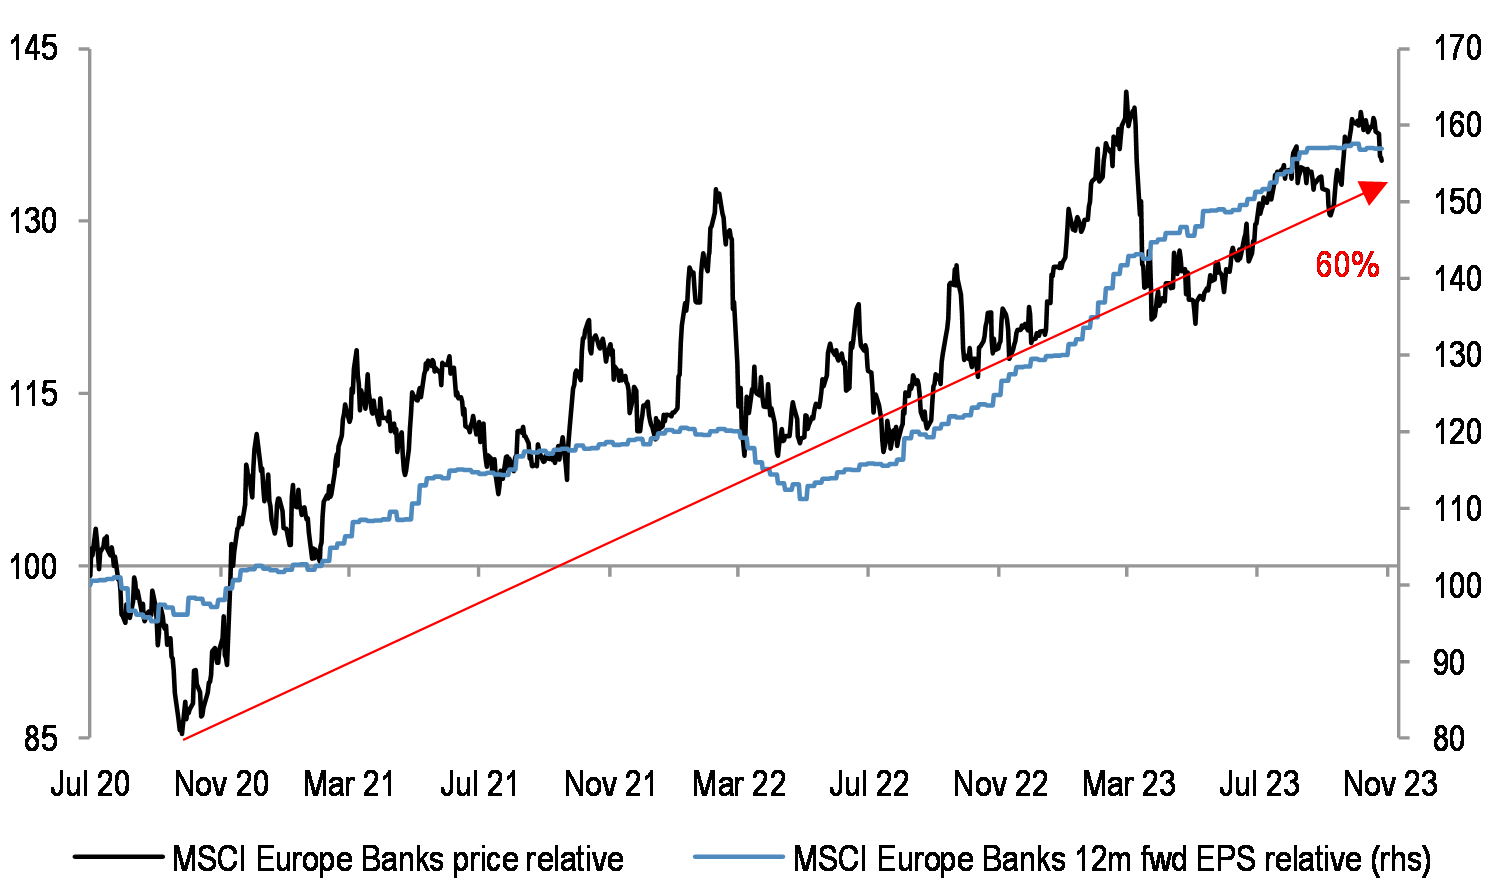
European Banks are up 8% ytd, vs SXXP at 1%. The group has seen a substantial 60% outperformance since the lows in September ’20, helped by rising earnings.
Table 1: Past periods of MSCI Europe Banks outperformance
| Start date | End date | Duration (years) | MSCI Europe Banks outperformance (%) |
| 03-Jun-96 | 22-Apr-98 | 1.9 | 37.2% |
| 10-Mar-00 | 07-Jan-05 | 4.8 | 70.1% |
| 24-Jul-12 | 15-Jan-14 | 1.5 | 30.2% |
| 25-Sep-20 | 20-Oct-23 | 3.1 | 61.4% |
Source: Datastream
Past periods of Banks outperforming the market have not tended to be much greater in magnitude, nor in duration, vs the current one.
We believe that the benefits of higher rates are likely now behind us, and NII for Banks is set to peak out. We use this opportunity to downgrade Banks to UW in Europe.
Rates remain a key driver for the sector… the potential peak in bond yields could hurt Banks’ performance
Figure 4: European Banks relative vs US 10Y bond yield
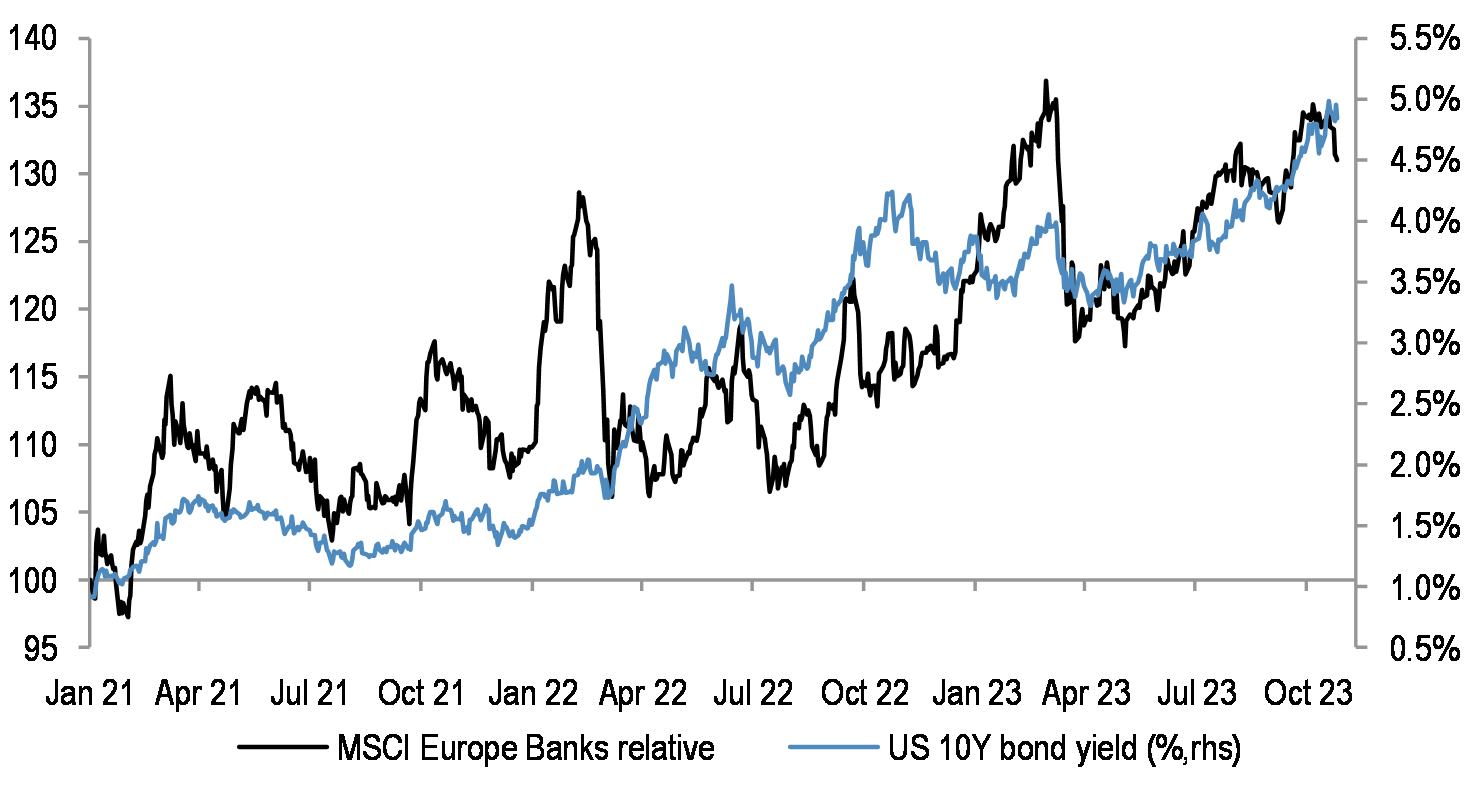
The rally in Banks coincided with the move up in German 10 year bond yields from -0.5% to 3%, and US from 1 to 5%.
Figure 5: European sectors correlation to bond yields
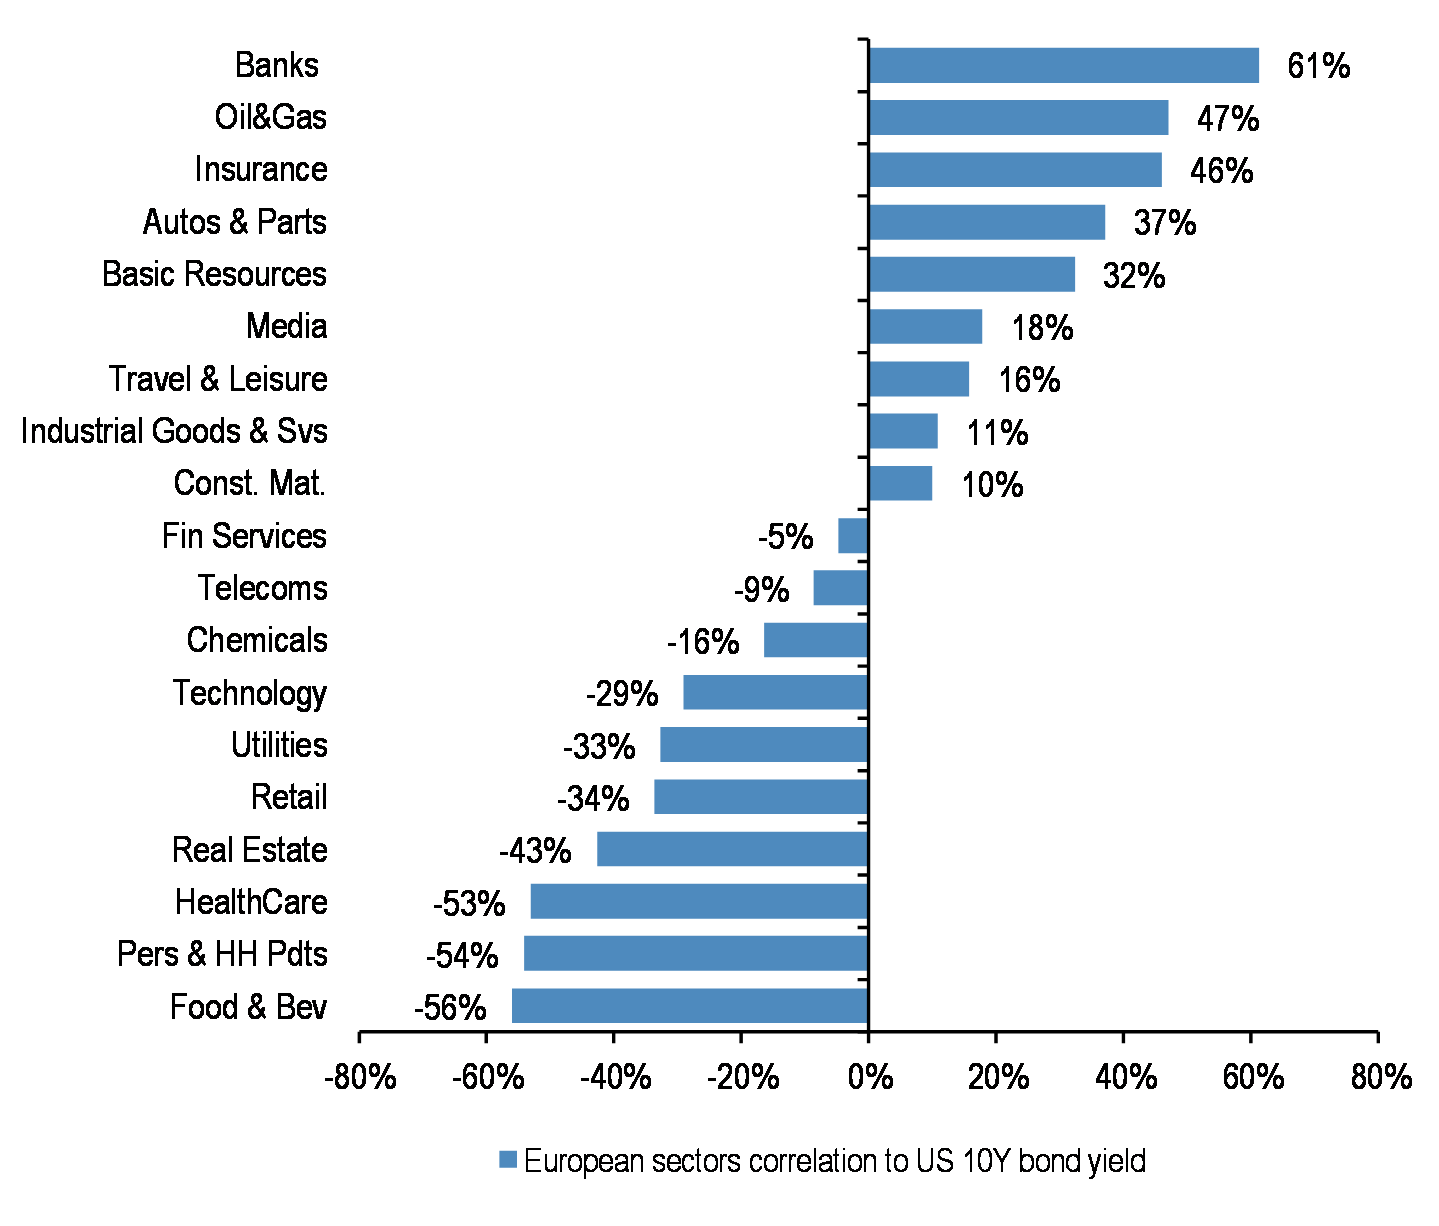
The group traditionally displays the most positive correlation to bond yields. If bond yields peak out, or if ECB cuts rates next year, Banks stocks’ profitability is likely to weaken.
Figure 6: Implied Rate - ECB
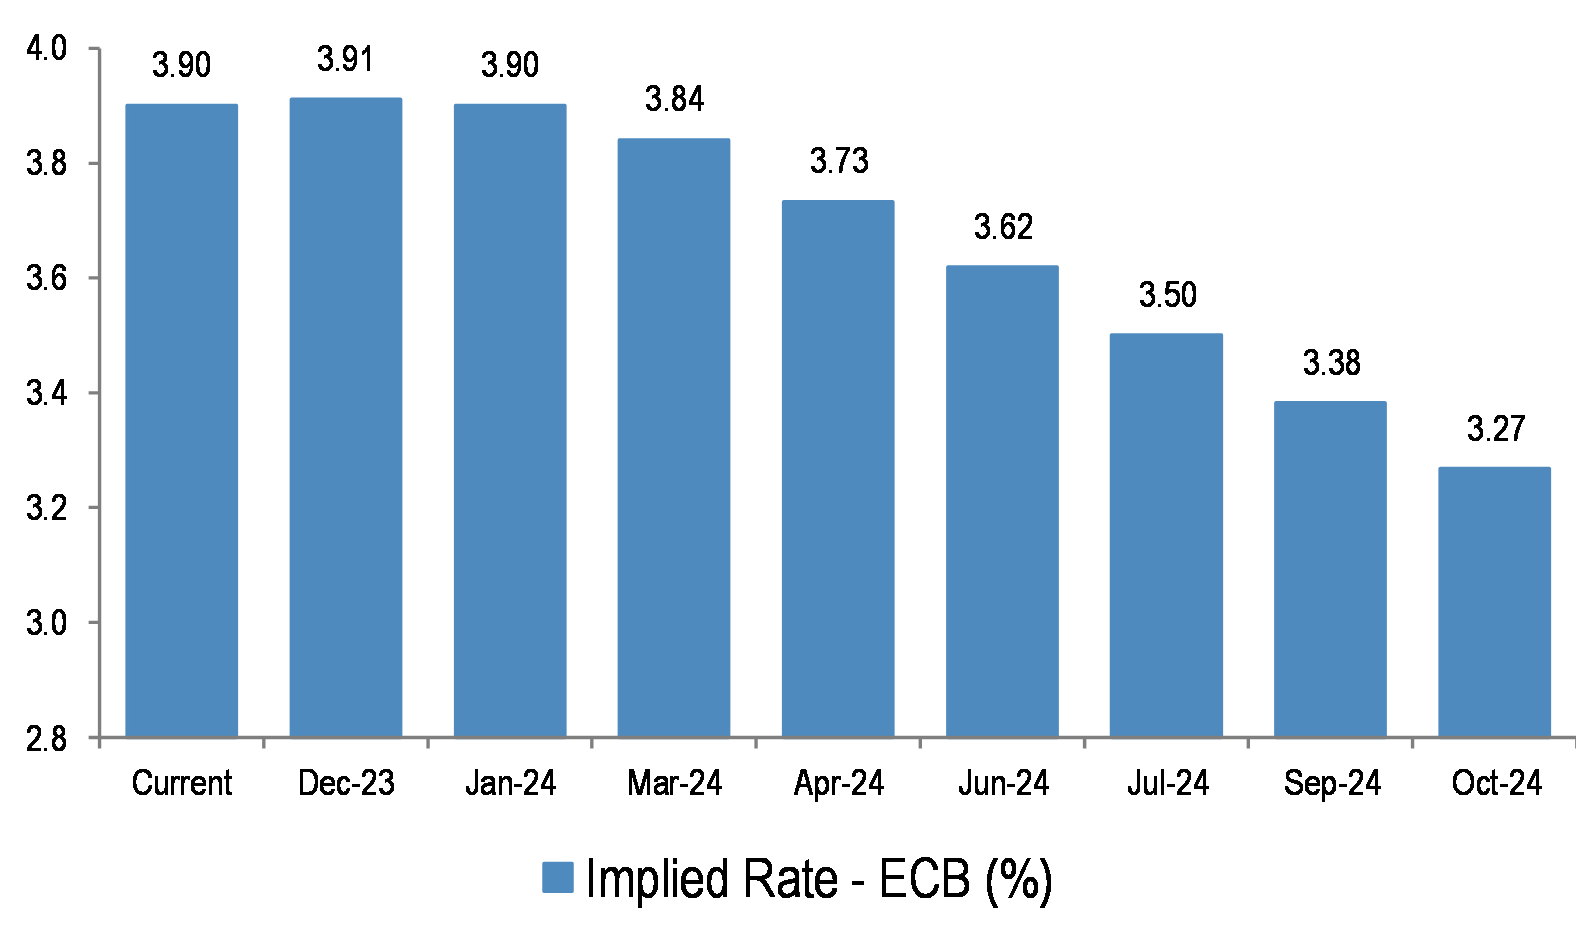
Our European Banks Research team estimates that a 25 bp rate cut, if it is translated across the curve, would result in a 5% cut in 2025 EPS, assuming a deposit beta of 25%. They flag that this is currently not discounted in consensus estimates – see report.
The sector could face a number of regulatory and other risks
Table 2: Long-Medium Term JPM deposit beta
| Country | Long-medium term Deposit Beta |
| UK | 50% |
| France | 50% |
| Netherlands | 50% |
| Germany | 35% |
| Spain | High 30 – 50% |
| Portugal | High 30 – 50% |
| Italy | 30 - 40% |
| Nordics | 60-70% |
Source: J.P. Morgan. European Banks Research
A rise in deposit betas is likely to be a meaningful headwind to the sector.
Figure 7: Average 3m and 12m fwd. Euribor
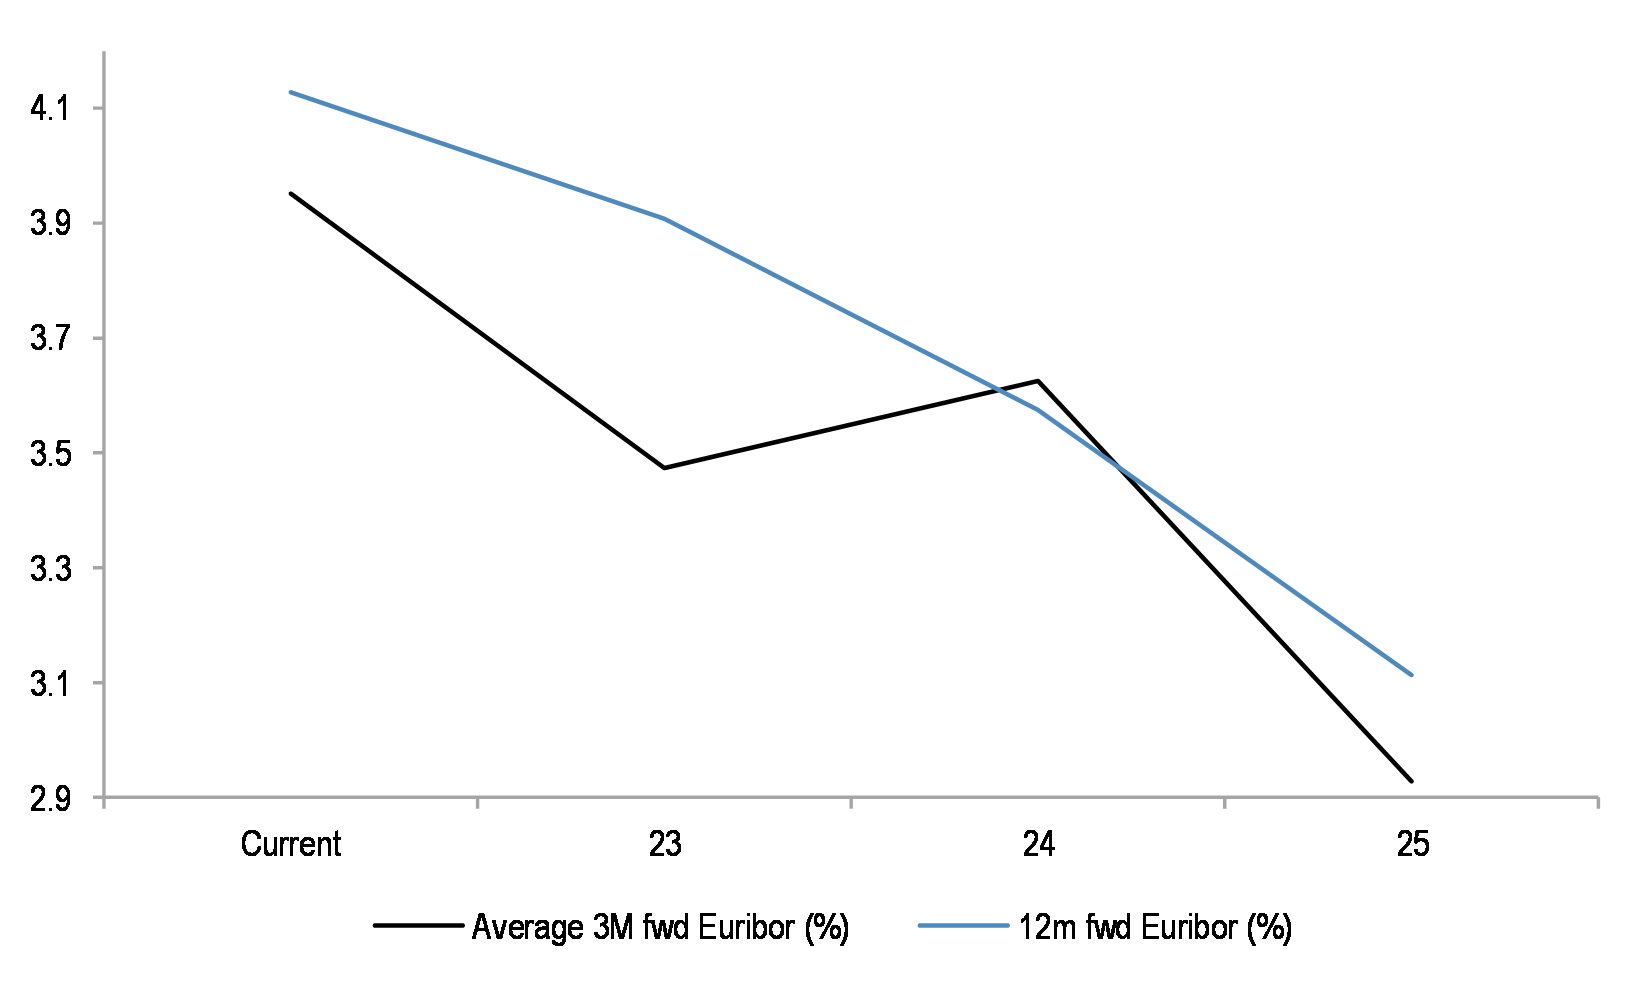
Our Banks analysts expect sector NII to peak by the end of this year, as deposit betas rise, Euribor curve falls, and with the potential increase in minimum reserve requirements.
Figure 8: US Deposits, all Commercial Banks
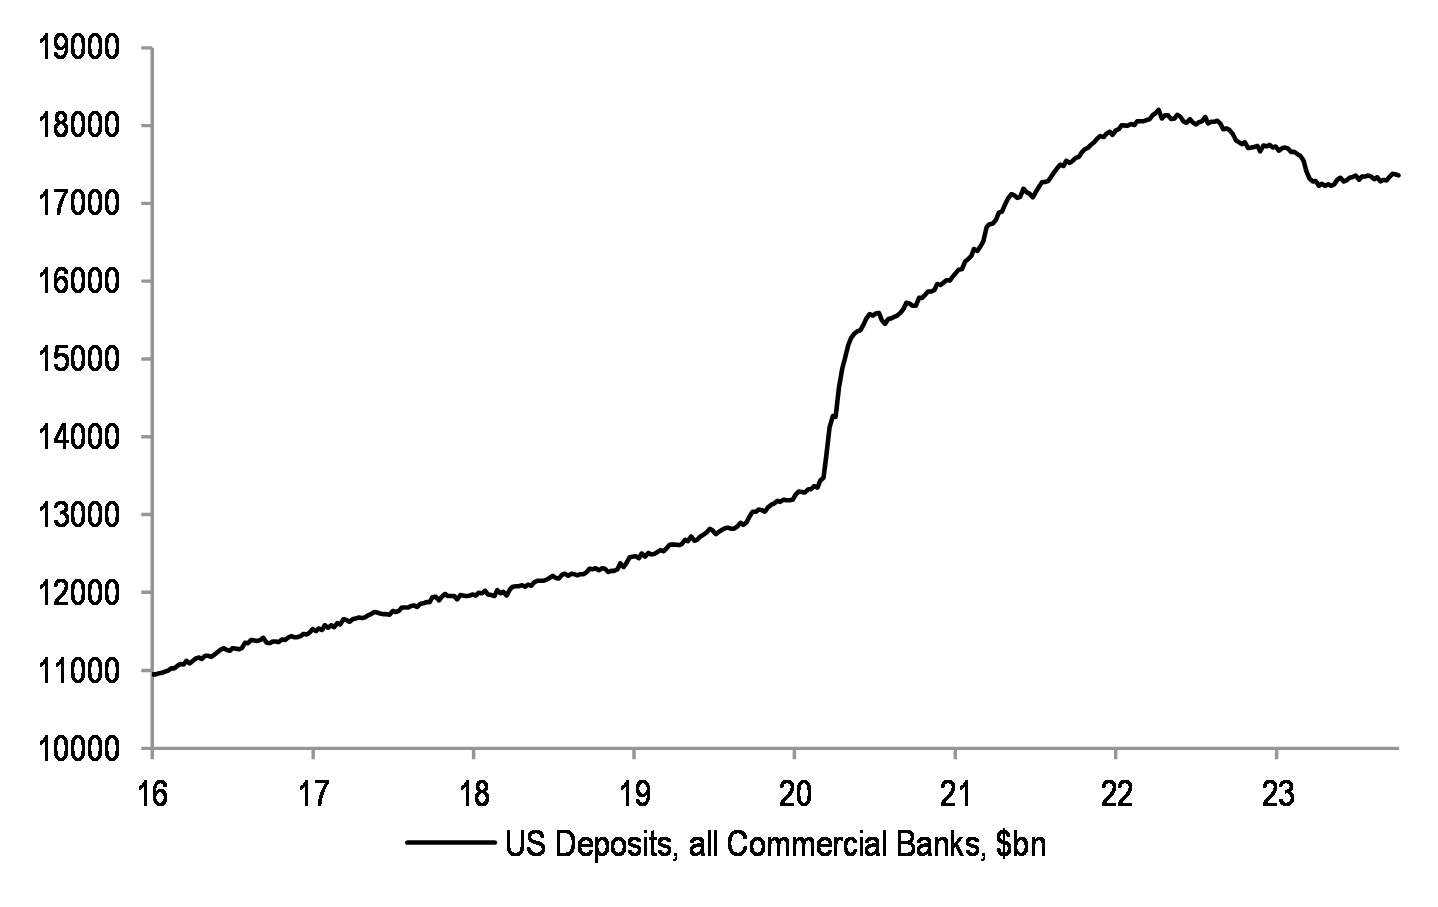
In addition, they flag that the deposit base is likely to keep falling, both in Eurozone and in the US.
Figure 9: ECB Balance Sheet
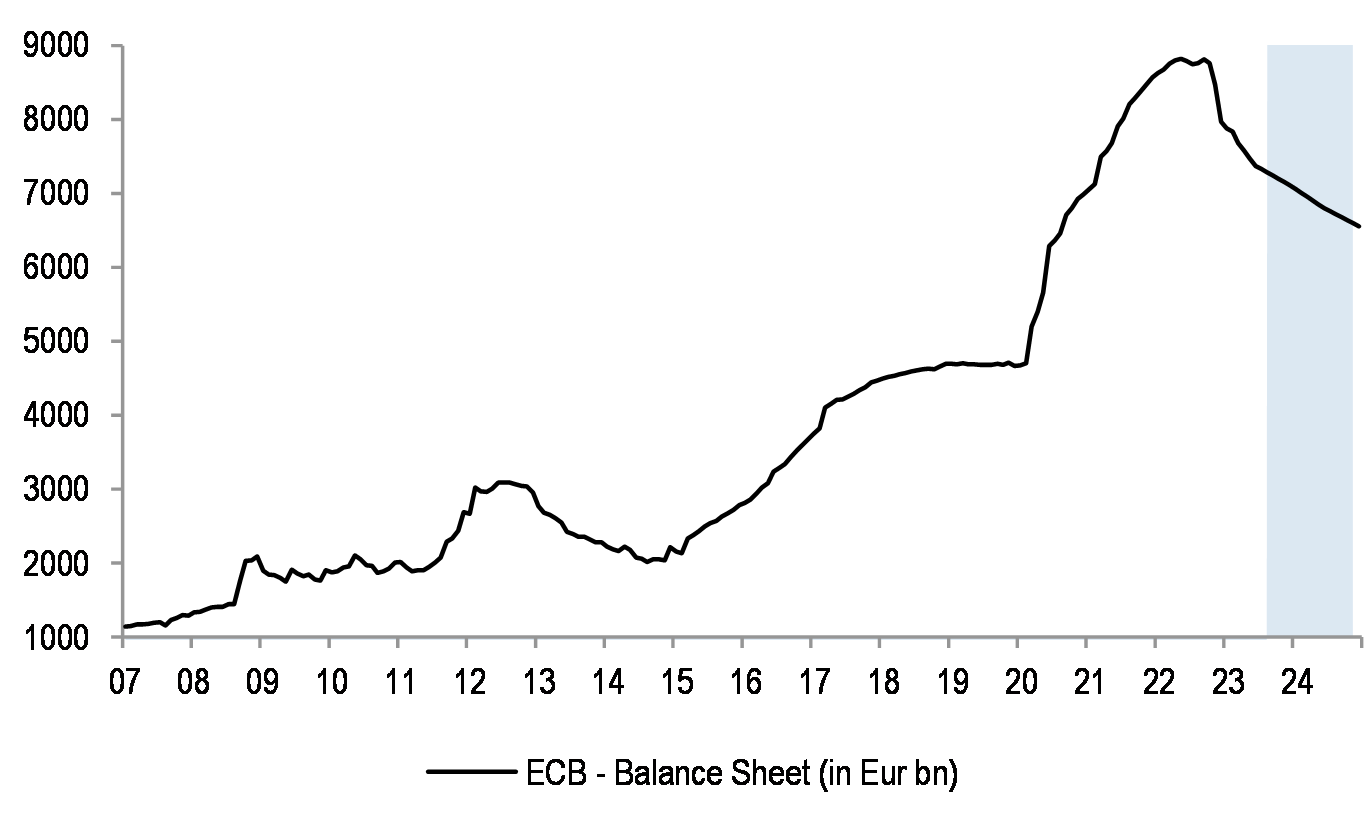
The ongoing QT is likely to further hurt deposit growth.
Table 3: Central Bank QT Programmes
| QT Programmes | |
| ECB | - APP (Asset purchase programme) - no longer reinvests the principal payments from maturing securities - PEPP (Pandemic emergency purchase programme) - reinvest the principal payments from maturing securities purchased under the programme until at least the end of 2024 (although the Governing Council will continue applying flexibility in reinvesting redemptions coming due in the PEPP portfolio) |
| BOE | BOE total gilt holdings have fallen from a peak of £875bn to £780bn today, and announced in the last monetary policy meeting, that they would increase the pace of quantitative tightening from £80bn to £100bn a year. |
| US Fed | Continues to sell holdings of US Treasuries and mortgage-backed securities(MBS) at a rate of US$95 billion per month (o.w. $60bn treasuries, $35bn MBS) |
Source: Bloomberg Finance L.P.
The pace of QT is likely to pick up in most regions.
Table 4: Bank Taxes announced in Europe
| Region | Financial Impact | Details |
| Italy | ISP and UCG opt out from paying the tax and will boost capital instead. For BAMI, expect ~12% impact on earning if they decide to pay the tax. | The tax is based on 40% of excess NII with a cap at 0.26% of RWAs, non-tax deductible, with an option to opt out if banks boost non-distributable reserves by 2.5x tax. |
| Spain | Ranging from ∼2-3% for SAN and BBVA to ∼10-14% for the domestic banks | The Spanish banking tax is a 4.8% tax on domestic Spanish NII and fees on banking income (insurance income is excluded), on top of existing corporate tax rate for banks at 30% (vs 25% for corporates). The tax is non-tax deductible. Some recent press articles suggest that the tax could potentially be extended. |
| Sweden | ∼4-5% net income impact from SEB, SHB and Swedbank | Liabilities linked to the domestic Swedish operations that exceed a set threshold limit set at the start of the fiscal year (2022: SEK150bn, and will increase annually based on an index). All liabilities within a group are included with the exception of intra-group debt, provisions and untaxed reserves, and debt not linked to the Swedish operations-at a tax rate of 0.05% of the tax base for 2022, and 0.06% for 2023 and onwards. |
| Denmark | ∼4-5% net income impact from Danske and Jyske | Corporate tax rate effectively increased to 25.2% in 2023 and 26% from 2024 for companies in the financial sector. |
Source: J.P. Morgan. European Banks Research
In addition, there is a rising risk from new/extended bank taxes, and pressure from governments to increase deposit remuneration. A number of countries have recently introduced tax measures on the banking sector, including Italy, Spain, Sweden, Denmark, Lithuania, Hungary, among others, with more countries likely to follow suit.
Figure 10: European sectors dividend yield
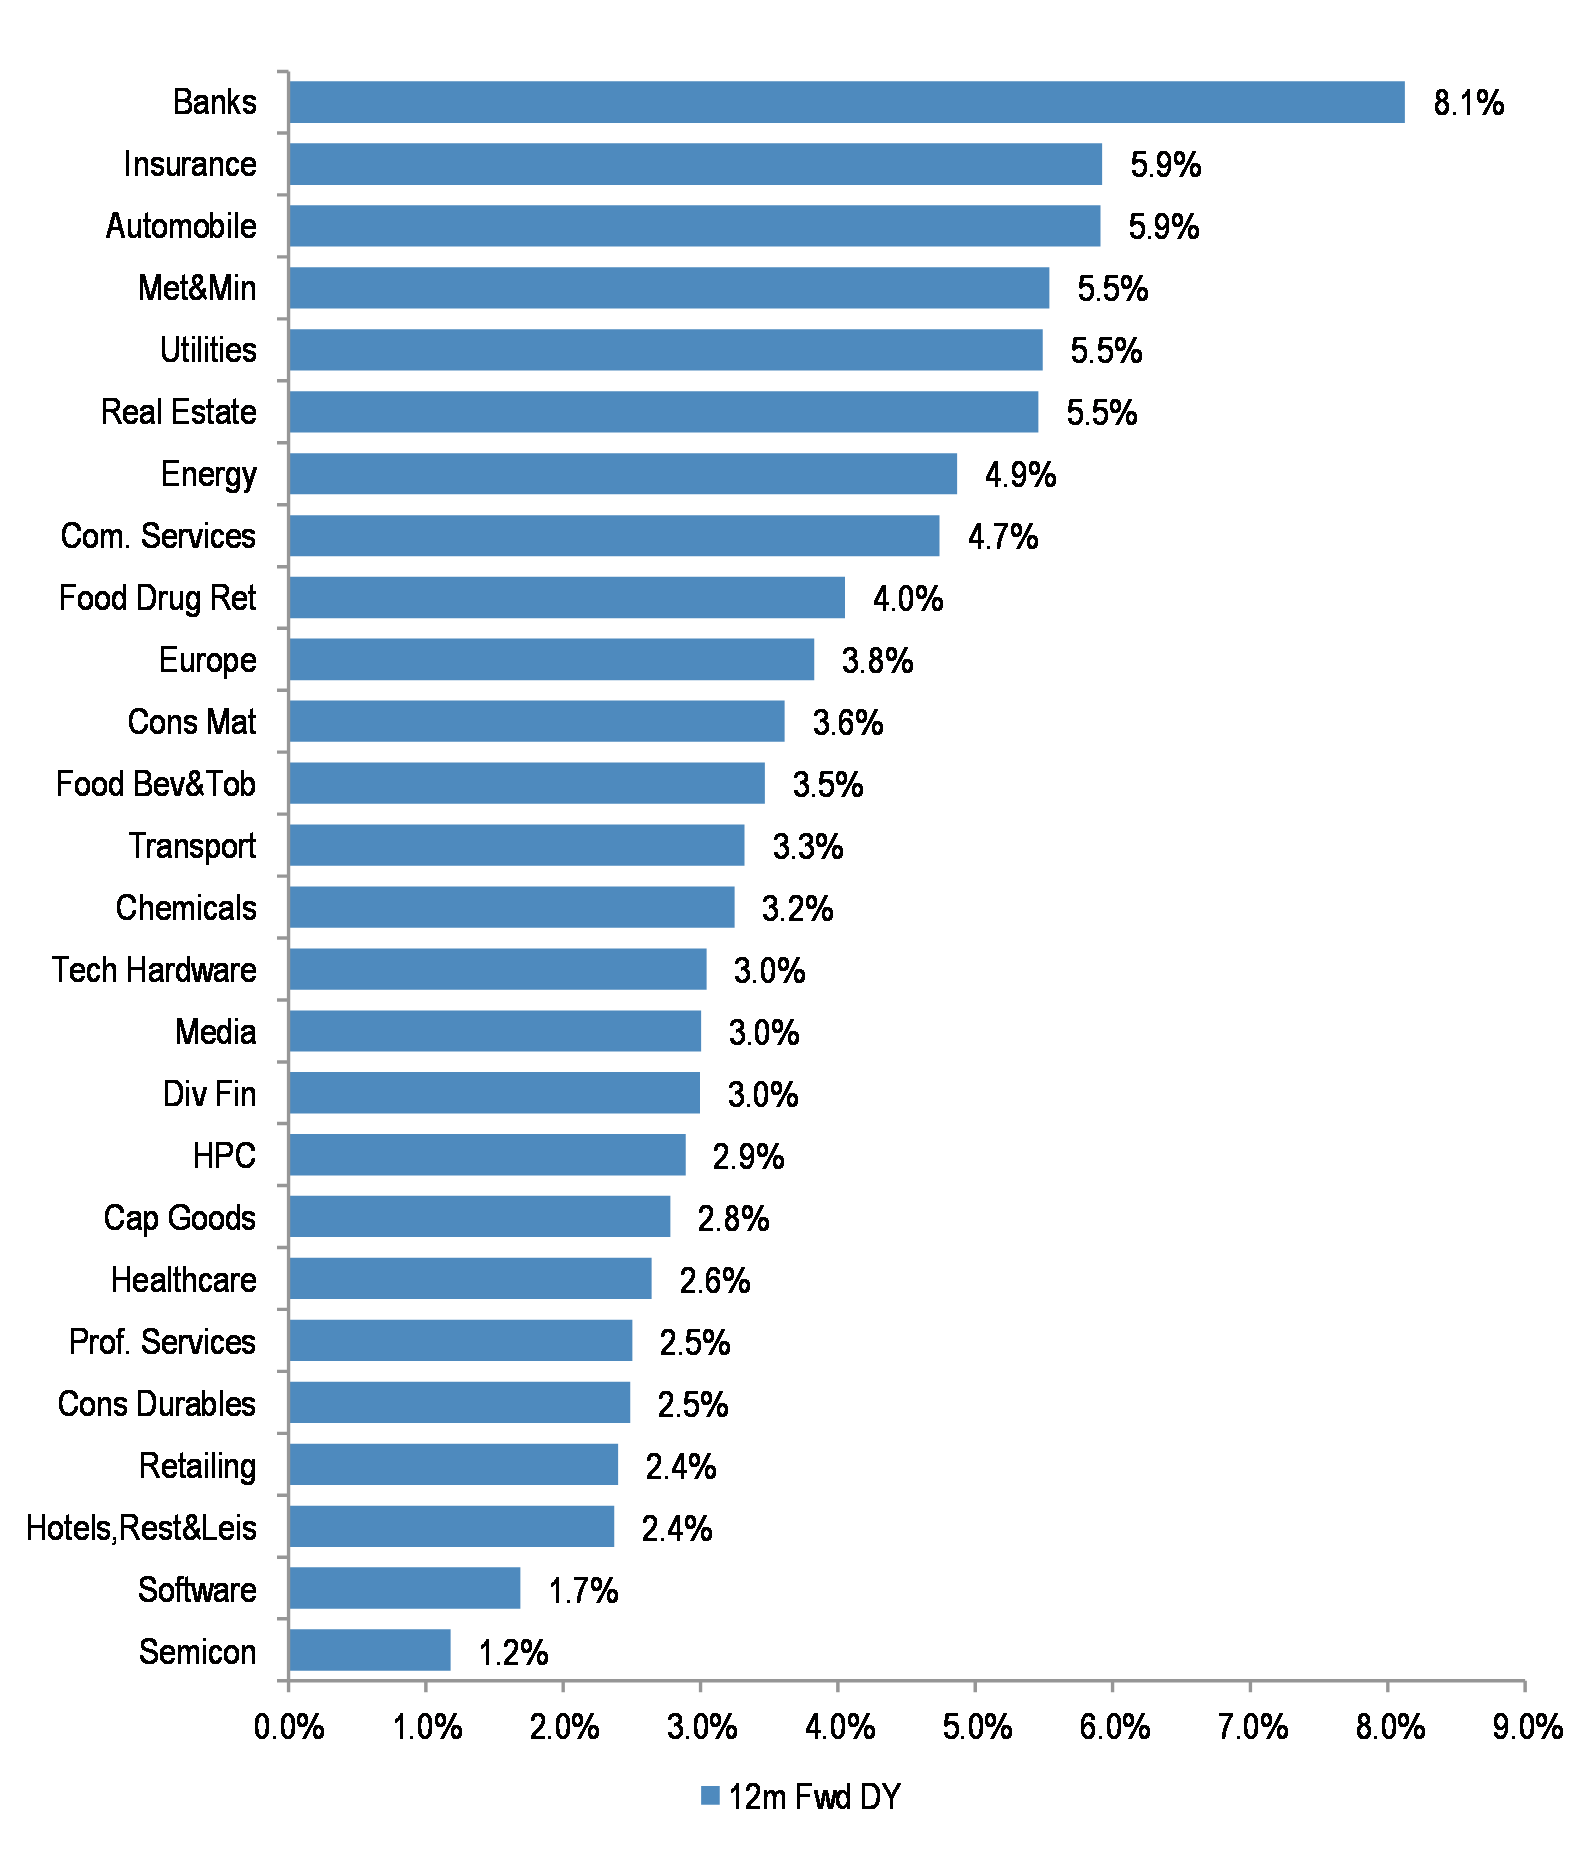
Total return yield for Banks stocks is the highest among all sectors, with both dividend yield and buybacks yield relatively elevated. However, dividends and buybacks are unlikely to be safe if the credit or macro environment weakens, or if the regulatory scrutiny increases.
Banks are a beta play on overall activity, and could suffer if the economy enters contraction…
Figure 11: European Banks Asset to Equity
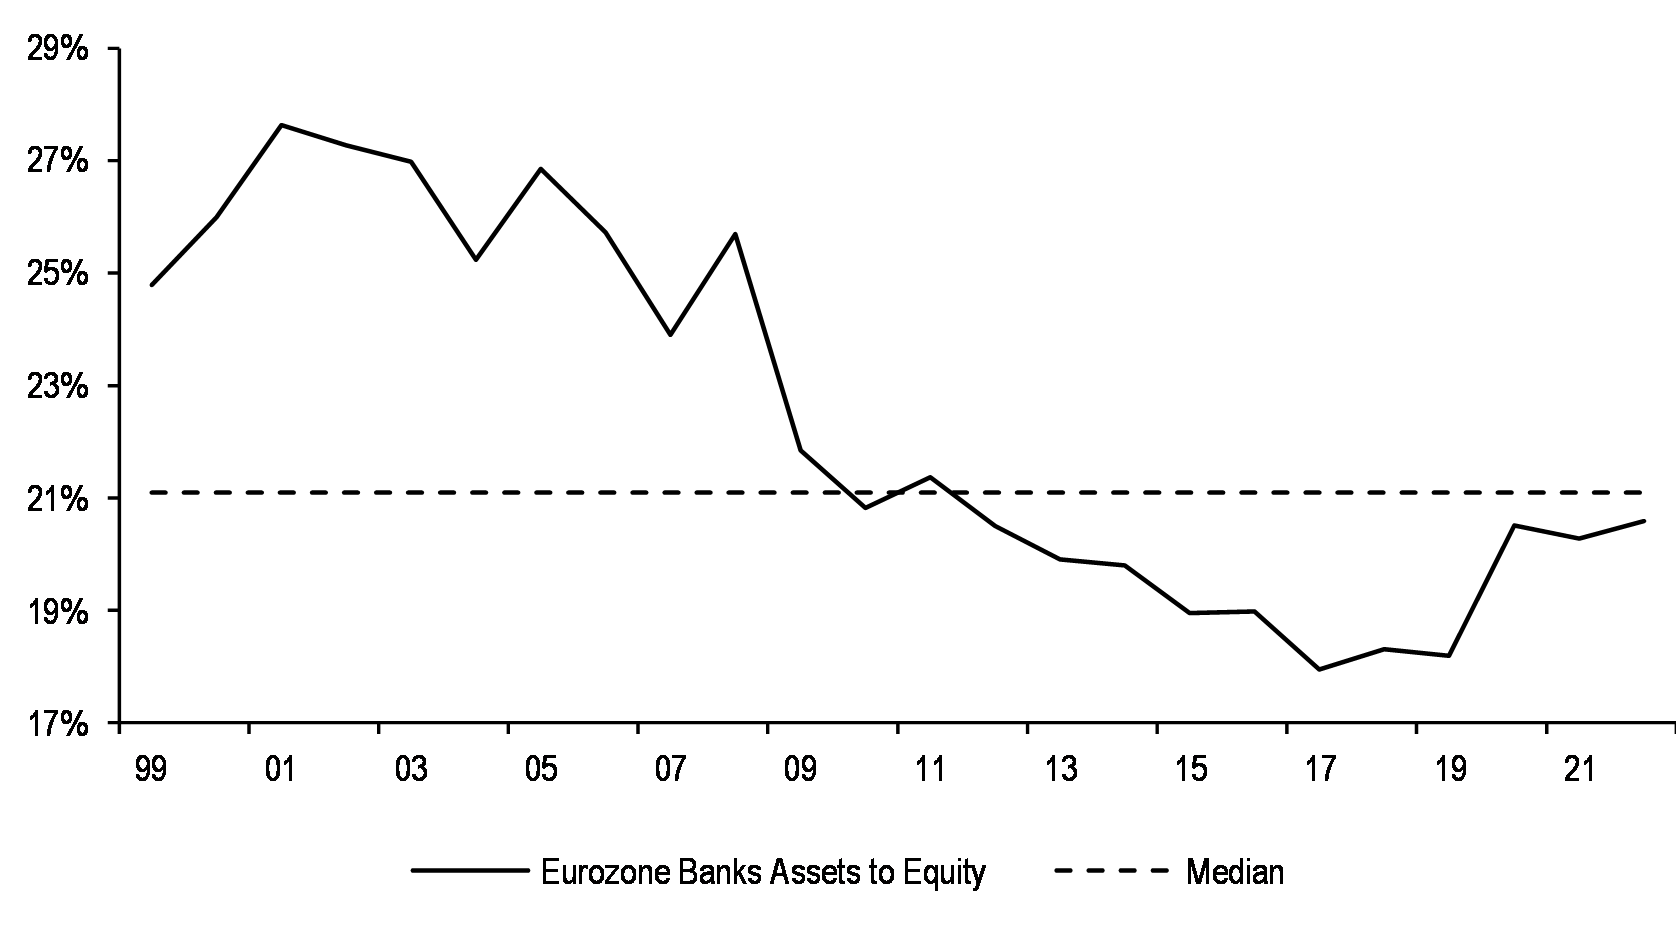
Banks have significantly delevered since GFC, with the leverage ratio currently below the long-term average.
Figure 12: MSCI Europe sectors Asset to Equity
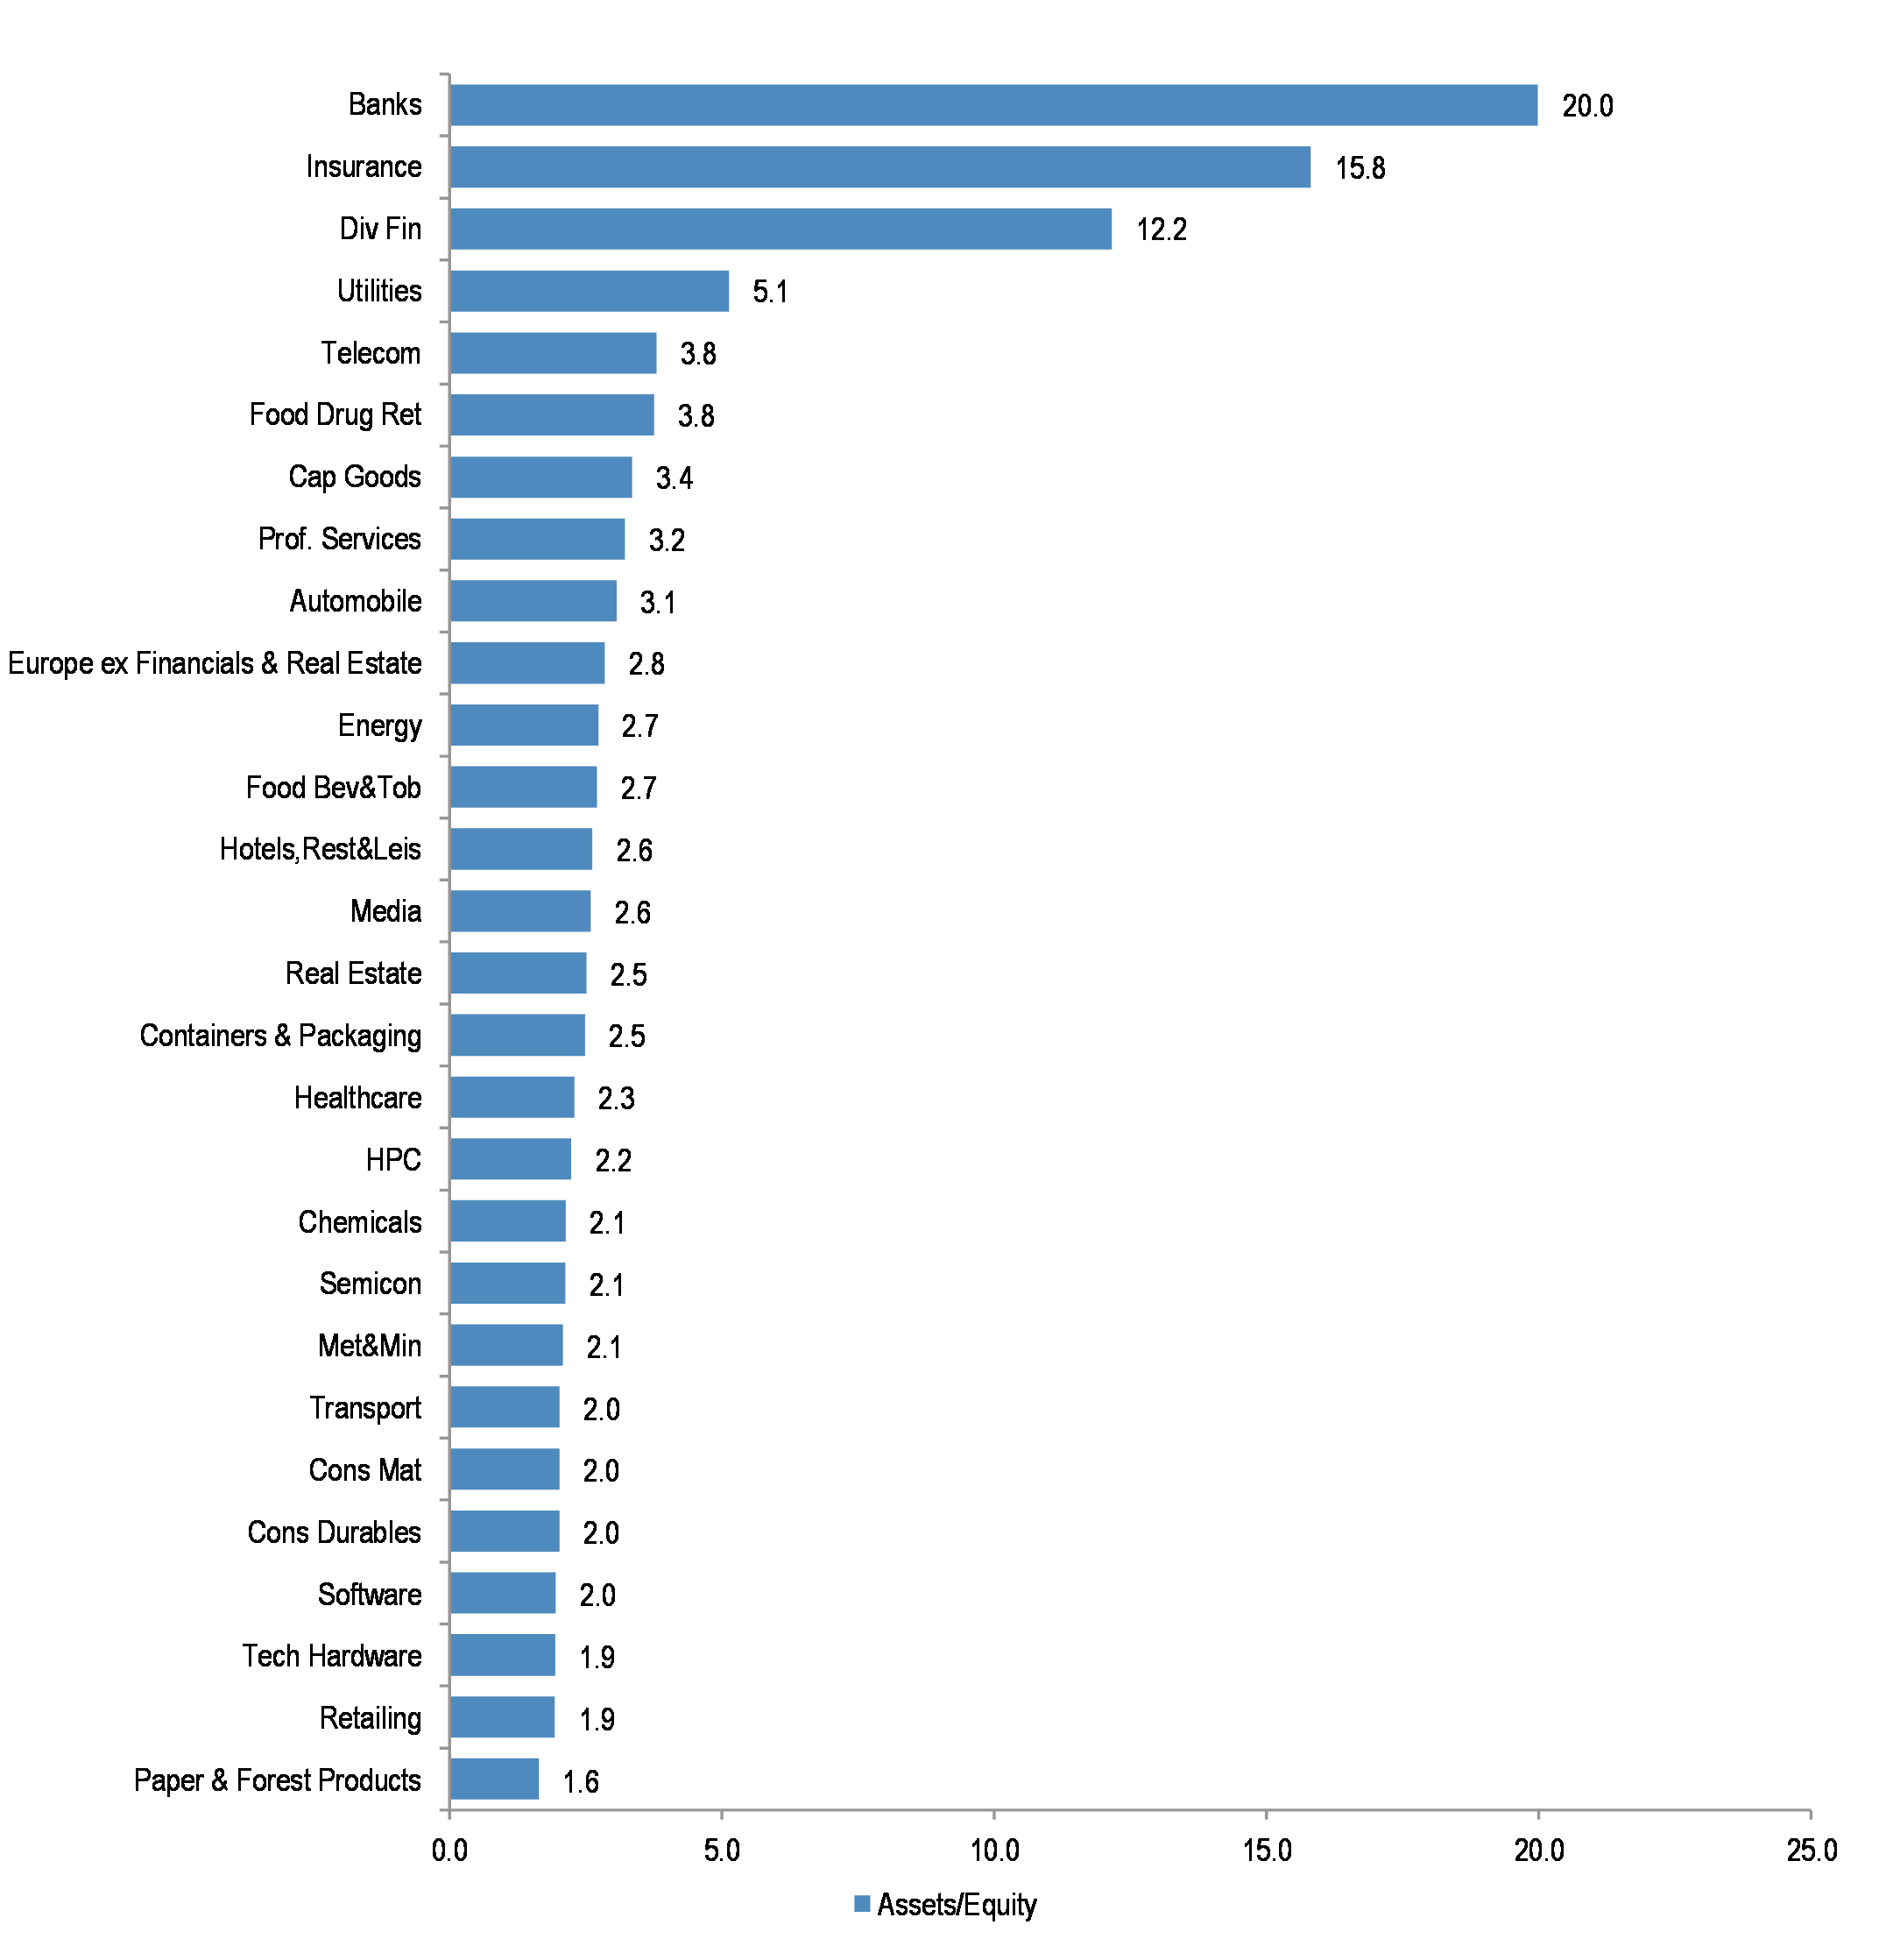
Still, at 20x, the leverage ratio for Banks is much higher than for other sectors, putting them at greater risk if the overall macro environment becomes more challenging.
Figure 13: Correlation of Eurozone sectors to Eurozone PMI
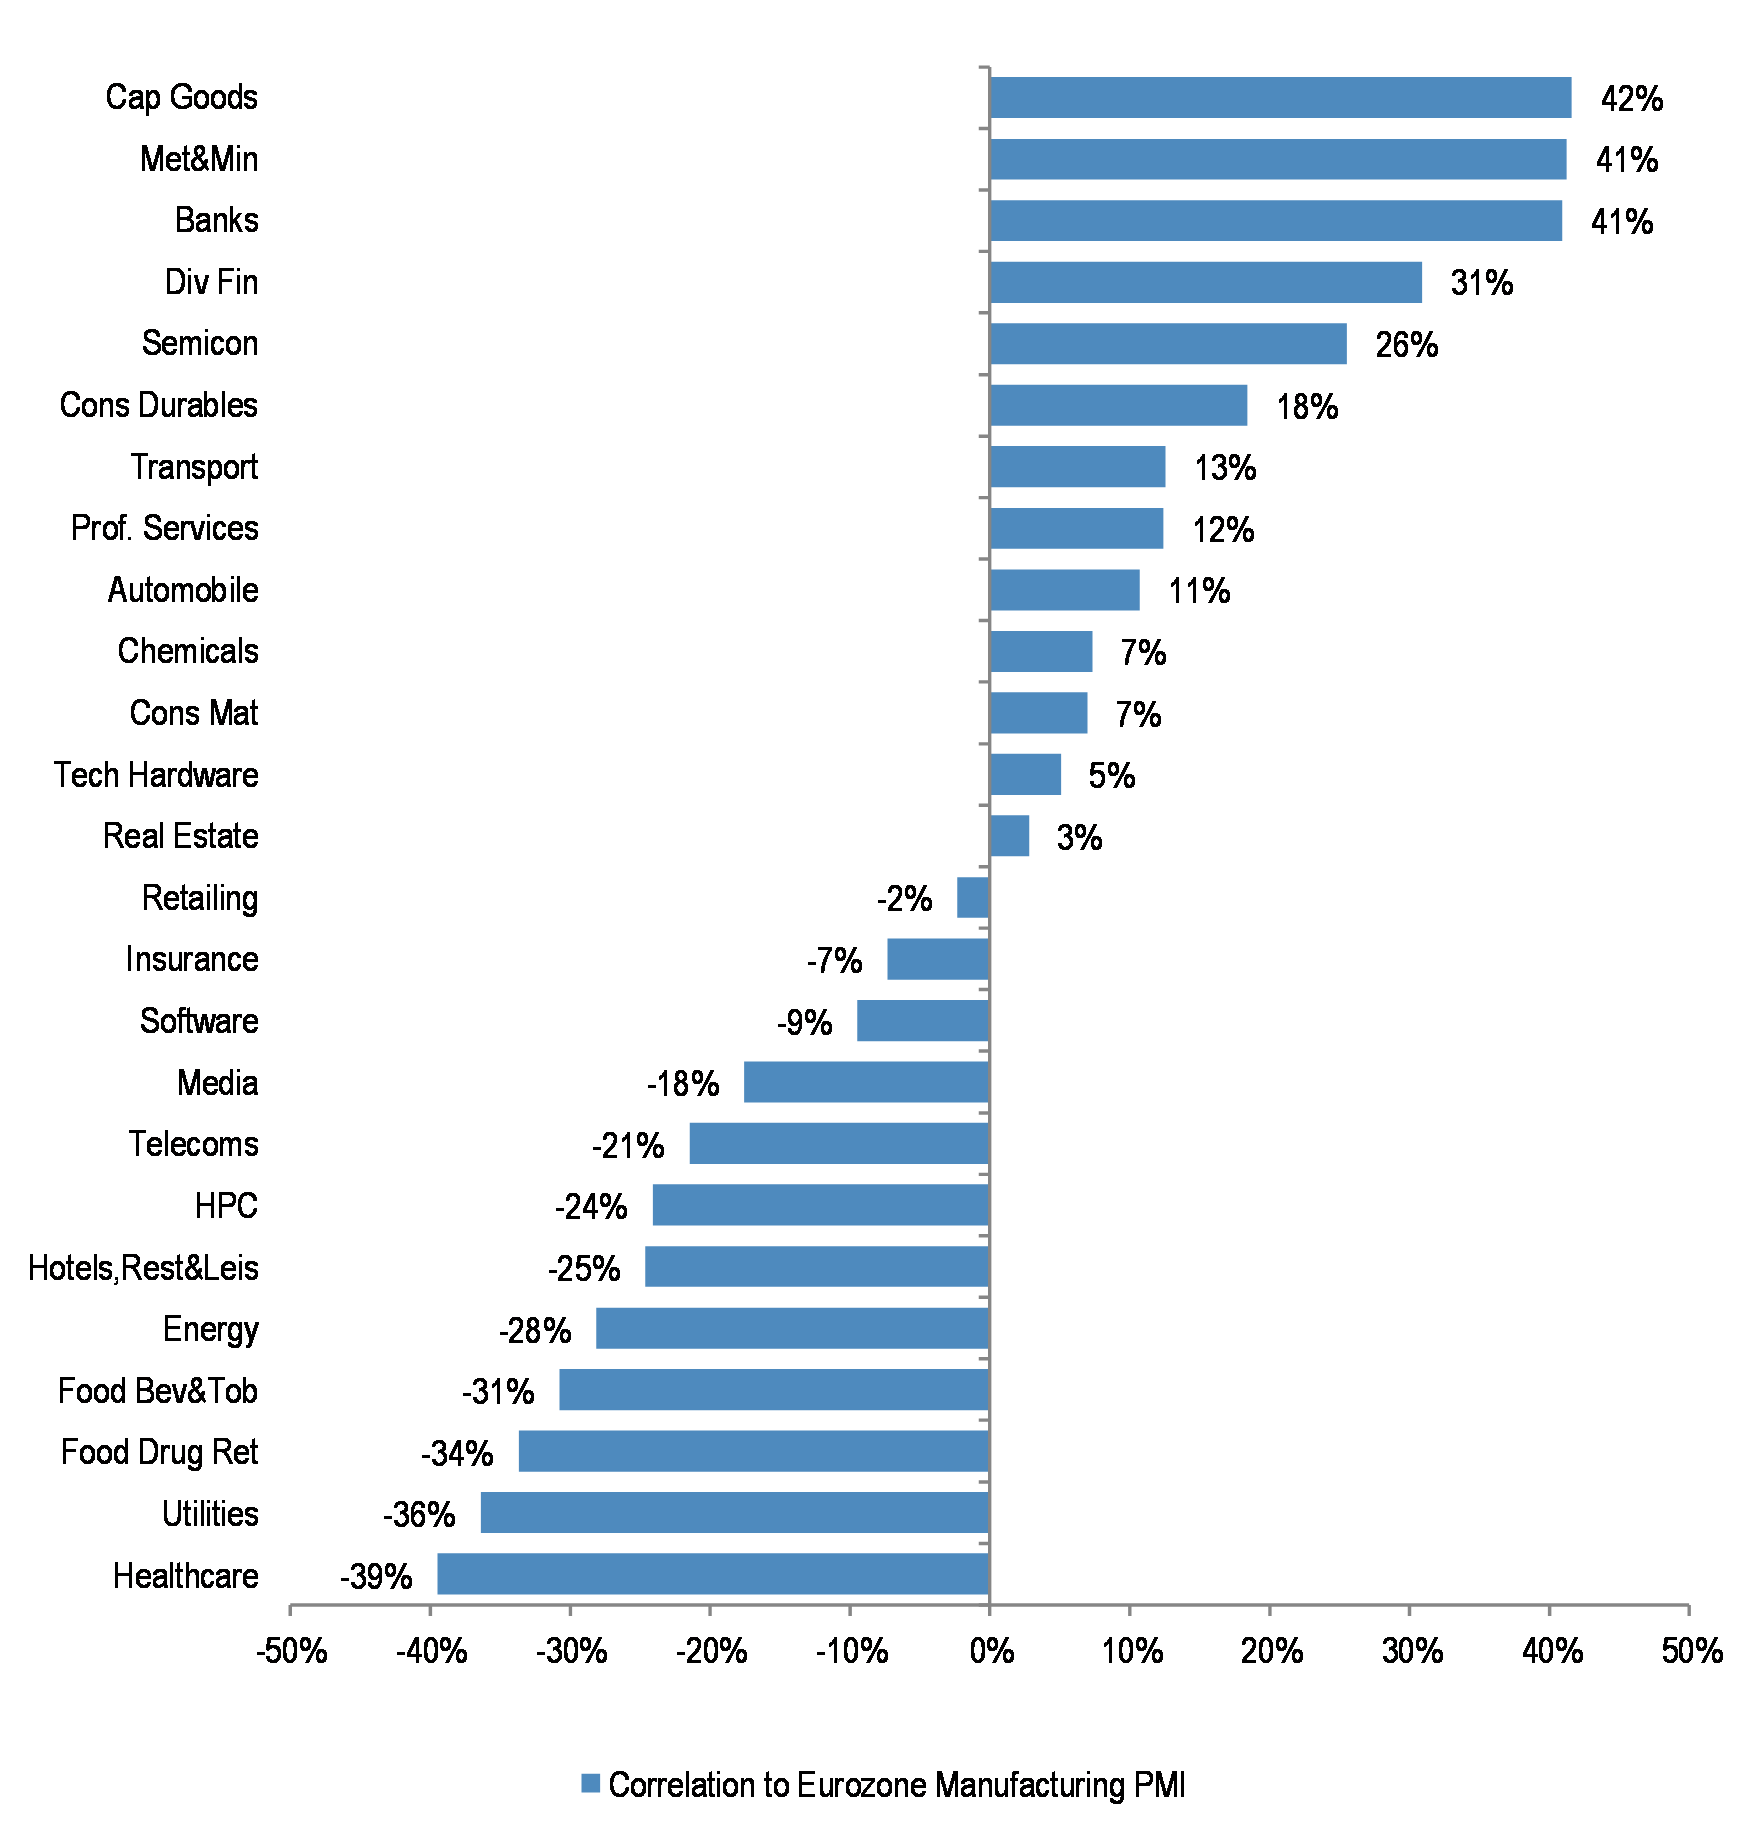
Additionally, Banks display one of the highest positive correlations to PMIs, and are strongly geared to activity momentum. If the economy weakens, the sector is likely to be hurt meaningfully.
…or if credit conditions worsen
Figure 14: % of US banks reporting stronger loan demand
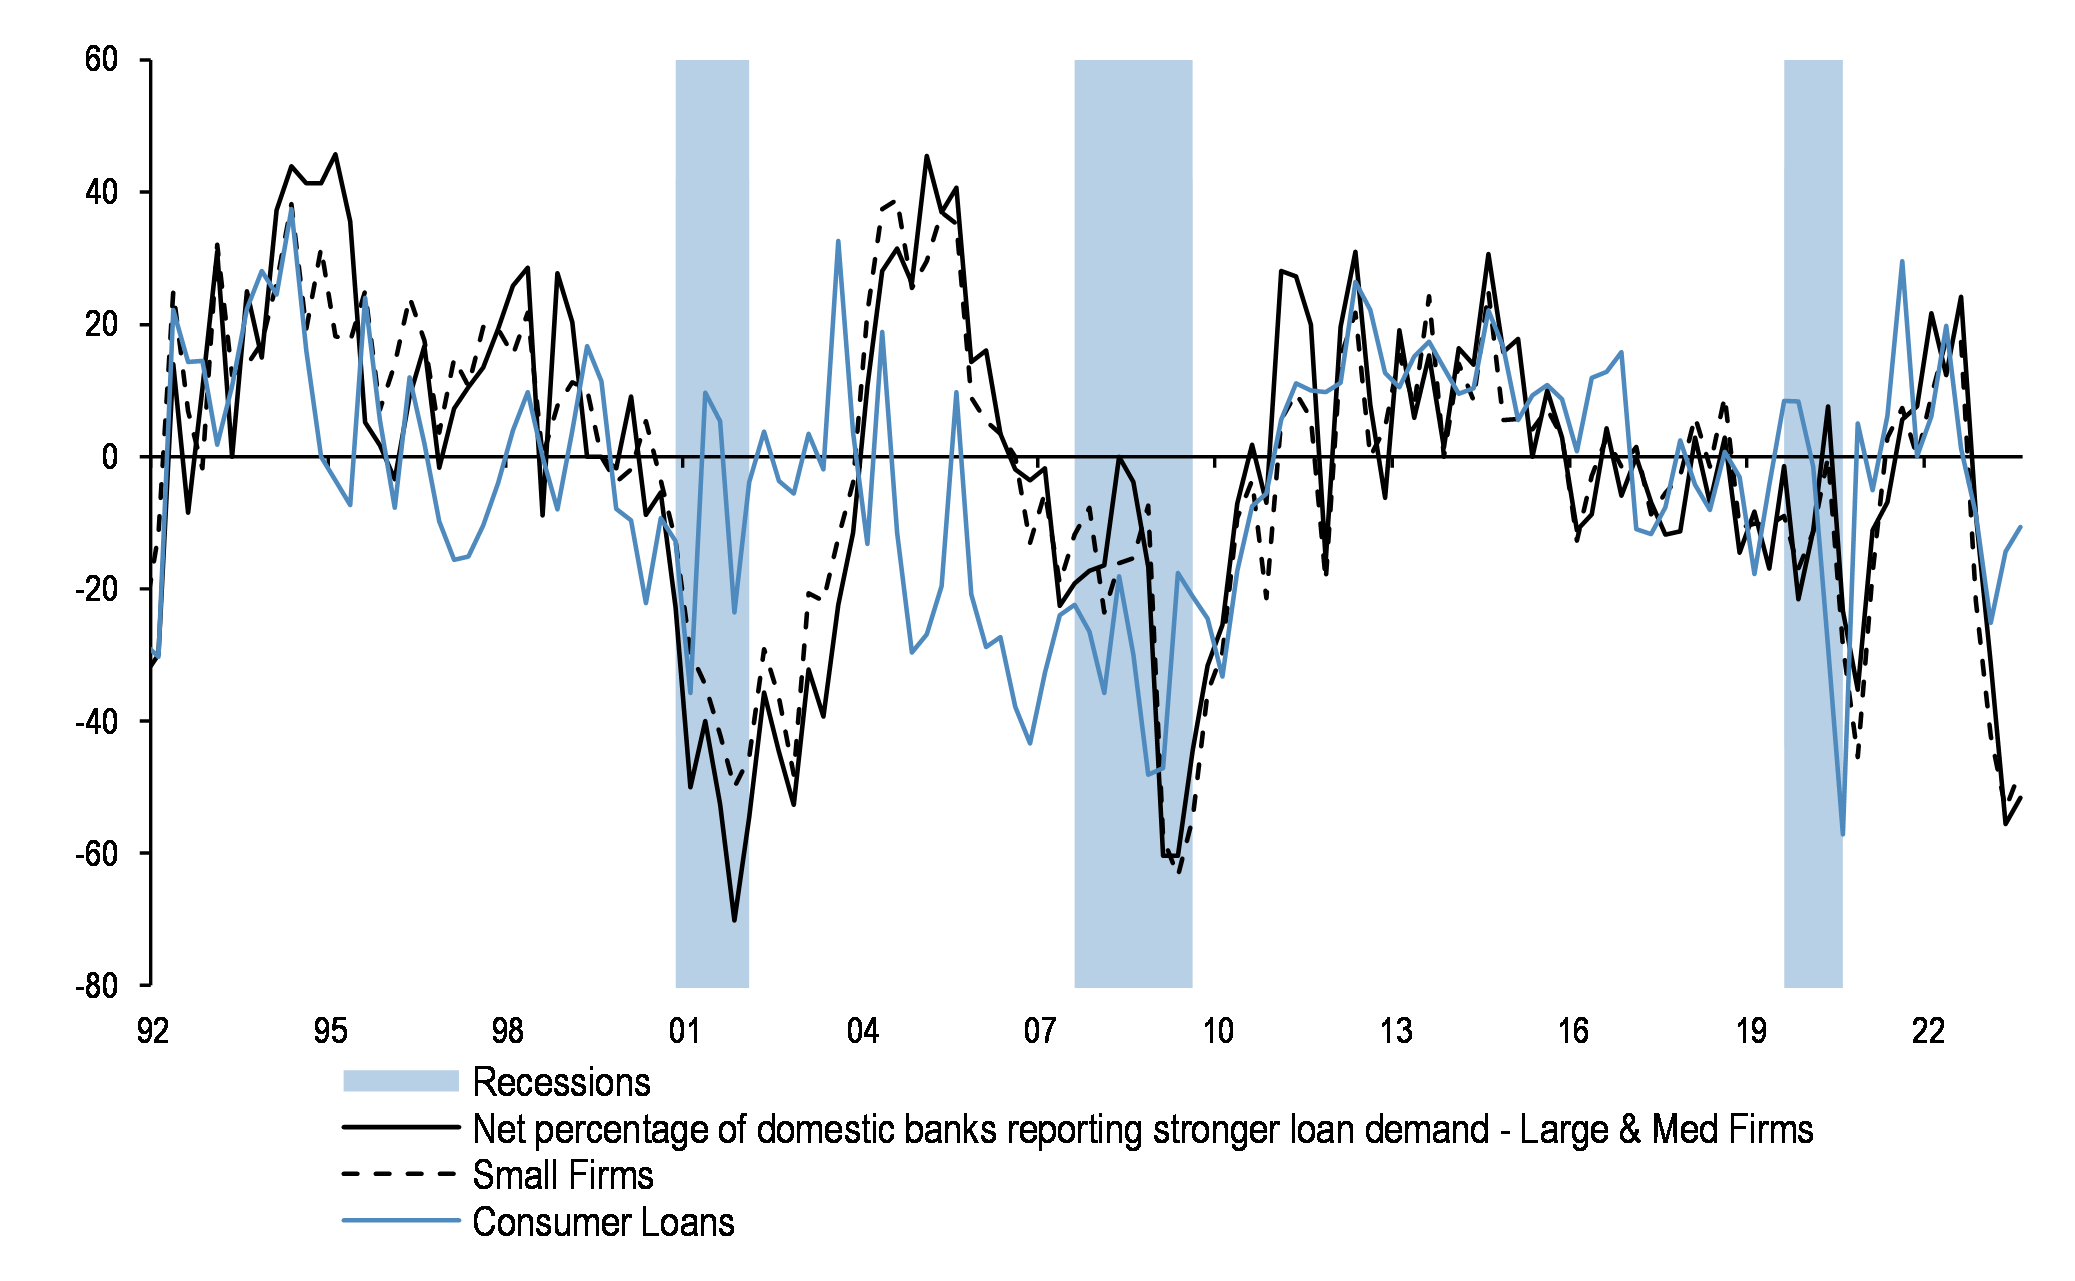
Higher rates and restrictive monetary policy have resulted in a sharp decline in loan demand.
Figure 15: % Eurozone banks reporting positive loan demand
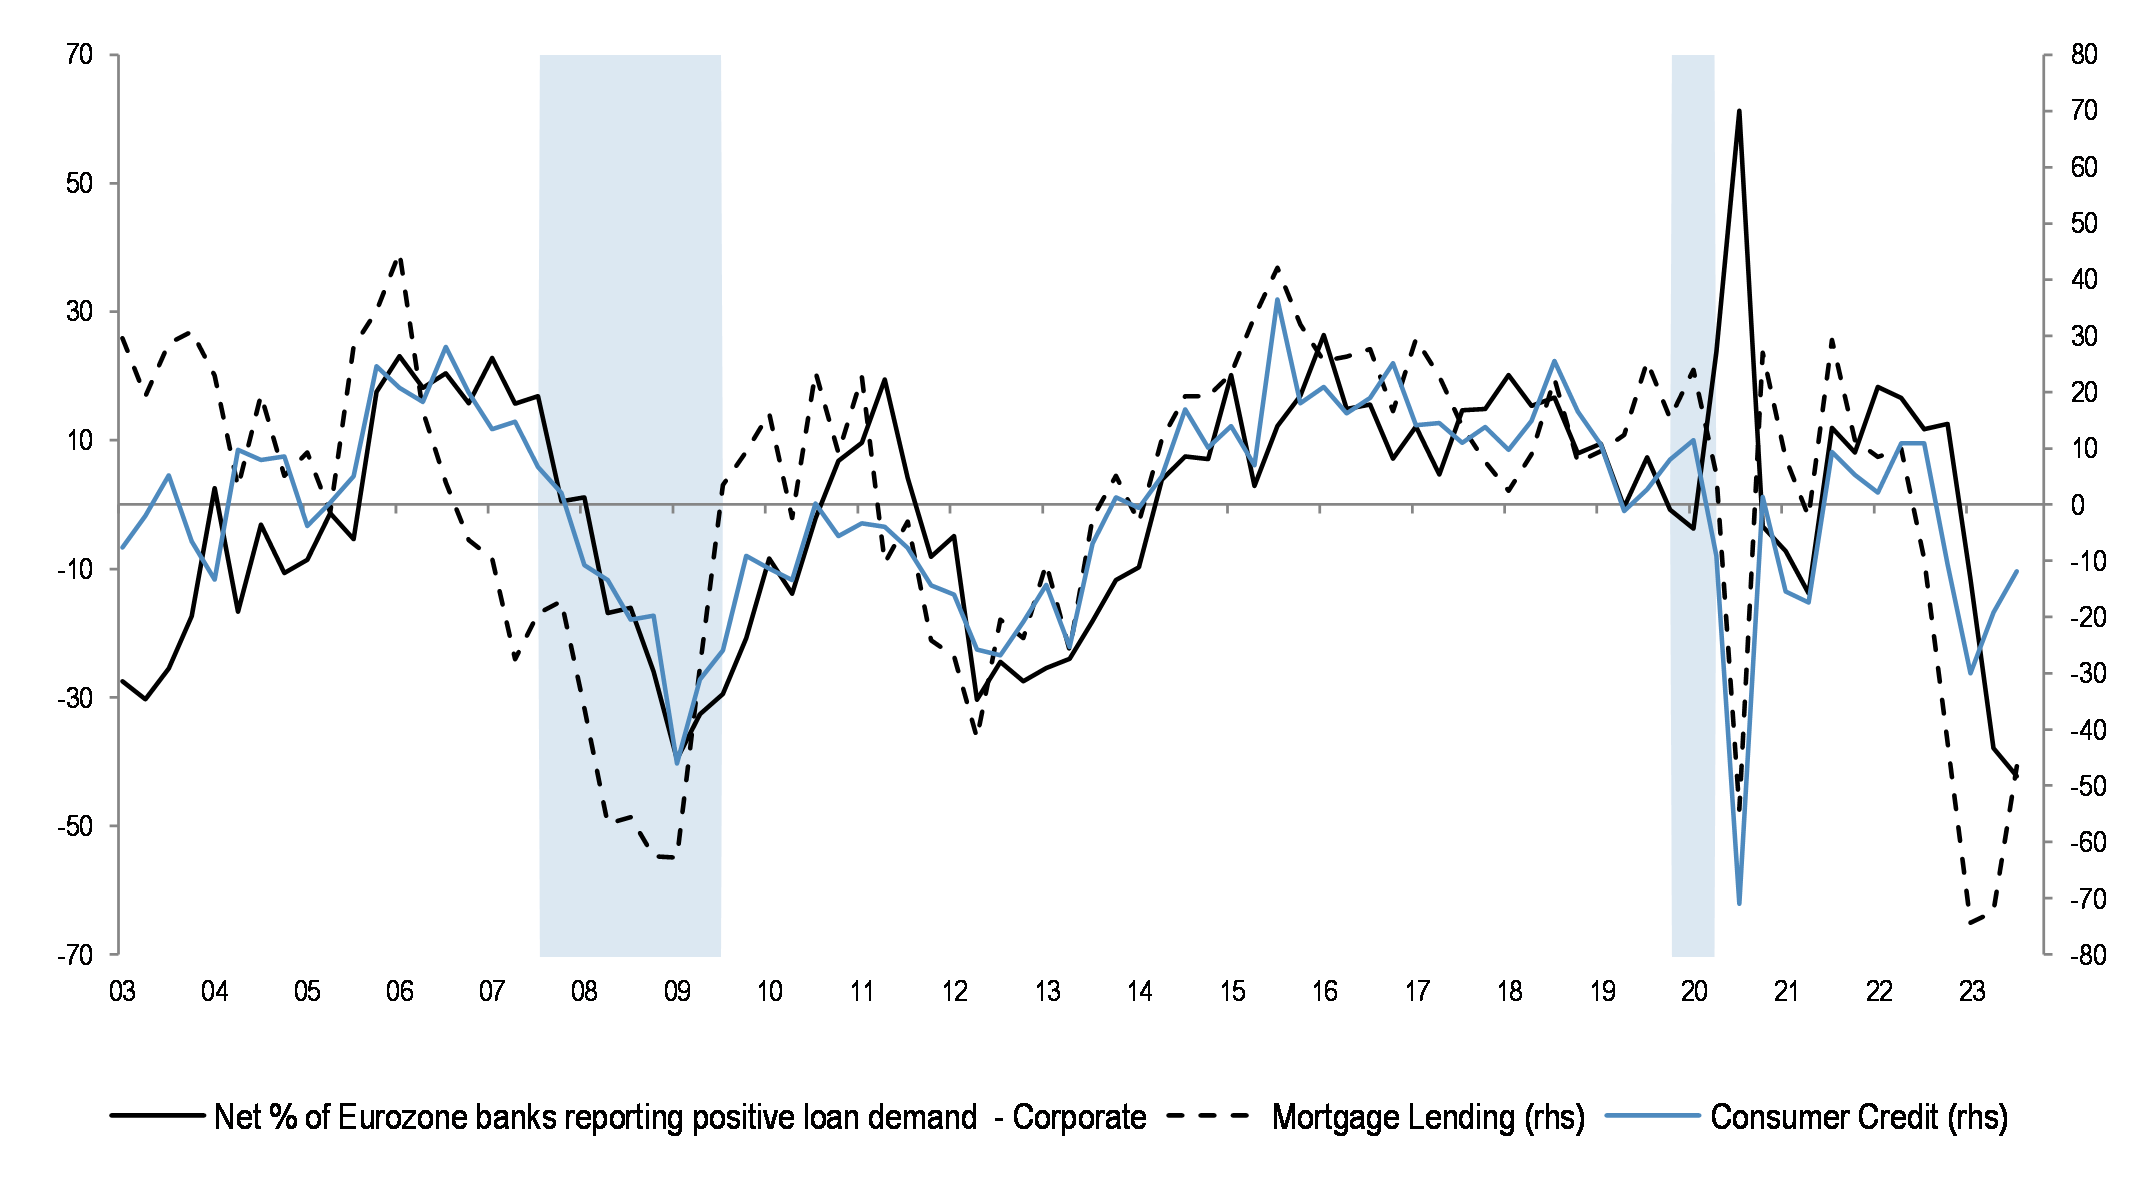
This is true in Europe, as well.
Figure 16: % of US domestic banks tightening lending standards
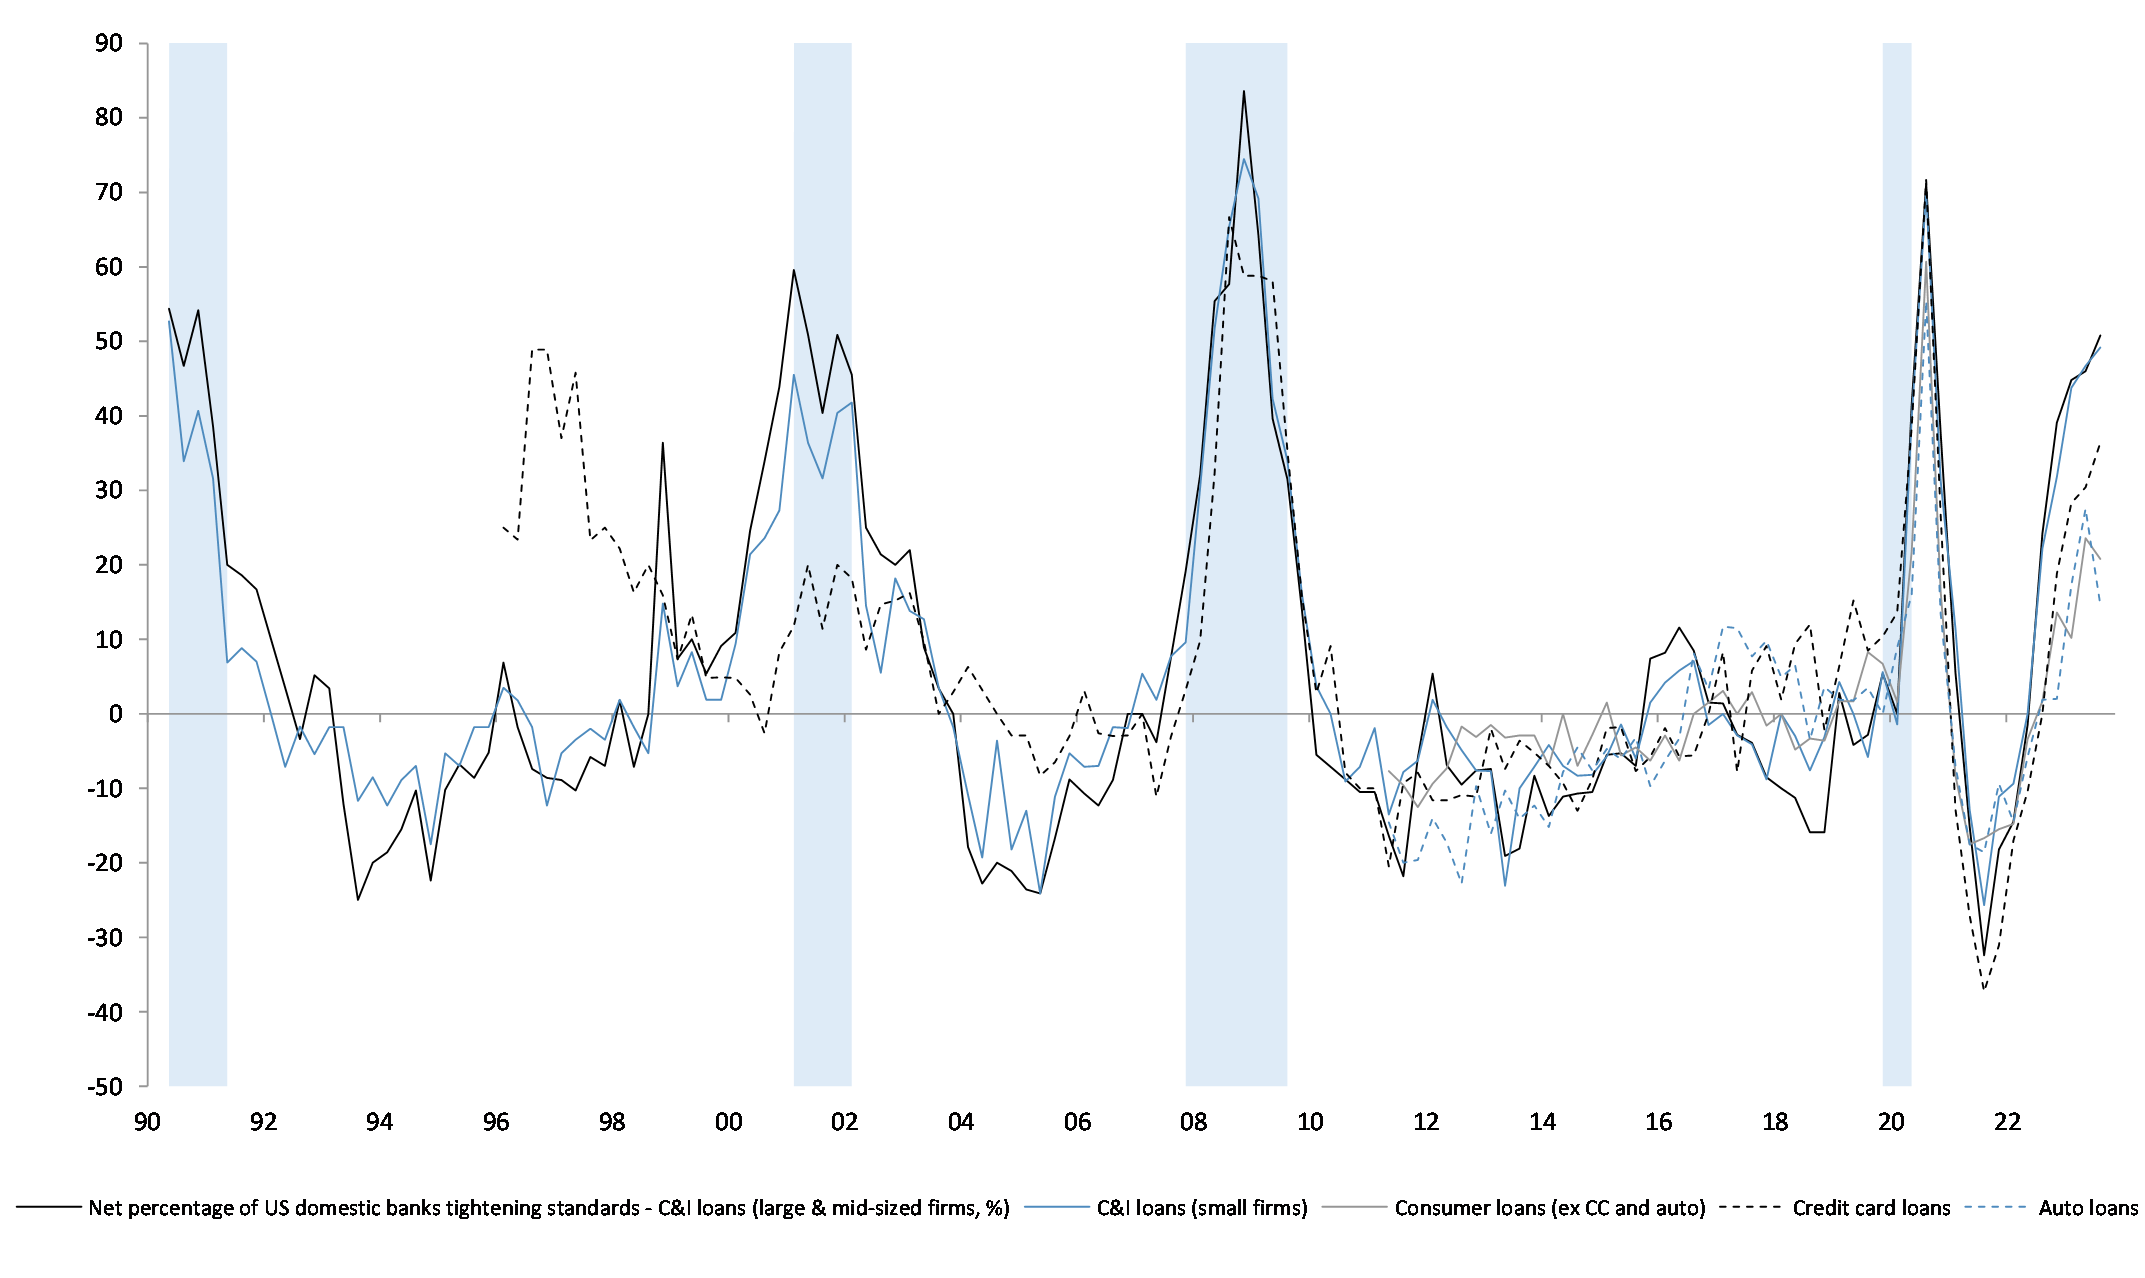
Credit standards have tightened.
Figure 17: % of Eurozone banks tightening lending standards
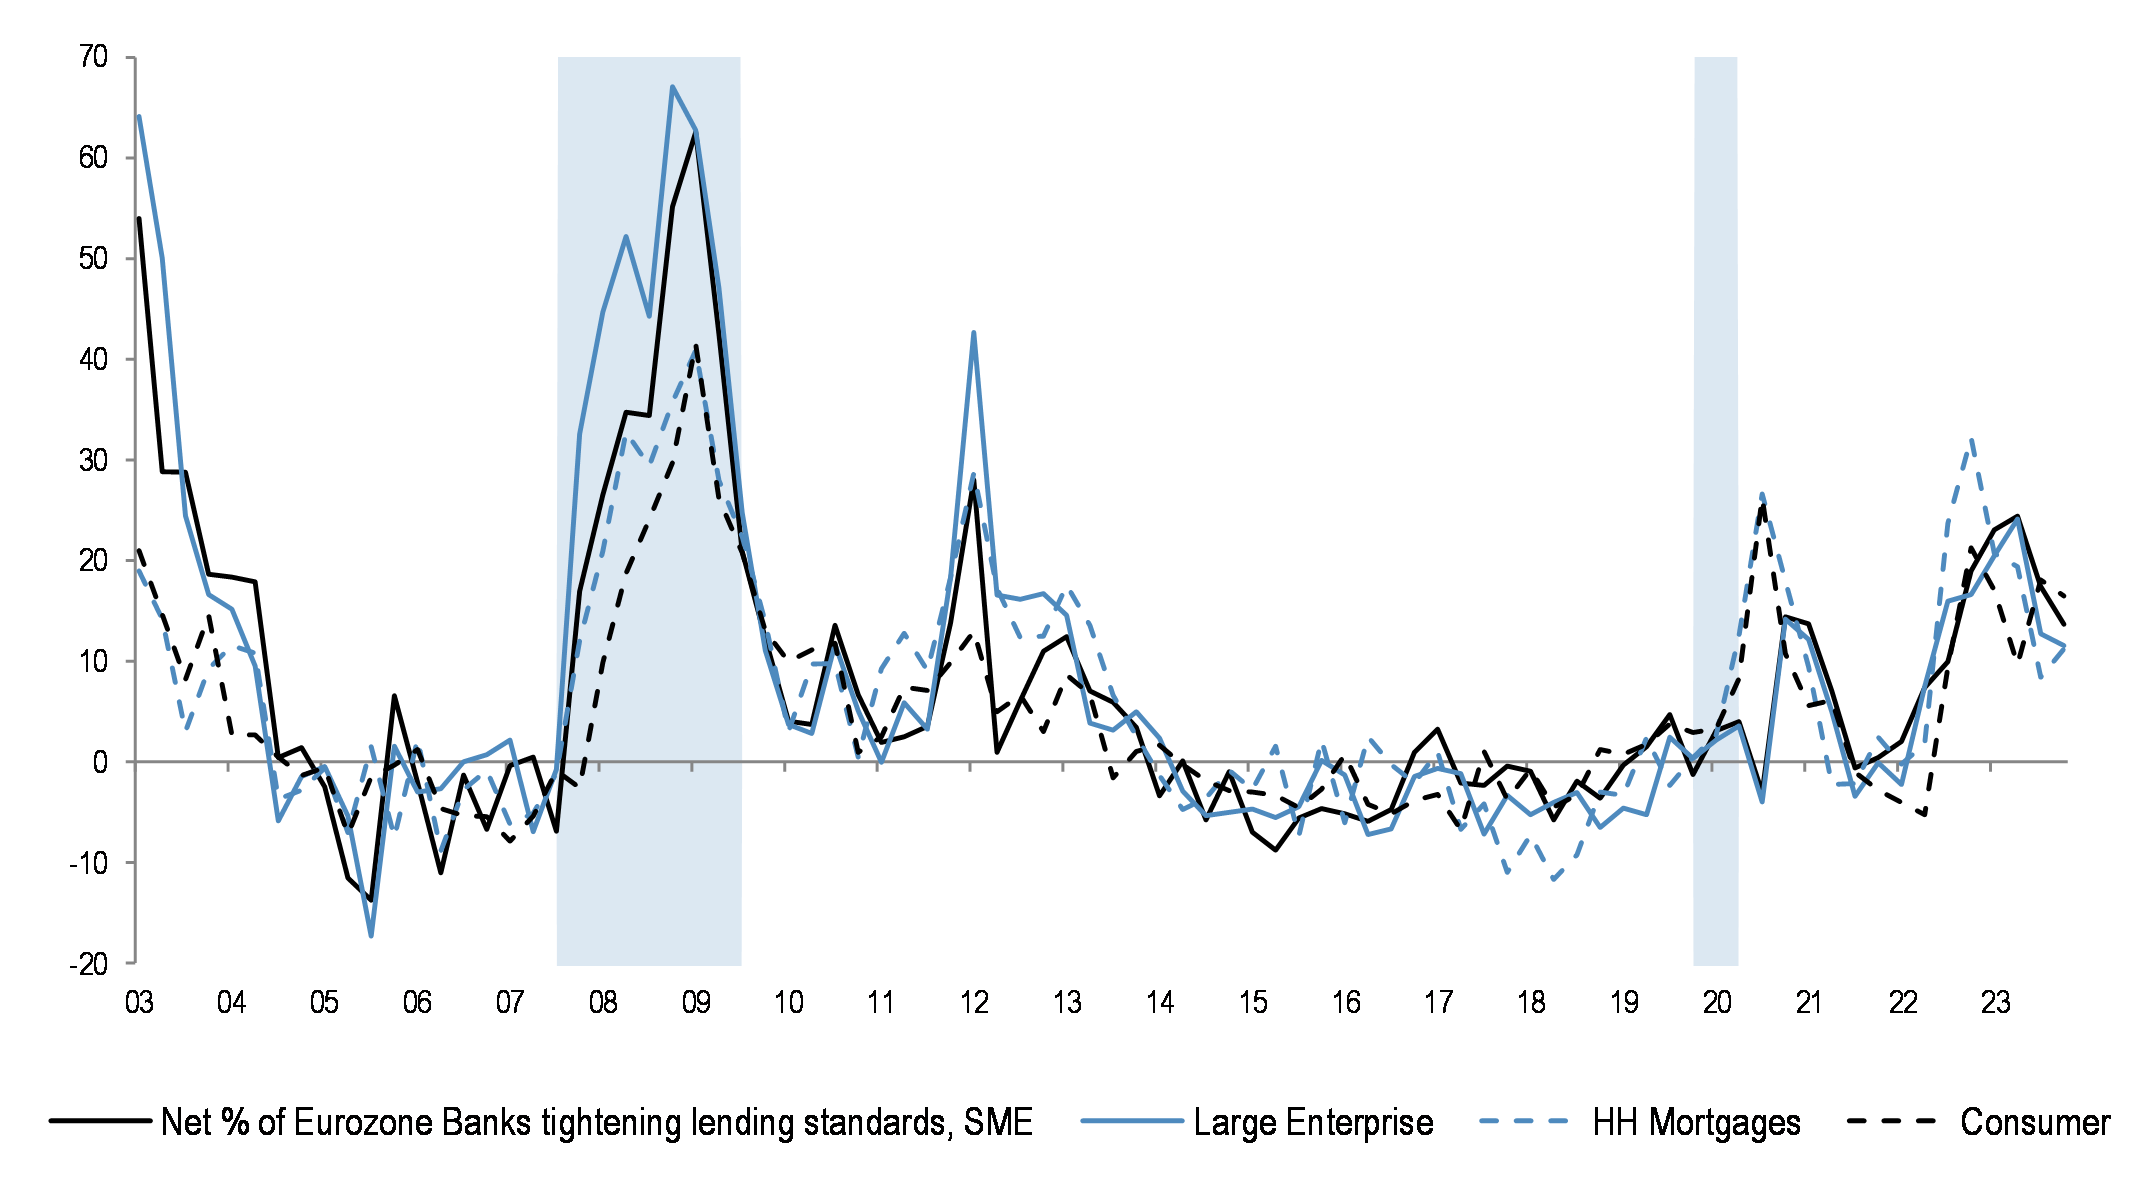
Lending standards are staying tight in Europe, too.
Figure 18: US and Euro HY spreads
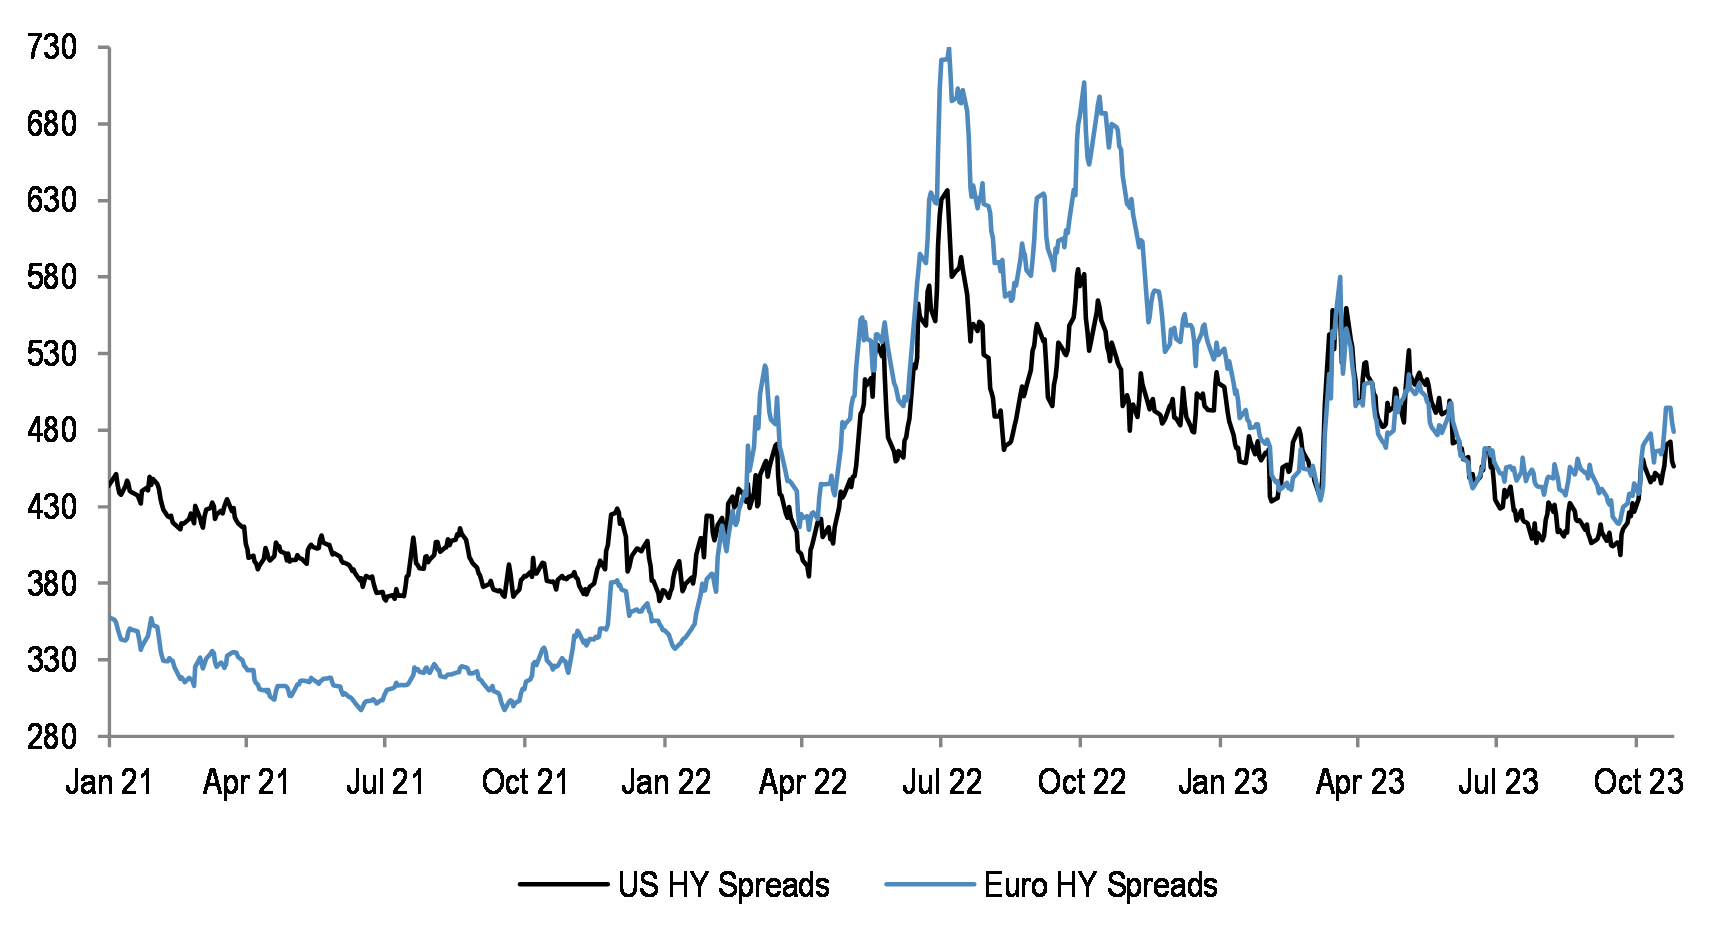
Credit pricing is relatively benign at present, but is at risk of deteriorating. US and Euro HY spreads have been widening recently.
Figure 19: US and Euro HG spreads
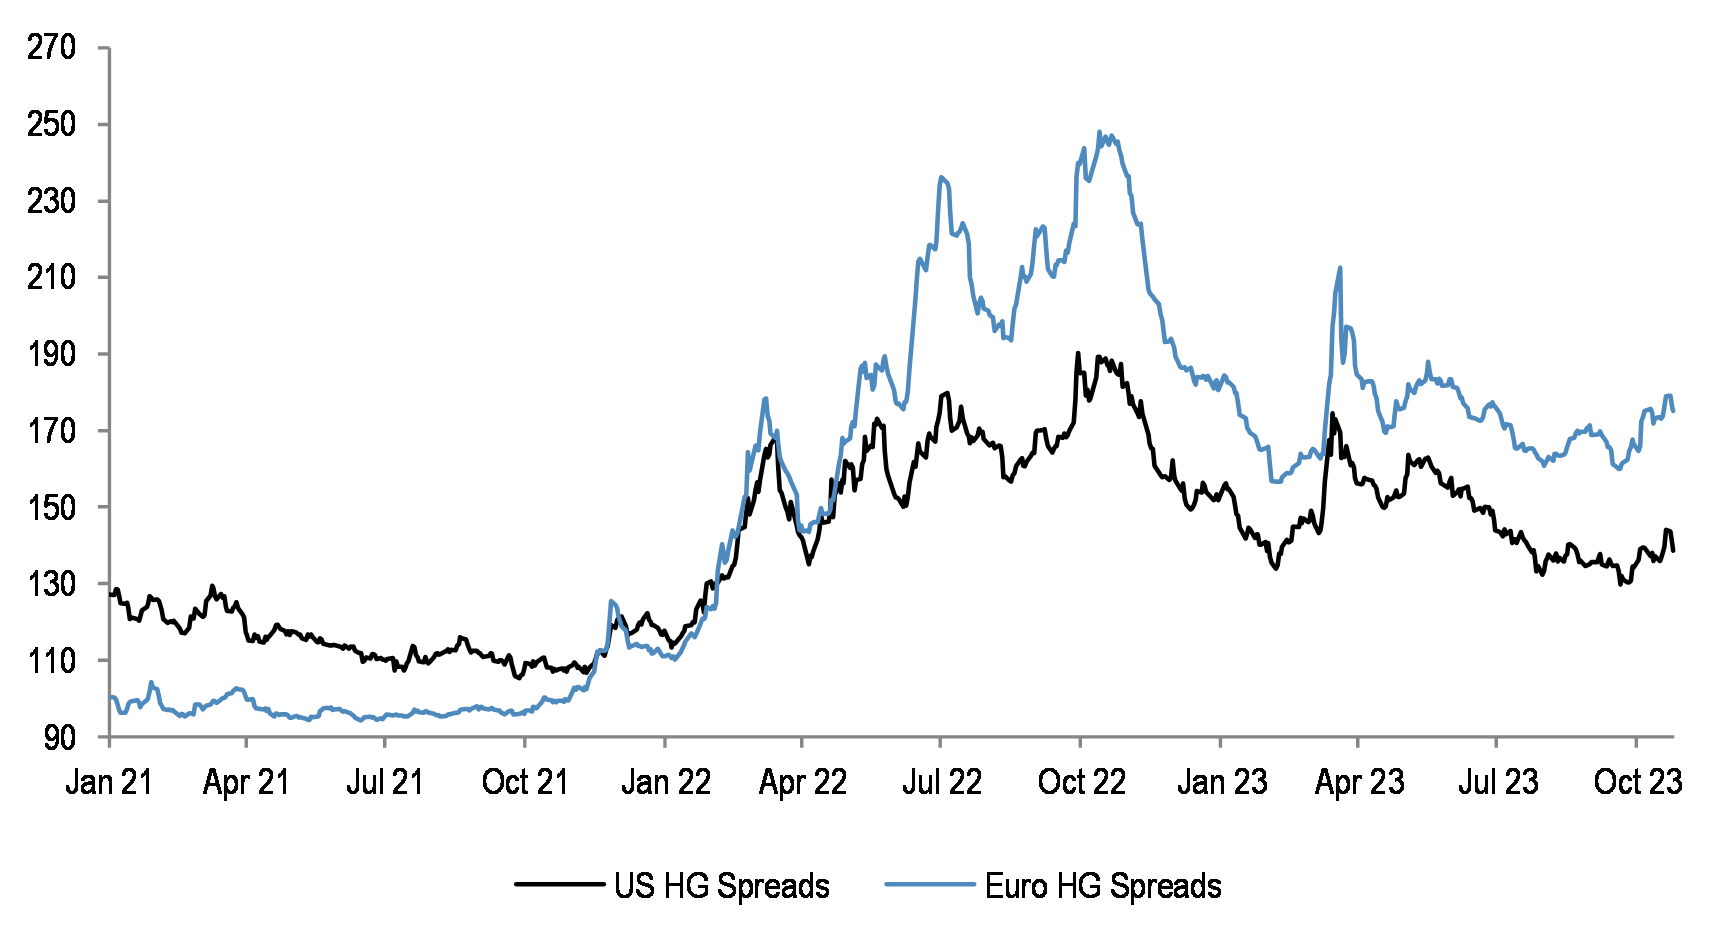
HG spreads could widen, as well.
Figure 20: European HY maturity profile
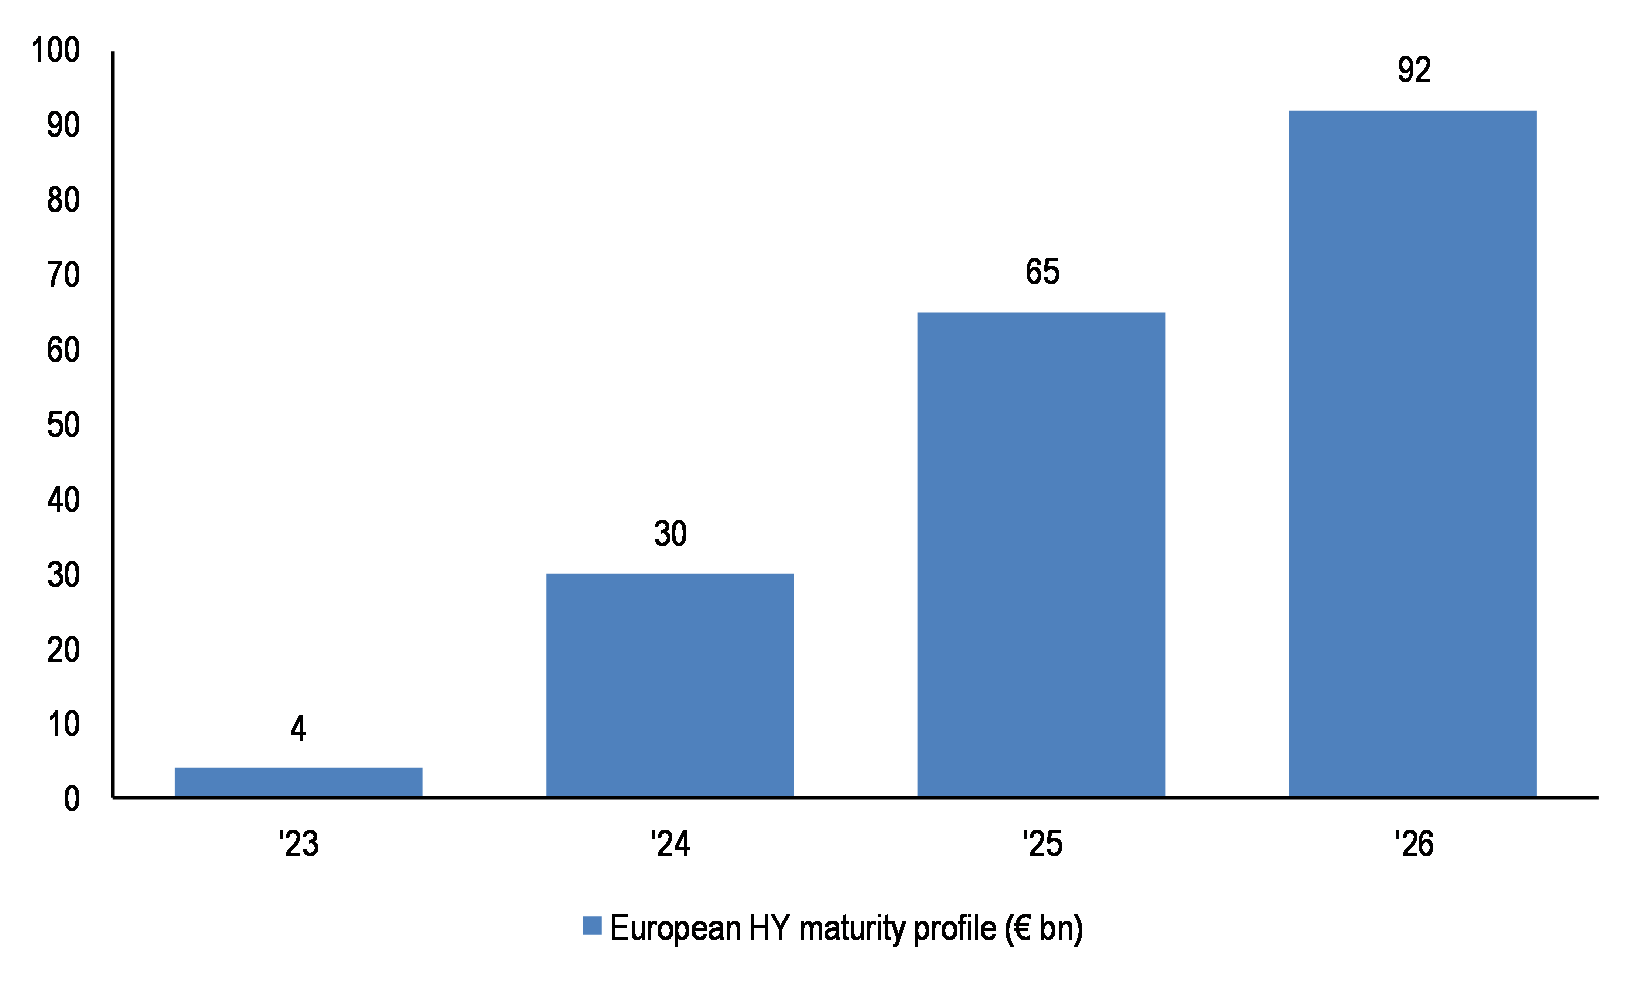
Credit risks are likely to rise, particularly for Banks with exposure to HY corporates, SMEs and commercial real estate, as refinancing needs are set to increase from next year.
Figure 21: Euro HY default rate
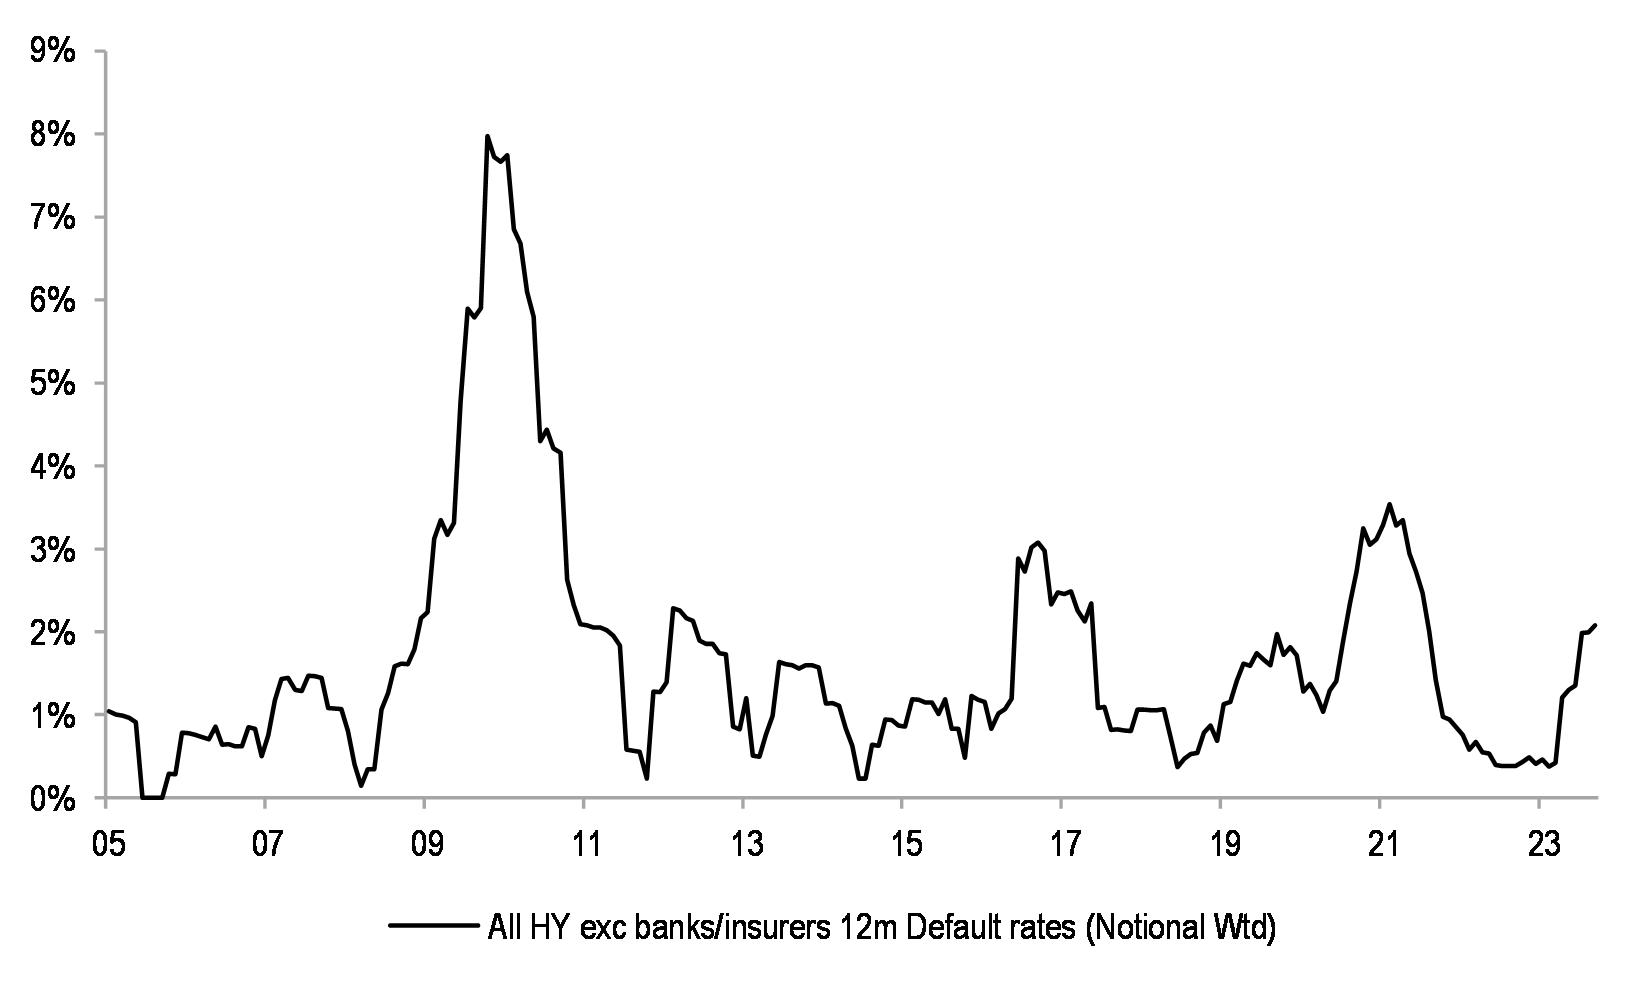
Default rates are picking up.
Figure 22: Eurozone Banks provisions
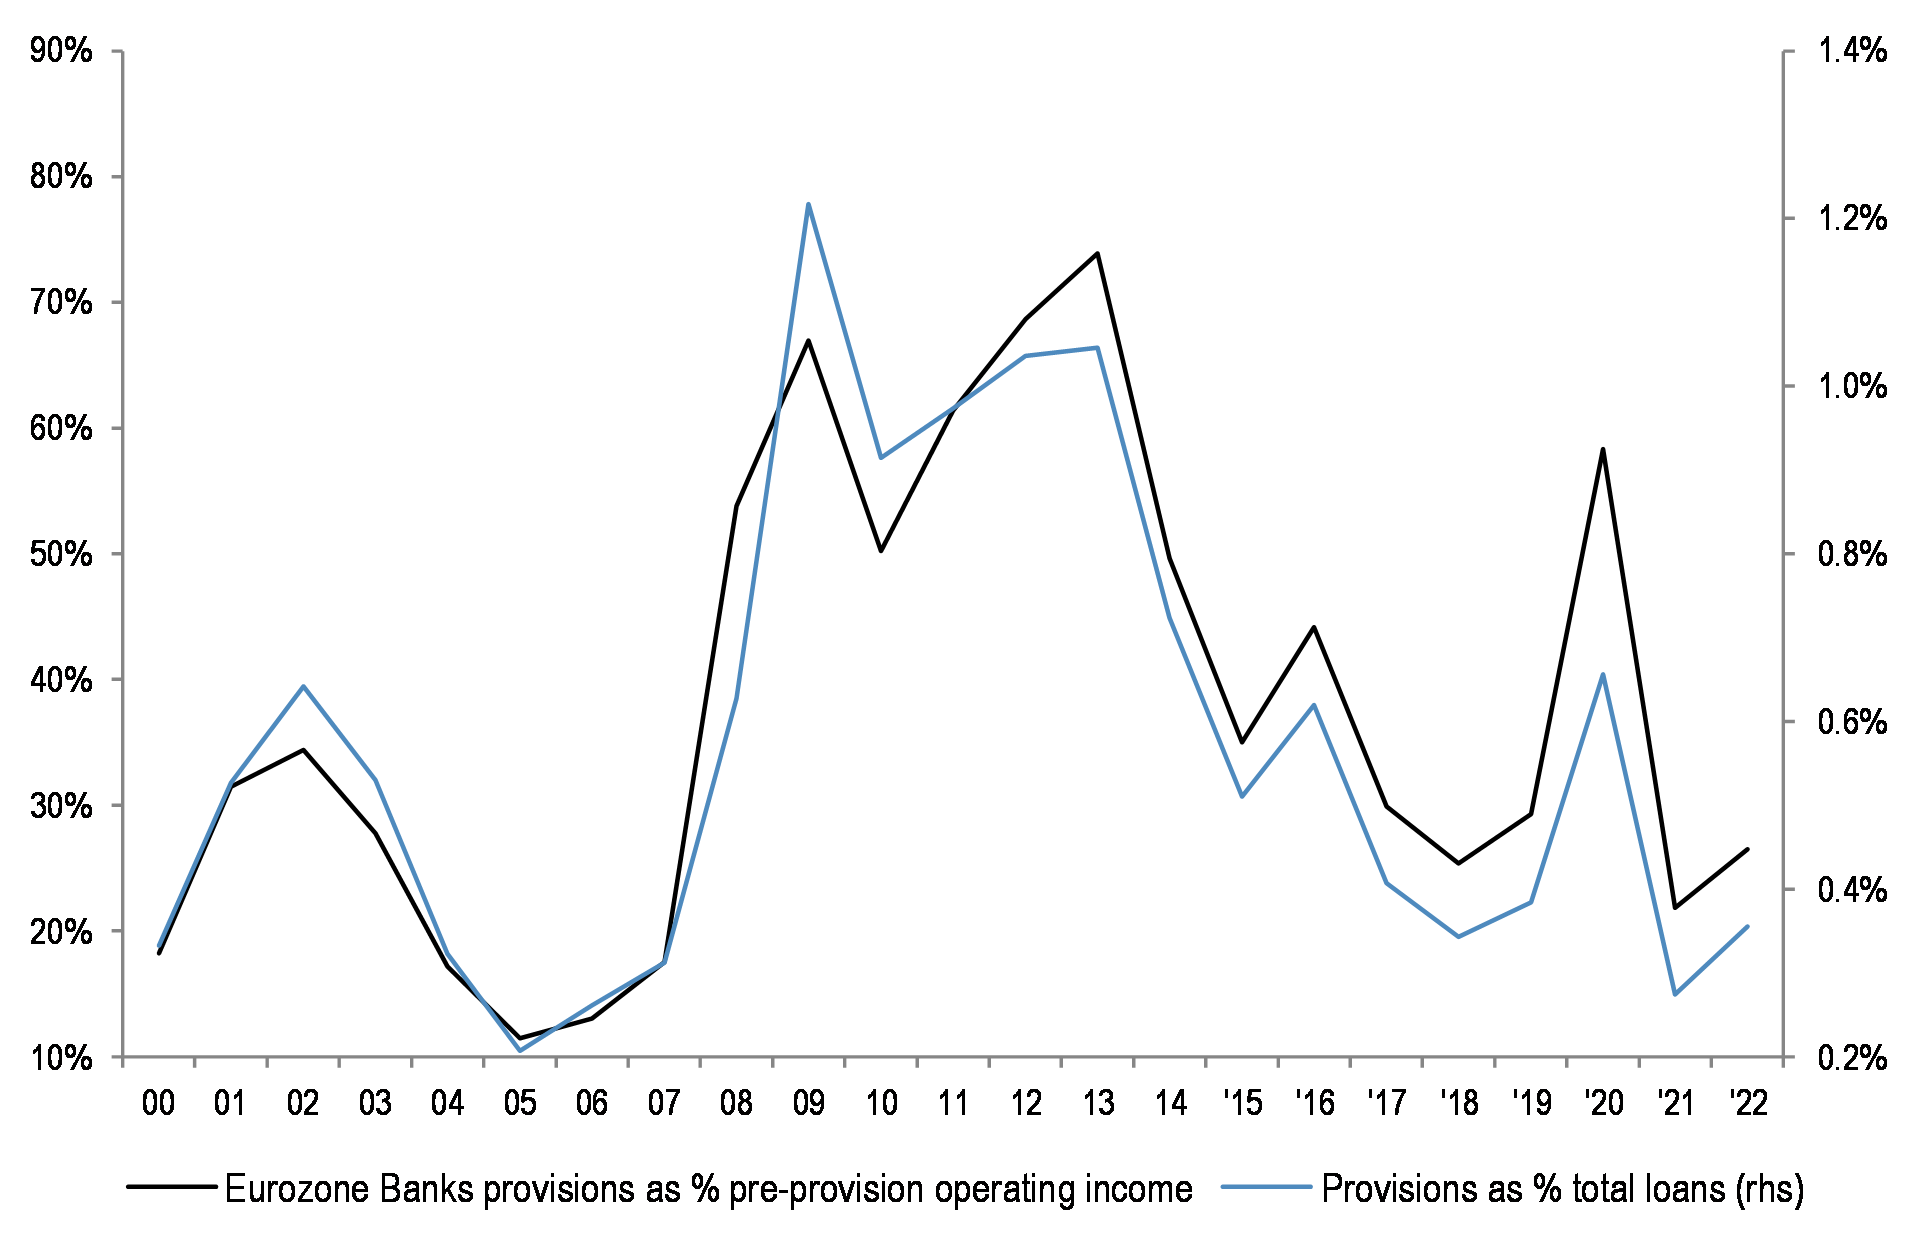
Provisioning is likely to rise, as well.
Regionally, we still have preference for Japanese over US and European Banks
Figure 23: Japanese vs US Banks and Japanese vs Eurozone Banks ytd
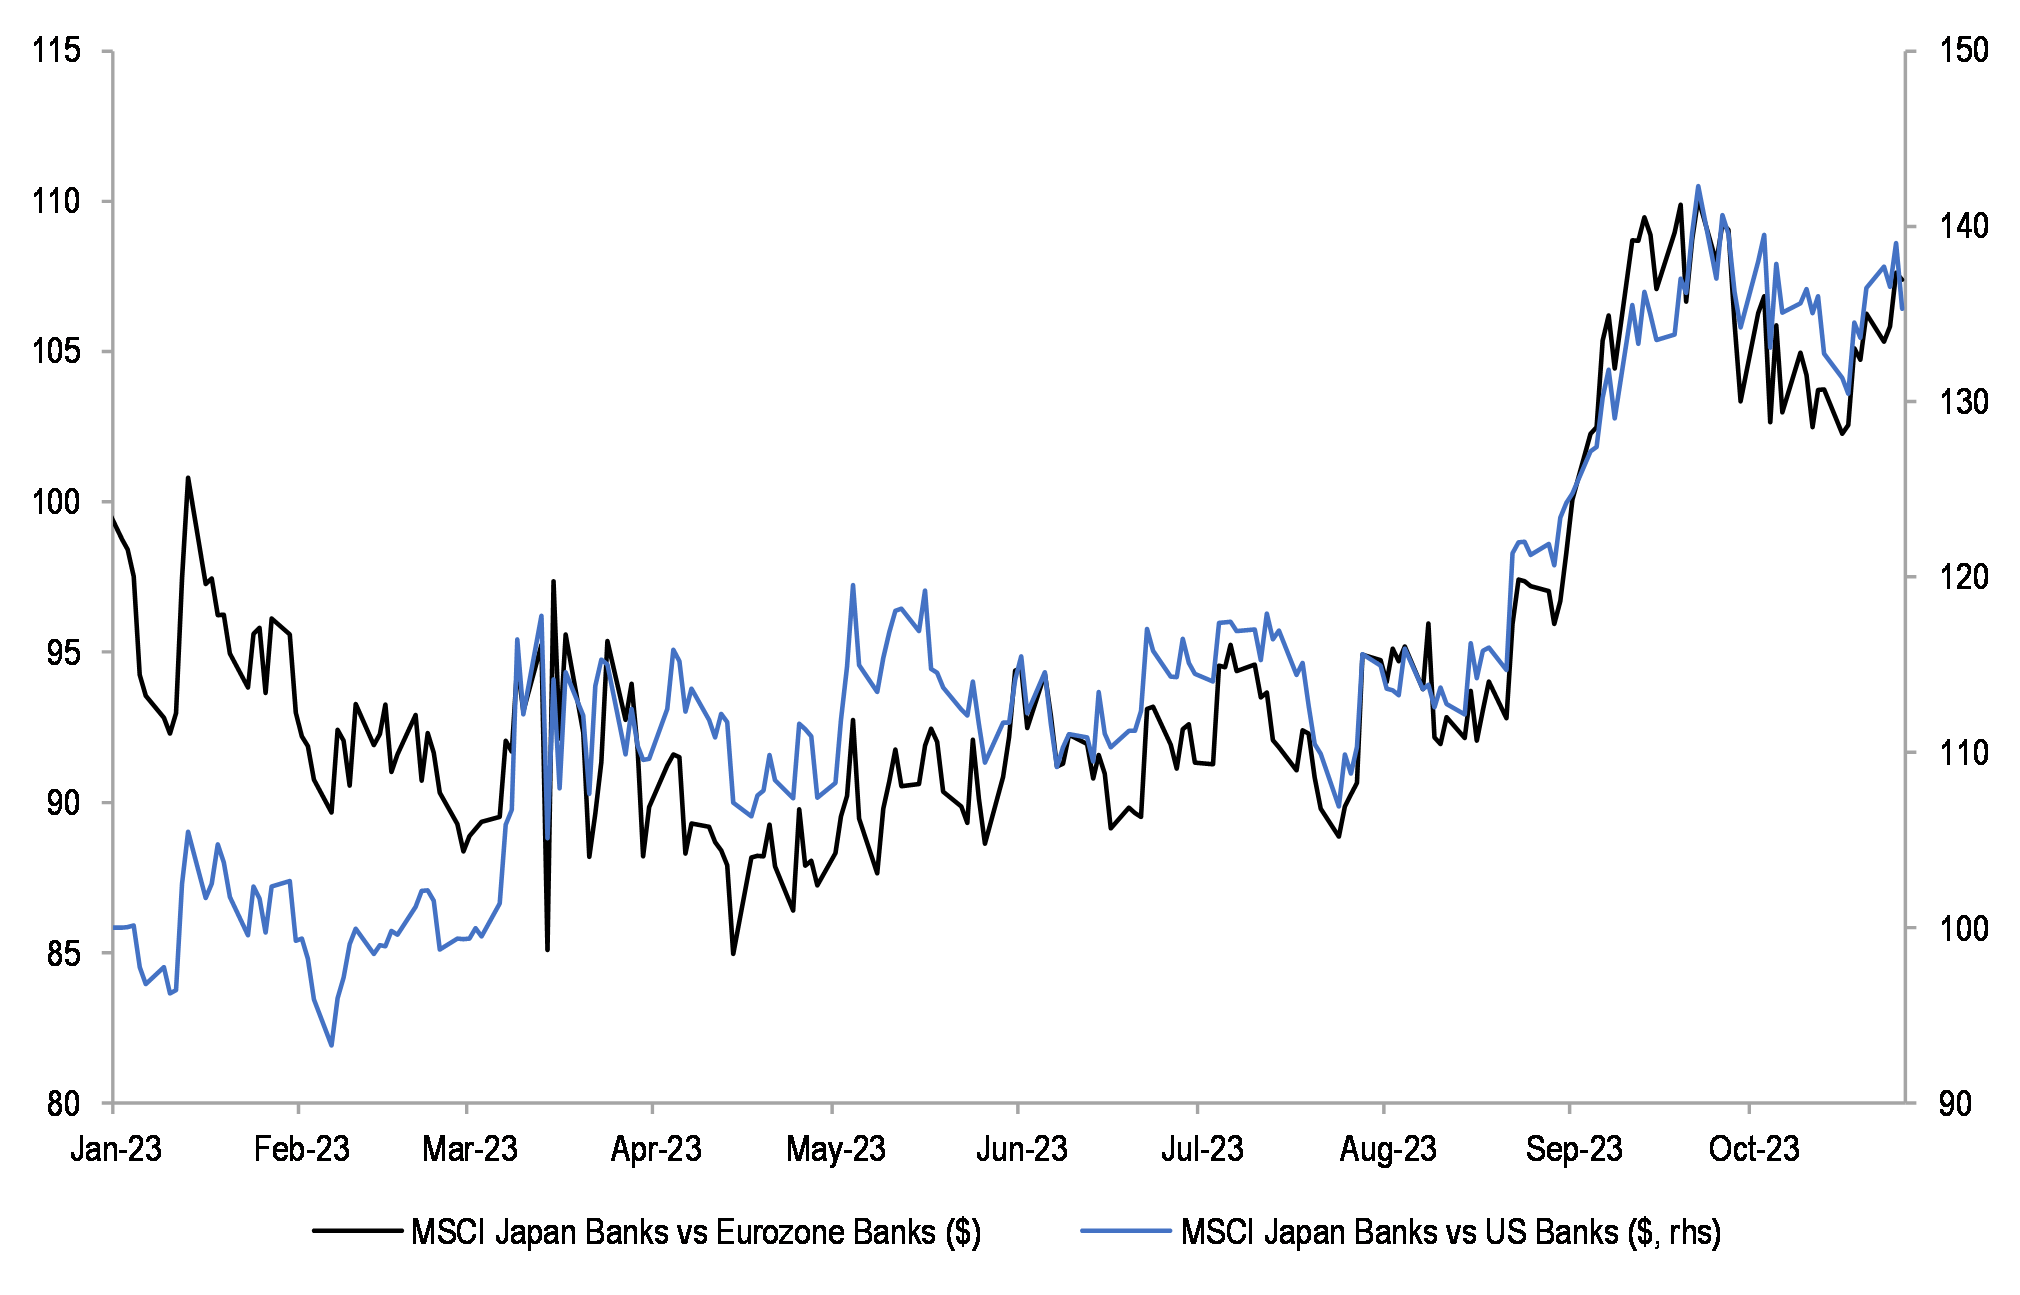
Regionally, we are keeping our preference for Japanese Banks vs both US Banks and European Banks.
We use the funds from the Banks downgrade to add to Healthcare, upgrading the sector from Neutral to OW
Figure 24: European Healthcare price relative
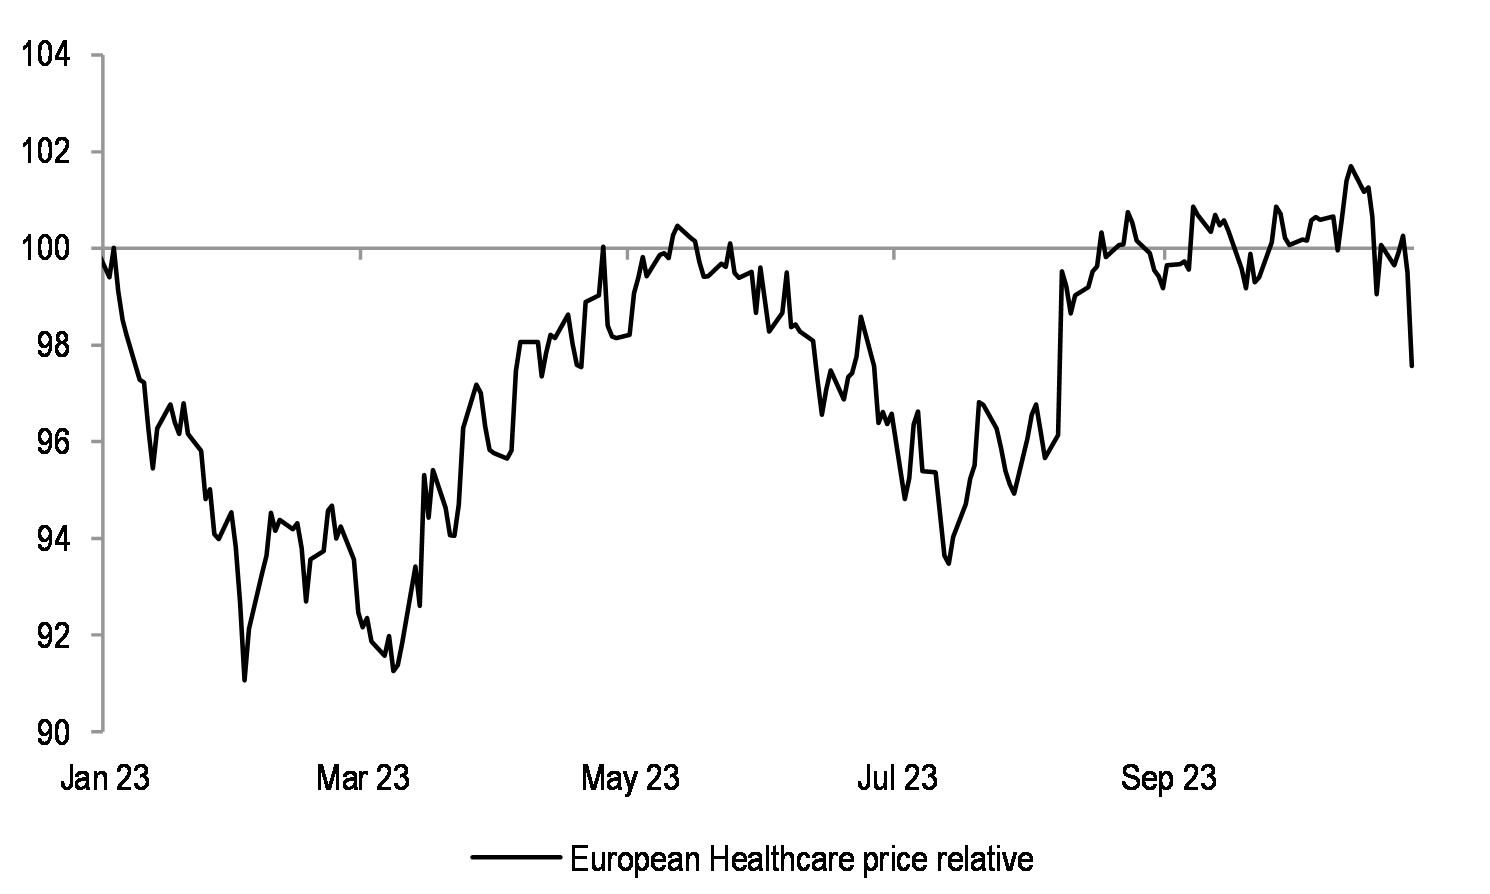
European Healthcare sector is down 2% this year vs the broader market.
Figure 25: European Healthcare relative and Healthcare ex Novo Nordisk relative to the market
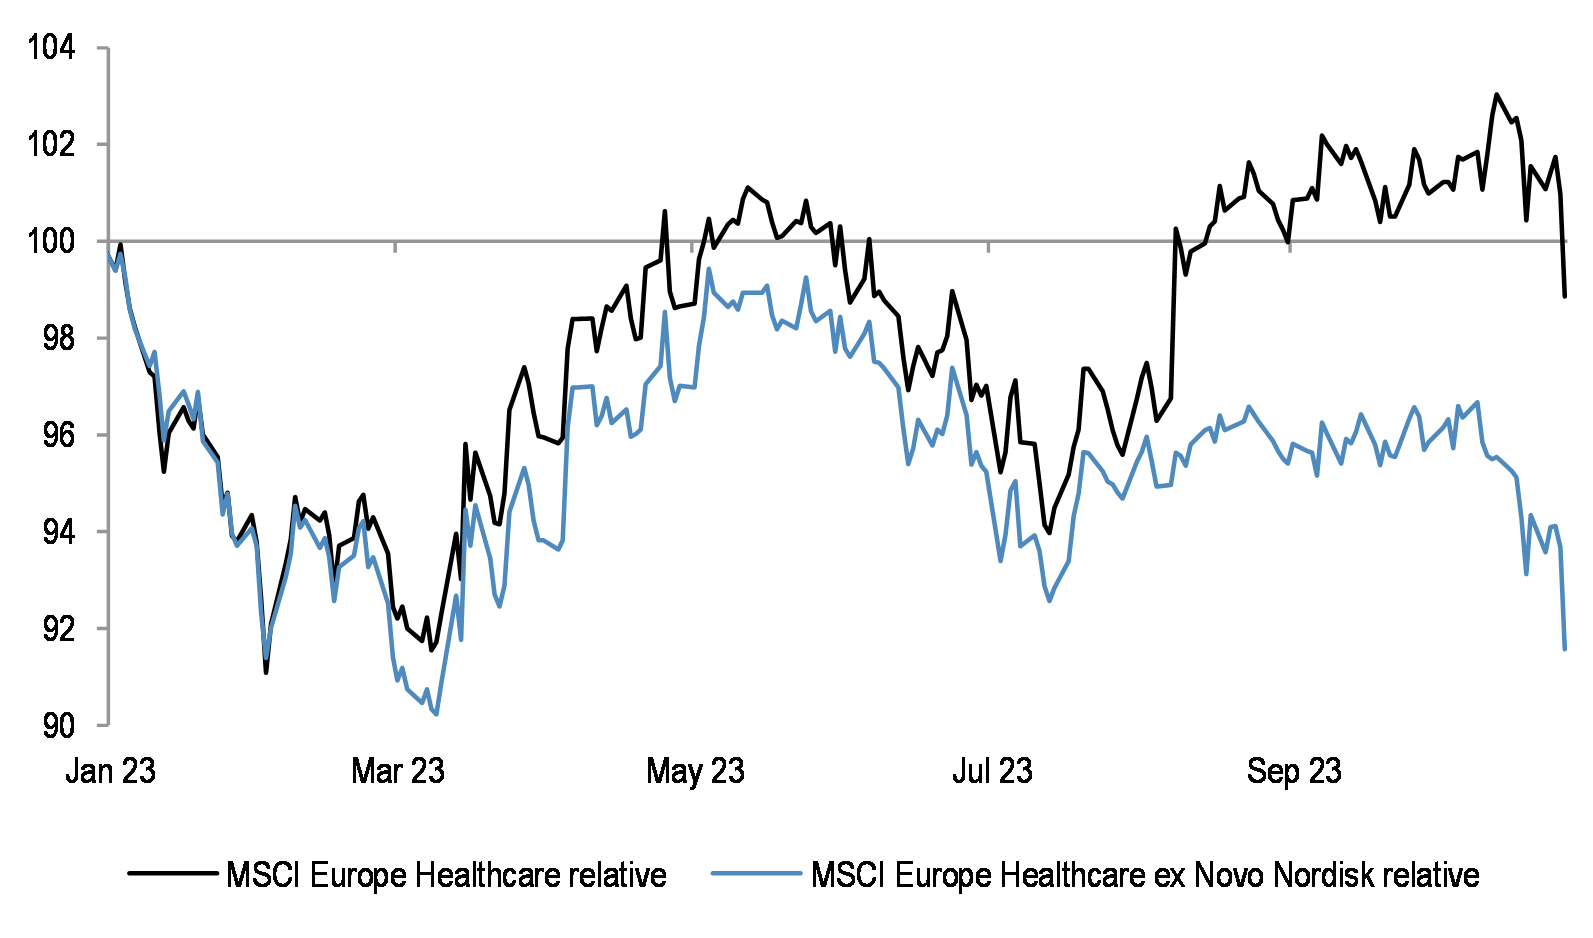
The bulk of the sector’s performance this year can be attributed to Novo Nordisk, driven by supportive newsflow around its GLP-1 drug. Excluding this stock, the rest of the sector is down 8% ytd.
Figure 26: European Healthcare price relative and EPS relative
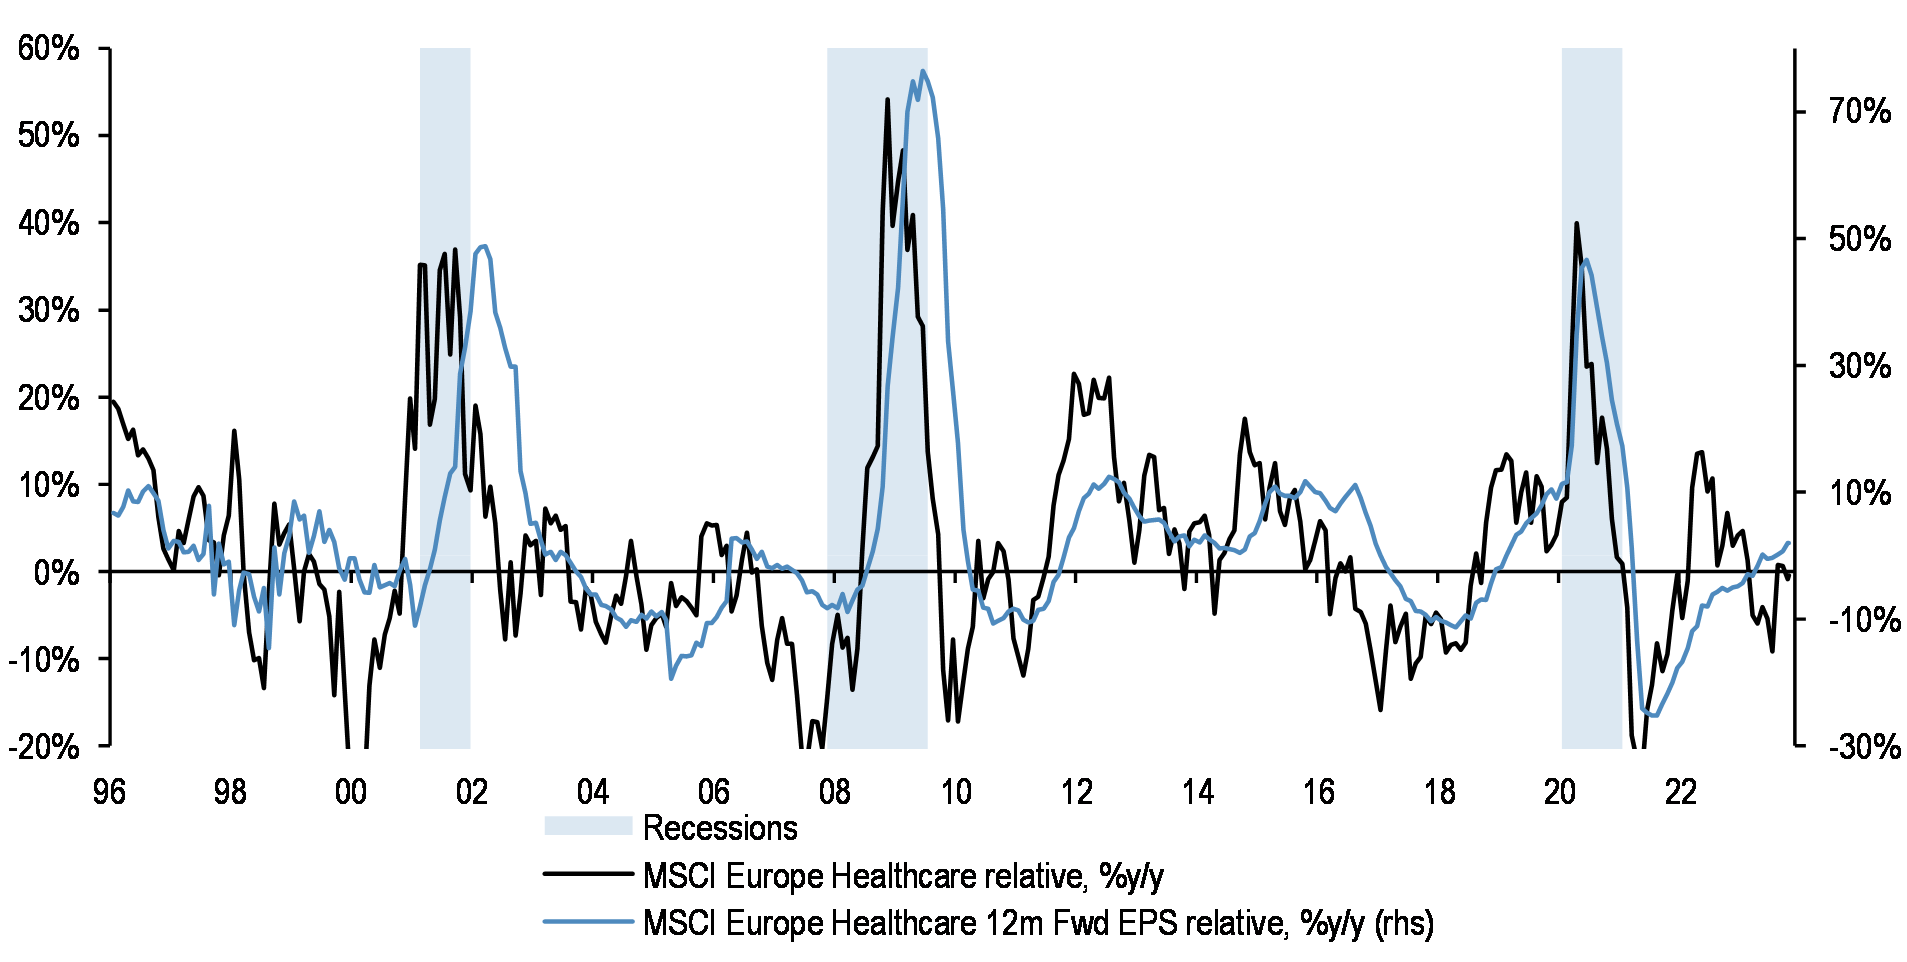
Healthcare is a pure Defensive play, with sector earnings typically more insulated than the broader market during periods of economic contraction.
Figure 27: European Healthcare 12m Fwd. EPS relative
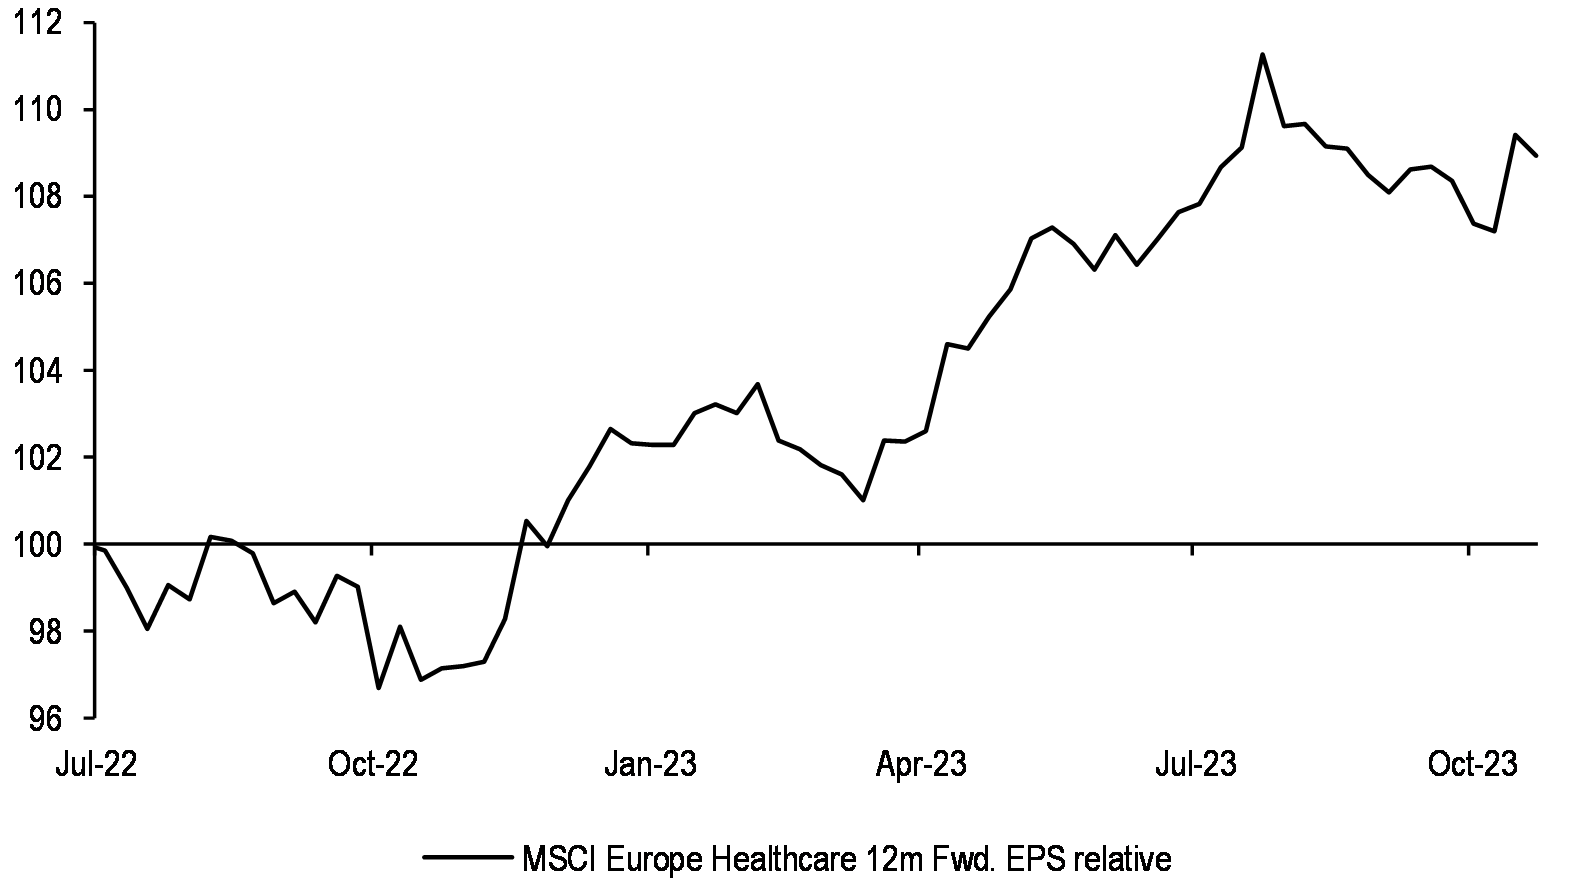
Our Healthcare analysts see upside potential to earnings for the sector, with renewal of pipeline newsflow, and patent expiry risk only at the end of the decade.
Figure 28: Healthcare price relative vs US 10 year bond yield
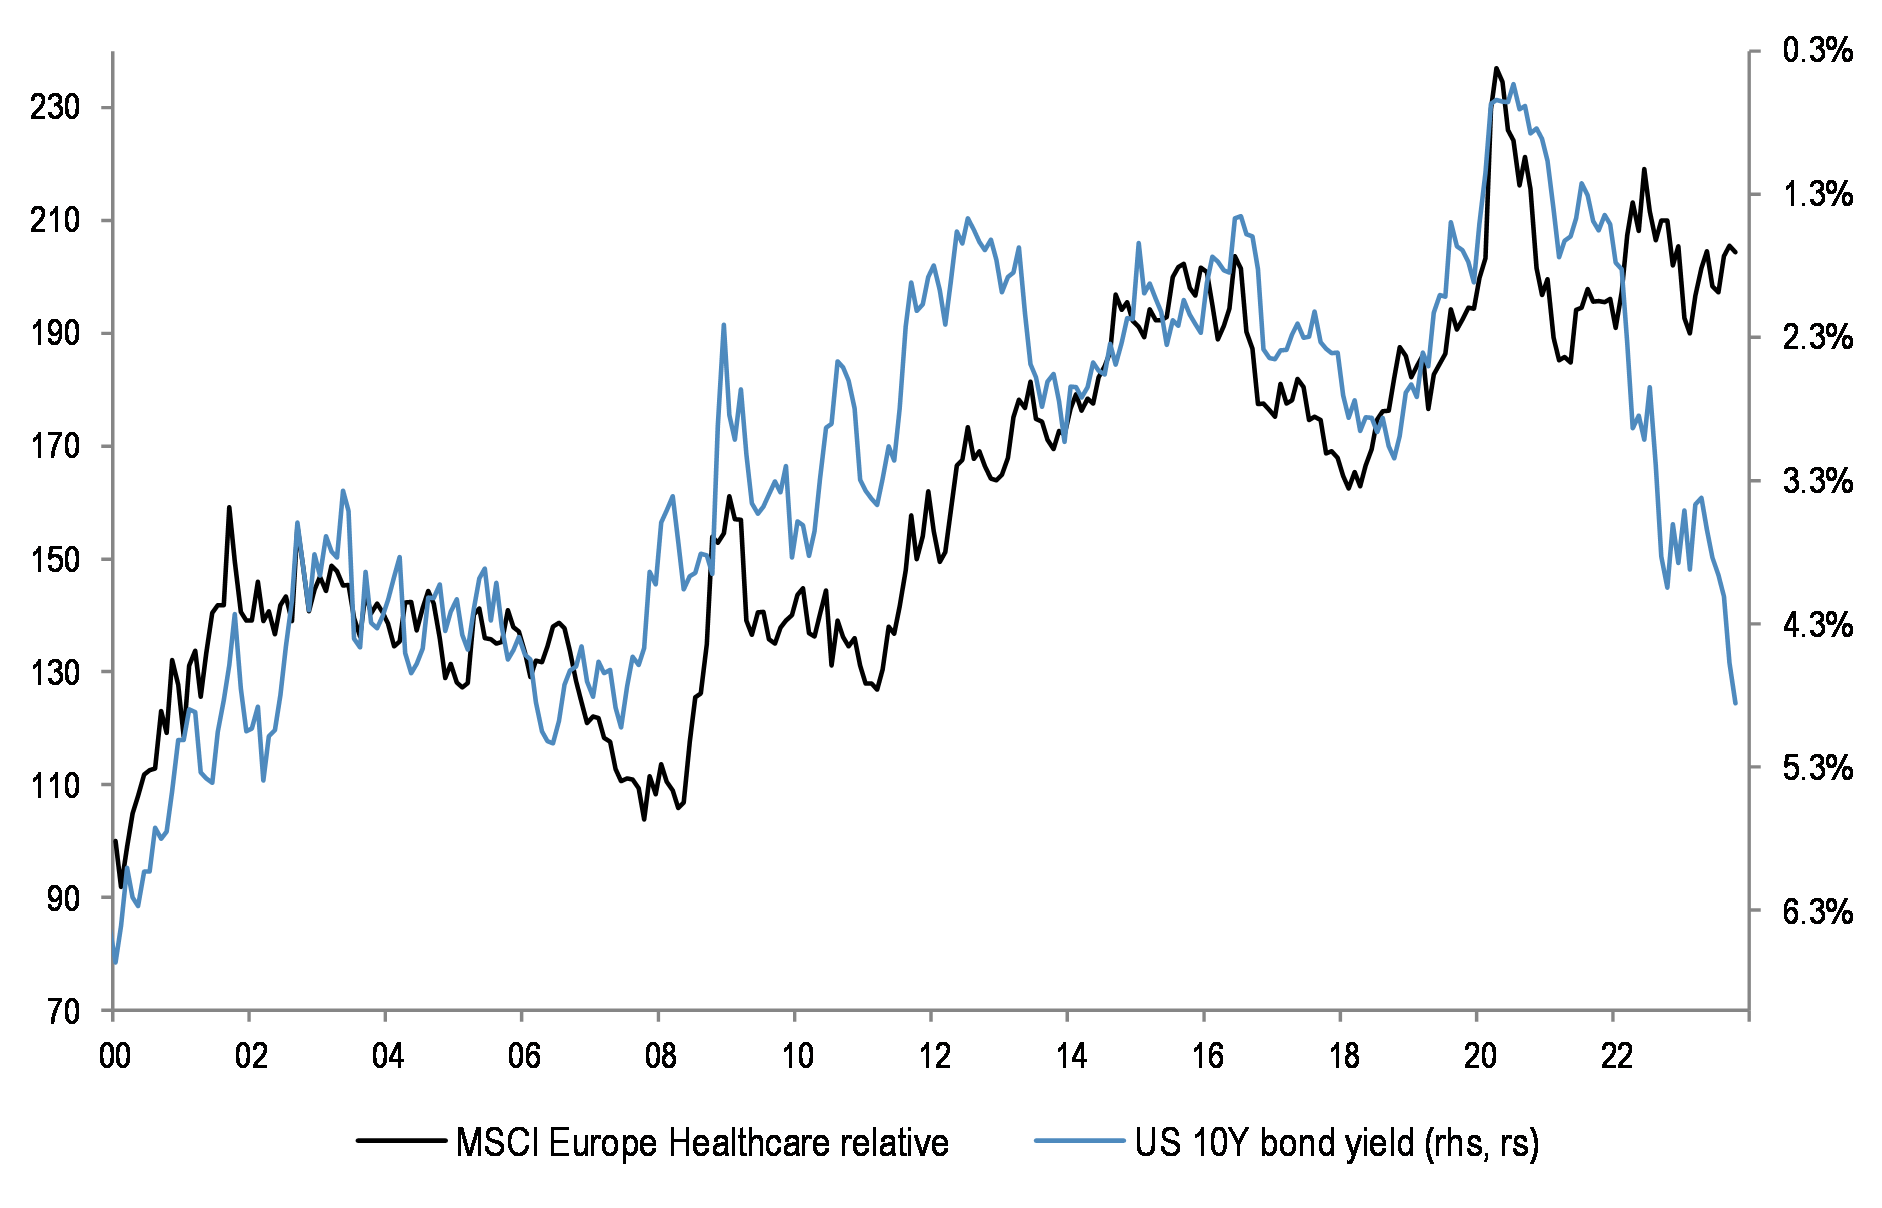
The sector is traditionally a bond-proxy, and should be helped if bond yields peak out.
Figure 29: MSCI Europe Healthcare relative and tradeable USD
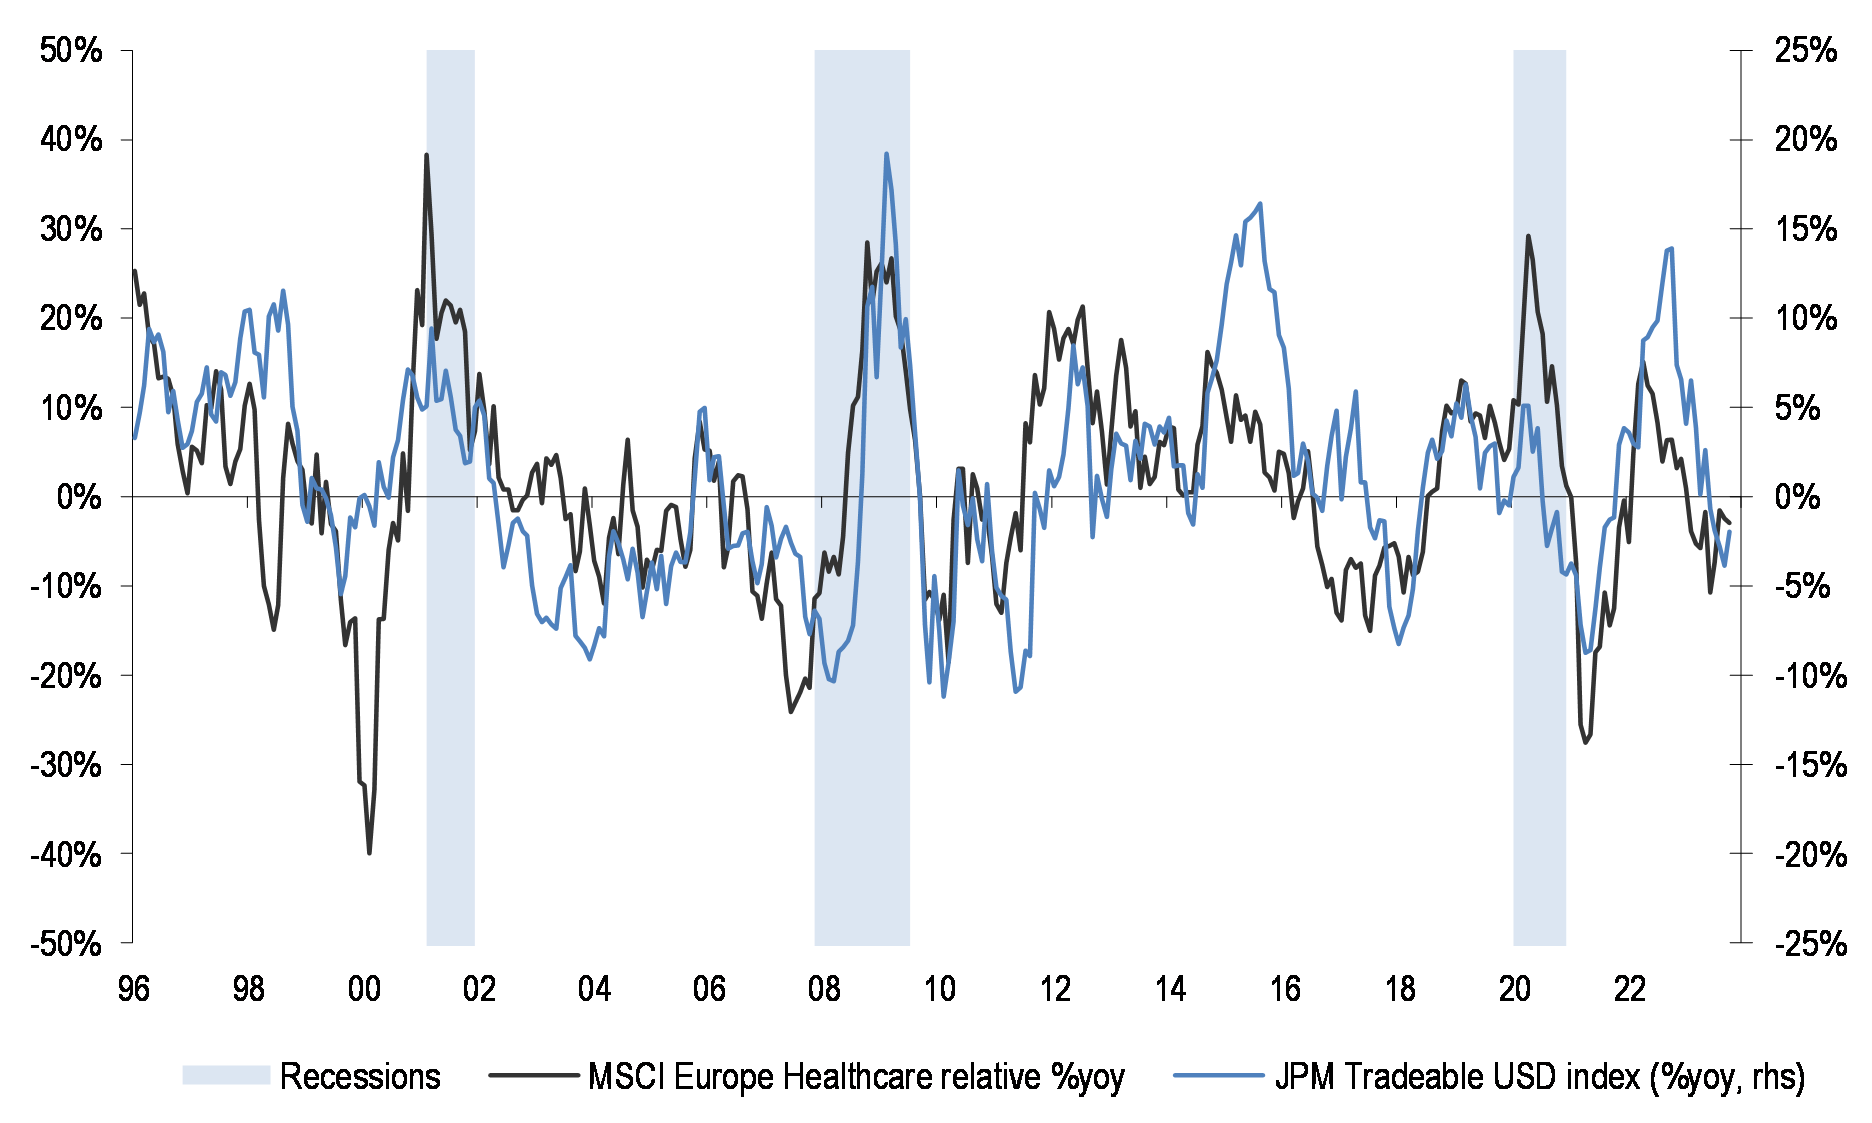
Importantly, Healthcare has meaningful USD revenue exposure, and is likely to do better if the dollar keeps rising.
If Banks start to lag, then the periphery could fall behind core markets…
Figure 30: Periphery vs Core and Banks relative
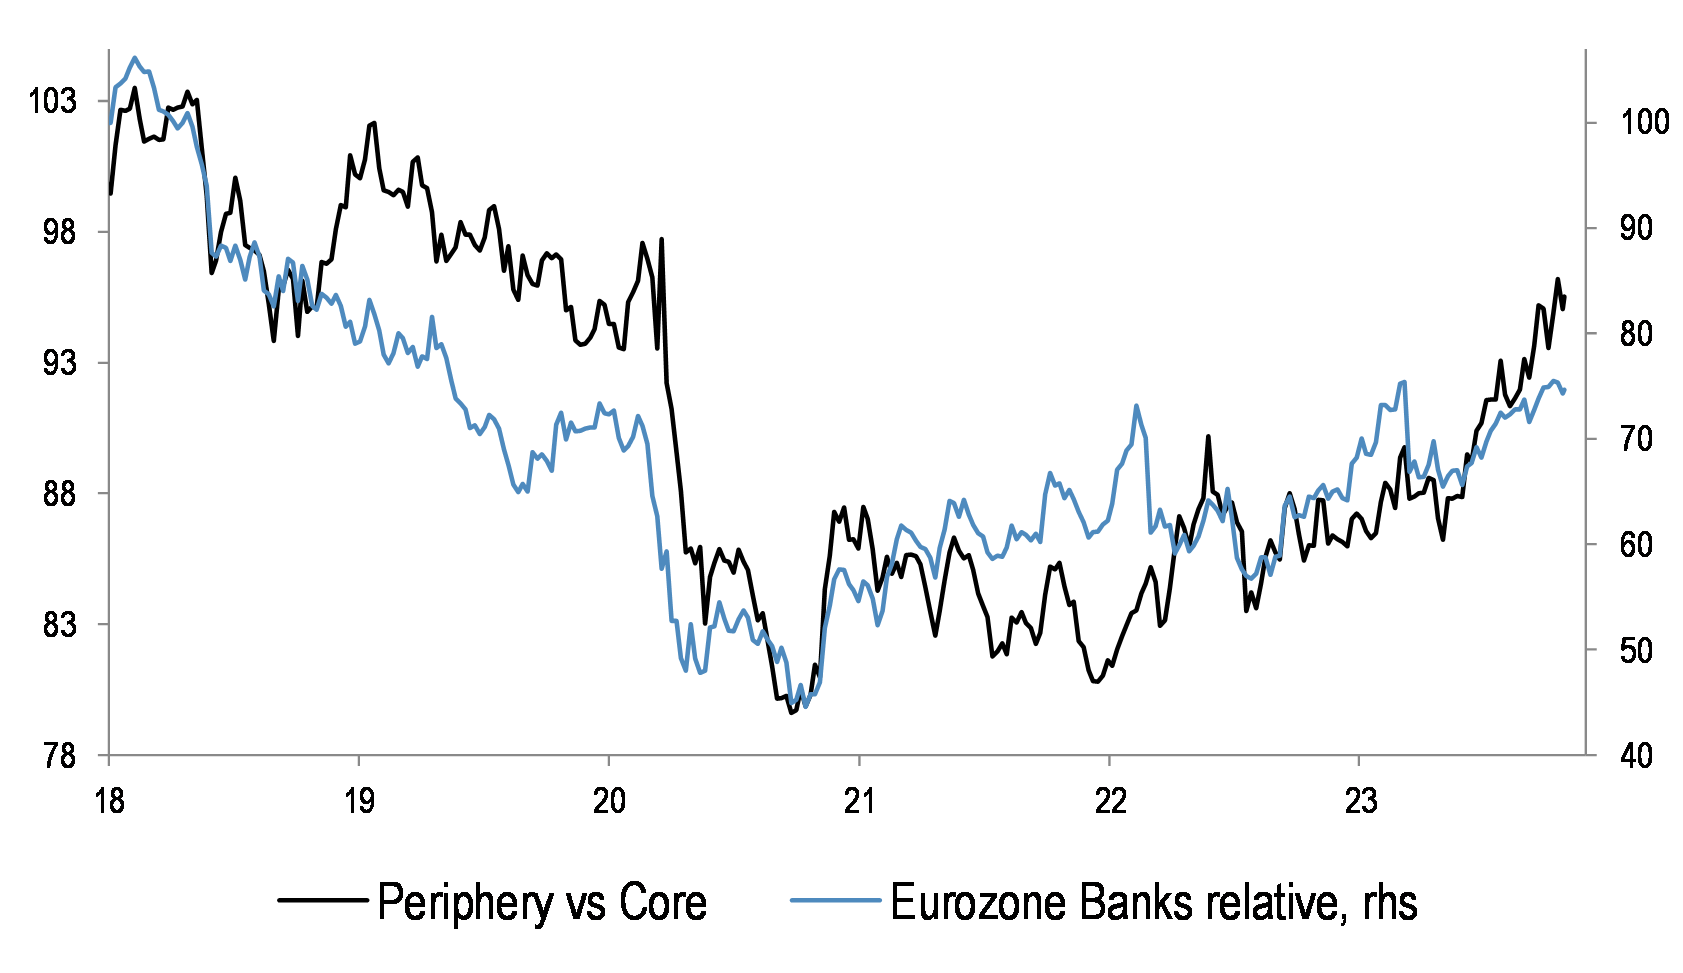
Given the higher weight of Banks in Italy and Spain, the fate of the Periphery vs Core performance is closely tied to that of Banks sector performance. If Banks underperform from here, then Periphery is likely to fall, as well.
Figure 31: Periphery vs Core performance since Jan 2020
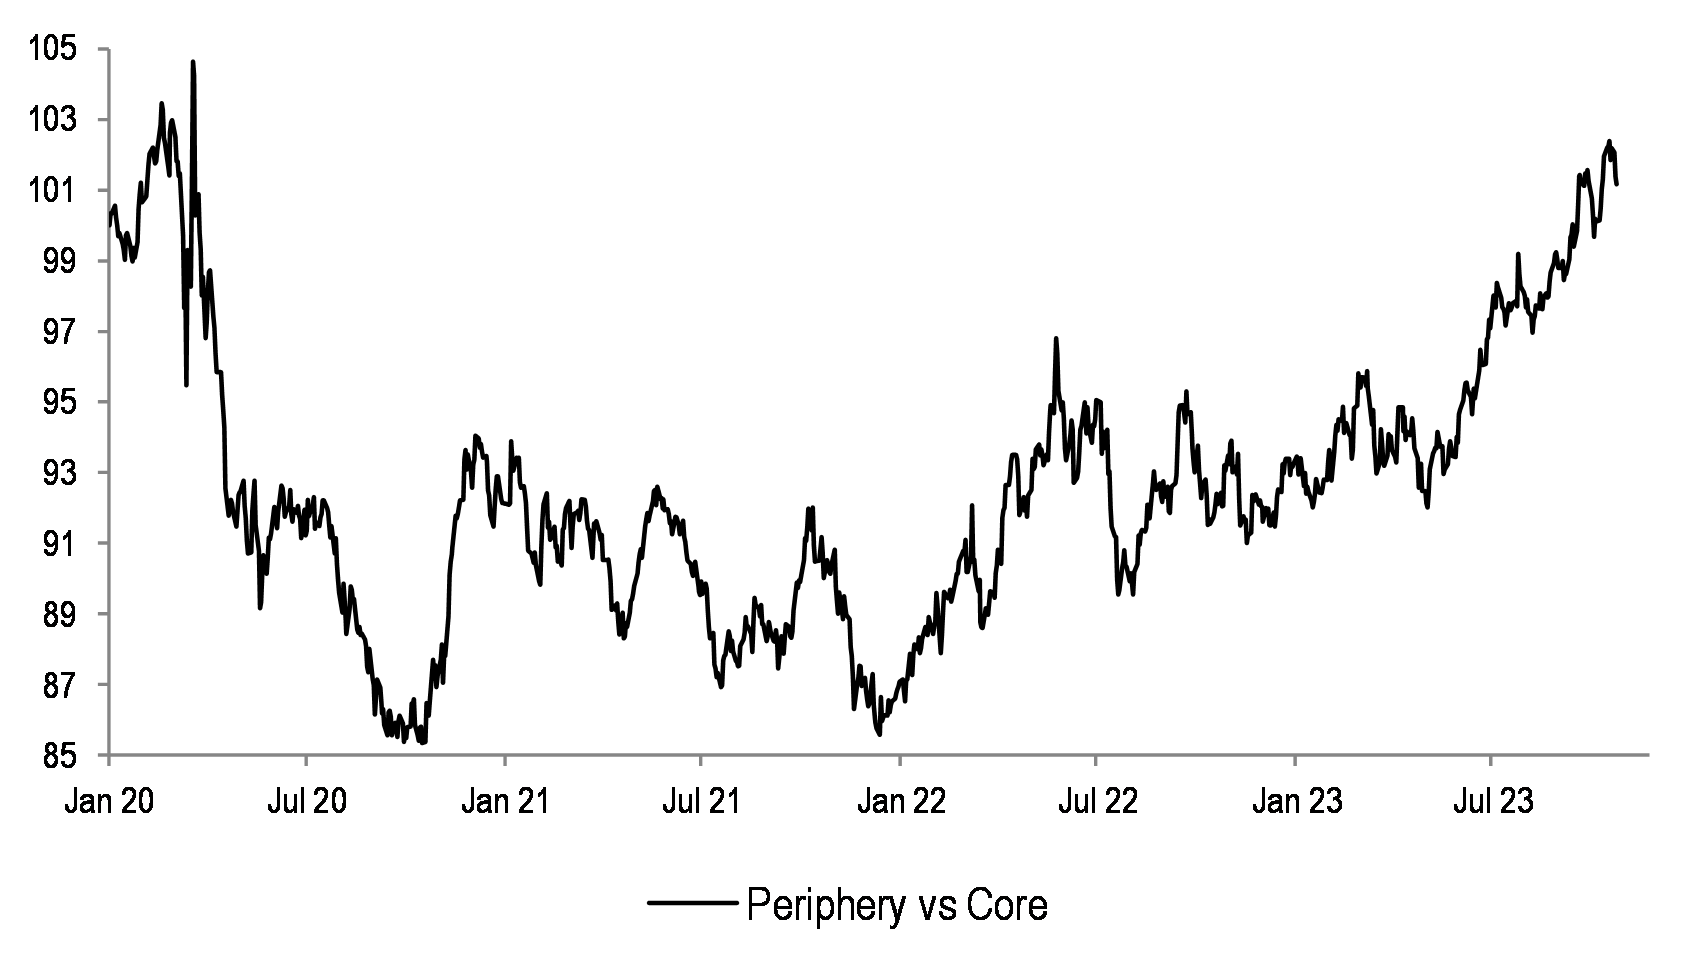
Periphery has done well relative to core markets in the last few years, but could turn, particularly if peripheral spreads widen.
…within periphery, one could open the Spain vs Italy trade
Table 5: MSCI Spain and Italy sector compositions
| MSCI Italy | MSCI Spain | |
| Financials | 34% | 33% |
| Discretionary | 24% | 17% |
| Utilities | 18% | 24% |
| Energy | 12% | 5% |
| Industrials | 6% | 9% |
| Healthcare | 3% | 1% |
| Comm. Services | 2% | 11% |
| Staples | 2% | 0% |
| Materials | - | - |
| IT | - | - |
| Real Estate | - | - |
| Cyclicals | 30% | 26% |
| Defensives | 25% | 36% |
Source: Datastream
Within periphery, Spain has a greater tilt towards Defensive sectors, and so is better protected against potentially falling rates and a weakening economy. In addition, Spain has higher exposure to Latam countries - our EM team are OW both Brazil and Mexico.
In Brazil, they expect rate cuts to drive better growth, and look for upgrades to current revenue estimates. Mexico has seen robust EPS growth, driven by stronger US and near-shoring trends. Mexican equities still appear attractive on key valuation metrics. The region is also an attractive carry on the USD-MXN trade – see report.
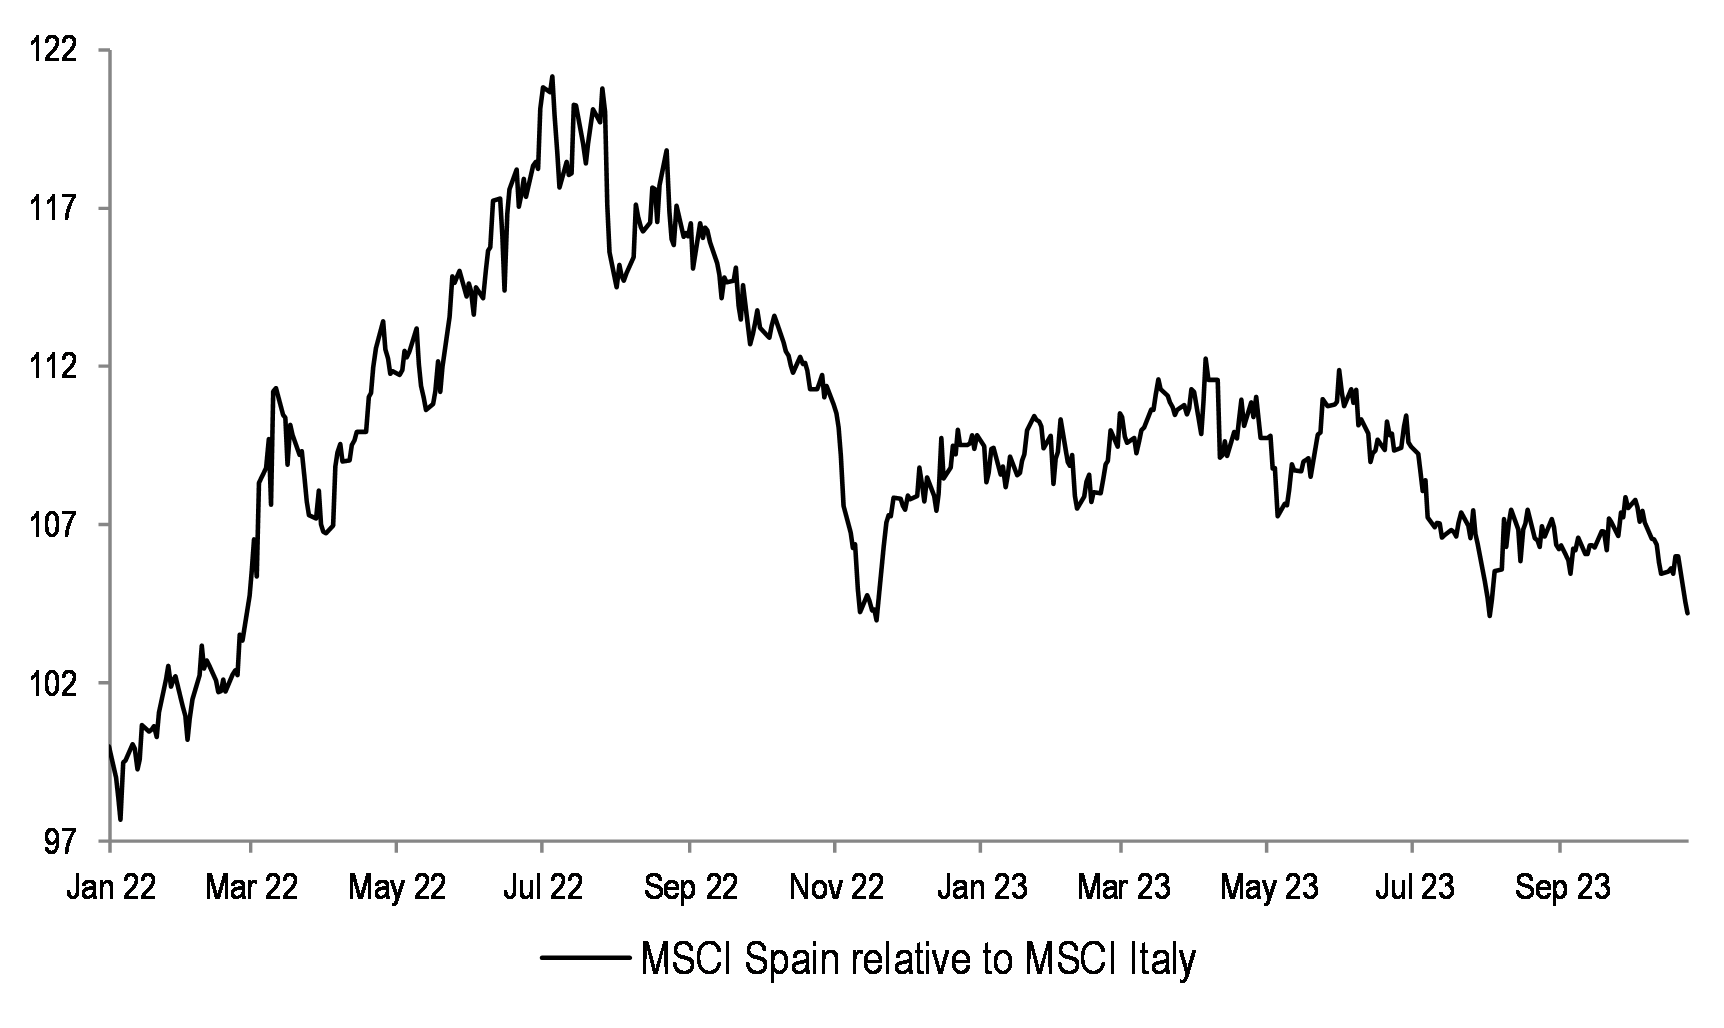
Source: Datastream
Spanish equities have lagged Italian equities since mid-2022, and could rebound from here.
Earnings results are starting to be more challenging
Figure 33: SXXP quarterly EPS growth and Global composite PMI
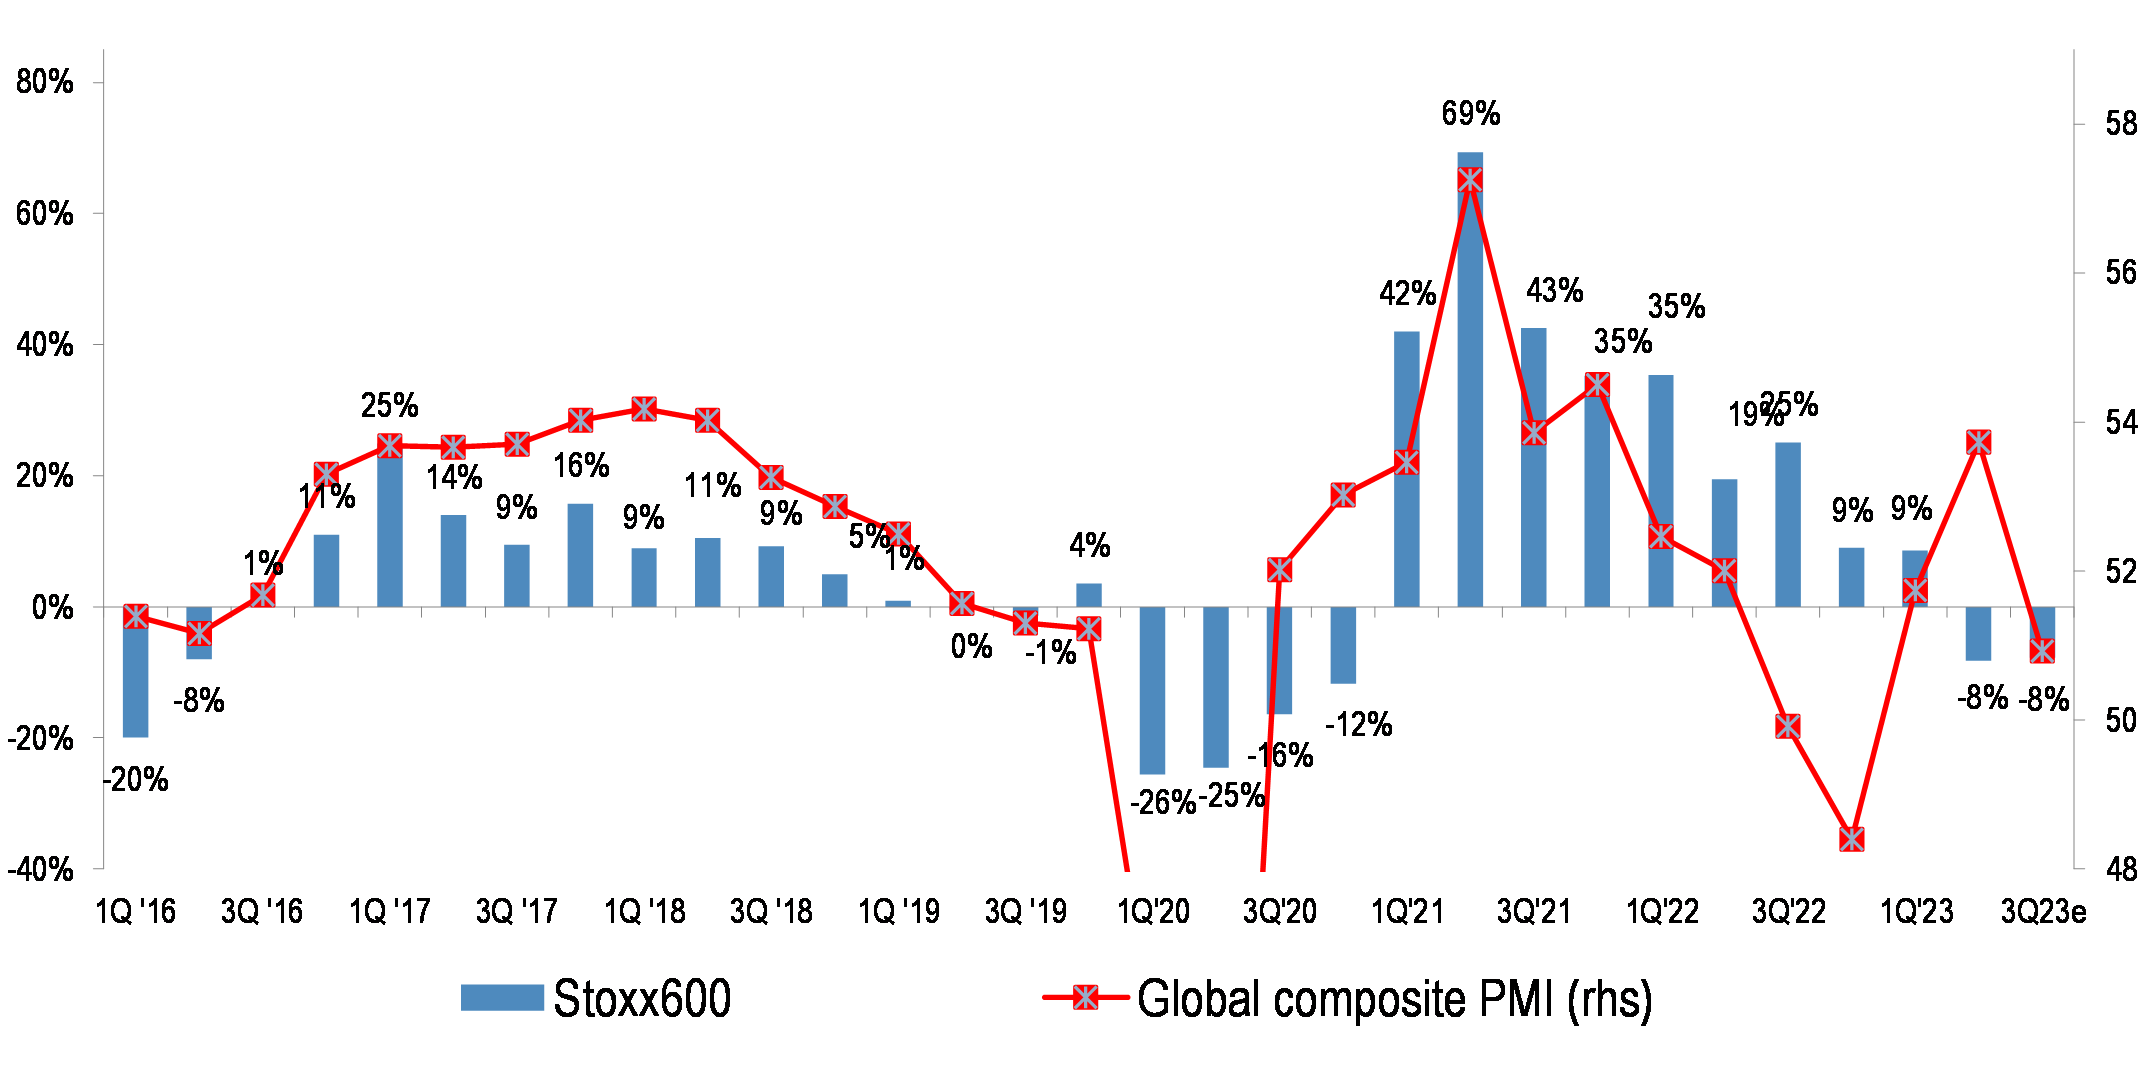
With nearly half the companies having reported so far, earnings delivery has been mixed. In Europe, EPS growth is negative for a second quarter in a row, in line with the more pronounced activity weakness in the region.
There appears to be more profit warnings this quarter compared to average, with several companies flagging lower volumes/demand, deteriorating macro environment and inflation pressure – see Appendix for the full table.
Figure 34: % of companies beating quarterly sales estimates in US and Europe
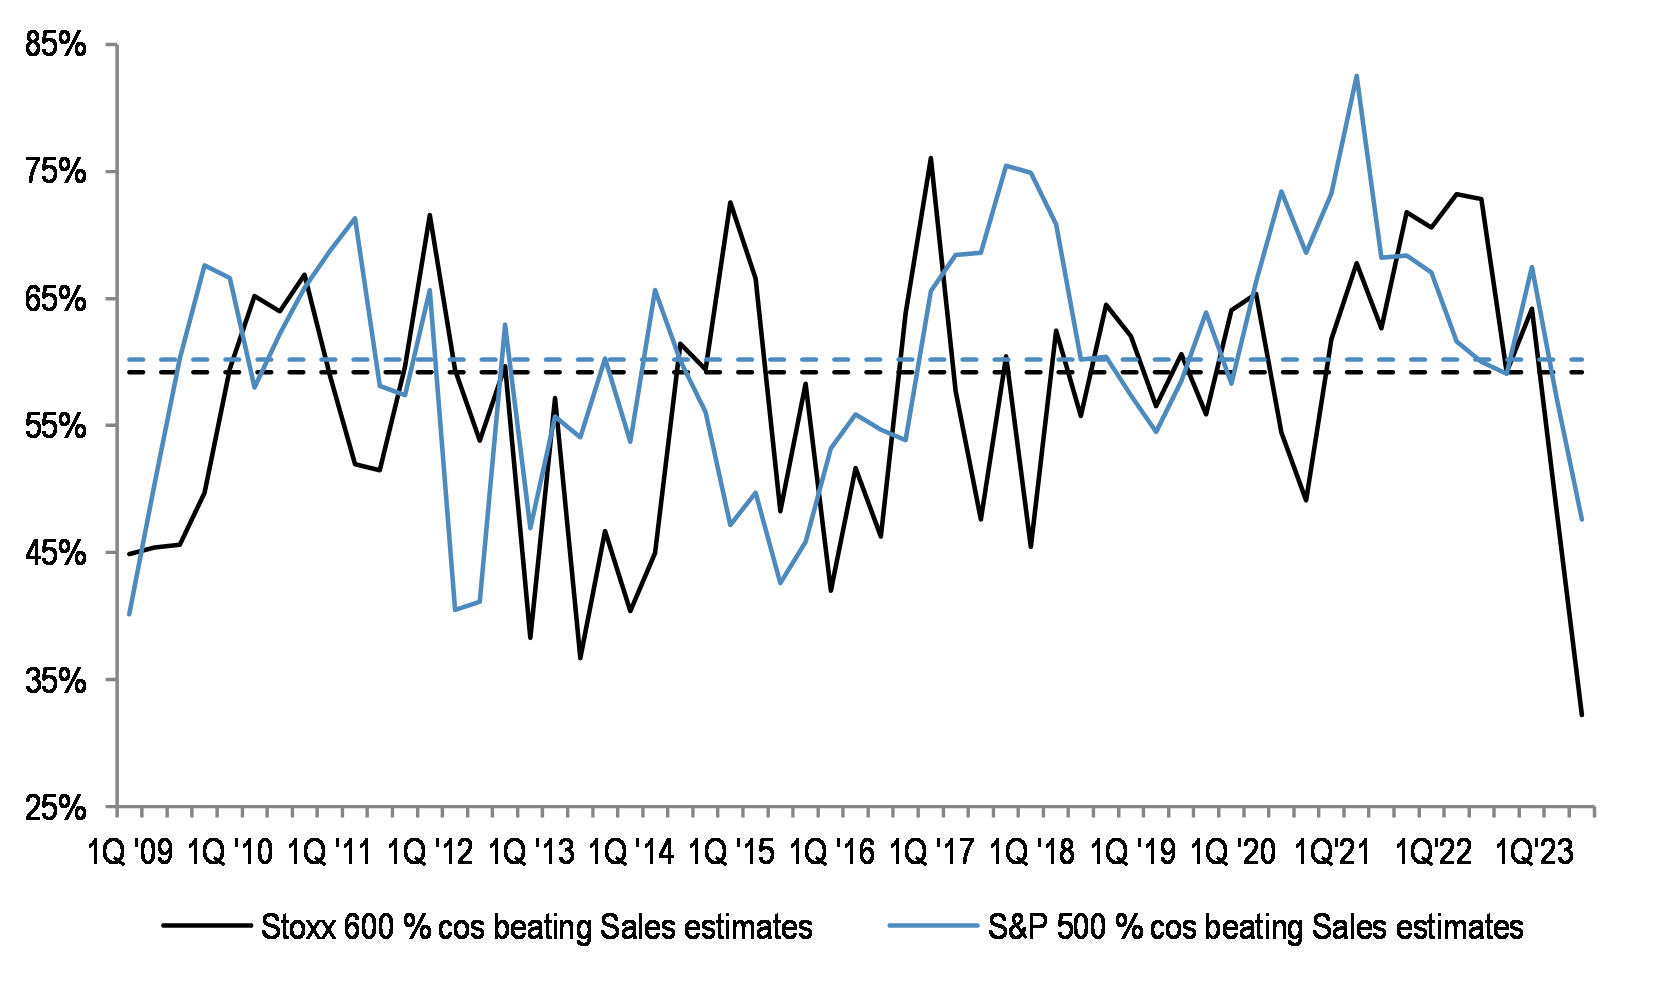
Notably, top line delivery has been disappointing, particularly in Europe. The proportion of companies beating sales estimates has fallen to the lowest since we started compiling the data more than a decade ago.
In the table below, we outline the important Q3 earnings commentary from key Banking stocks. For those that have not yet reported, we include the earnings preview from our sector analysts.
Table 6: MSCI Europe top 20 Banks Commentary
| Company Name | Ticker | Weight in Index | JPM Rating | Commentary |
| HSBC HOLDINGS | HSBA LN | 19.0% | N | The focus of results to be on NII momentum and asset quality outlook with China CRE under pressure. |
| BNP PARIBAS | BNP FP | 8.2% | N | While BNP's results were broadly as expected, divisional trends showed weakness in retail-banking operations, particularly in France and Italy, whereas CIB and corporate center showed lower provisions and lower costs. |
| BANCO SANTANDER | SAN SM | 7.6% | N | Banco Santander earnings beat estimates as higher interest rates in Europe and Mexico continued to boost revenue and offset a rise in loan loss charges. |
| BBV.ARGENTARIA | BBVA SM | 6.0% | N | Strong delivery on NII and low CoR in Spain well should bode well for BBVA. |
| ING GROEP | INGA NA | 5.9% | OW | Although the new taxes are yet to be finalized, based on the current proposal, negative impact on earnings is manageable; total revenue will benefit from fee growth recovering. |
| UNICREDIT | UCG IM | 5.4% | OW | UniCredit lifted its full-year revenue target for the third straight quarter, and posted better-than-expected third quarter net income and said it will use a get-out clause to avoid paying the Italian government’s bank windfall tax, helping to preserve its plans to return capital to investors and laying the groundwork for peers to follow suit. |
| INTESA SANPAOLO | ISP IM | 4.9% | OW | Intesa Sanpaolo results are expected to be supported by NII with still low deposit beta and benign cost of risks with costs largely in line with expectations. |
| NORDEA BANK | NDA SS | 4.4% | N | Small NII improvement mainly explained by deposit margins, day count and treasury effects and low loan losses are positives, whereas, slightly weaker than expected trading income is a negative. |
| LLOYDS BANKING GROUP | LLOY LN | 4.3% | UW | Lloyds beat Q3 expectations helped by a drop in defaults and higher interest rates, but warned that the benefits of higher rates are starting to wane. |
| BARCLAYS | BARC LN | 3.7% | OW | Barclays lowered its guidance for net interest margin this year to between 3.05% to 3.1% having already cut this guidance in July, as the benefit of higher interest rates start to fade amid competitive environment for UK retail deposits. |
| STANDARD CHARTERED | STAN LN | 2.7% | OW | Standard Chartered PLC's third-quarter underlying net profit dropped 30%, weighed by higher credit impairment and operating expenses as the bank suffered a blow of almost $900 billion because of its exposure to China. |
| SKANDINAVISKA ENSKILDA BANKEN A | SEBA SS | 2.3% | UW | SEB beat analysts’ estimates for third quarter net income supported by low loan loss provisions and strong trading income. |
| DNB BANK | DNB NO | 2.3% | N | Norway's largest lender was unable to meet net interest expectations on repricing lag; asset quality is showing some signs of normalization. |
| SOCIETE GENERALE | GLE FP | 2.2% | N | Below consensus net operating profit expectation, driven by lower revenues in French retail (excluding insurance) and Financial services to corporates. |
| NATWEST GROUP | NWG LN | 2.0% | N | Natwest warned that higher interest rates were leading to a shift in deposits. They reported weaker than expected NIM, and lowered FY NIM guidance |
| CAIXABANK | CABK SM | 2.0% | N | Strong delivery on NII and low CoR in Spain well should bode well for Caixa Bank. |
| DANSKE BANK | DANSKE DC | 2.0% | N | Question is how long the lender can sustain high growth trends in net interest income; expect credit losses to remain low. |
| SWEDBANK A | SWEDA SS | 1.9% | N | Net interest income continued to soar in the third quarter, but the growth rate was lowest in a year as the rates boost of the recent years is tapering off. |
| KBC GROUP | KBC BB | 1.9% | N | Expect a larger margin impact from deposit outflows than previously assumed; fee income should be lower reflecting lower markets and AUM in 3Q. |
| CREDIT AGRICOLE | ACA FP | 1.8% | UW | Pretax profit estimate is below expectations mainly due to lower revenue in Asset Management, Insurance and French Retail, only offset by lower costs and slightly better provisions. |
Source: Bloomberg Finance L.P., Datastream
Q3 earnings for Banks were mixed so far, with a number of banks flagging risk to NII, and a benefit from high rates starting to wane.
In terms of positioning, we remain cautious on market direction, and keep a barbell of commodities…
Figure 35: European Metals & Mining relative
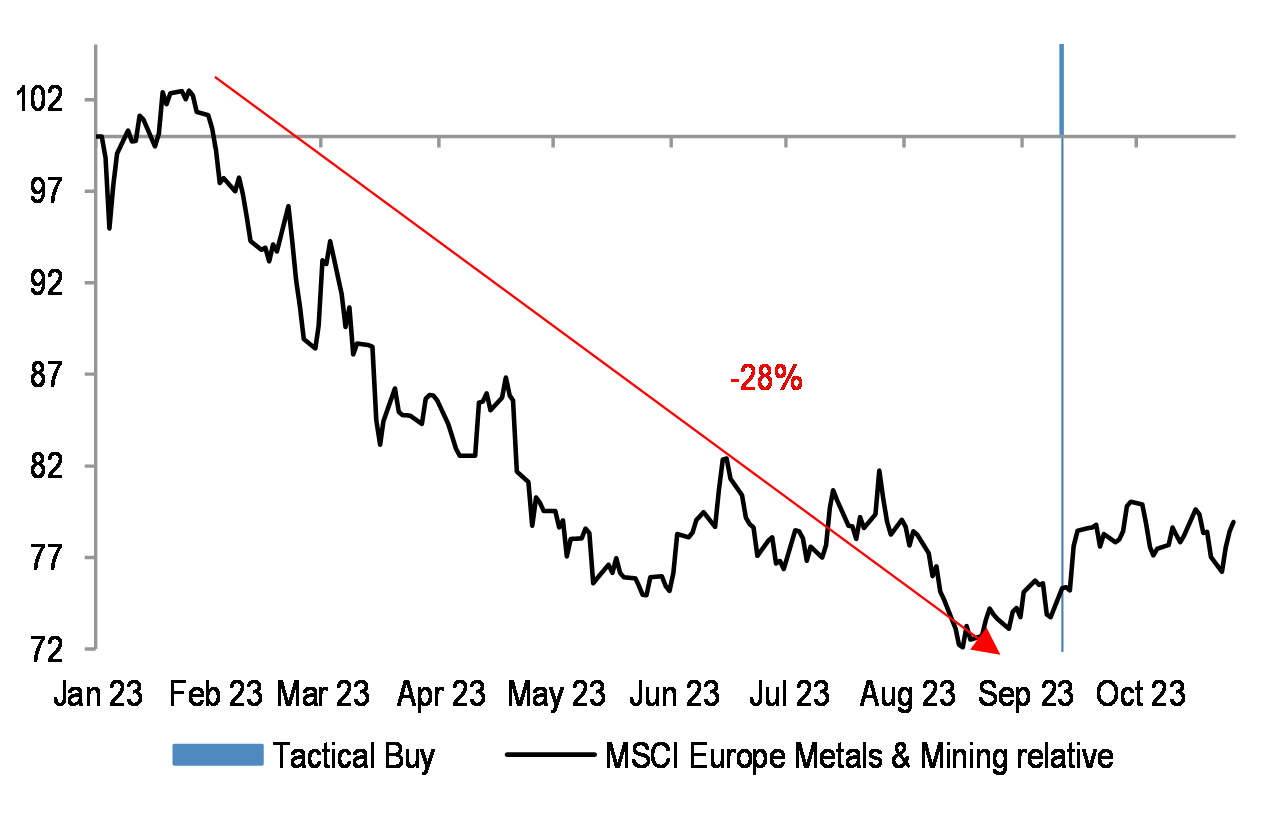
We have last month advised that Miners could tactically trade better, after being cautious on the sector this year, given the 30% underperformance.
Figure 36: Mining EPS and metal prices
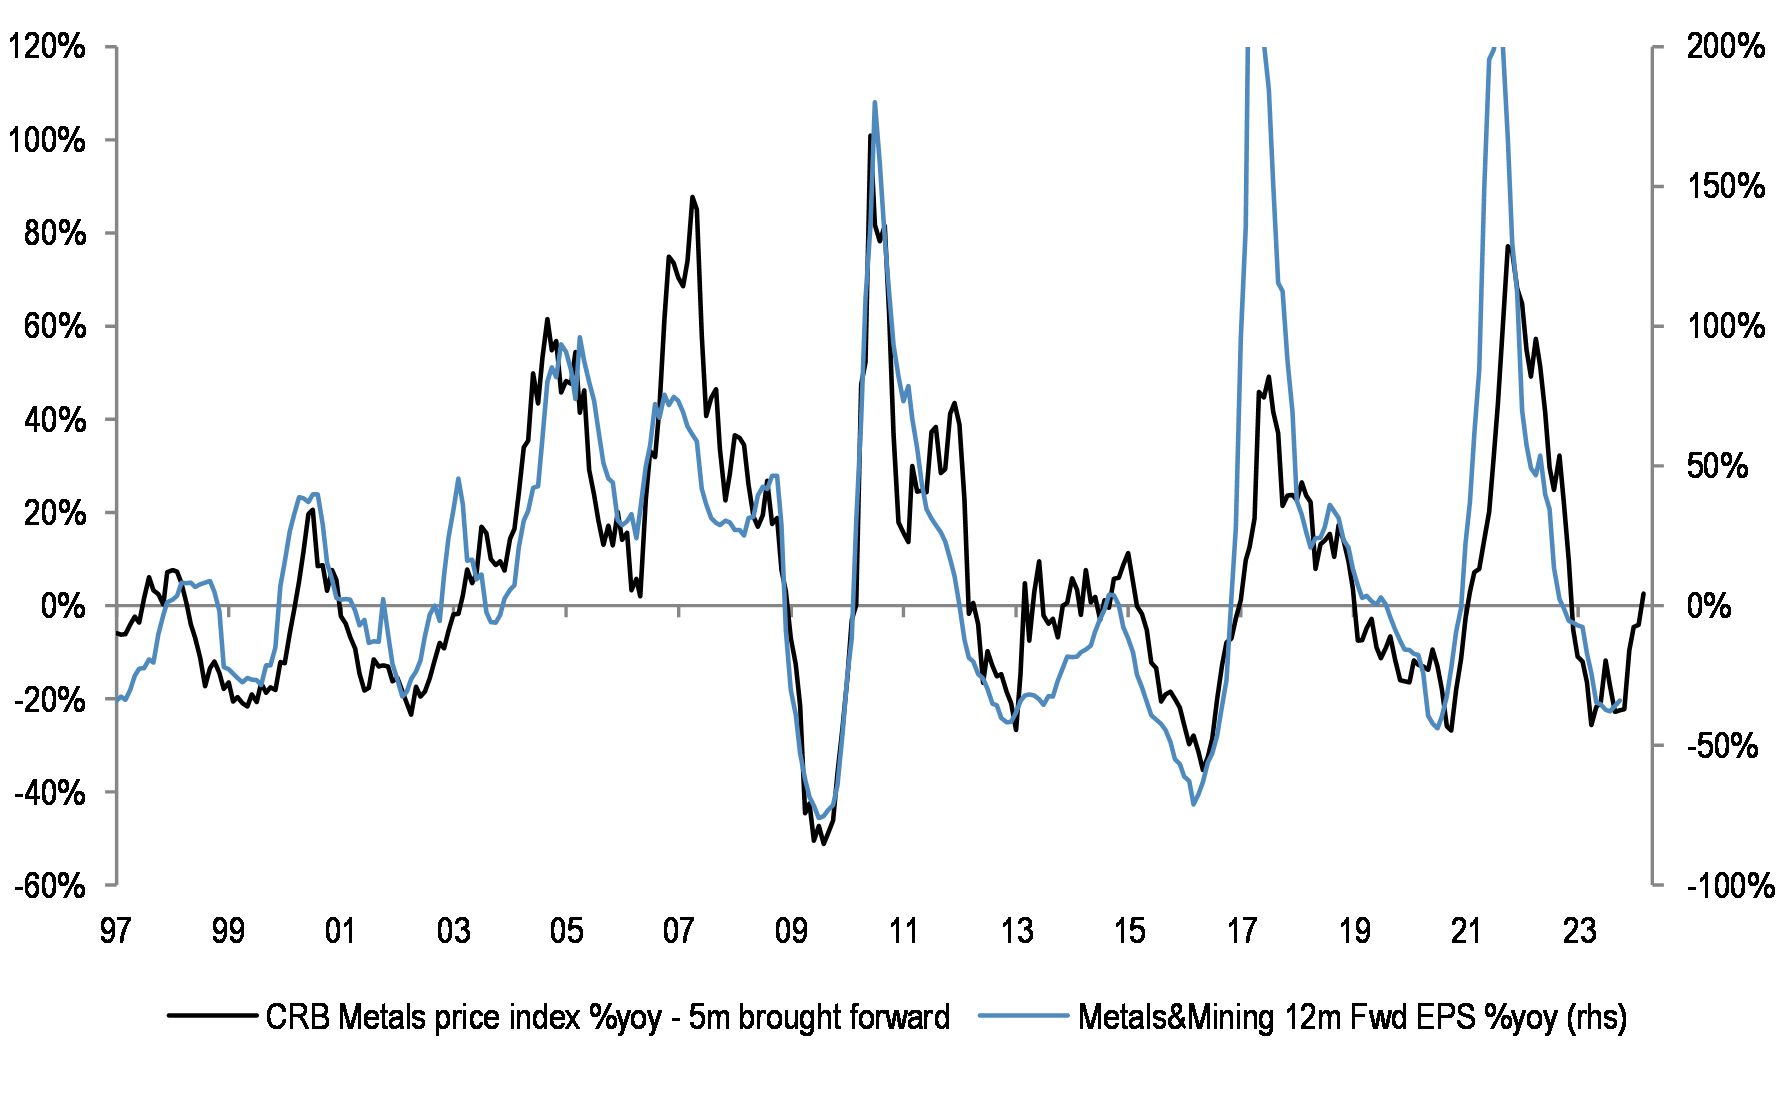
Mining stocks are likely to see earnings upgrades come through, particularly if commodity prices stay supported. China stimulus is coming through.
Figure 37: Energy sector relative performance vs oil price
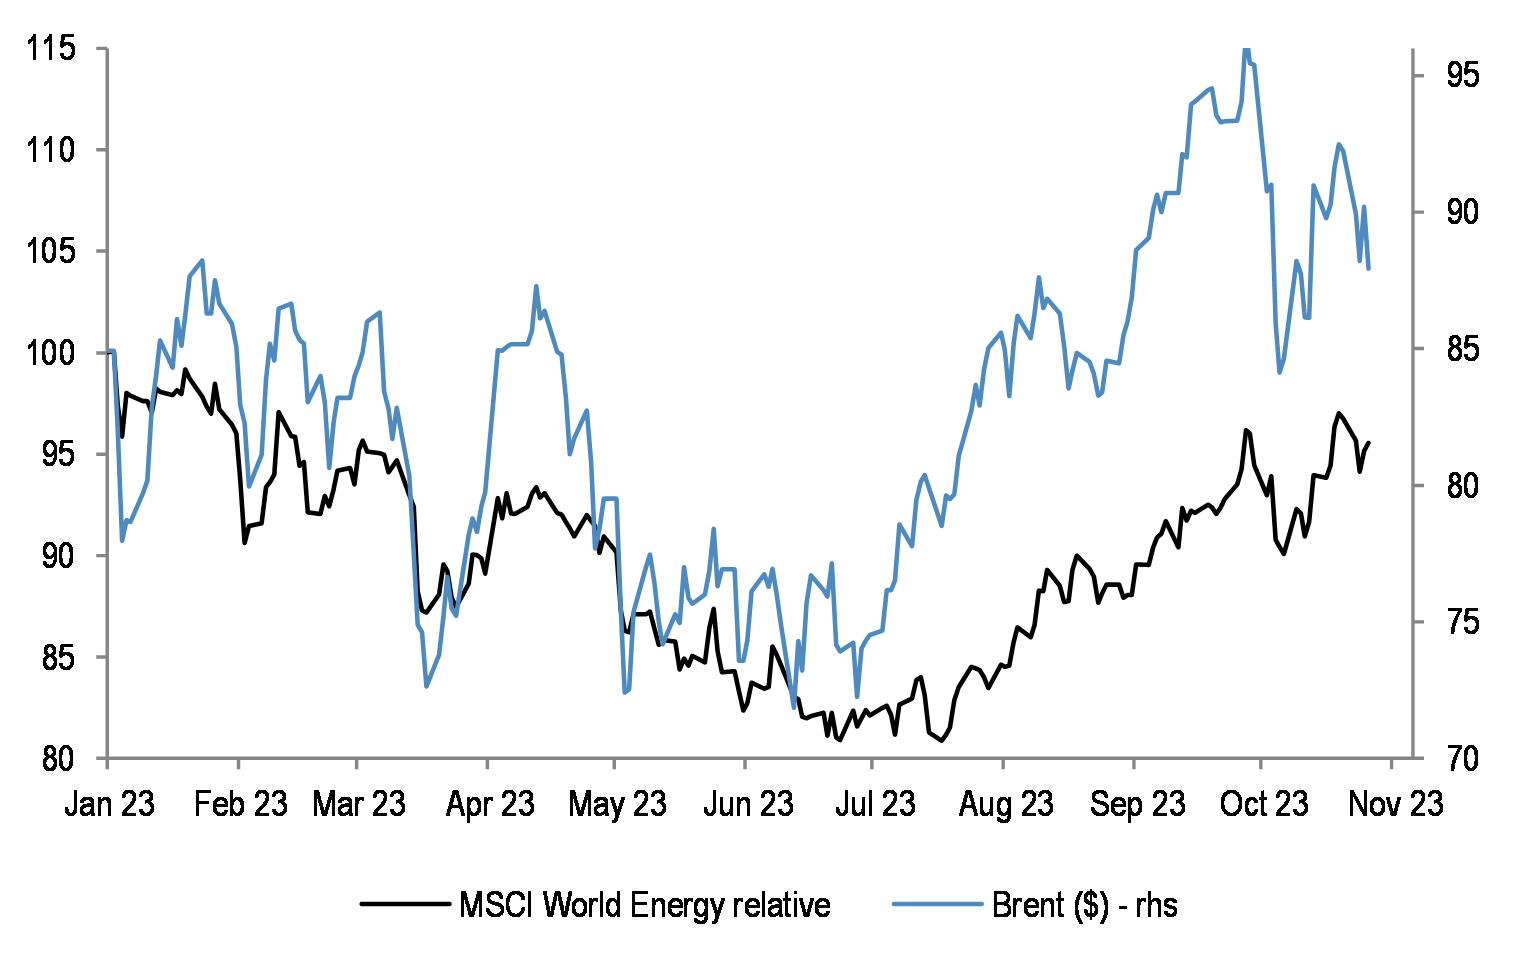
Energy sector remains our OW, it is a good hedge against geopolitical risks increasing.
Figure 38: MSCI Europe Energy 12m Fwd. P/E relative
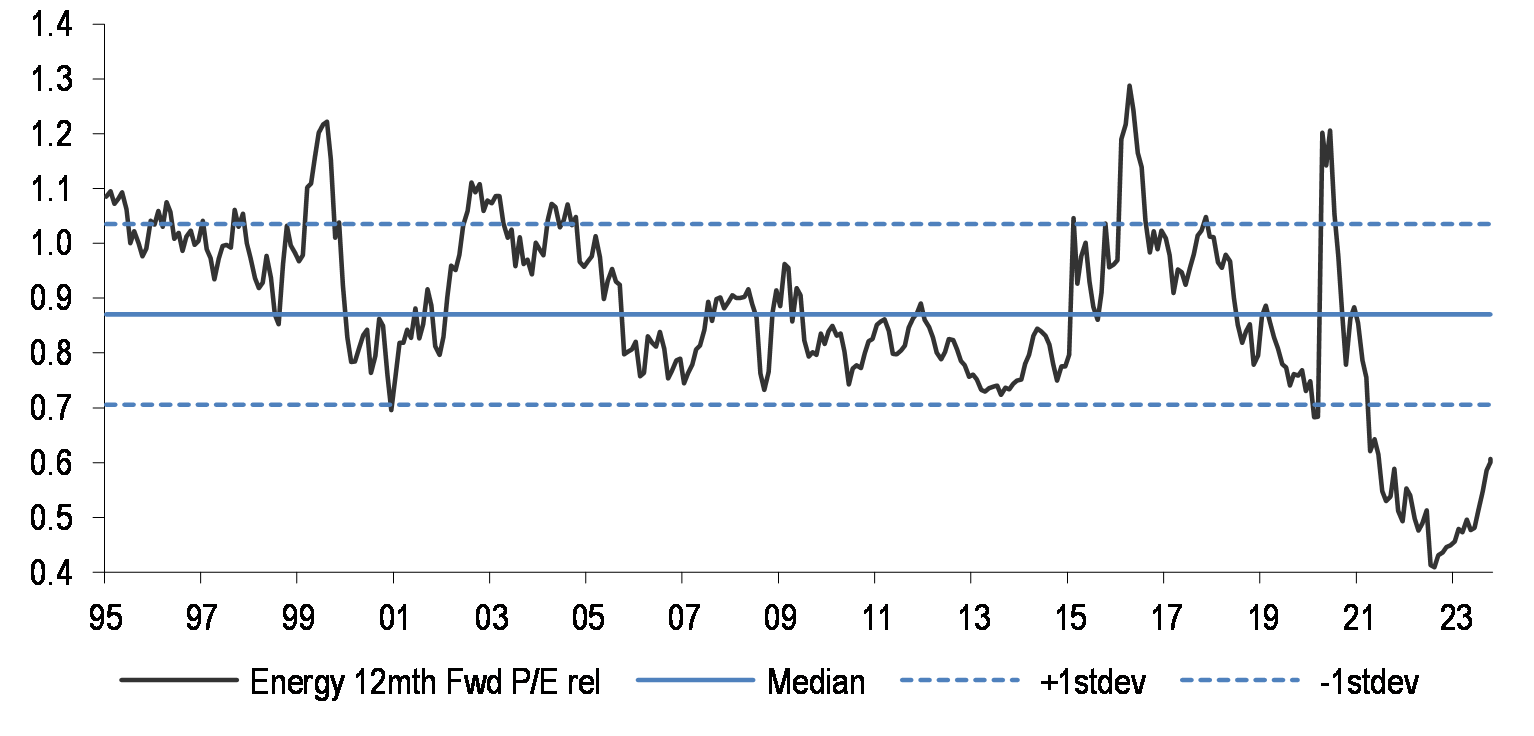
The sector has re-rated recently, but still trades outright cheap on P/E metric.
…bond proxies such as Utilities and Staples should be relative winners, too
Figure 39: European Utilities relative vs US 10Y bond yield
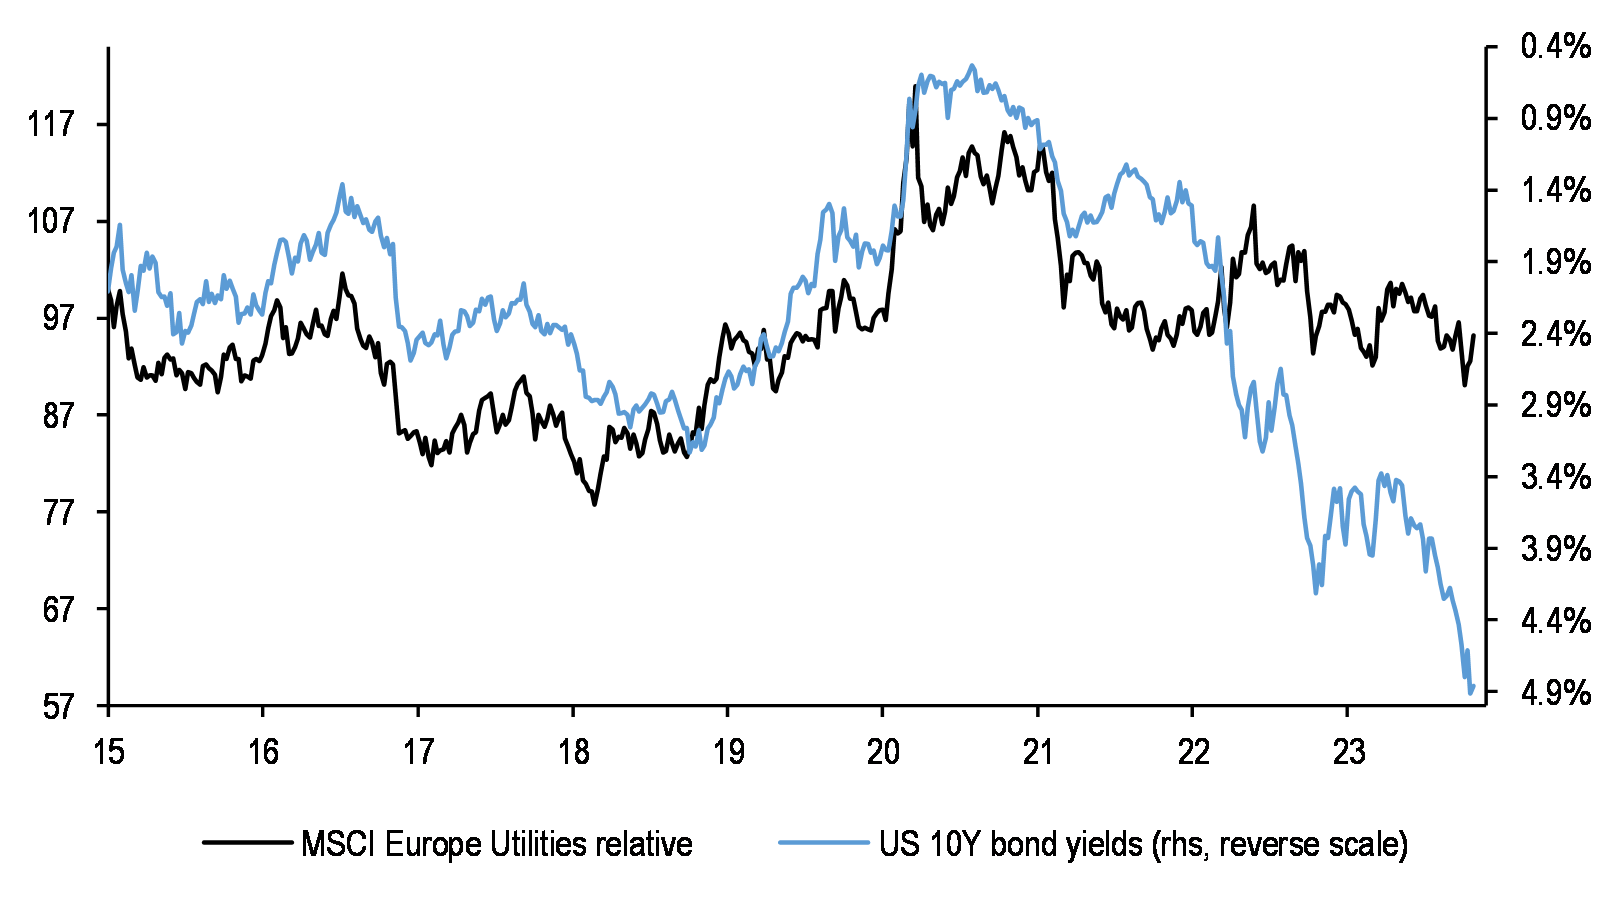
Pure Defensive plays like Utilities are also likely to fare better in an environment of potentially peaking bond yields and more challenging earnings.
Figure 40: European Utilities 12m Fwd. EPS relative
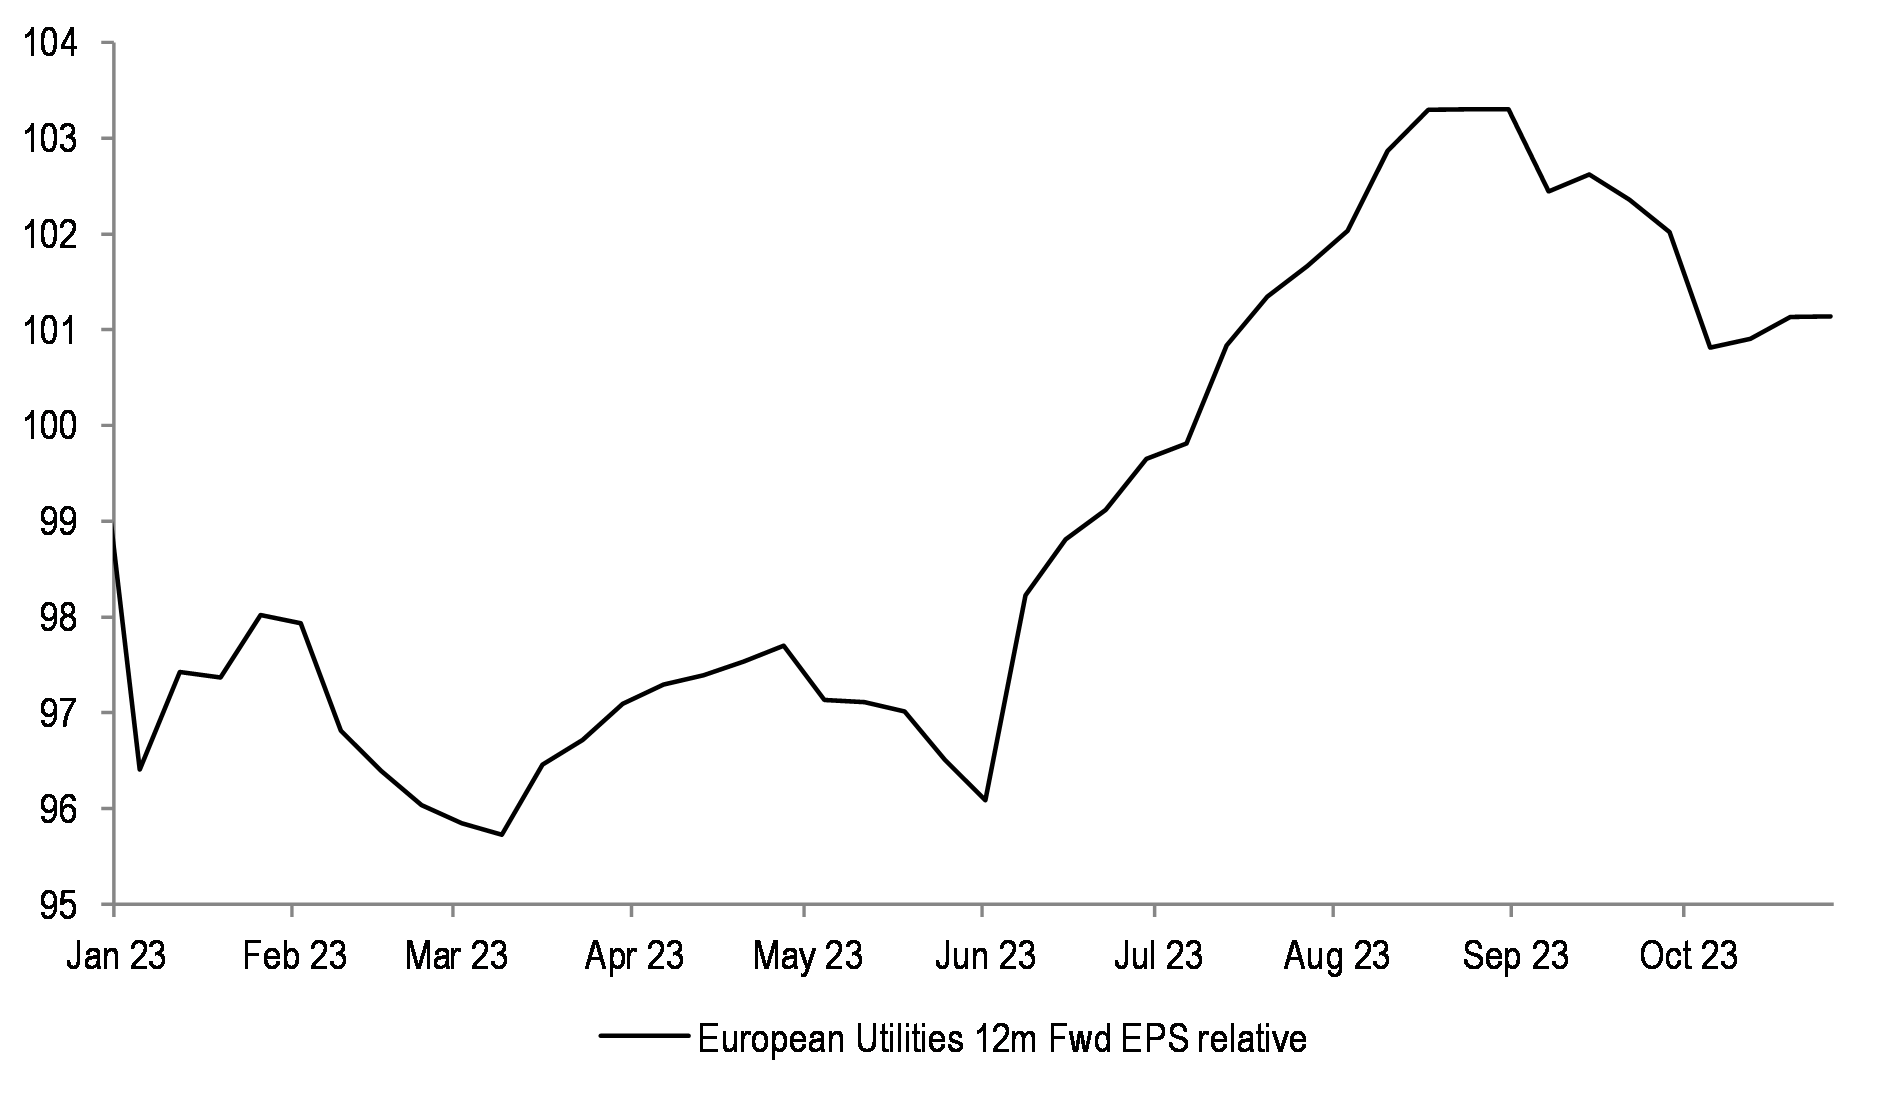
Earnings for Utilities have seen strong positive momentum. We believe high power prices will underpin further earnings support for the sector, with most regulatory headwinds now behind us, too.
Figure 41: European Staples price relative ytd
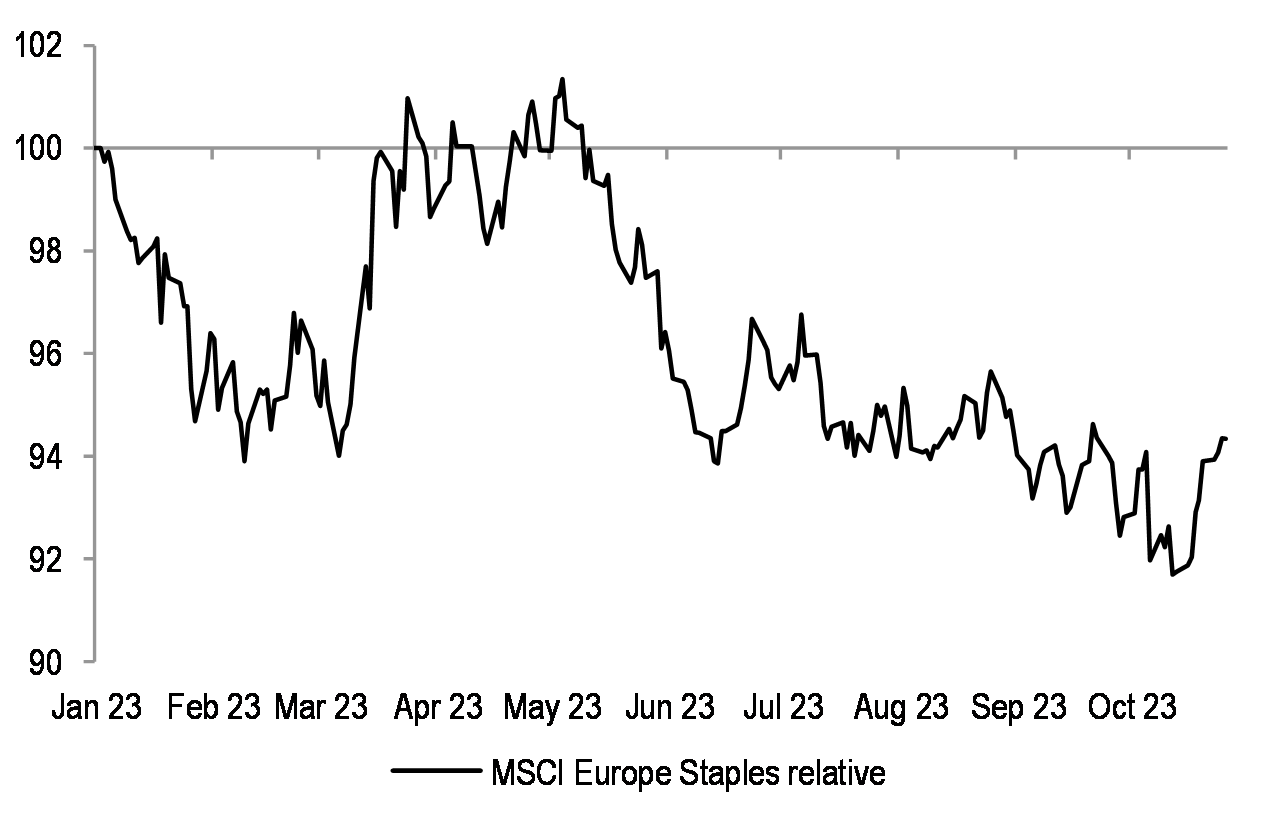
Staples could look more interesting here.
Figure 42: MSCI Europe Staples 12m Fwd. P/E relative
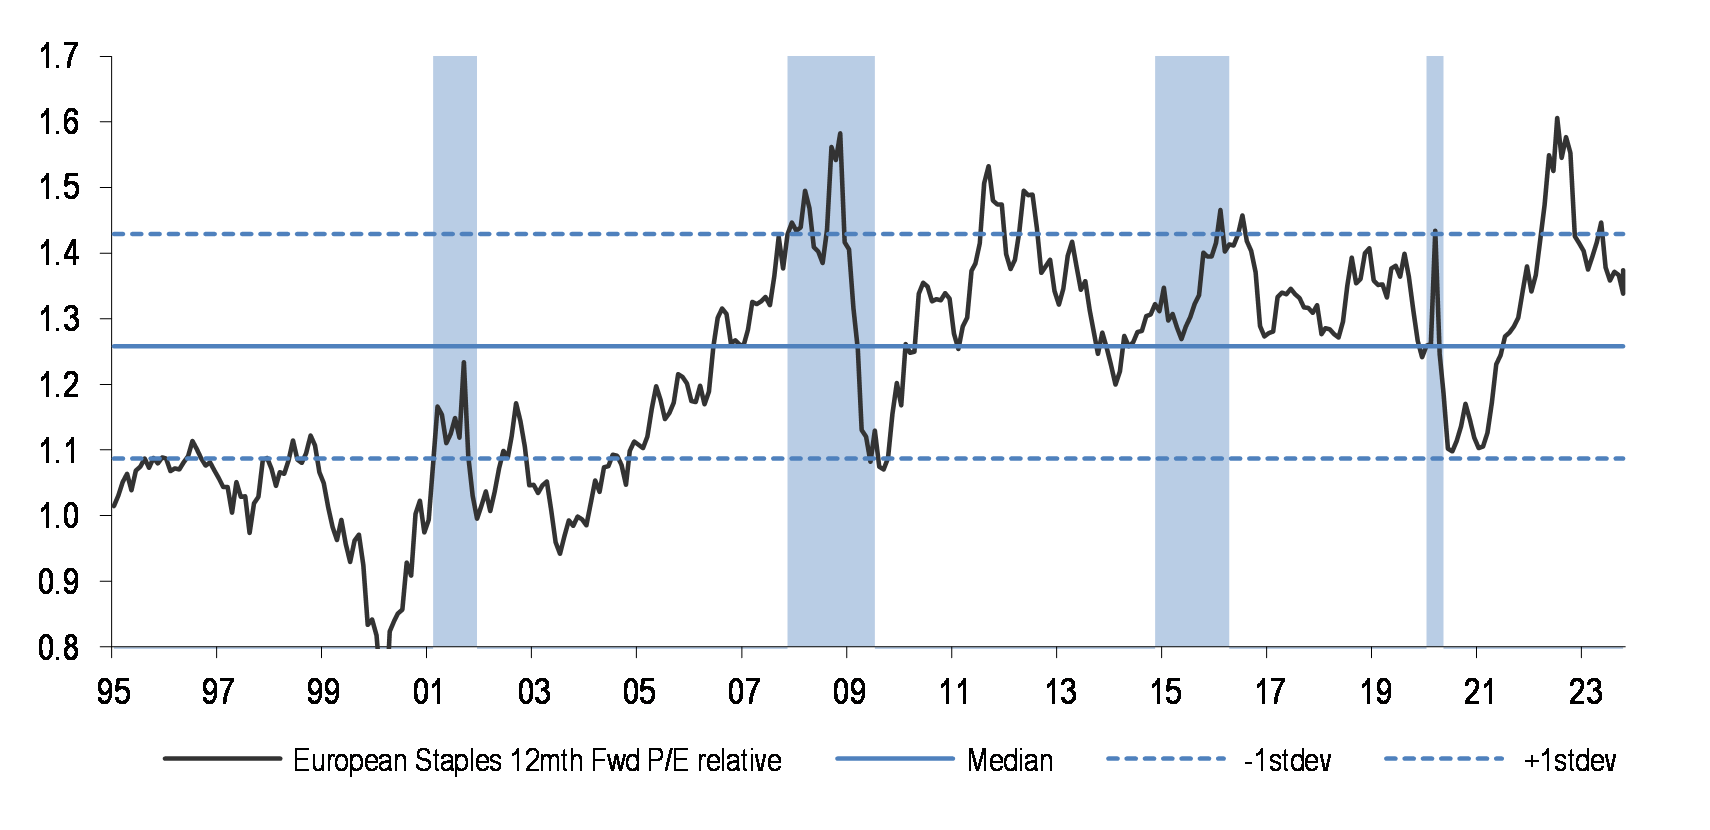
Staples are also a bond-proxy, potentially helped by peaking rates, the group is no longer as expensive as before, and their margins are likely to stabilize next year.
Appendix
Table 7: Recent profit warnings
| Company Name | Company Ticker | Commentary | Date | 1Day Perf relative to market, % | Sector | MV(in $bn) |
| RTX CORP | RTX US | - | 11 Sep | -8.6% | Industrials | 114.3 |
| SIGHT SCIENCES INC | SGHT US | Sight Sciences falls 21% postmarket after the maker of a glaucoma surgery device cut its year revenue outlook, saying uncertainty about the future of Medicare coverage for the company’s products is hurting demand. | 11 Sep | 5.4% | Health Care | 0.1 |
| AMERICAN AIRLINES GROUP INC | AAL US | American Air Cuts Earnings Outlook on Higher Fuel Cost | 13 Sep | -5.8% | Industrials | 7.2 |
| THG PLC | THG LN | lowered its sales forecast, held back by inflationary pressures and its beauty division. | 14 Sep | -23.3% | Consumer Discretionary | 1.0 |
| DELTA AIR LINES INC | DAL US | Delta Air Lines Cuts 3Q Adjusted EPS Forecast | 14 Sep | -1.4% | Industrials | 20.3 |
| NUCOR CORP | NUE US | Steelmaker blames lower pricing and volumes for downbeat earnings outlook | 15 Sep | -4.9% | Materials | 36.6 |
| BITTIUM OYJ | BITTI FH | Bittium lowers its financial outlook for 2023, citing slower pace and lower volumes of deliveries of its tactical communication products and security solutions from the defense and security business unit. | 15 Sep | -6.2% | Information Technology | 0.2 |
| SOCIETE GENERALE SA | GLE FP | The French bank on Monday set a goal for annual revenue growth of between zero and 2% over the next three years, down from at least 3%, and slightly lowered the target for return on tangible equity that some analysts had expected to be lifted. | 18 Sep | -10.9% | Financials | 17.9 |
| NORDIC SEMICONDUCTOR ASA | NOD NO | The chipmaker reduced quarterly revenue and margin forecasts, citing weak demand across its core markets and no signs of improvement amid an industry downturn. | 18 Sep | -8.8% | Information Technology | 1.5 |
| S4 CAPITAL PLC | SFOR LN | it said it is maintaining a disciplined cost-management approach. | 18 Sep | -20.9% | Communication Services | 0.4 |
| KINGFISHER PLC | KGF LN | Kingfisher Warns on Profit as Polish, French Shoppers Cut Back | 19 Sep | -12.3% | Consumer Discretionary | 4.6 |
| SMCP SA | SMCP FP | Cut its 2023 guidance, citing a slowdown in Europe and lower-than-expected Chinese consumption. | 19 Sep | -29.0% | Consumer Discretionary | 0.3 |
| NAKED WINES PLC | WINE LN | Profit warned due to oversupply in the sector | 19 Sep | -11.2% | Consumer Staples | 0.0 |
| NORTHCODERS GROUP PLC | CODE LN | Profit warned due to cautious market conditions | 19 Sep | -32.6% | Consumer Discretionary | 0.0 |
| QUIZ PLC | QUIZ LN | Profit warned due to cost of living squeeze amid higher interest rates | 19 Sep | -31.5% | Consumer Discretionary | 0.0 |
| SAFESTYLE UK PLC | SFE LN | Profit warned due to ongoing cost inflation and low consumer confidence | 19 Sep | -47.1% | Industrials | 0.0 |
| SALZGITTER AG | SZG GY | Profit warned due to continued weakness in steel | 19 Sep | 0.0% | Materials | 1.5 |
| EQTEC PLC | EQT LN | Eqtec lowers revenue forecast as files legal claim against Logik | 20 Sep | -17.1% | Industrials | 0.0 |
| HEXATRONIC GROUP AB | HTRO SS | Hexatronic shares slide as much as 12% to the lowest level in more than two years after the Swedish fiber-optic cable manufacturer said it expects to record negative organic revenue growth in second half of 2023. | 22 Sep | -10.9% | Industrials | 0.7 |
| ENTAIN PLC | ENT LN | Entain shares drop as much as 5.4% to the lowest since July 2022 after the gambling company said net gaming revenue was “softer than anticipated” after the summer, and noted a simplification of group structures to reduce costs. | 25 Sep | -12.3% | Consumer Discretionary | 7.1 |
| ASOS PLC | ASC LN | Asos Plc said cash flow is weaker than expected amid falling sales in the fiscal fourth quarter as the British online fashion retailer struggles to turn around its business. | 26 Sep | -1.5% | Consumer Discretionary | 0.6 |
| HENNES & MAURITZ AB-B SHS | HMB SS | Hennes & Mauritz AB warned that revenue is dropping this month due to an abnormally warm start to autumn in Europe as well as the absence of sales from Russia. | 27 Sep | 3.6% | Consumer Discretionary | 21.4 |
| RYANAIR HOLDINGS PLC | RYA ID | Ryanair Holdings Plc Chief Executive Officer Michael O’Leary says discount specialist trying to carry 25% more passengers this winter than pre-Covid, though might have to use lower fares to stimulate demand. | 27 Sep | 1.3% | Industrials | 17.1 |
| WORKDAY INC-CLASS A | WDAY US | Sales outlook cut | 28 Sep | -9.1% | Information Technology | 54.2 |
| 888 HOLDINGS PLC | 888 LN | William Hill Owner Cuts Earnings Outlook as Sports Bettors Win | 28 Sep | -11.7% | Consumer Discretionary | 0.4 |
| PEPCO GROUP NV | PCO PW | “In addition, the timing of our autumn/winter collection landing in stores has coincided with persistent record warm weather in our core CEE markets, resulting in weaker customer demand at this time.” | 28 Sep | -20.8% | Consumer Discretionary | 2.4 |
| PHILIP MORRIS INTERNATIONAL | PM US | - | 28 Sep | 2.4% | Consumer Staples | 139.5 |
| JETBLUE AIRWAYS CORP | JBLU US | JetBlue Airways warned of worse-than-expected September bookings and said disruptions tied to air traffic control issues and weather have been greater than expected. | 28 Sep | 2.1% | Industrials | 1.4 |
| BOOHOO GROUP PLC | BOO LN | Boohoo Group Plc lowered its revenue forecast as consumer demand has been sluggish and the fast fashion retailer cuts prices to attract cash-strapped shoppers. | 03 Oct | -2.2% | Consumer Discretionary | 0.5 |
| ALSTOM | ALO FP | The biggest impact was from much higher inventory levels, after the company hiked output amid tight supply chains to fill its order backlog and avoid production disruption and delivery delays. | 05 Oct | -37.9% | Industrials | 4.8 |
| NORSK HYDRO ASA | NHY NO | CO2 compensation to be lower by NOK1billion than previously expected | 06 Oct | -2.9% | Materials | 11.1 |
| EUROAPI SASU | EAPI FP | Profit warned due to pricing pressures and destocking | 09 Oct | 0.8% | Health Care | 0.5 |
| MIND GYM LTD | MIND LN | Profit warned over missing market expectations that clients are deferring training and commitment to new spend on back on inflationary pressures | 09 Oct | -37.8% | Industrials | 0.0 |
| CRODA INTERNATIONAL PLC | CRDA LN | Profit warned due to weaker demand and destocking | 09 Oct | -7.3% | Materials | 7.1 |
| MAISONS DU MONDE SA | MDM FP | Low consumer confidence and reduced discretionary spending | 10 Oct | -1.0% | Consumer Discretionary | 0.2 |
| ENERAQUA TECHNOLOGIES PLC | ETP LN | Profit warned over number of customers slowing spending and delaying projects to fiscal 2025 | 11 Oct | -58.2% | Industrials | 0.0 |
| TRAVIS PERKINS PLC | TPK LN | Travis Perkins warned that falling prices of commodity products have hurt gross profit and narrowed its profit margins | 11 Oct | -6.0% | Industrials | 1.8 |
| FORTERRA PLC | FORT LN | Market demand conditions is falling | 11 Oct | -5.0% | Materials | 0.3 |
| PAGEGROUP PLC | PAGE LN | Job market is tough | 11 Oct | -2.2% | Industrials | 1.5 |
| WATKIN JONES PLC | WJG LN | Profit warned due to higher costs | 11 Oct | -7.5% | Real Estate | 0.1 |
| SIG PLC | SHI LN | Profit warned due to further softening in consumer demand | 12 Oct | -9.1% | Industrials | 0.4 |
| HERSHEY CO/THE | HSY US | Hershey to see unfavourable 2024 amid slowing demand, tough competition | 12 Oct | -1.5% | Consumer Staples | 38.7 |
| MOBICO GROUP PLC | MCG LN | Mobico slumps on profit warning because of higher expenses, especially recruitment and examination costs | 12 Oct | -27.9% | Industrials | 0.4 |
| SARTORIUS AG-VORZUG | SRT3 GY | Lower volume expectations | 13 Oct | -12.3% | Health Care | 15.9 |
| WULFF-GROUP OYJ | WUF1V FH | Profit warned due to tightening monetary cycle | 16 Oct | 0.8% | Consumer Discretionary | 0.0 |
| CHRISTIE GROUP PLC | CTG LN | - | 13 Oct | -1.5% | Industrials | 0.0 |
| ERICSSON LM-B SHS | ERICB SS | Profit warned due to macroeconomic uncertainty in 2024 | 17 Oct | -5.8% | Information Technology | 14.9 |
| BELLWAY PLC | BWY LN | Profit warned due to lower volume output and pressures of cost inflation | 17 Oct | 2.7% | Consumer Discretionary | 2.9 |
| ESKER SA | ALESK FP | Esker falls 6% on profit margin, and may be hurt because of higher commissions paid to sales people for new contract wins | 18 Oct | -1.2% | Information Technology | 0.8 |
| PONSSE OYJ | PON1V FH | Profit warned due to weak economic cycle and persistent inflation. | 18 Oct | 1.6% | Industrials | 0.8 |
| RAUTE OYJ-A SHS | RAUTE FH | Profit warned due to slower than expected recovery | 19 Oct | -1.1% | Industrials | 0.1 |
| COMET HOLDING AG-REG | COTN SW | Profit warned due to later than expected recovery of semis business | 19 Oct | -2.1% | Information Technology | 1.5 |
| EXEL COMPOSITES OYJ | EXL1V FH | Profit warned because of challenging market environment and softer demand | 19 Oct | -2.3% | Industrials | 0.0 |
| RENTOKIL INITIAL PLC | RTO LN | Rentokil Initial warned of weakness saying margins were expected to come down, because of softer demand in North America | 19 Oct | -17.5% | Industrials | 12.4 |
| GJENSIDIGE FORSIKRING ASA | GJF NO | Severe weather events and one off expenses in 3Q | 20 Oct | 6.0% | Financials | 7.4 |
| HUSQVARNA AB-B SHS | HUSQB SS | Weaker market situation with lower user end demand | 20 Oct | -6.6% | Industrials | 3.7 |
| WORLDLINE SA | WLN FP | Shares of Wordline were cut in half, after the company profit warned blaming a deteriorating environment in Germany | 25 Oct | -59.3% | Financials | 3.2 |
| FORBO HOLDING AG-REG | FORN SW | Forbo shares slump as the company profit warns citing negative currency and macroeconomic conditions | 25 Oct | -2.2% | Industrials | 1.6 |
| CAB PAYMENTS HOLDINGS PLC | CABP LN | CAB payments suffers shares sell-off after profit warning because of volatility in African currencies were hurting volumes and squeezing margins | 25 Oct | -18.1% | Financials | 0.2 |
| SITOWISE GROUP PLC | SITOWS FH | Profit warned due to weaker market outlook in Buildings business area | 25 Oct | -2.0% | Industrials | 0.1 |
| META PLATFORMS INC-CLASS A | META US | Warned on revenue outlook due to economic uncertainty and softer advertising spending | 26 Oct | -3.4% | Communication Services | 741.6 |
Source: Bloomberg Finance L.P.
Equity Strategy Key Calls and Drivers
Despite recent weakness, where SPX RSI turned technically oversold, we believe that the equity risk-reward remains challenging. Divergences between softer activity momentum and the elevated equity prices, as well as market internals, that opened up in the summer, are starting to close, but there is more to go. The PMI rebound that many were hoping for, the call that the weakness in manufacturing will end and join the more resilient services, remains elusive. In addition, real rates upmove is pressuring multiples, and this is even taking out Tech. Finally, Brent and USD rally should be seen as concerning for stocks. Most of Brent upmove is supply driven, and could lead to weaker final demand. Corporates might struggle to pass on rising input costs this time, in contrast to ’21-’22. Historically, strengthening USD was almost always met with risk-off in equities. We do not think that bond yields will be able to keep moving up for too much longer, and will likely ultimately fall, and that is precisely because of the “higher for longer” narrative by the Fed. Q4 could end up a very good time to lock in the long duration trade for the next 12 months. SX5E has lagged the US since May, coincident with our downgrade to UW – stay short. Even as we remain bearish on China over the medium term, a lot has happened, MSCI China is down more than 20% since January, and one should not be tactically pressing the shorts into year end, in our view. We stay OW Energy. We were OW Growth vs Value this year, but the Tech run is becoming heavy, so we think that pure Defensives look the best into year end.
Table 8: J.P. Morgan Equity Strategy — Factors driving our medium-term views
| Driver | Impact | Our Core Working Assumptions | Recent Developments | |||
| Global Growth | Neutral | At risk of weakening as consumer strength wanes | Global composite PMI is at 50.5 | |||
| European Growth | Negative | Manufacturing and services are converging on the downside; industry data stays weak | ||||
| Monetary Policy | Neutral | Fed is unlikely to pivot, unless the macro backdrop deteriorates meaningfully | ||||
| Currency | Neutral | USD could strengthen further | ||||
| Earnings | Negative | Margin squeeze and negative operating leverage coming up | 2023 and 2024 full year earnings projections are not moving higher | |||
| Valuations | Negative | US in particular is unattractive vs bond yields, but Europe screens better | MSCI Europe on 11.6x Fwd P/E | |||
| Technicals | Negative | Sentiment and positioning are no longer as stretched | RSIs close to oversold territory, Vix is not up much yet | |||
Source: J.P. Morgan estimates
Table 9: Base Case and Risks
| Scenario | Assumption |
| Upside scenario | No further hawkish tilt by the Fed. No landing |
| Base-case scenario | Inflation to fall further, risk of downturn still elevated. Earnings downside from here |
| Downside scenario | Further Fed tightening and global recession to become a base case again |
Source: J.P. Morgan estimates.
Table 10: Index targets
| Dec '23 Target | 26-Oct-23 | % upside | |
| MSCI EMU | 256 | 243 | 5% |
| FTSE 100 | 8,150 | 7,355 | 11% |
| MSCI EUROPE | 1,880 | 1,753 | 7% |
| DJ EURO STOXX 50 | 4,150 | 4,049 | 2% |
| DJ STOXX 600 E | 465 | 433 | 7% |
Source: J.P. Morgan.
Table 11: Key Global sector calls
| Overweight | Neutral | Underweight |
| Utilities | Technology | Capital Goods ex A&D |
| Insurance | Discretionary | Chemicals |
| Staples | Mining | Autos |
| Energy | Retail | |
Source: J.P. Morgan
Table 12: J.P. Morgan Equity Strategy — Key sector calls*
| Sector | Recommendations | Key Drivers |
| Utilities | Overweight | Sector should see less regulatory uncertainty this year; resilient earnings, peaking bond yields are supports |
| Staples | Overweight | Sector is one of the best performers around the last Fed hike in the cycle, lower bond yields and better relative EPS momentum should further support |
| Autos | Underweight | Pricing power to weaken, consumer to slow down |
| Capital Goods ex A&D | Underweight | Sector trades expensive, on peak margins |
Source: J.P. Morgan estimates. * Please see the last page for the full list of our calls and sector allocation.
Table 13: J.P. Morgan Equity Strategy — Key regional calls
| Region | Recommendations | J.P. Morgan Views |
| EM | Neutral | China tactical chance for a bounce, but structural bearish call remains |
| DM | Neutral | |
| US | Underweight | Expensive, with earnings risk. However, if markets to weaken into year end, US could fare relatively better vs Eurozone |
| Japan | Overweight | Japan is attractively priced; diverging policy path and TSE reforms are tailwinds |
| Eurozone | Underweight | Growth-Policy trade-off likely to deteriorate further; Eurozone is typically a high beta on the way down |
| UK | Overweight | Valuations still look very attractive, low beta with the highest regional dividend yield |
Source: J.P. Morgan estimates
Top Picks
Table 14: J.P. Morgan European Strategy: Top European picks
| EPS Growth | Dividend Yield | 12m Fwd P/E | Performance | ||||||||||||
| Name | Ticker | Sector | Rating | Price | Currency | Market Cap (€ Bn) | 22e | 23e | 24e | 23e | Current | 10Y Median | % Premium | -3m | -12m |
| TOTALENERGIES | TTE FP | Energy | OW | 63 | E | 152.8 | 109% | -29% | -1% | 4.7% | 6.8 | 10.6 | -36% | 21% | 20% |
| SHELL | SHEL LN | Energy | OW | 32 | E | 209.0 | 116% | -22% | 3% | 4.2% | 7.9 | 11.2 | -29% | 17% | 23% |
| BASF | BAS GR | Materials | OW | 41 | E | 36.7 | 3% | -48% | 21% | 8.0% | 9.9 | 13.1 | -24% | -12% | -8% |
| SOLVAY | SOLB BB | Materials | OW | 99 | E | 10.4 | 67% | -18% | -7% | 4.2% | 7.6 | 12.3 | -39% | -3% | 12% |
| ANGLO AMERICAN | AAL LN | Materials | OW | 2156 | £ | 30.3 | -31% | -43% | 13% | 4.4% | 8.6 | 9.7 | -12% | -6% | -18% |
| SAINT GOBAIN | SGO FP | Industrials | OW | 50 | E | 25.4 | 21% | -5% | 5% | 4.1% | 7.9 | 12.7 | -38% | -13% | 27% |
| VINCI | DG FP | Industrials | OW | 101 | E | 60.1 | 66% | 9% | 8% | 4.4% | 11.7 | 15.1 | -23% | -6% | 16% |
| ATLAS COPCO A | ATCOA SS | Industrials | OW | 143 | SK | 58.2 | 26% | 19% | 4% | 1.8% | 24.0 | 21.4 | 12% | -2% | 31% |
| REXEL | RXL FP | Industrials | OW | 20 | E | 6.0 | 59% | -12% | 0% | 5.8% | 7.5 | 11.7 | -36% | -11% | 22% |
| DSV | DSV DC | Industrials | OW | 1131 | DK | 33.2 | 60% | -27% | 1% | 0.7% | 18.9 | 21.9 | -14% | -23% | 19% |
| AIRBUS | AIR FP | Industrials | OW | 124 | E | 97.9 | 21% | -3% | 21% | 1.6% | 19.1 | 18.1 | 5% | -8% | 23% |
| BAE SYSTEMS | BA/ LN | Industrials | OW | 1041 | £ | 36.2 | 17% | 12% | 8% | 2.9% | 15.7 | 12.2 | 29% | 12% | 29% |
| DR ING HC F PORSCHE PREF. | P911 GR | Discretionary | OW | 91 | E | 82.1 | - | 8% | 7% | 2.5% | 14.6 | 18.5 | -21% | -19% | - |
| RENAULT | RNO FP | Discretionary | OW | 33 | E | 9.9 | -138% | - | -3% | 4.1% | 2.6 | 5.5 | -52% | -14% | 4% |
| MERCEDES-BENZ GROUP N | MBG GR | Discretionary | OW | 63 | E | 67.2 | 36% | -4% | -2% | 8.3% | 4.9 | 7.5 | -34% | -12% | 10% |
| INDITEX | ITX SM | Discretionary | OW | 34 | E | 105.8 | 189% | 27% | 27% | - | 19.1 | 24.7 | -23% | -1% | 49% |
| LVMH | MC FP | Discretionary | OW | 671 | E | 336.7 | 17% | 14% | 7% | 2.0% | 19.9 | 21.7 | -8% | -21% | 7% |
| WHITBREAD | WTB LN | Discretionary | OW | 3341 | £ | 7.4 | - | - | 31% | 1.5% | 15.2 | 18.6 | -18% | -2% | 31% |
| B&M EUROPEAN VAL.RET. | BME LN | Discretionary | UW | 554 | £ | 6.4 | -5% | -12% | 3% | 2.6% | 14.3 | 16.8 | -15% | -1% | 80% |
| TESCO | TSCO LN | Staples | N | 274 | £ | 22.3 | 81% | 0% | 7% | 4.0% | 11.2 | 13.6 | -17% | 7% | 34% |
| KONINKLIJKE AHOLD DELHAIZE | AD NA | Staples | UW | 28 | E | 26.4 | 16% | -2% | 7% | 4.0% | 10.4 | 13.2 | -21% | -11% | -1% |
| ANHEUSER-BUSCH INBEV | ABI BB | Staples | OW | 51 | E | 102.1 | 13% | -6% | 16% | 2.0% | 15.7 | 19.5 | -20% | -3% | 8% |
| DANONE | BN FP | Staples | OW | 54 | E | 36.7 | 4% | 1% | 5% | 3.8% | 15.2 | 17.3 | -12% | -3% | 12% |
| NESTLE 'N' | NESN SW | Staples | OW | 99 | SF | 279.3 | 9% | 3% | 7% | 3.1% | 18.9 | 21.4 | -12% | -6% | -7% |
| ASTRAZENECA | AZN LN | Health Care | OW | 10488 | £ | 186.2 | 26% | 10% | 15% | 2.4% | 15.6 | 17.8 | -12% | 0% | 7% |
| NOVO NORDISK 'B' | NOVOB DC | Health Care | OW | 684 | DK | 413.4 | 18% | 48% | 20% | 1.3% | 32.8 | 22.2 | 47% | 29% | 71% |
| SIEMENS HEALTHINEERS | SHL GR | Health Care | OW | 47 | E | 51.4 | 13% | -14% | 17% | 1.9% | 19.9 | 22.5 | -12% | -9% | 4% |
| UBS GROUP | UBSG SW | Financials | OW | 22 | SF | 79.6 | 9% | -44% | 65% | 2.4% | 13.2 | 10.4 | 27% | 18% | 46% |
| ING GROEP | INGA NA | Financials | OW | 12 | E | 44.8 | -18% | 90% | -1% | 8.2% | 6.4 | 9.2 | -30% | -5% | 30% |
| LONDON STOCK EXCHANGE GROUP | LSEG LN | Financials | OW | 8226 | £ | 51.0 | 10% | 4% | 12% | 1.4% | 22.8 | 22.3 | 2% | -2% | 10% |
| AMUNDI (WI) | AMUN FP | Financials | OW | 51 | E | 10.4 | -11% | 4% | 3% | 8.0% | 8.3 | 12.8 | -35% | -11% | 15% |
| SWISS RE | SREN SW | Financials | OW | 98 | SF | 33.1 | -67% | 578% | 15% | 6.3% | 9.1 | 10.1 | -10% | 8% | 32% |
| PRUDENTIAL | PRU LN | Financials | OW | 860 | £ | 27.1 | -1% | -7% | 18% | 1.9% | 9.9 | 11.7 | -15% | -19% | -4% |
| SAP | SAP GR | IT | OW | 126 | E | 154.5 | -40% | 27% | 19% | 1.7% | 21.3 | 19.7 | 8% | -1% | 42% |
| ASML HOLDING | ASML NA | IT | OW | 563 | E | 226.8 | -1% | 38% | 3% | 1.2% | 28.2 | 26.2 | 8% | -14% | 29% |
| ADYEN | ADYEN NA | Financials | OW | 699 | E | 21.7 | 19% | 9% | 23% | 0.0% | 29.6 | 87.1 | -66% | -55% | -47% |
| BT GROUP | BT/A LN | Telecoms | OW | 116 | £ | 13.2 | 6% | 9% | -15% | 6.7% | 6.3 | 9.2 | -31% | -8% | -9% |
| DEUTSCHE TELEKOM | DTE GR | Telecoms | OW | 20 | E | 100.6 | 50% | -8% | 11% | 3.8% | 11.1 | 14.4 | -23% | 4% | 11% |
| INFRASTRUTTURE WIRELESS ITALIANE SPA NPV | INW IM | Telecoms | OW | 10 | E | 9.9 | 54% | 24% | 19% | 4.4% | 23.6 | 28.3 | -16% | -12% | 23% |
| RELX | REL LN | Industrials | OW | 2880 | £ | 62.3 | 17% | 10% | 10% | 2.0% | 23.7 | 19.1 | 24% | 12% | 30% |
| PEARSON | PSON LN | Discretionary | OW | 908 | £ | 7.4 | 49% | 11% | 12% | 2.5% | 14.6 | 15.1 | -3% | 5% | 2% |
| DELIVERY HERO | DHER GR | Discretionary | OW | 25 | E | 6.6 | - | - | - | 0.0% | -12.1 | -29.1 | - | -40% | -30% |
| ENGIE | ENGI FP | Utilities | OW | 15 | E | 36.2 | 74% | -12% | -14% | 8.9% | 8.3 | 12.3 | -33% | -1% | 21% |
| RWE | RWE GR | Utilities | OW | 34 | E | 25.3 | 102% | 3% | -34% | 2.9% | 9.6 | 13.0 | -26% | -13% | -10% |
| SEGRO | SGRO LN | Real Estate | OW | 708 | £ | 10.0 | 7% | 4% | 8% | 3.9% | 20.7 | 25.3 | -18% | -11% | -1% |
| VONOVIA | VNA GR | Real Estate | OW | 21 | E | 16.6 | 3% | -2% | -2% | 6.4% | 9.6 | 19.3 | -50% | -3% | 0% |
Source: Datastream, MSCI, IBES, J.P. Morgan, Prices and Valuations as of COB 26th Oct, 2023. Past performance is not indicative of future returns.
Please see the most recent company-specific research published by J.P. Morgan for an analysis of valuation methodology and risks on companies recommended in this report. Research is available at http://www.jpmorganmarkets.com, or you can contact the covering analyst or your J.P. Morgan representative.
Equity Flows Snapshot
Table 15: DM Equity Fund Flows Summary
| Regional equity fund flows | ||||||||||
| $mn | % AUM | |||||||||
| 1w | 1m | 3m | YTD | 12m | 1w | 1m | 3m | YTD | 12m | |
| Europe ex UK | -372 | -2,226 | -4,332 | -10,107 | -15,995 | -0.1% | -0.7% | -1.4% | -3.6% | -6.9% |
| UK | -503 | -1,611 | -7,564 | -24,589 | -31,244 | -0.2% | -0.6% | -2.8% | -9.1% | -14.2% |
| US | 349 | 13,219 | 19,417 | 5,065 | 21,089 | 0.0% | 0.2% | 0.2% | 0.1% | 0.3% |
| Japan | -902 | 3,380 | 9,188 | 11,834 | 13,256 | -0.1% | 0.5% | 1.3% | 1.9% | 2.3% |
Source: EPFR, as of 18th Oct, 2023
Figure 43: DM Equity Fund flows – last month
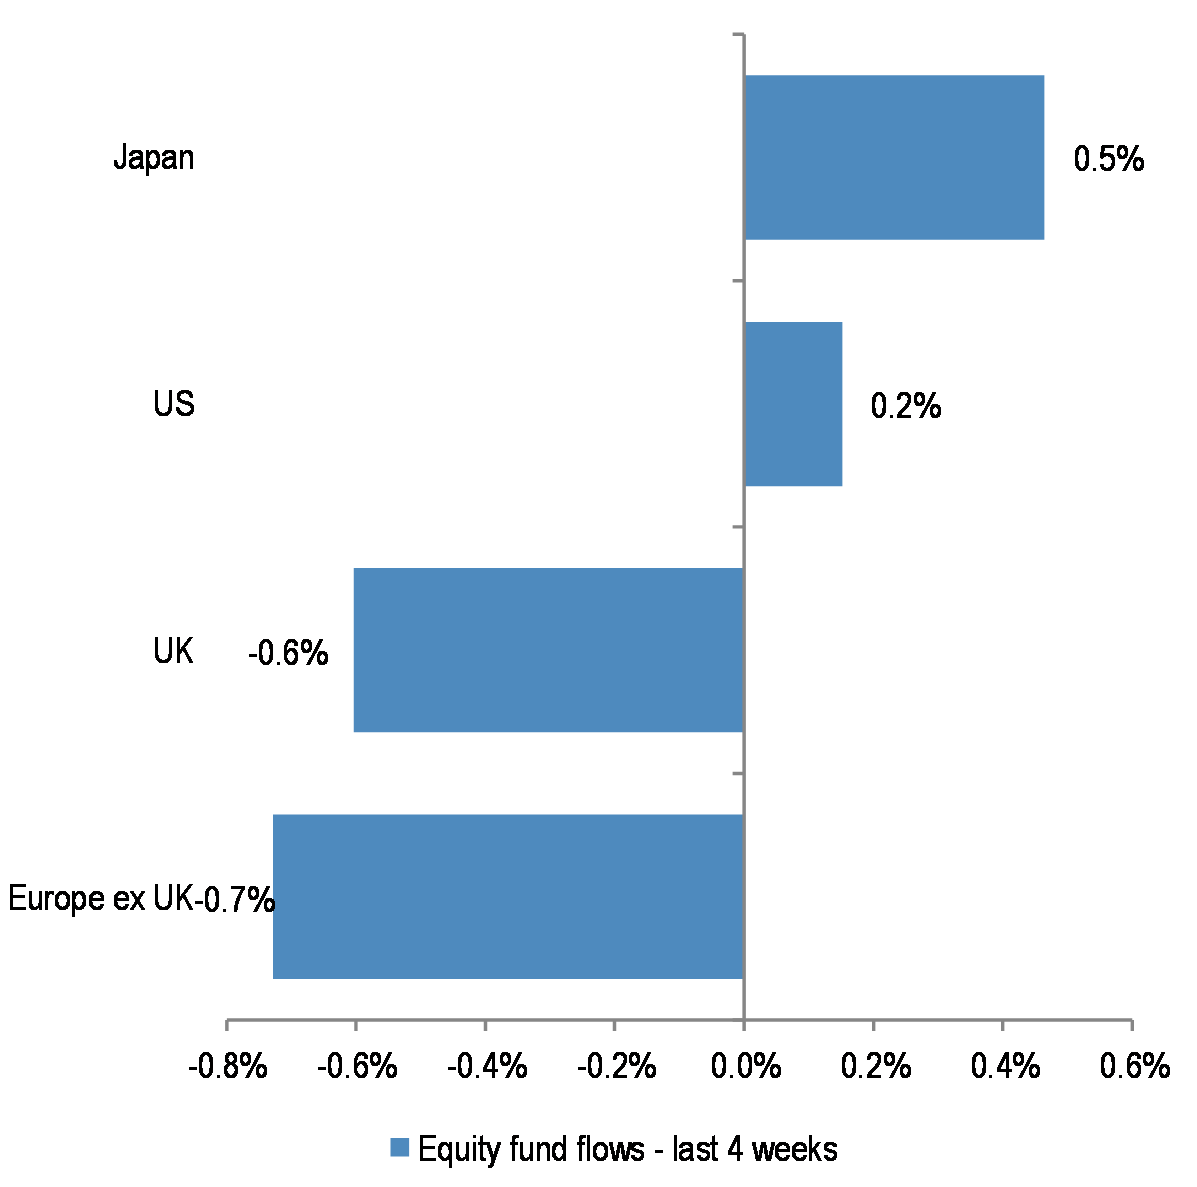
Figure 44: Cumulative fund flows into regional funds as a percentage of AUM
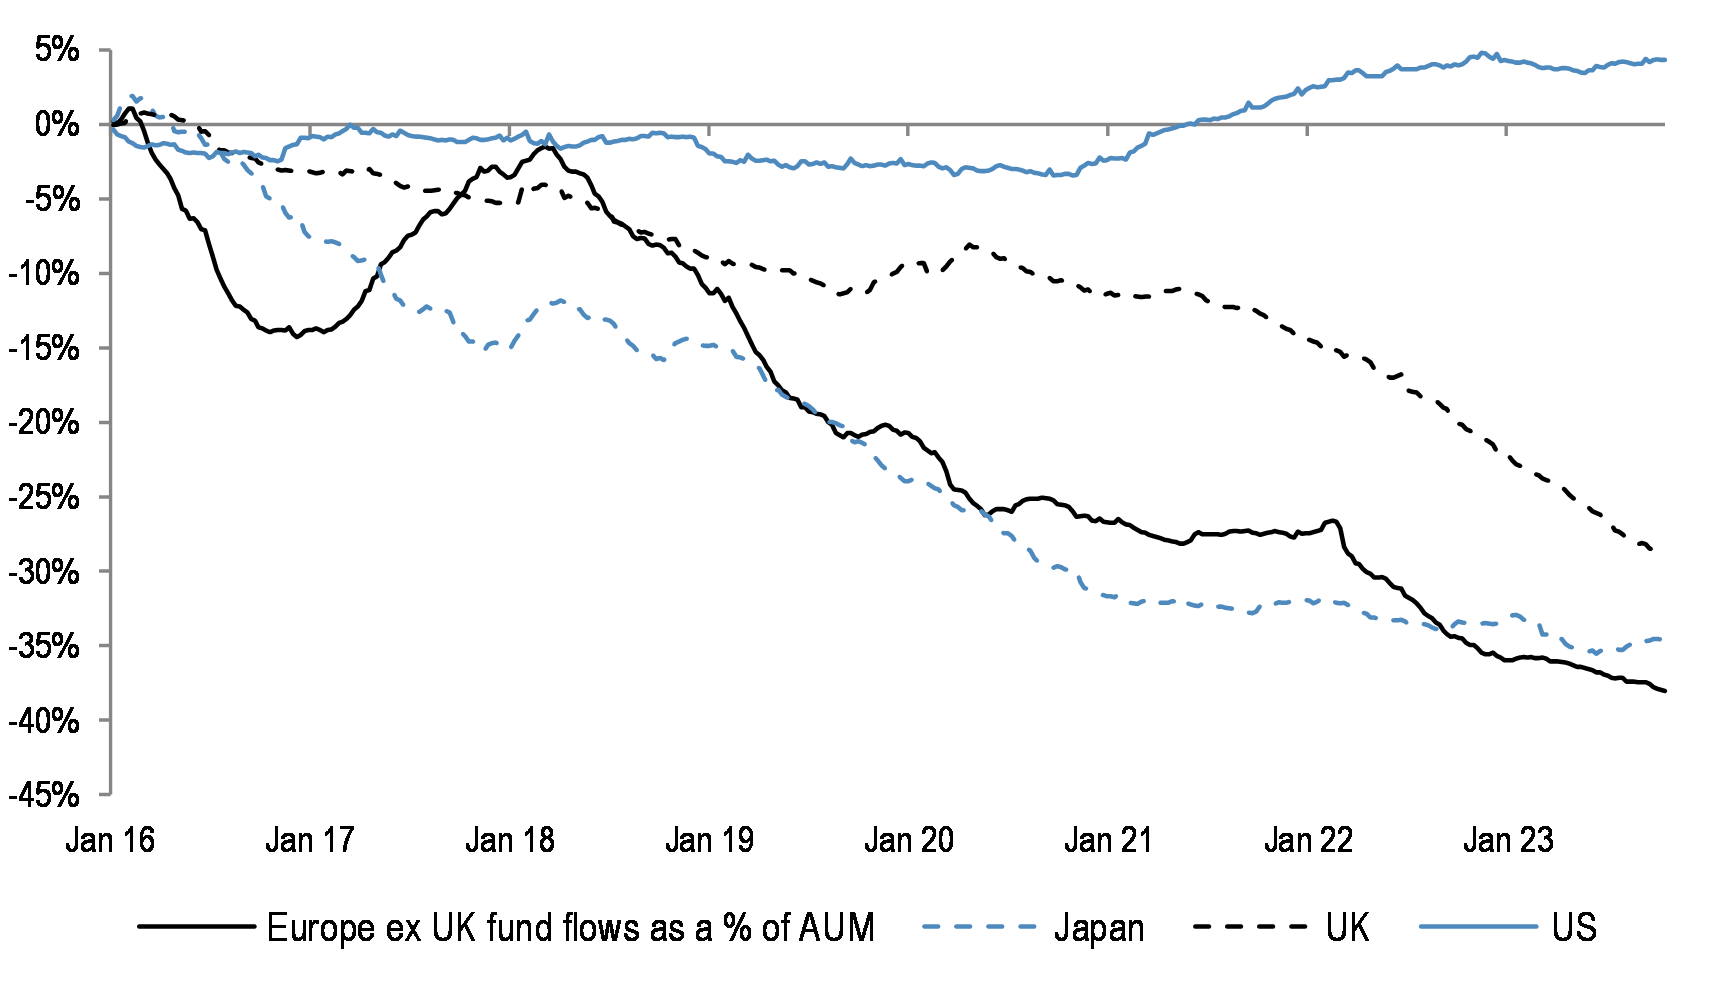
Figure 45: DM Equity Fund flows – last 12 months
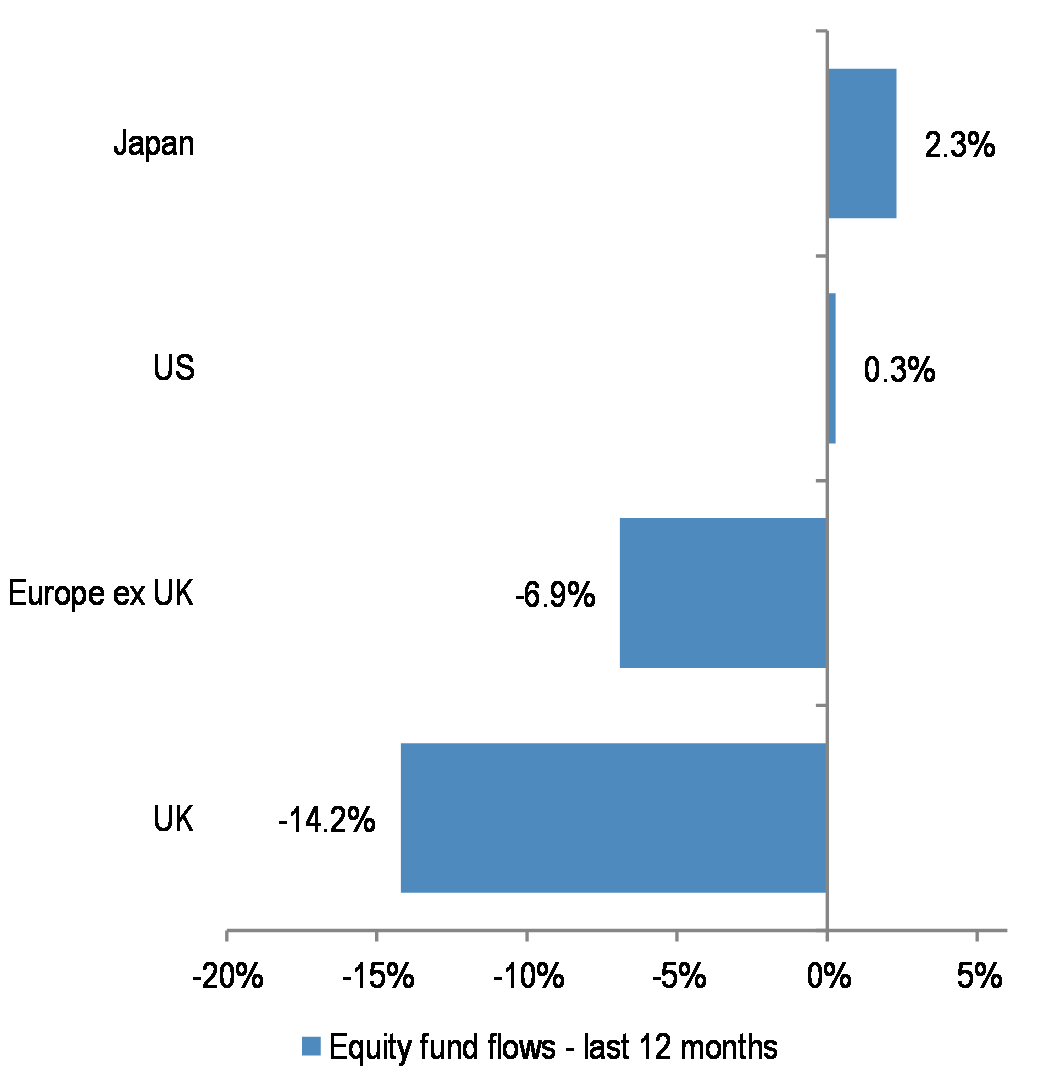
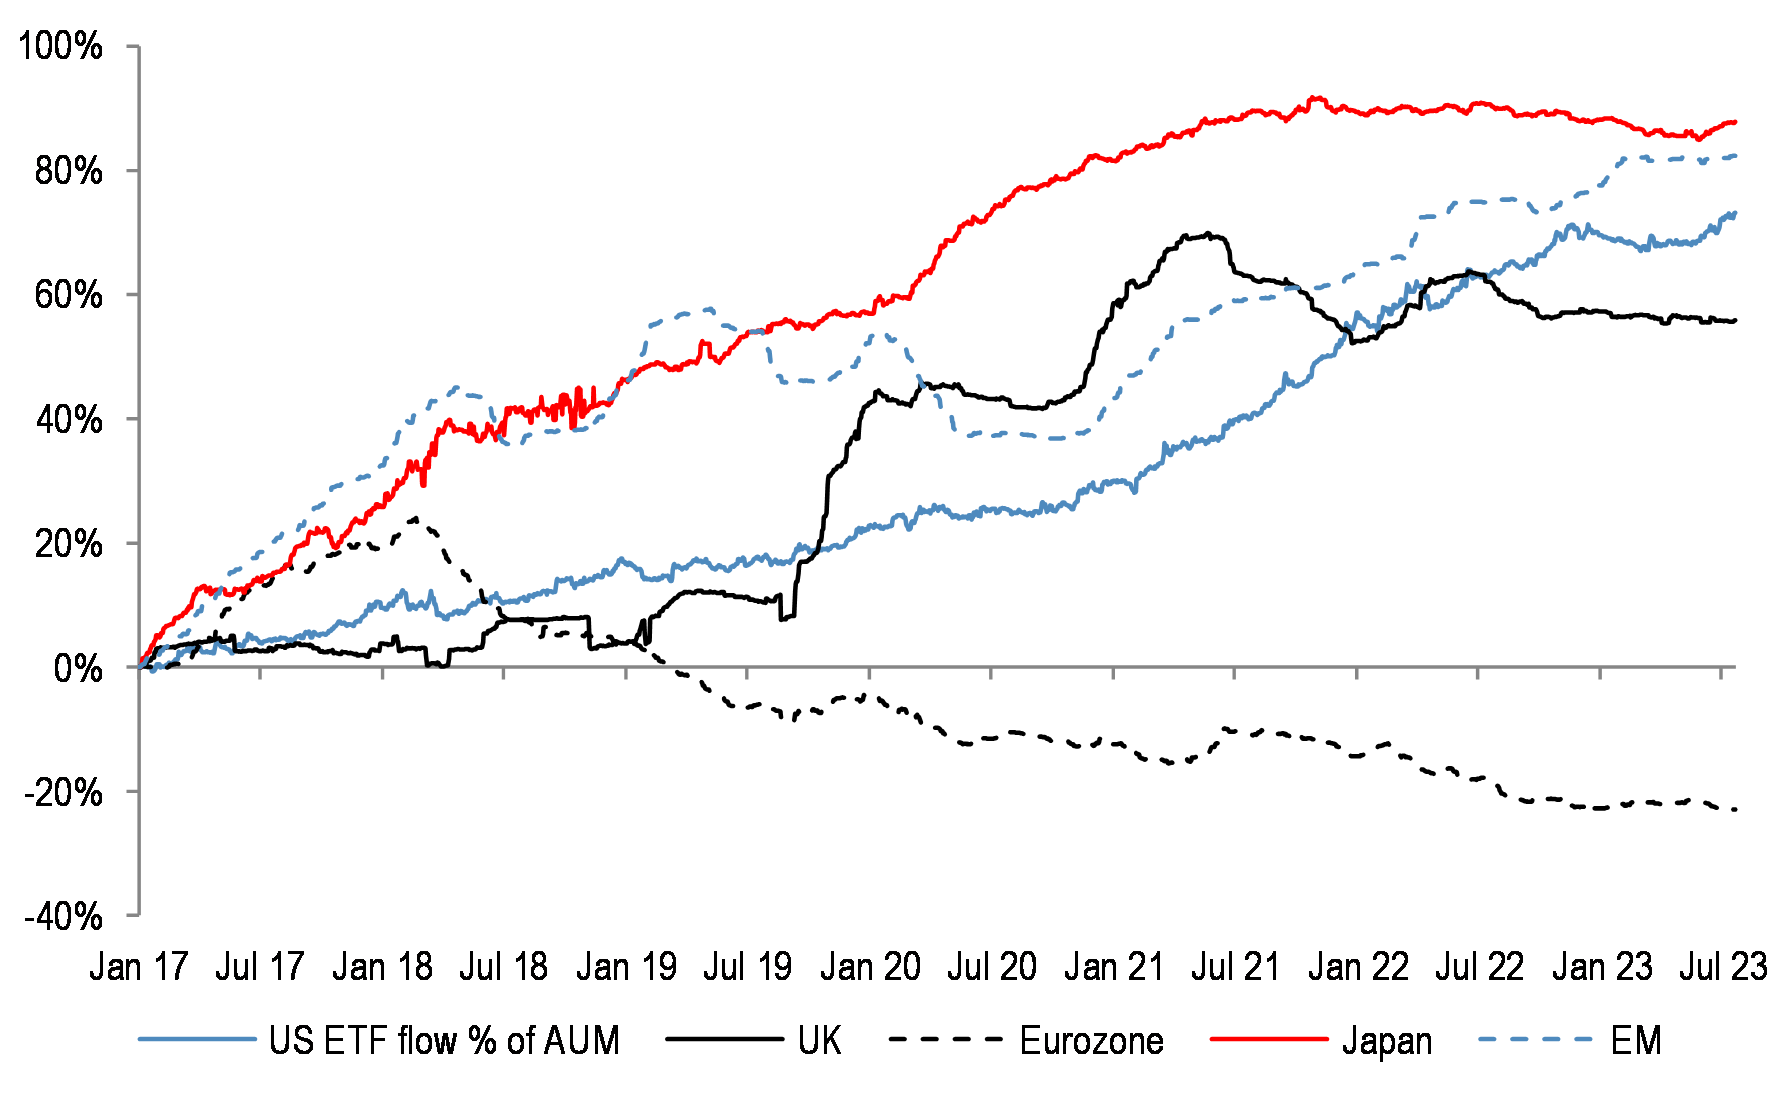
Figure 46: Cumulative fund flows into regional equity ETFs as a percentage of AUM
Technical Indicators
Figure 47: S&P500 RSI
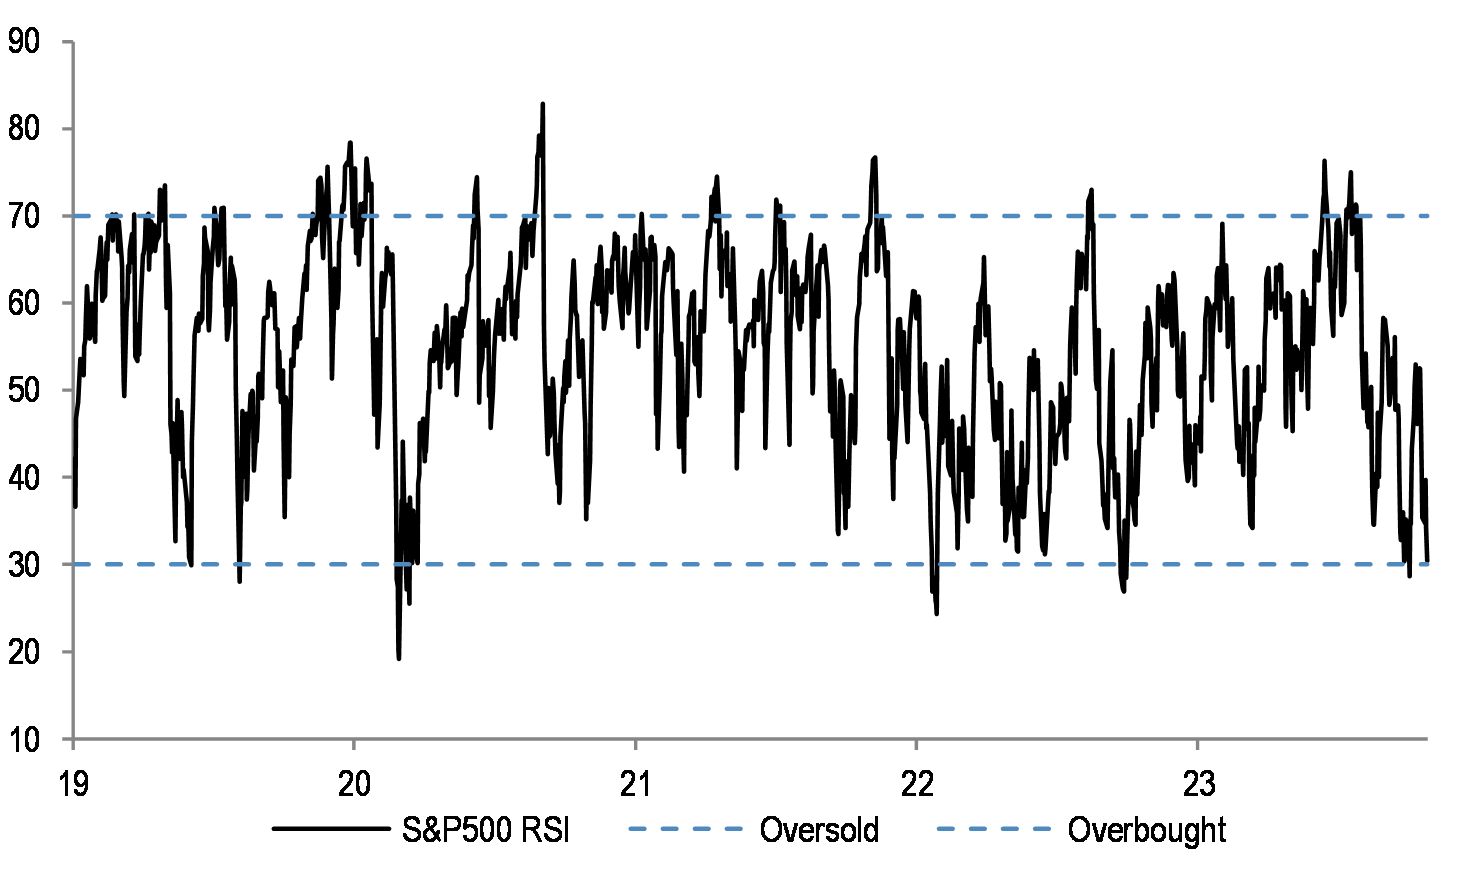
Figure 48: AAII Bull-Bear
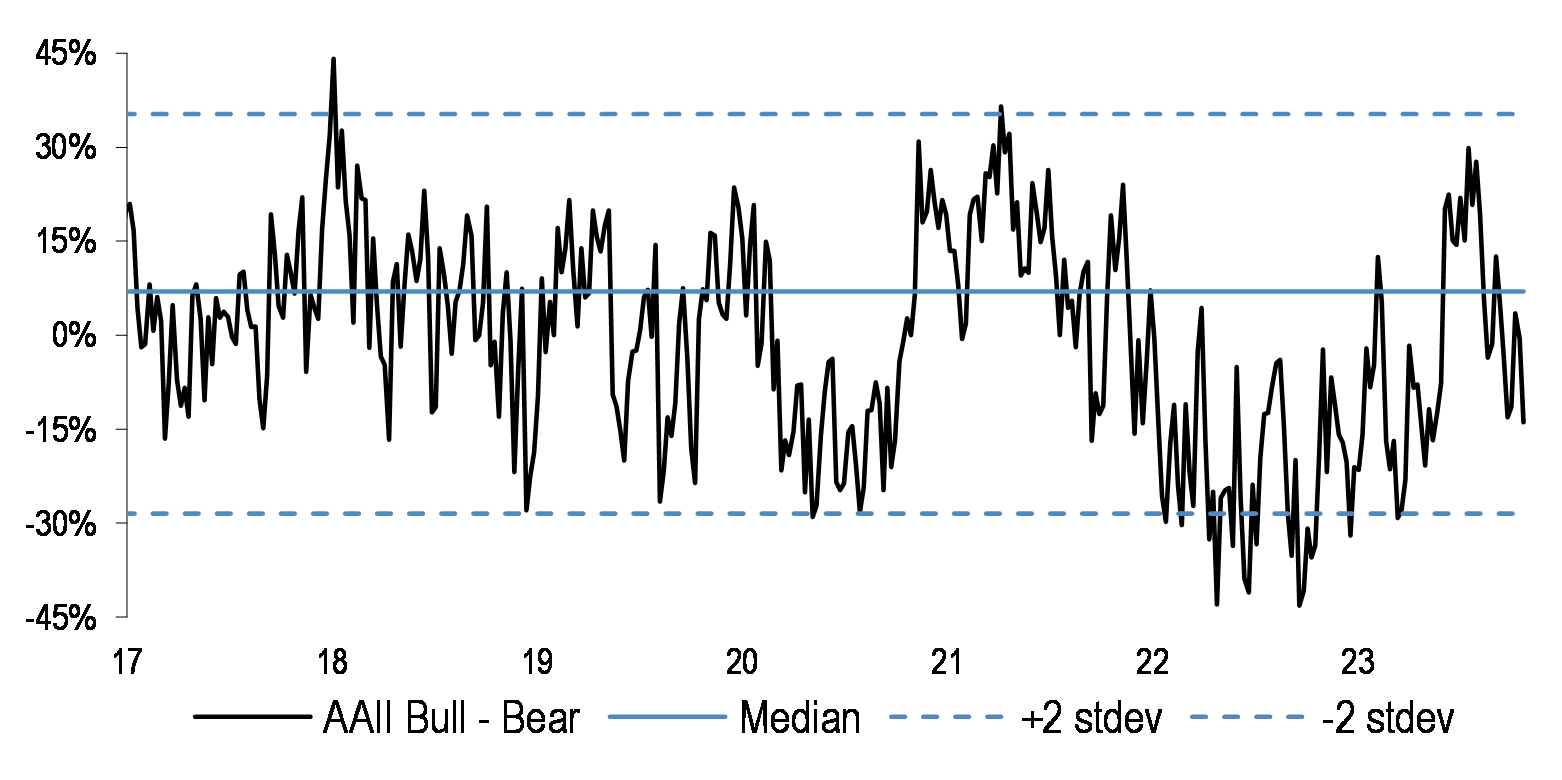
Figure 49: Sentix Sentiment Index vs SX5E
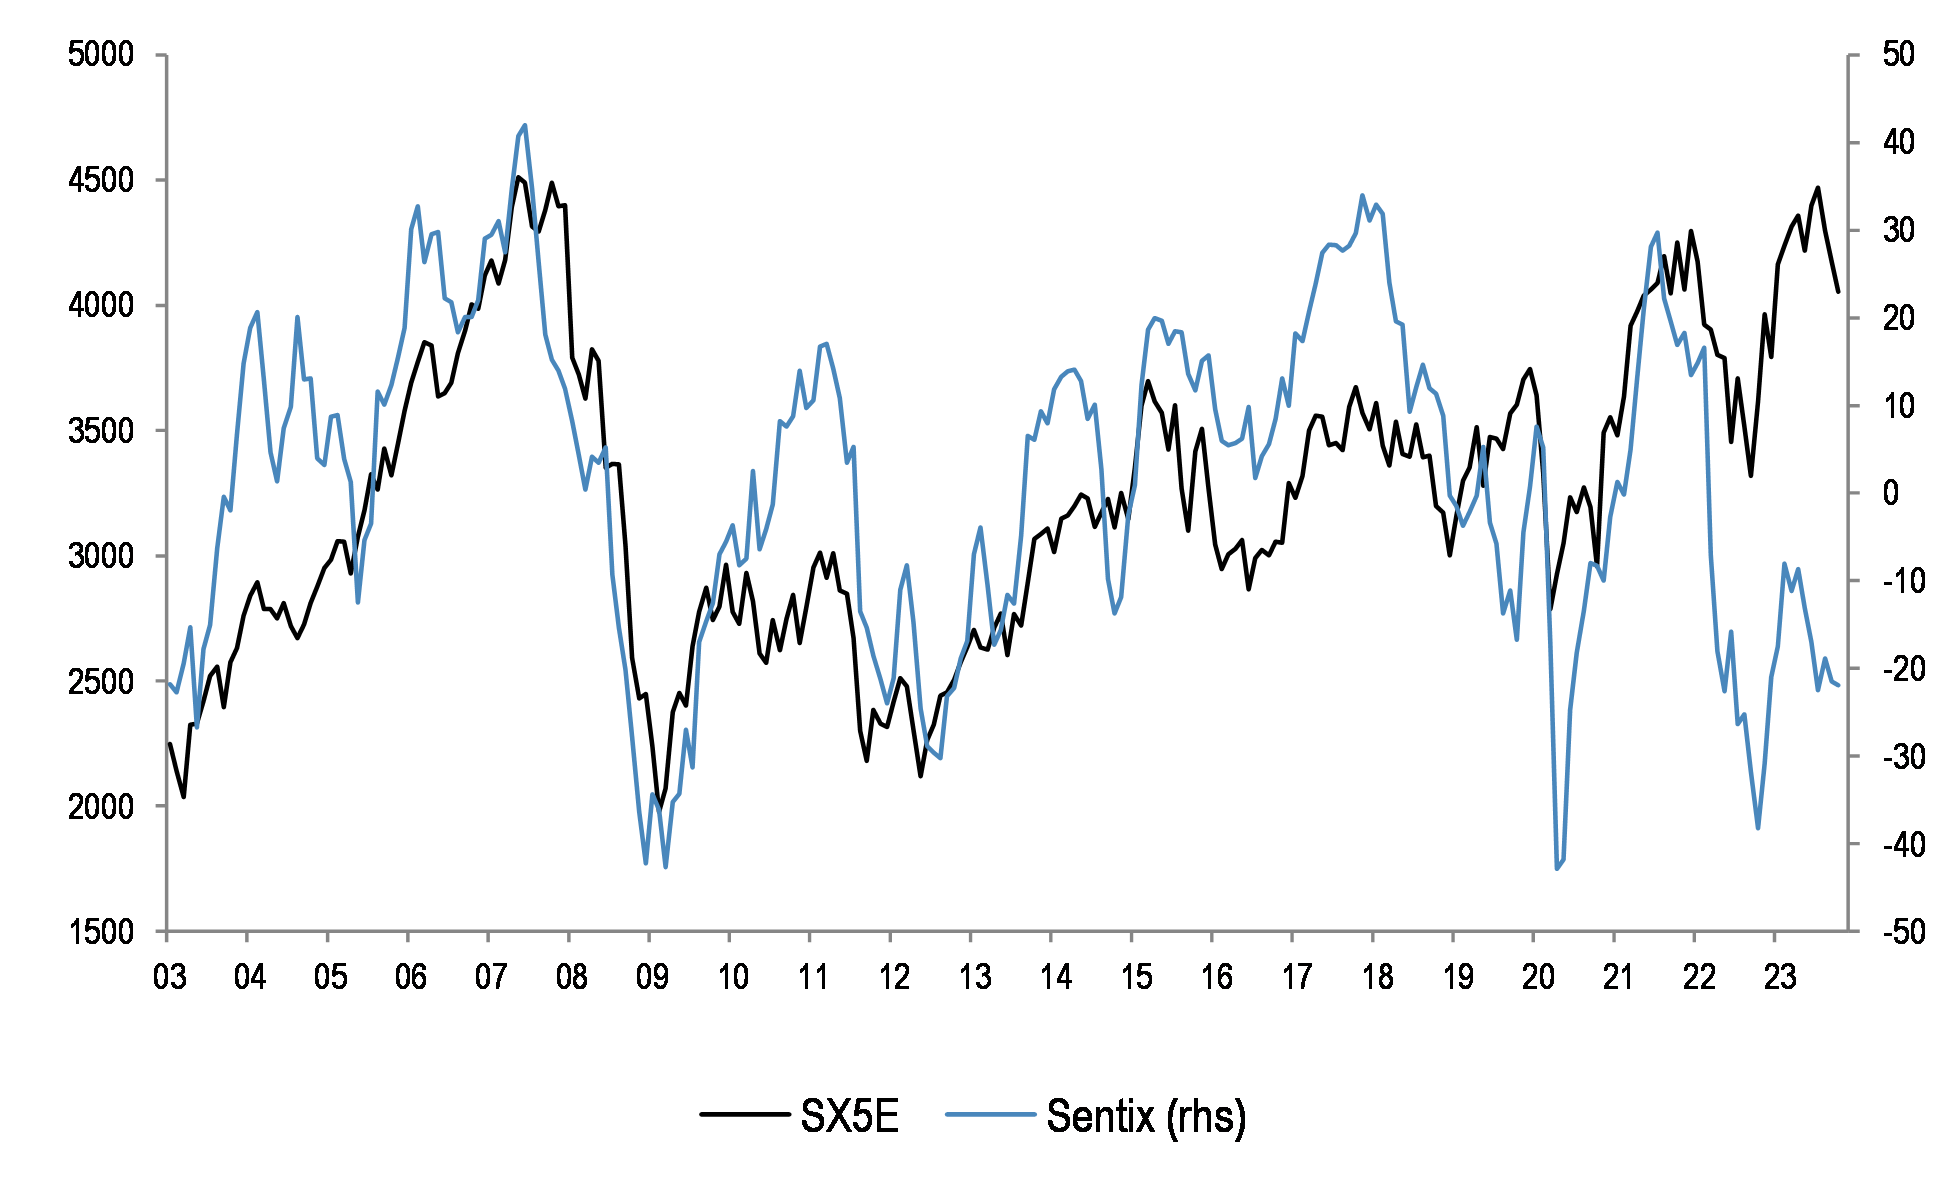
Figure 50: Speculative positions in S&P500 futures contracts
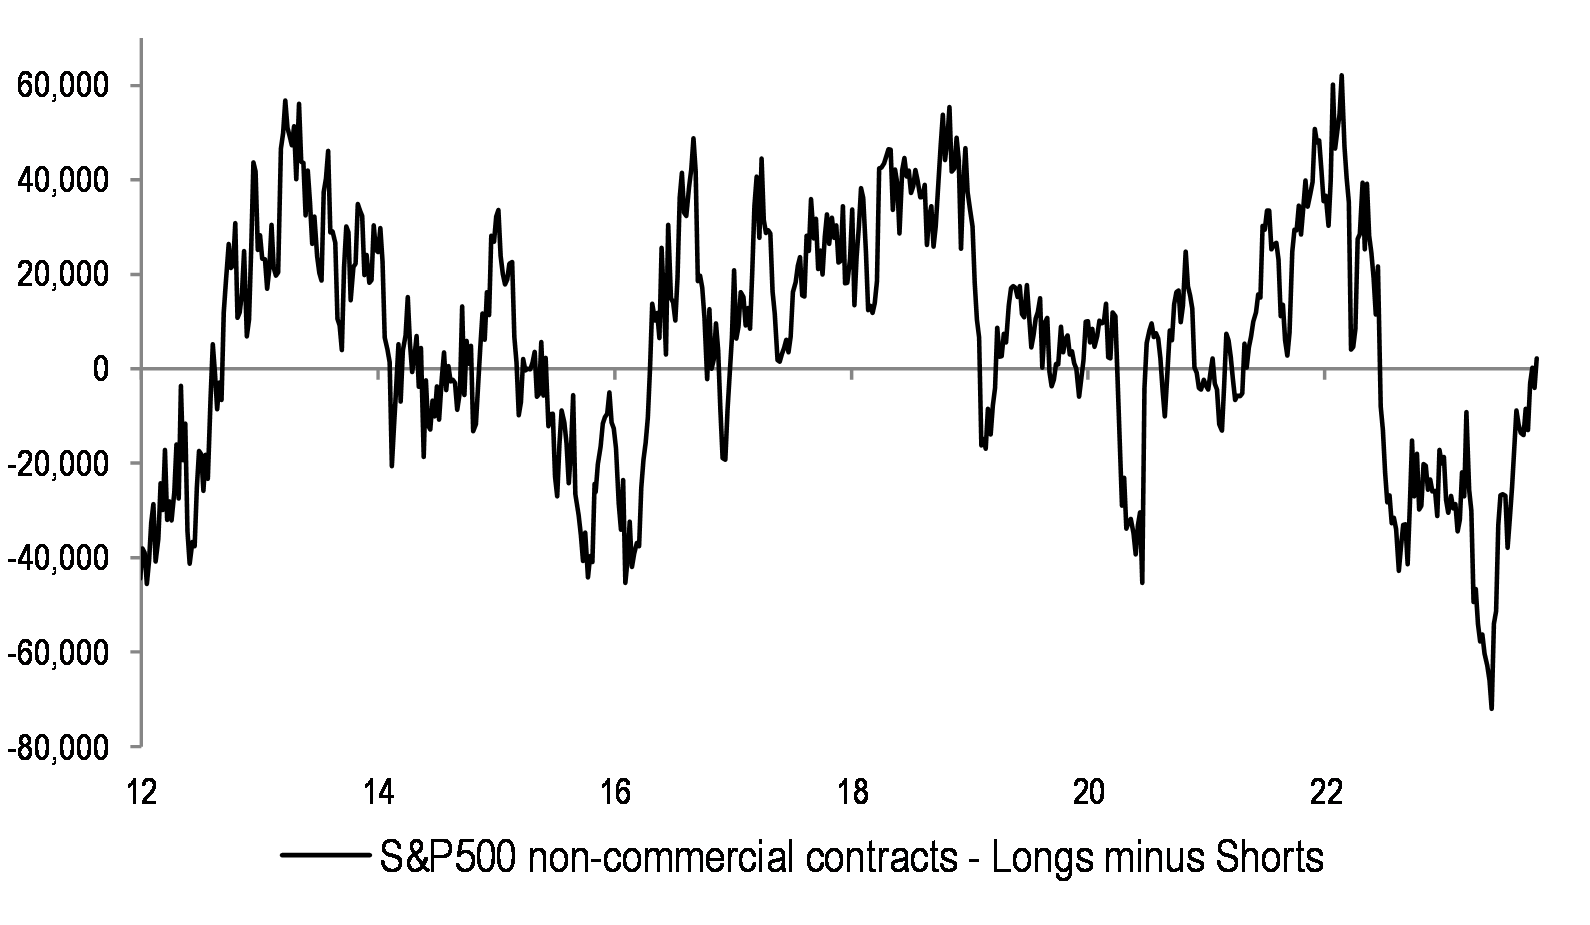
Figure 51: Eurostoxx50 RSI
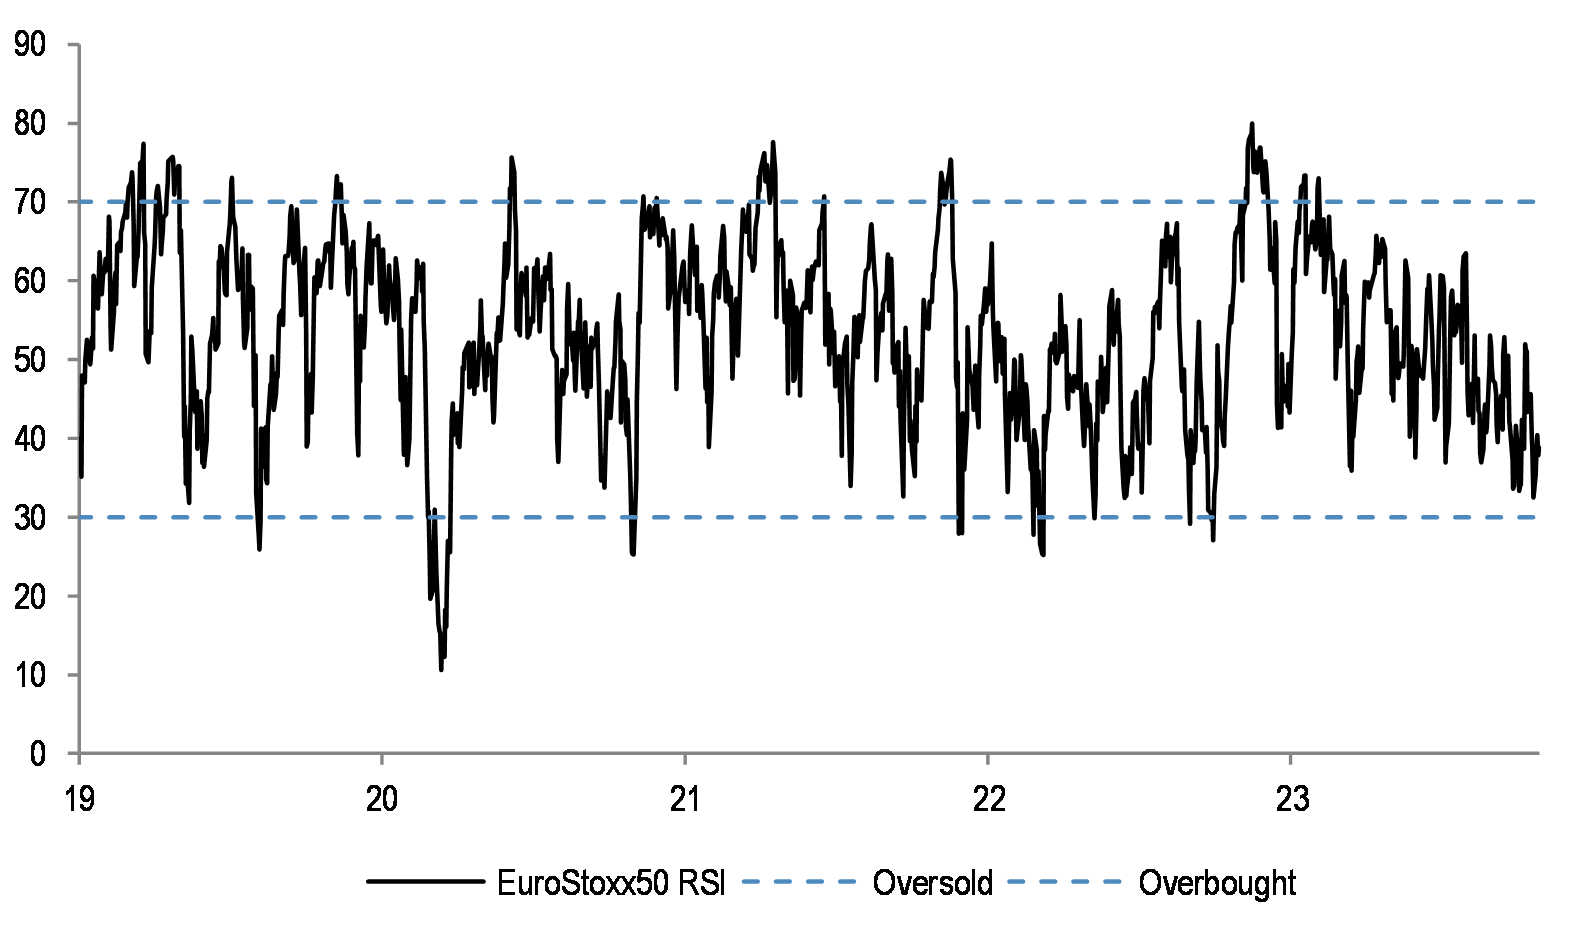
Figure 52: Put-call ratio
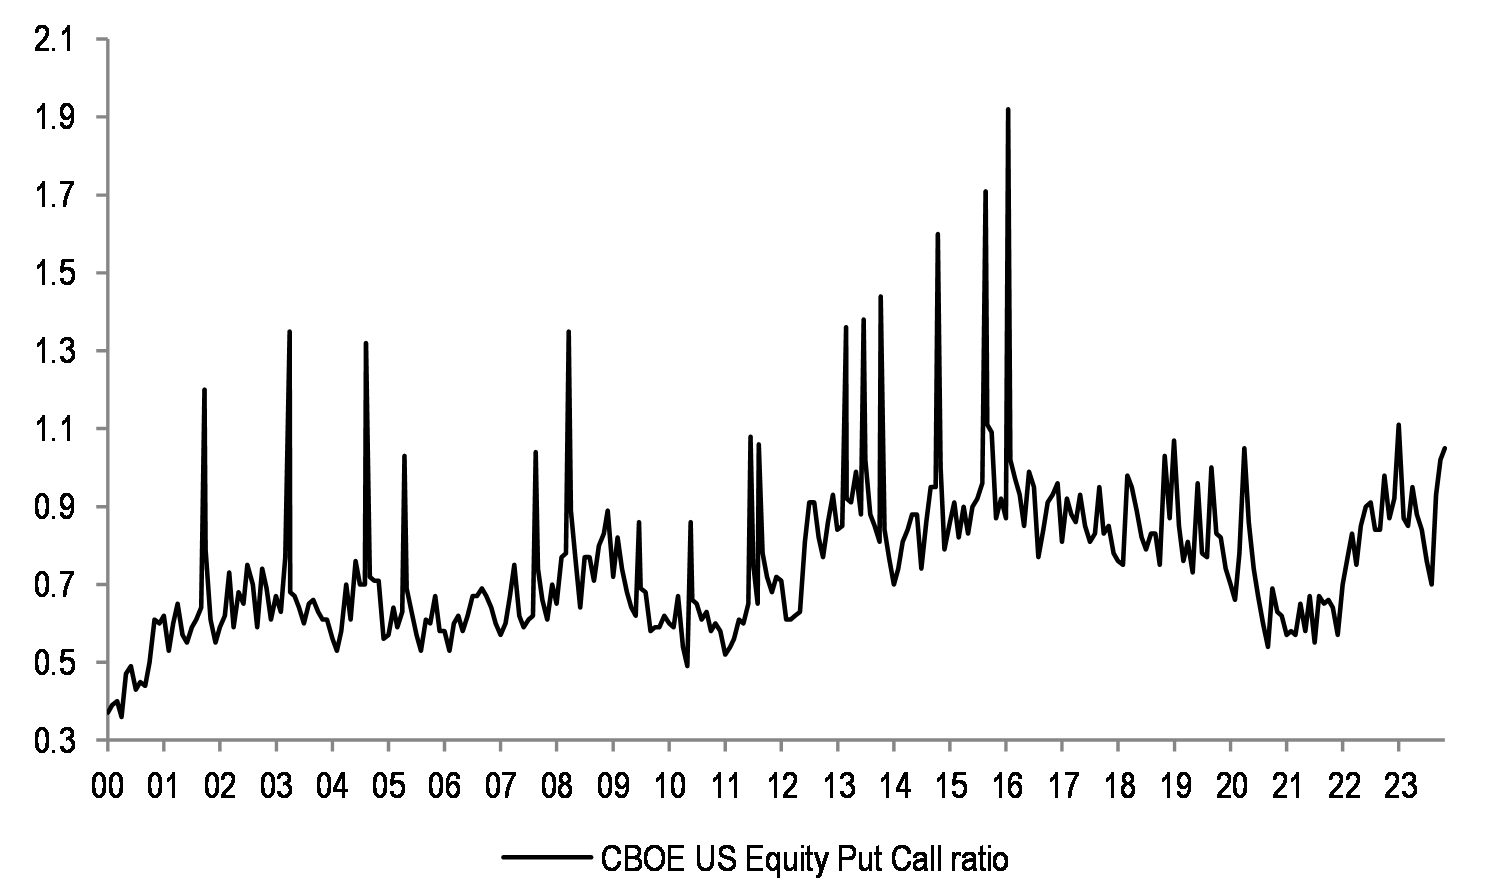
Figure 53: Equity Skew
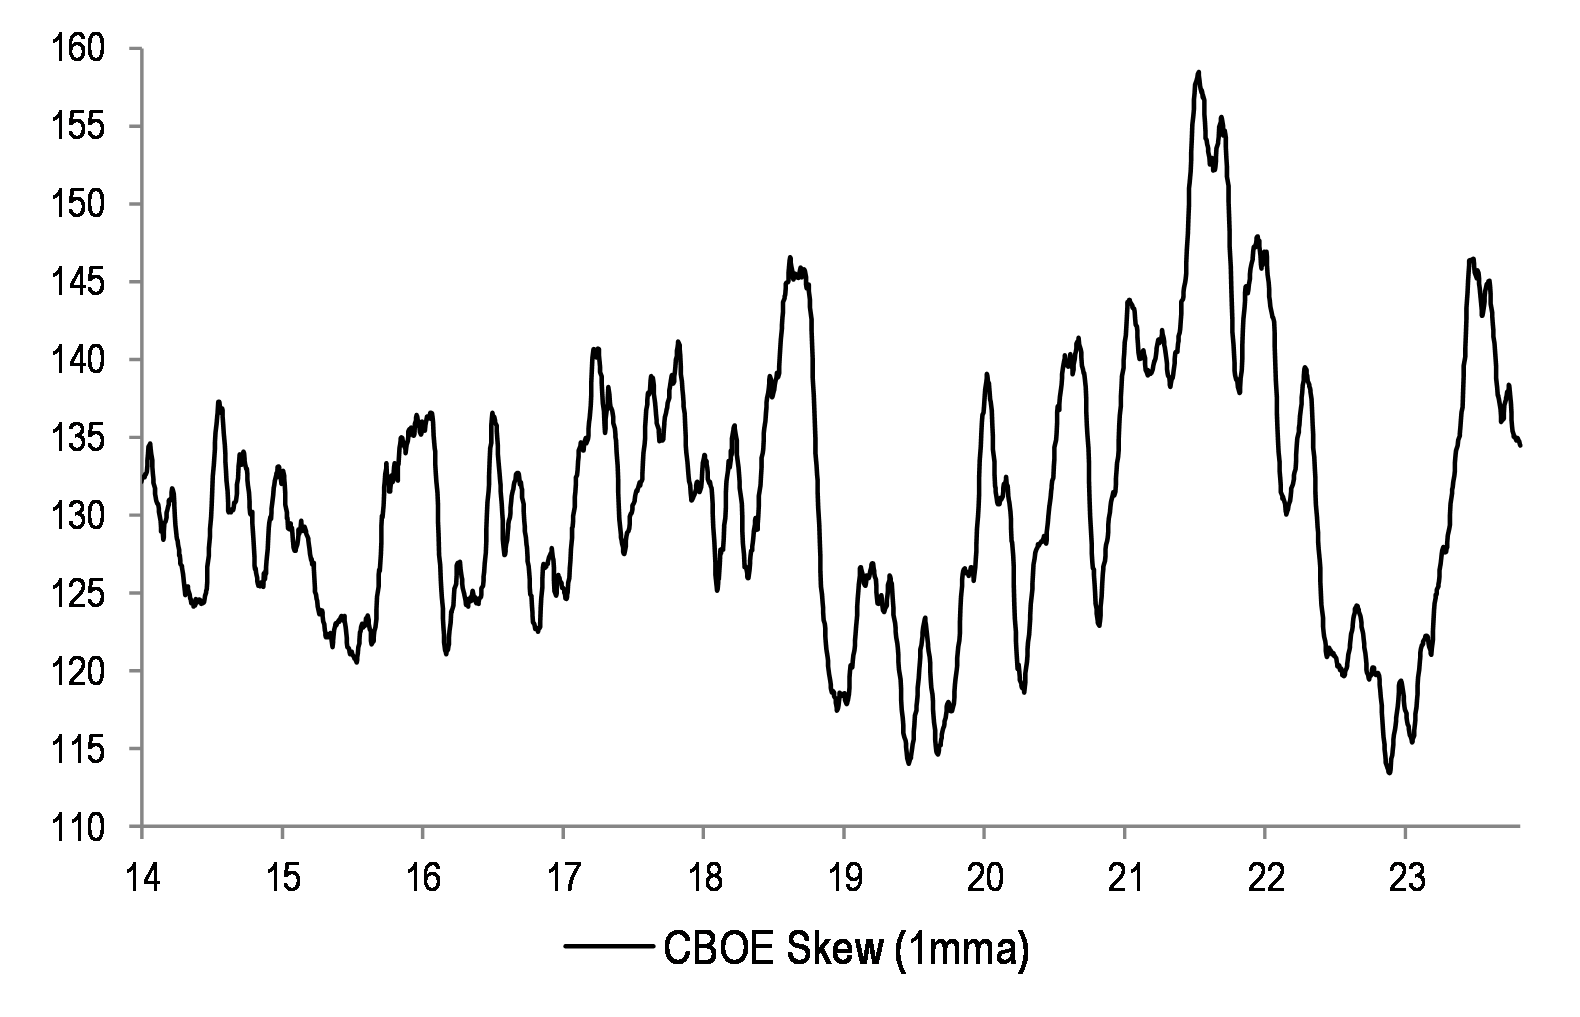
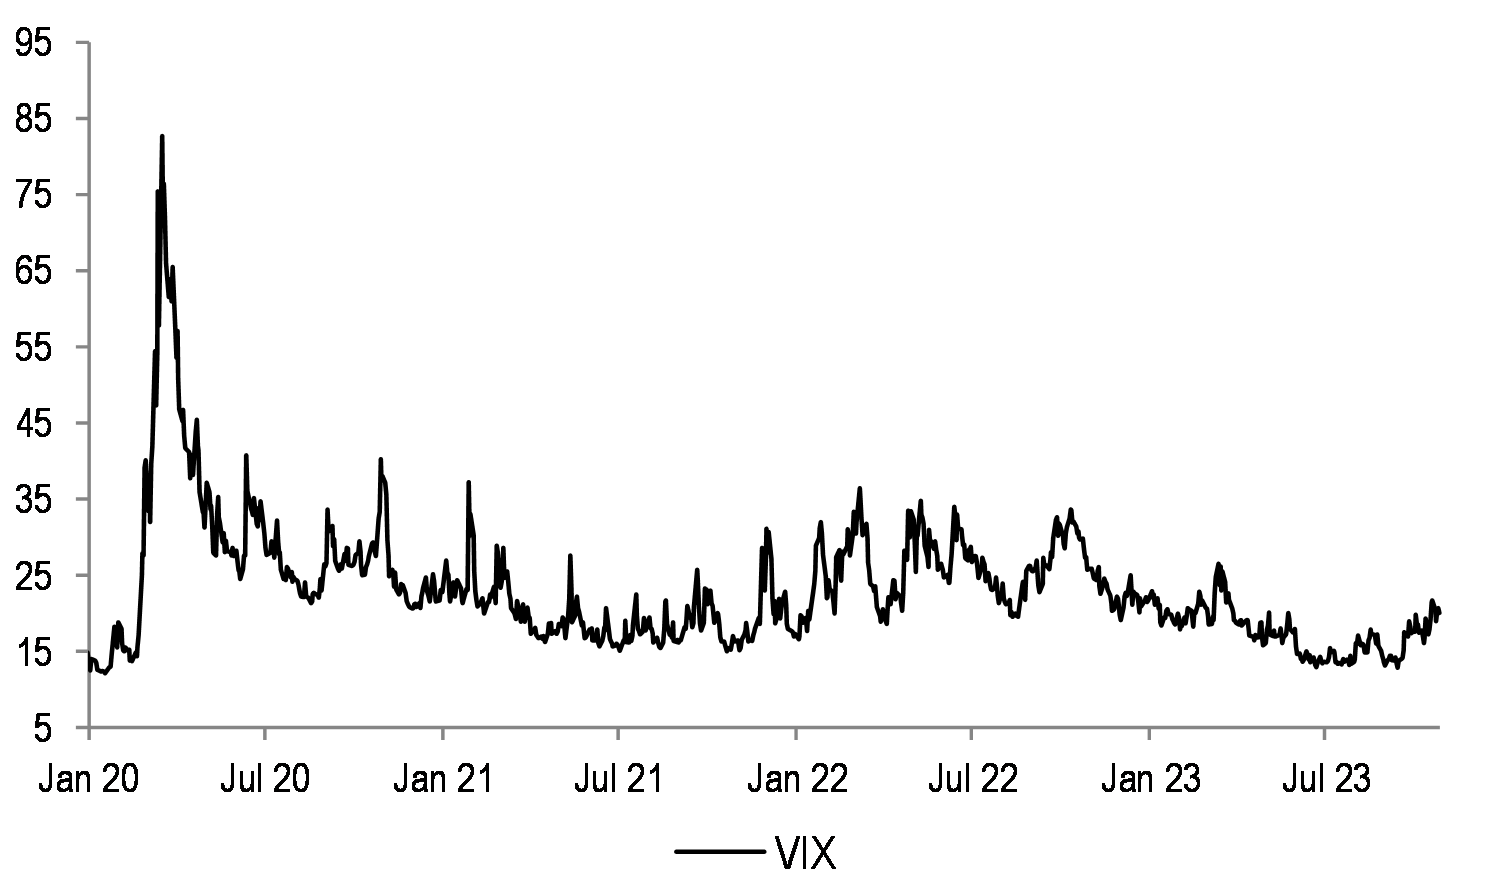
Figure 54: VIX
Performance
Table 16: Sector Index Performances — MSCI Europe
| (%change) | Local currency | |||
| Industry Group | 4week | 12m | YTD | |
| Europe | (3.4) | 5.8 | 1.7 | |
| Energy | (0.5) | 13.4 | 9.2 | |
| Materials | (3.9) | (3.1) | (6.5) | |
| Chemicals | (3.2) | (5.8) | (3.3) | |
| Construction Materials | (5.0) | 39.4 | 28.1 | |
| Metals & Mining | (4.5) | (9.0) | (20.2) | |
| Industrials | (5.8) | 7.1 | 3.5 | |
| Capital Goods | (5.4) | 10.6 | 4.9 | |
| Transport | (11.5) | (2.9) | (2.8) | |
| Business Svs | (4.5) | (4.0) | (0.3) | |
| Consumer Discretionary | (5.0) | 7.9 | 1.3 | |
| Automobile | (7.2) | 7.1 | 5.6 | |
| Consumer Durables | (3.9) | 5.8 | (0.6) | |
| Media | (1.5) | 10.0 | 6.8 | |
| Retailing | (6.2) | 21.4 | (1.2) | |
| Hotels, Restaurants & Leisure | (3.8) | 5.8 | 4.4 | |
| Consumer Staples | (1.4) | (2.3) | (4.8) | |
| Food & Drug Retailing | (1.7) | 7.6 | 6.4 | |
| Food Beverage & Tobacco | (1.5) | (7.8) | (8.7) | |
| Household Products | (1.2) | 8.9 | 1.8 | |
| Healthcare | (4.1) | 4.0 | 1.2 | |
| Financials | (4.5) | 12.4 | 3.6 | |
| Banks | (5.9) | 20.8 | 8.8 | |
| Diversified Financials | (5.4) | (0.8) | (2.2) | |
| Insurance | (1.4) | 10.7 | 0.7 | |
| Real Estate | (3.5) | (8.8) | (12.0) | |
| Information Technology | 0.7 | 9.6 | 11.7 | |
| Software and Services | 2.8 | 15.3 | 22.6 | |
| Technology Hardware | (3.6) | (16.5) | (14.7) | |
| Semicon & Semicon Equip | 0.2 | 15.4 | 13.0 | |
| Telecommunications Services | (2.4) | 3.1 | 3.4 | |
| Utilities | 0.5 | 5.6 | (1.2) | |
Source: MSCI, Datastream, as at COB 26th Oct, 2023.
Table 17: Country and Region Index Performances
| (%change) | Local Currency | US$ | |||||
| Country | Index | 4week | 12m | YTD | 4week | 12m | YTD |
| Austria | ATX | (4.0) | 5.6 | (3.3) | (4.2) | 10.8 | (4.4) |
| Belgium | BEL 20 | (6.3) | (6.6) | (10.8) | (6.4) | (2.0) | (11.9) |
| Denmark | KFX | (0.9) | 28.5 | 15.2 | (1.1) | 34.3 | 13.4 |
| Finland | HEX 20 | (4.2) | (13.8) | (15.7) | (4.4) | (9.6) | (16.7) |
| France | CAC 40 | (3.2) | 9.8 | 6.4 | (3.4) | 15.2 | 5.1 |
| Germany | DAX | (3.9) | 11.6 | 5.8 | (4.0) | 17.1 | 4.5 |
| Greece | ASE General | (1.3) | 36.5 | 26.6 | (1.5) | 43.2 | 25.1 |
| Ireland | ISEQ | (7.4) | 12.1 | 9.4 | (7.6) | 17.6 | 8.0 |
| Italy | FTSE MIB | (2.3) | 22.9 | 16.0 | (2.5) | 28.9 | 14.6 |
| Japan | Topix | (5.2) | 16.0 | 17.6 | (5.8) | 13.1 | 3.1 |
| Netherlands | AEX | (0.9) | 8.1 | 4.4 | (1.1) | 13.4 | 3.1 |
| Norway | OBX | (2.7) | 3.1 | 1.2 | (6.9) | (5.7) | (11.2) |
| Portugal | BVL GEN | 0.6 | (4.5) | (5.1) | 0.4 | 0.2 | (6.2) |
| Spain | IBEX 35 | (4.9) | 13.9 | 8.9 | (5.1) | 19.5 | 7.6 |
| Sweden | OMX | (3.4) | 4.8 | 1.0 | (5.4) | 2.1 | (5.8) |
| Switzerland | SMI | (5.0) | (4.2) | (3.4) | (3.1) | 5.3 | (0.5) |
| United States | S&P 500 | (3.8) | 8.0 | 7.8 | (3.8) | 8.0 | 7.8 |
| United States | NASDAQ | (4.6) | 14.8 | 20.3 | (4.6) | 14.8 | 20.3 |
| United Kingdom | FTSE 100 | (3.3) | 4.2 | (1.3) | (3.8) | 8.9 | (0.5) |
| EMU | MSCI EMU | (3.4) | 8.2 | 3.7 | (3.6) | 13.5 | 2.4 |
| Europe | MSCI Europe | (3.4) | 5.8 | 1.7 | (3.5) | 11.0 | 1.1 |
| Global | MSCI AC World | (3.9) | 7.4 | 6.5 | (4.0) | 8.1 | 5.3 |
Source: MSCI, Datastream, as at COB 26th Oct, 2023.
Earnings
Table 18: IBES Consensus EPS Sector Forecasts — MSCI Europe
| EPS Growth (%) | ||||
| 2022 | 2023E | 2024E | 2025E | |
| Europe | 20.8 | (2.5) | 6.8 | 8.6 |
| Energy | 121.8 | (28.9) | 0.7 | (0.5) |
| Materials | 2.9 | (35.6) | 11.0 | 7.9 |
| Chemicals | 3.1 | (28.3) | 21.1 | 14.2 |
| Construction Materials | 17.1 | 9.0 | 6.7 | 8.9 |
| Metals & Mining | (2.6) | (45.0) | 2.8 | 0.9 |
| Industrials | 20.9 | (0.5) | 9.3 | 12.5 |
| Capital Goods | 6.8 | 22.3 | 12.0 | 12.6 |
| Transport | 84.9 | (57.3) | (9.4) | 15.3 |
| Business Svs | 12.7 | 4.2 | 9.8 | 10.0 |
| Discretionary | 18.2 | 9.7 | 5.1 | 9.9 |
| Automobile | 17.5 | 4.0 | (1.7) | 5.0 |
| Consumer Durables | 15.2 | 0.9 | 9.9 | 12.8 |
| Media | 37.6 | 0.3 | 10.2 | 8.3 |
| Retailing | 1.8 | 36.8 | 16.5 | 18.5 |
| Hotels, Restaurants & Leisure | 118.0 | 92.7 | 23.8 | 19.5 |
| Staples | 13.2 | 2.2 | 7.4 | 8.8 |
| Food & Drug Retailing | 4.9 | 1.5 | 11.8 | 11.7 |
| Food Beverage & Tobacco | 17.0 | 1.4 | 6.7 | 8.7 |
| Household Products | 5.6 | 4.7 | 7.8 | 7.9 |
| Healthcare | 7.5 | 2.6 | 11.7 | 13.8 |
| Financials | 6.2 | 16.4 | 7.1 | 7.7 |
| Banks | 9.0 | 26.8 | 3.0 | 6.2 |
| Diversified Financials | 7.0 | (14.3) | 17.6 | 13.8 |
| Insurance | 0.1 | 15.2 | 11.5 | 7.6 |
| Real Estate | 4.1 | 11.2 | (1.4) | (0.1) |
| IT | 0.3 | 12.5 | 8.8 | 18.9 |
| Software and Services | (23.5) | 17.8 | 15.0 | 13.3 |
| Technology Hardware | 1.7 | (20.9) | 19.9 | 9.1 |
| Semicon & Semicon Equip | 24.4 | 25.3 | 1.6 | 26.2 |
| Telecoms | 27.3 | (5.0) | 10.1 | 9.7 |
| Utilities | 30.4 | 2.7 | (3.2) | 1.1 |
Source: IBES, MSCI, Datastream. As at COB 26th Oct, 2023.
Table 19: IBES Consensus EPS Country Forecasts
| EPS Growth (%) | |||||
| Country | Index | 2022 | 2023E | 2024E | 2025E |
| Austria | ATX | 36.3 | (16.3) | (0.2) | 3.2 |
| Belgium | BEL 20 | 2.3 | 4.6 | 8.0 | 17.2 |
| Denmark | Denmark KFX | 22.3 | (9.7) | 15.1 | 19.1 |
| Finland | MSCI Finland | 5.0 | (23.9) | 16.6 | 8.4 |
| France | CAC 40 | 28.5 | (0.4) | 5.2 | 8.6 |
| Germany | DAX | 9.5 | 1.0 | 7.3 | 9.6 |
| Greece | MSCI Greece | 121.4 | 2.6 | 0.5 | 5.4 |
| Ireland | MSCI Ireland | 12.8 | 39.9 | 5.3 | 8.6 |
| Italy | MSCI Italy | 29.0 | 9.2 | 0.2 | 2.9 |
| Netherlands | AEX | 29.4 | (4.3) | 5.6 | 12.2 |
| Norway | MSCI Norway | 83.6 | (38.5) | 12.2 | (1.8) |
| Portugal | MSCI Portugal | 23.5 | 30.5 | 8.2 | 6.6 |
| Spain | IBEX 35 | 28.9 | 2.5 | 1.5 | 6.9 |
| Sweden | OMX | (8.3) | 31.8 | 3.9 | 7.8 |
| Switzerland | SMI | 2.0 | 3.0 | 10.9 | 10.9 |
| United Kingdom | FTSE 100 | 28.6 | (10.5) | 5.6 | 6.3 |
| EMU | MSCI EMU | 19.8 | 3.5 | 6.7 | 9.3 |
| Europe ex UK | MSCI Europe ex UK | 17.6 | 1.6 | 7.4 | 9.7 |
| Europe | MSCI Europe | 20.8 | (2.5) | 6.8 | 8.6 |
| United States | S&P 500 | 7.3 | 0.5 | 12.0 | 12.3 |
| Japan | Topix | 2.8 | 11.8 | 8.2 | 9.3 |
| Emerging Market | MSCI EM | 5.9 | (4.2) | 18.6 | 14.6 |
| Global | MSCI AC World | 9.7 | (0.4) | 11.3 | 11.5 |
Source: IBES, MSCI, Datastream. As at COB 26th Oct, 2023** Japan refers to the period from March in the year stated to March in the following year – EPS post-goodwill
Valuations
Table 20: IBES Consensus European Sector Valuations
| P/E | Dividend Yields | EV/EBITDA | Price to Book | |||||||||
| 2023e | 2024e | 2025e | 2023e | 2024e | 2025e | 2023e | 2024e | 2025e | 2023e | 2024e | 2025e | |
| Europe | 12.2 | 11.5 | 10.5 | 3.8% | 4.0% | 4.2% | 7.6 | 7.2 | 6.6 | 1.7 | 1.6 | 1.5 |
| Energy | 7.1 | 7.0 | 7.1 | 5.5% | 5.3% | 5.3% | 3.1 | 3.0 | 3.2 | 1.3 | 1.2 | 1.1 |
| Materials | 13.4 | 12.0 | 11.2 | 4.2% | 4.2% | 4.4% | 7.0 | 6.5 | 5.9 | 1.5 | 1.4 | 1.3 |
| Chemicals | 20.2 | 16.7 | 14.6 | 3.3% | 3.4% | 3.6% | 10.7 | 9.3 | 8.5 | 1.9 | 1.9 | 1.8 |
| Construction Materials | 10.6 | 10.0 | 9.1 | 3.8% | 3.9% | 4.2% | 6.4 | 5.9 | 5.3 | 1.2 | 1.1 | 1.0 |
| Metals & Mining | 8.9 | 8.7 | 8.6 | 5.8% | 5.5% | 5.6% | 4.6 | 4.4 | 4.1 | 1.2 | 1.1 | 1.0 |
| Industrials | 16.1 | 14.7 | 13.1 | 2.8% | 3.0% | 3.3% | 9.0 | 8.4 | 7.4 | 2.7 | 2.5 | 2.3 |
| Capital Goods | 16.1 | 14.4 | 12.8 | 2.7% | 2.9% | 3.2% | 9.6 | 8.6 | 7.5 | 2.8 | 2.6 | 2.4 |
| Transport | 12.2 | 13.5 | 11.7 | 4.1% | 3.7% | 3.8% | 5.8 | 6.3 | 6.0 | 1.5 | 1.5 | 1.4 |
| Business Svs | 19.5 | 17.7 | 16.1 | 2.6% | 2.8% | 3.1% | 12.6 | 11.4 | 10.4 | 5.3 | 4.9 | 4.3 |
| Discretionary | 11.3 | 10.8 | 9.8 | 3.1% | 3.4% | 3.7% | 5.5 | 5.1 | 4.2 | 1.7 | 1.6 | 1.4 |
| Automobile | 4.8 | 4.9 | 4.7 | 6.0% | 6.2% | 6.5% | 2.1 | 2.3 | 1.5 | 0.7 | 0.6 | 0.6 |
| Consumer Durables | 19.8 | 18.0 | 16.0 | 2.1% | 2.3% | 2.6% | 13.1 | 11.7 | 10.4 | 3.8 | 3.4 | 3.1 |
| Media & Entertainment | 15.1 | 13.7 | 12.6 | 2.5% | 2.7% | 2.8% | 12.2 | 11.0 | 8.8 | 1.7 | 1.6 | 1.5 |
| Retailing | 16.1 | 13.8 | 11.6 | 2.3% | 2.8% | 3.0% | 13.6 | 7.9 | 6.9 | 2.9 | 2.5 | 2.4 |
| Hotels, Restaurants & Leisure | 23.2 | 18.7 | 15.7 | 2.0% | 2.6% | 2.9% | 13.3 | 11.2 | 9.6 | 3.5 | 3.2 | 2.9 |
| Staples | 16.9 | 15.8 | 14.5 | 3.1% | 3.3% | 3.5% | 11.2 | 10.4 | 9.6 | 2.7 | 2.6 | 2.4 |
| Food & Drug Retailing | 12.9 | 11.6 | 10.4 | 3.6% | 3.9% | 4.1% | 6.5 | 6.0 | 5.7 | 1.6 | 1.6 | 1.5 |
| Food Beverage & Tobacco | 16.5 | 15.4 | 14.2 | 3.4% | 3.6% | 3.9% | 11.1 | 10.3 | 9.6 | 2.4 | 2.3 | 2.2 |
| Household Products | 19.9 | 18.5 | 17.1 | 2.4% | 2.5% | 2.7% | 14.3 | 13.2 | 12.1 | 4.0 | 3.8 | 3.5 |
| Healthcare | 16.8 | 15.0 | 13.2 | 2.6% | 2.7% | 3.0% | 12.4 | 11.0 | 9.8 | 3.4 | 3.1 | 2.8 |
| Financials | 7.9 | 7.4 | 6.9 | 5.9% | 6.5% | 6.8% | 0.9 | 0.9 | 0.8 | |||
| Banks | 6.0 | 5.8 | 5.5 | 7.8% | 8.6% | 8.8% | 0.7 | 0.7 | 0.6 | |||
| Diversified Financials | 12.7 | 10.8 | 9.5 | 2.8% | 3.0% | 3.3% | 1.1 | 1.2 | 1.1 | |||
| Insurance | 10.1 | 9.1 | 8.5 | 5.7% | 6.1% | 6.5% | 1.5 | 1.4 | 1.3 | |||
| Real Estate | 10.7 | 10.9 | 10.9 | 5.6% | 5.8% | 6.0% | 0.6 | 0.7 | 0.6 | |||
| IT | 20.8 | 19.1 | 16.1 | 1.5% | 1.6% | 1.8% | 13.1 | 12.2 | 10.2 | 3.9 | 3.6 | 3.2 |
| Software and Services | 23.0 | 20.0 | 17.7 | 1.6% | 1.7% | 1.8% | 14.2 | 12.9 | 11.2 | 3.6 | 3.3 | 3.1 |
| Technology Hardware | 14.3 | 11.9 | 11.0 | 2.8% | 3.1% | 3.4% | 8.4 | 7.1 | 6.3 | 1.6 | 1.5 | 1.4 |
| Semicon & Semicon Equip | 21.4 | 21.0 | 16.7 | 1.1% | 1.2% | 1.4% | 14.1 | 13.8 | 10.9 | 6.7 | 5.7 | 4.8 |
| Communication Services | 13.8 | 12.5 | 11.4 | 4.5% | 4.7% | 4.9% | 6.7 | 6.4 | 5.9 | 1.3 | 1.3 | 1.2 |
| Utilities | 11.3 | 11.7 | 11.6 | 5.4% | 5.4% | 5.6% | 7.8 | 7.9 | 7.8 | 1.6 | 1.5 | 1.4 |
Source: IBES, MSCI, Datastream. As at COB 26th Oct, 2023.
Table 21: IBES Consensus P/E and 12-Month Forward Dividend Yields — Country Forecasts
| P/E | Dividend Yield | |||||
| Country | Index | 12mth Fwd | 2023E | 2024E | 2025E | 12mth Fwd |
| Austria | ATX | 6.4 | 6.4 | 6.4 | 6.2 | 6.3% |
| Belgium | BEL 20 | 13.5 | 14.4 | 13.3 | 11.4 | 3.5% |
| Denmark | Denmark KFX | 23.8 | 26.8 | 23.3 | 19.5 | 1.8% |
| Finland | MSCI Finland | 12.7 | 14.5 | 12.4 | 11.5 | 5.0% |
| France | CAC 40 | 11.1 | 11.5 | 11.0 | 10.1 | 3.7% |
| Germany | DAX | 9.9 | 10.5 | 9.8 | 8.9 | 4.0% |
| Greece | MSCI Greece | 34.8 | 35.0 | 34.8 | 33.0 | 1.5% |
| Ireland | MSCI Ireland | 11.7 | 12.2 | 11.6 | 10.7 | 3.0% |
| Italy | MSCI Italy | 7.5 | 7.5 | 7.5 | 7.3 | 6.1% |
| Netherlands | AEX | 12.8 | 13.3 | 12.6 | 11.2 | 2.9% |
| Norway | MSCI Norway | 9.8 | 10.8 | 9.6 | 9.8 | 6.4% |
| Portugal | MSCI Portugal | 14.1 | 15.1 | 13.9 | 13.1 | 4.0% |
| Spain | IBEX 35 | 9.8 | 9.9 | 9.8 | 9.2 | 5.2% |
| Sweden | OMX | 12.6 | 13.0 | 12.5 | 11.6 | 4.1% |
| Switzerland | SMI | 14.8 | 16.1 | 14.6 | 13.1 | 3.6% |
| United Kingdom | FTSE 100 | 10.0 | 10.4 | 9.9 | 9.3 | 4.5% |
| EMU | MSCI EMU | 11.0 | 11.6 | 10.9 | 10.0 | 3.9% |
| Europe ex UK | MSCI Europe ex UK | 12.2 | 13.0 | 12.1 | 11.0 | 3.7% |
| Europe | MSCI Europe | 11.6 | 12.2 | 11.5 | 10.5 | 3.9% |
| United States | S&P 500 | 17.3 | 19.2 | 17.1 | 15.2 | 1.7% |
| Japan | Topix | 13.2 | 13.9 | 12.9 | 11.8 | 2.5% |
| Emerging Market | MSCI EM | 11.5 | 13.3 | 10.7 | 9.8 | 3.2% |
| Global | MSCI AC World | 15.5 | 17.0 | 14.5 | 13.7 | 2.4% |
Source: IBES, MSCI, Datastream. As at COB 26th Oct, 2023; ** Japan refers to the period from March in the year stated to March in the following year – P/E post goodwill.
Economic, Interest Rate and Exchange Rate Outlook
Table 22: Economic Outlook in Summary
| Real GDP | Real GDP | Consumer prices | |||||||||||
| % oya | % over previous period, saar | % oya | |||||||||||
| 2022 | 2023E | 2024E | 1Q23 | 2Q23 | 3Q23E | 4Q23E | 1Q24E | 2Q24E | 2Q23 | 4Q23E | 2Q24E | 4Q24E | |
| United States | 1.9 | 2.4 | 1.4 | 2.2 | 2.1 | 4.9 | 1.5 | 0.5 | 0.5 | 4.1 | 3.3 | 2.6 | 2.1 |
| Eurozone | 3.4 | 0.5 | 0.6 | 0.2 | 0.5 | 0.0 | 0.5 | 0.7 | 0.7 | 6.2 | 3.3 | 2.9 | 2.1 |
| United Kingdom | 4.3 | 0.6 | 0.2 | 1.3 | 0.8 | 0.0 | 1.0 | 0.8 | 0.0 | 8.4 | 4.4 | 2.5 | 3.0 |
| Japan | 1.0 | 1.9 | 0.7 | 3.2 | 4.8 | 0.2 | 0.0 | 0.6 | 0.6 | 3.4 | 3.7 | 4.1 | 3.4 |
| Emerging markets | 3.5 | 3.9 | 3.6 | 4.0 | 1.4 | 3.3 | 2.1 | 1.9 | 1.9 | 3.4 | 3.9 | 4.5 | 3.8 |
| Global | 2.9 | 2.6 | 2.1 | 7.4 | 1.1 | 4.8 | 3.6 | 3.5 | 3.6 | 4.3 | 3.6 | 3.5 | 3.0 |
Source: J.P. Morgan economic research J.P. Morgan estimates, as of COB 19th Oct, 2023
Table 23: Official Rates Outlook
| % | Official interest rate | Current | Last change (bp) | Forecast next change (bp) | Forecast for | |||
| Dec 23 | Mar 24 | Jun 24 | Sep 24 | |||||
| United States | Federal funds rate | 5.50 | 26 Jul 23 (+25bp) | 3Q24 (-25bp) | 5.50 | 5.50 | 5.50 | 5.25 |
| Eurozone | Depo rate | 4.00 | 14 Sep 23 (+25bp) | Sep 24 (-25bp) | 4.00 | 4.00 | 4.00 | 3.75 |
| United Kingdom | Repo rate | 5.25 | 03 Aug 23 (+25bp) | On hold | 5.25 | 5.25 | 5.25 | 5.25 |
| Japan | Overnight call rate | -0.10 | Jan 16 (-20bp) | 3Q24 (+10bp) | -0.10 | -0.10 | -0.10 | 0.00 |
Source: J.P. Morgan estimates, Datastream, as of COB 19th Oct 2023.
Table 24: 10-Year Government Bond Yield Forecasts
| 10Yr Govt BY | Forecast for end of | ||||
| 27-Oct-23 | Dec 23 | Mar 24 | Jun 24 | Sep 24 | |
| US | 4.86 | 4.75 | 4.55 | 4.20 | 4.00 |
| Euro Area | 2.83 | 2.50 | 2.20 | 2.00 | 1.90 |
| United Kingdom | 4.57 | 4.40 | 4.15 | 3.90 | 3.75 |
| Japan | 0.88 | 0.75 | 0.80 | 0.90 | 1.00 |
Source: J.P. Morgan estimates, Datastream, forecasts as of COB 19th Oct, 2023.
Table 25: Exchange Rate Forecasts vs. US Dollar
| Exchange rates vs US$ | Forecast for end of | ||||
| 26-Oct-23 | Dec 23 | Mar 24 | Jun 24 | Sep 24 | |
| EUR | 1.05 | 1.00 | 1.03 | 1.05 | 1.10 |
| GBP | 1.21 | 1.14 | 1.18 | 1.21 | 1.26 |
| CHF | 0.90 | 0.93 | 0.92 | 0.91 | 0.87 |
| JPY | 150 | 152 | 153 | 153 | 149 |
| DXY | 106.6 | 111.3 | 108.9 | 107.2 | 103.0 |
Source: J.P. Morgan estimates, Datastream, forecasts as of COB 19th Oct, 2023.
Sector, Regional and Asset Class Allocations
Table 26: J.P. Morgan Equity Strategy — European Sector Allocation
| MSCI Europe Weights | J.P. Morgan Allocation | Deviation From MSCI | J.P. Morgan Recommendation | ||
| Energy | 6.6% | 8.0% | 1.4% | OW | |
| Materials | 7.0% | 6.0% | -1.0% | N | |
| Chemicals | UW | ||||
| Construction Materials | N | ||||
| Metals & Mining | N | ||||
| Industrials | 14.6% | 14.0% | -0.6% | N | |
| Capital Goods ex Aerospace & Defence | UW | ||||
| Aerospace & Defence* | OW | ||||
| Transport | N | ||||
| Business Services | N | ||||
| Consumer Discretionary | 9.2% | 8.0% | -1.2% | N | |
| Automobile | UW | ||||
| Consumer Durables | N | ||||
| Hotels, Restaurants, Leisure | N | ||||
| Specialty Retail | UW | ||||
| Internet Retail | UW | ||||
| Consumer Staples | 12.4% | 13.0% | 0.6% | OW | |
| Food & Drug Retailing | N | ||||
| Beverages | N | ||||
| Food & Tobacco | OW | ||||
| Household Products | OW | ||||
| Healthcare | 16.3% | 18.0% | 1.7% | OW | |
| Financials | 17.7% | 15.0% | -2.7% | UW | |
| Banks | UW | ||||
| Insurance | OW | ||||
| Real Estate | 0.7% | 1.0% | 0.3% | N | |
| Information Technology | 6.7% | 7.0% | 0.3% | N | |
| Software and Services | N | ||||
| Technology Hardware | N | ||||
| Semicon & Semicon Equip | N | ||||
| Communication Services | 4.5% | 5.0% | 0.5% | OW | |
| Telecommunication Services | OW | ||||
| Media | N | ||||
| Utilities | 4.3% | 5.0% | 0.7% | OW | |
| 100.0% | 100.0% | 0.0% | Balanced | ||
Source: MSCI, Datastream, J.P. Morgan.
Table 27: J.P. Morgan Equity Strategy — Global Regional Allocation
| MSCI Weights | Allocation | Deviation | Recommendation | |
| EM | 10.9% | 11.0% | 0.1% | Neutral |
| DM | 89.1% | 89.0% | -0.1% | Neutral |
| US | 67.7% | 64.0% | -3.7% | Underweight |
| Japan | 6.1% | 9.0% | 2.9% | Overweight |
| Eurozone | 9.8% | 8.0% | -1.8% | Underweight |
| UK | 4.3% | 6.0% | 1.7% | Overweight |
| Other* | 12.1% | 13.0% | 0.9% | Overweight |
| 100.0% | 100.0% | 0.0% | Balanced | |
Source: MSCI, J.P. Morgan *Other includes Denmark, Switzerland, Australia, Canada, Hong Kong SAR, Sweden, Singapore, New Zealand, Israel and Norway
Table 28: J.P. Morgan Equity Strategy — European Regional Allocation
| MSCI Europe Weights | Allocation | Deviation | Recommendation | |
| Eurozone | 51.5% | 47.0% | -4.5% | Underweight |
| United Kingdom | 22.7% | 26.0% | 3.3% | Overweight |
| Other** | 25.9% | 27.0% | 1.1% | Overweight |
| 100.0% | 100.0% | 0.0% | Balanced | |
Source: MSCI, J.P. Morgan **Other includes Denmark, Switzerland, Sweden and Norway
Table 29: J.P. Morgan Equity Strategy — Asset Class Allocation
| Benchmark Weighting | Allocation | Deviation | Recommendation | |
| Equities | 60% | 55% | -5% | Underweight |
| Bonds | 30% | 35% | 5% | Overweight |
| Cash | 10% | 10% | 0% | Neutral |
| 100% | 100% | 0% | Balanced | |
Source: J.P. Morgan Equity Strategy
