
Equity Strategy
Three key drivers of to date resilient corporate profitability to turn weaker
Profit margins are elevated in the historical context, and have started to soften… they always move lower ahead of the next downturn…

…net interest component was strongly accretive to corporate bottom line over the past few years, with net interest expense collapsing, but this is likely as good as it gets…

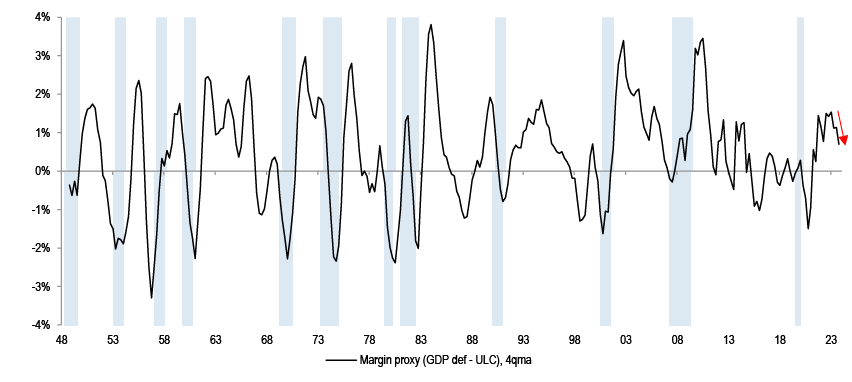
…ULCs are set to move higher, as well… this shoud lead to a rollover in margin proxy - deflator minus ULCs

Source: FRED,J.P. Morgan.
- Bulls are to a good extent basing their constructive market call on the premise that corporate profits are set to accelerate, supported by the bottoming out in activity indicators that is now in progress, such as PMIs and ISM. Indeed, a number of forecasters have in the past few weeks raised their index targets on the back of the more optimistic earnings outlook. However, the earnings reality might turn out to be the opposite as we move through the year.
- In aggregate, and despite a few notable exceptions, corporate profit margins are elevated in a historical context, and appear to be peaking out - top chart. The historical pattern where profit margins always start to move lower ahead of the next economic downturn is clear. We see 3 sources of downside to profit margins and to earnings from here:
- 1. Many corporates benefitted from the unique feature of this cycle: as interest rates increased 300bp+, the net interest expense came down. That could be explained by companies locking in low cost of financing through extending the duration of their debt, and also through many corporates seeing an improving return on their cash balances. This, rather counter-intuitive, development is set to normalize as time passes. Companies will have to roll their debt into higher cost of credit. Separately, the basket of stocks with high refinancing needs is losing 20% vs SXXP over a year ago - JPDEHFCL, and our basket of cash rich companies is ahead by 14% - JPDEHFCW. We think this outperformance will continue through 1H.
- 2. Topline was exceptionally strong post COVID for many corporates, as pricing power was high, companies were able to pass on input cost pressure with ease. As nominal GDP growth rates fade, and as PPIs have turned negative, margins could weaken. We are still of the view that COVID induced inflation spike will end up fully unwound, as per our Oct ’22 report, and this in turn suggests that corporate profitability winners need to reset. Historically, the positive correlation between earnings and PPIs has been clear.
- 3. US economic activity was much more robust last year than most assumed, and this has potentially boosted productivity and in turn reduced ULCs. If the economy slows, partly because the supports that it enjoyed last year do not repeat, such as fiscal stimulus, ULCs could pick up. Profit margin proxy, corporate deflator minus ULCs, could turn into more of a headwind.
- Putting the above 3 together, one might end up with a disappointing profits outcome even without seeing an outright recession, and we note that 2024 EPS projections keep coming down in key regions. Now, could S&P500 earnings do much better than economy wide profits? It is interesting to note that for S&P500 all the profit growth in the past few quarters was due to Magnificent 7, and this is one of the reasons why we remain OW Growth vs Value. Ex these stocks, EPS growth for the remaining S&P500 constituents is outright negative. USD plays a role here, and if it gets stronger, as we suspect, then the S&P500 earnings might not outperform NIPA much.
Three key drivers of to date resilient corporate profitability to turn weaker
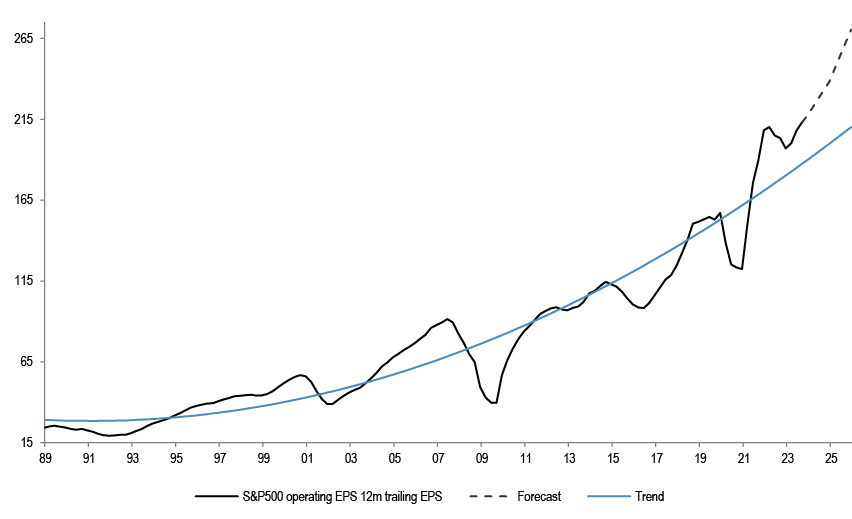
Figure 1: S&P500 EPS vs Trend
Source: Datastream, IBES
Consensus projections are for S&P500 EPS growth to accelerate in 2024 and 2025, to 10-11% pace, from 2% seen in 2023. Bulls are basing their constructive market call on this, but the question is whether earnings and margins will continue to grow from what is an already elevated starting point?
Profit margins are elevated, and starting to show some softening of late...
Figure 2: NIPA profit margins

Source: BEA
US profit margins are close to historical highs, and are softening from the peak levels. We note that the rollover in margins always historically preceded the next downturn.
Figure 3: MSCI Europe (ex Financials) EBIT margin

Source: Datastream
European profit margins are also at elevated levels, in the historical context. Some sectors such as commodities and Chemicals are subdued, but most other sectors are at highs, leaving the overall margin level elevated.
Table 1: MSCI World EBIT Margin and Earnings growth - consensus
| EBIT Margin | Earnings growth | ||||||
| 23e | 24e | 25e | Change 24e-23e (bps) | 23e | 24e | 25e | |
| World | 14.5% | 14.9% | 15.7% | 40.2 | 1.0% | 7.6% | 12.1% |
Source: Datastream, IBES, *EBIT margin is for ex Financials and Real Estate
The consensus is projecting an acceleration in EPS growth and in margins this year, but we see risks to this.
...we believe profitability trends will be weaker over the next year: 1) Corporate profit margins have benefitted from lower interest expense. but that could start to reverse
Figure 4: Euro IG and HY Yield

Source: J.P. Morgan
Compared to pre-pandemic levels , the yield on the Euro denominated investment grade credit has gone up more than 300bp, from 0.9% in 2019 to 4.2% on average in 2023. Cost of borrowing for high yielders has risen by 380bp over the same time frame.
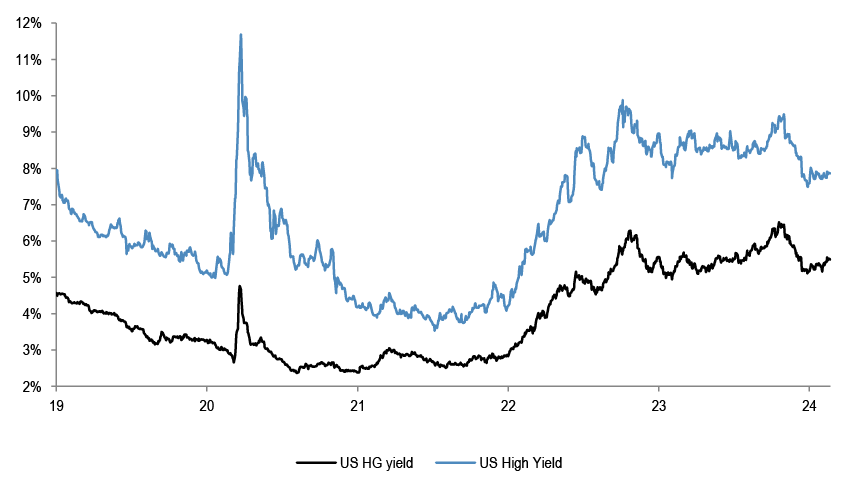
Figure 5: US HG and HY Yield
Source: J.P. Morgan
US corporate debt has seen yields rising by similar magnitude.
Figure 6: US and Eurozone Median Net Debt to Equity

Source: Datastream
At the same time, net leverage of both the US and European corporates has not changed all that much, to be close to the historical averages.
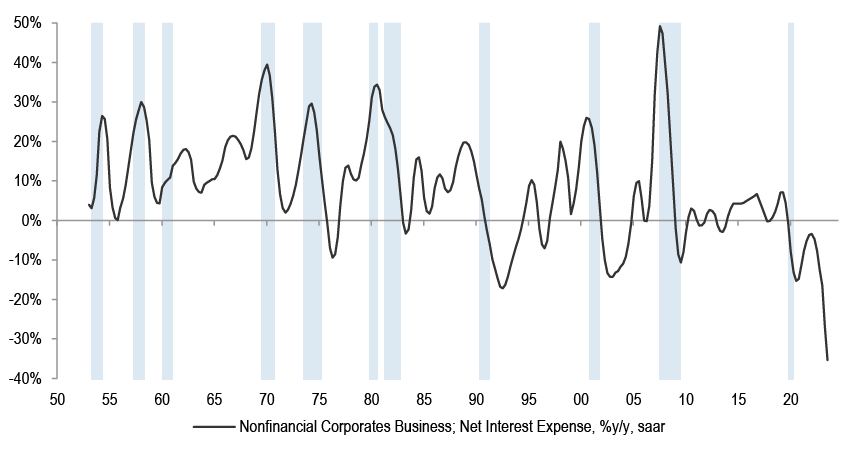
Figure 7: Nonfinancial corporate business: Net Interest Expenses
Source: FRED
What is interesting is that despite the big increase in borrowing costs it appears that companies are on average paying less in interest now than before the pandemic. Data from the St. Louis Fed tracking aggregate interest expense for non-financial corporates in the US shows a sharp decline over the past few years.
Figure 8: S&P500 and Stoxx600 Net interest expense as a % of Net Debt

Source: Bloomberg Finance L.P.
Our bottom up analysis on S&P500 shows that almost 40% of the index constituents have either seen their net interest expense go down, or the income on their cash balances improve compared to 2019. For Stoxx600, more than half the companies are paying less in interest expense versus 2019, or are earning more interest on their cash balances.
We also looked at the effective interest rate (net interest expense / net debt) that companies were paying on their debt. Here again we note that 42% of companies in the S&P500 (excluding net cash companies from the denominator) and 36% of companies in the Stoxx600 are paying a lower rate of interest on their debt versus the pre-pandemic levels. This finding is supported by work from our Credit strategists who concluded that, at an aggregate level, as a rate of change vs 2019, companies were net earnings more interest on their cash balances compared to what they were paying in additional coupons on their debt.
The reasons why this happened range from: a large number of corporates tapped debt markets during the period of extremely low interest rates, extending the duration of debt on their books, and locking in low cost of financing, which didn’t need to roll over yet, and at the same time on their cash balances companies started to earn some positive rate of return. We do not think that can last, the positive effect is as good as it gets, in our view.
Figure 9: European and US High Yield bonds maturity profile (EUR billion)

Source: J.P. Morgan Credit Strategy
Limited refinancing needs thus far meant that, at an aggregate level, companies were largely shielded from the higher borrowing costs. This is starting to change. We note that a growing volume of debt is to be refinanced over the next few years. At the same time, we expect central banks will commence rate cuts this year, which will reduce the income on cash that corporates are earning.
Table 2: Debt Distribution - Stoxx600
| Debt Distribution Average Years to Maturity | % Debt maturing this year | % Debt maturing in next 3 years | #cos whose more than 60% of total debt is maturing this year | #cos whose more than 60% of total debt is maturing in next 3 years | #cos whose more than 40% of total debt is maturing this year | #cos whose more than 40% of total debt is maturing in next 3 years | |
| ENERGY | 6.0 | 3.6% | 26.7% | 4 | 8 | 4 | 13 |
| FINANCIALS | 5.0 | 7.5% | 36.1% | 16 | 56 | 23 | 83 |
| REAL ESTATE | 4.8 | 4.3% | 33.5% | 5 | 14 | 8 | 26 |
| MATERIALS | 3.9 | 5.3% | 35.7% | 7 | 25 | 16 | 48 |
| INDUSTRIALS | 3.9 | 6.4% | 37.0% | 33 | 74 | 48 | 106 |
| COMMUNICATION SERVICES | 5.3 | 4.6% | 30.2% | 7 | 16 | 10 | 24 |
| CONSUMER STAPLES | 4.7 | 8.0% | 33.3% | 13 | 24 | 17 | 42 |
| CONSUMER DISCRETIONARY | 3.5 | 0.9% | 46.1% | 27 | 52 | 33 | 60 |
| UTILITIES | 6.7 | 4.8% | 24.0% | 1 | 7 | 2 | 19 |
| HEALTH CARE | 4.5 | 0.0% | 30.6% | 12 | 25 | 15 | 38 |
| INFORMATION TECHNOLOGY | 3.7 | 10.0% | 42.1% | 12 | 21 | 17 | 25 |
Source: Bloomberg Finance L.P.
In Europe, quite a few companies in the Technology, Industrials and Consumer Discretionary sectors need to refinance a significant proportion of their debt over the next year.
Table 3: Debt Distribution - S&P500
| Debt Distribution Average Years to Maturity | % Debt maturing this year | % Debt maturing in next 3 years | #cos whose more than 60% of total debt is maturing this year | #cos whose more than 60% of total debt is maturing in next 3 years | #cos whose more than 40% of total debt is maturing this year | #cos whose more than 40% of total debt is maturing in next 3 years | |
| ENERGY | 11.0 | 4.1% | 20.8% | 0 | 3 | 1 | 12 |
| FINANCIALS | 7.5 | 4.5% | 24.5% | 4 | 17 | 5 | 43 |
| REAL ESTATE | 6.6 | 3.6% | 24.9% | 0 | 2 | 0 | 20 |
| MATERIALS | 10.5 | 3.3% | 25.6% | 0 | 1 | 0 | 16 |
| INDUSTRIALS | 7.5 | 0.1% | 23.9% | 10 | 21 | 16 | 51 |
| COMMUNICATION SERVICES | 11.9 | 2.7% | 15.1% | 0 | 1 | 0 | 8 |
| CONSUMER STAPLES | 9.8 | 6.7% | 24.6% | 1 | 4 | 2 | 24 |
| CONSUMER DISCRETIONARY | 5.4 | 0.0% | 25.6% | 6 | 16 | 7 | 40 |
| UTILITIES | 13.3 | 4.1% | 15.4% | 0 | 1 | 1 | 7 |
| HEALTH CARE | 7.2 | 3.7% | 21.1% | 10 | 17 | 11 | 39 |
| INFORMATION TECHNOLOGY | 5.7 | 2.4% | 26.6% | 13 | 26 | 18 | 46 |
Source: Bloomberg Finance L.P.
The Consumer Discretionary, Technology and Real Estate sectors in the US have relatively high proportion of shorter duration debt.
Figure 10: Nonfinancial corporate business: Net Interest Expense versus US 10Y bond yield

Source: Bloomberg Finance L.P., FRED
This suggests that the startling divergence that was seen between the rising interest rates and falling net interest expense seen over the past 3 years is set to start closing.
Our analysts have flagged stocks like Safran, BAE systems, Sanofi, GSK and Novartis among those that have benefitted from this.
The basket of stocks with high refinancing needs will likely keep struggling...
In our 2024 outlook report, we had introduced a couple of stock baskets centered around this theme.
Table 4: JPM European losers of higher financing costs - JPDEHFCL Index
| Name | Ticker | Sector | ND/EBITDA 2024e |
| Ocado Group PLC | OCDO LN | Staples | 9.5 |
| United Utilities Group PLC | UU/ LN | Utilities | 8.8 |
| Severn Trent PLC | SVT LN | Utilities | 7.4 |
| National Grid PLC | NG/ LN | Utilities | 6.5 |
| Cellnex Telecom SA | CLNX SM | Comm. Srvcs | 6.2 |
| Snam SpA | SRG IM | Utilities | 6.1 |
| Enagas SA | ENG SM | Utilities | 5.1 |
| Infrastrutture Wireless Italia | INW IM | Comm. Srvcs | 4.6 |
| Grifols SA | GRF SM | Health care | 4.4 |
| Redeia Corp SA | RED SM | Utilities | 4.0 |
| LANXESS AG | LXS GR | Materials | 4.0 |
| Fresenius SE & Co KGaA | FRE GR | Health care | 3.6 |
| Wizz Air Holdings Plc | WIZZ LN | Industrials | 3.0 |
| Fresenius Medical Care AG & Co | FME GR | Health care | 2.9 |
| Bayer AG | BAYN GR | Health care | 2.8 |
| Fluidra SA | FDR SM | Industrials | 2.8 |
| Nexi SpA | NEXI IM | Financials | 2.8 |
| Diageo PLC | DGE LN | Staples | 2.7 |
| Pernod Ricard SA | RI FP | Staples | 2.7 |
| Anheuser-Busch InBev SA/NV | ABI BB | Staples | 2.7 |
| Coca-Cola HBC AG | CCH LN | Staples | 2.7 |
| Akzo Nobel NV | AKZA NA | Materials | 2.5 |
| BASF SE | BAS GR | Materials | 2.5 |
| Givaudan SA | GIVN SW | Materials | 2.5 |
| British American Tobacco PLC | BATS LN | Staples | 2.4 |
| Electrolux AB | ELUXB SS | Discretionary | 2.4 |
| Alstom SA | ALO FP | Industrials | 2.3 |
| ams-OSRAM AG | AMS SW | IT | 2.2 |
| Ashtead Group PLC | AHT LN | Industrials | 2.2 |
| Koninklijke Philips NV | PHIA NA | Health care | 2.0 |
| Eurofins Scientific SE | ERF FP | Health care | 2.0 |
| Symrise AG | SY1 GR | Materials | 1.7 |
| RELX PLC | REL LN | Industrials | 1.6 |
| DSV A/S | DSV DC | Industrials | 1.4 |
| Valeo SE | FR FP | Discretionary | 1.2 |
Source: J.P. Morgan
On the negative side, we identified companies that have high leverage and face meaningful refinancing risk in the near-term.
…while cash rich companies should keep working in the near term
Table 5: JPM European Beneficiaries of higher rates - JPDEHFCW Index
| Name | Ticker | Sector |
| Publicis Groupe SA | PUB FP | Comm. Srvcs |
| Renault SA | RNO FP | Discretionary |
| Mercedes-Benz Group AG | MBG GR | Discretionary |
| Stellantis NV | STLAM IM | Discretionary |
| Industria de Diseno Textil SA | ITX SM | Discretionary |
| Whitbread PLC | WTB LN | Discretionary |
| Volkswagen AG | VOW GR | Discretionary |
| Beiersdorf AG | BEI GR | Staples |
| KONE AG | KNEBV FH | Financials |
| Banco BPM SpA | BAMI IM | Financials |
| Banco Bilbao Vizcaya Argentari | BBVA SM | Financials |
| Bank of Ireland Group PLC | BIRG ID | Financials |
| Bankinter SA | BKT SM | Financials |
| CaixaBank SA | CABK SM | Financials |
| Intesa Sanpaolo SpA | ISP IM | Financials |
| UniCredit SpA | UCG IM | Financials |
| AIB Group PLC | AIBG ID | Financials |
| Banco de Sabadell SA | SAB SM | Financials |
| Schindler Holding AG | SCHP SW | Industrials |
| Epiroc AB | EPIA SS | Industrials |
| Airbus SE | AIR FP | Industrials |
| Dassault Aviation SA | AM FP | Industrials |
| Ryanair Holdings PLC | RYA ID | Industrials |
| Spectris PLC | SXS LN | IT |
| Dassault Systemes SE | DSY FP | IT |
| SAP SE | SAP GR | IT |
| Centrica PLC | CNA LN | Utilities |
Source: J.P. Morgan
On the other hand, we argued that companies that are cash rich, or benefit from still high interest rates, will be well positioned.
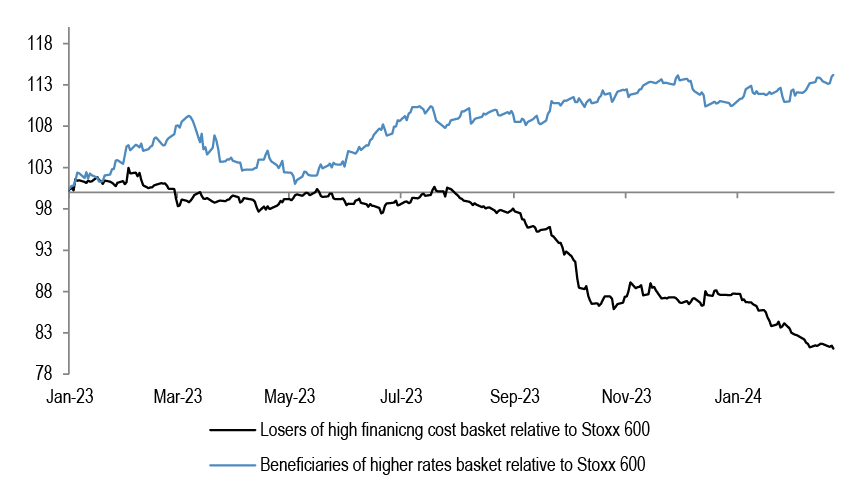
Figure 11: JPM Beneficiaries of higher rates basket relative
Source: Bloomberg Finance L.P.
This losers basket has lagged the Stoxx600 index by almost 20% over the last year, while beneficiaries basket is outperforming the Stoxx600 index by 14% since the start of last year. We believe this trend should continue, at least in the 1H of this year.
2) Corporate topline was very strong post COVID, with high pricing power, but these are not sustainable
Figure 12: USD GDP Deflator

Source: J.P. Morgan
Corporates benefitted from the very strong topline growth post COVID. Many had like-for-like sales growth of a magnitude never seen before. This was helped by strong consumer backdrop, supported by ample liquidity.
Figure 13: US Manufacturing PMI - Supplier Delivery Times

Source: J.P. Morgan
At the same time, the supply chain distortions created by COVID-related shutdowns created huge supply-demand imbalances. While this at face value increased costs and resulted in production outages in a wide range of industries, companies were able to more than offset any negative impact on their bottom-line through aggressive pricing.
Figure 14: US Retail trade - Motor Vehicle Inventory/sales

Source: J.P. Morgan
We believe that this period of very strong pricing power is ending. Inventory levels across a number of industries are normalising, as are sales.
Figure 15: MSCI World12m trailing EPS and Global PPI

Source: Datastream, J.P. Morgan
As PPIs turn negative, corporate earnings will likely follow.
Figure 16: MSCI Eurozone 12m trailing EPS and Euro area PPI

Source: Bloomberg Finance L.P., Datastream
Producer prices have seen bigger declines in the Euro Area, and the positive fit is as good.
3) ULCs could pick up as topline slows, and as wage costs are sticky
Figure 17: Unemployment rate and avg hourly earnings

Source: FRED
The strong improvement in productivity was a big factor behind the resilience in margins over the past year, but that could have been flattered by elevated topline growth, which was supported by one-off factors such as excess liquidity and the aggressive government spending. Even though the labour market was extremely tight and delivered higher wages, the strong output has kept unit labour costs in check.
Figure 18: Euro area negotiated pay growth

Source: J.P. Morgan
US wage growth has peaked, but could stay elevated for a while. Eurozone wage growth also appears to be peaking, but at elevated levels.
Figure 19: GDP Deflator minus ULCs - US
Source: J.P. Morgan, FRED
Looking forward, wages will likely remain sticky around current elevated levels, and productivity might slow, as topline slows. Our margin proxy (GDP deflator minus ULCs) has peaked and we believe it will continue to weaken further.
Earnings projections are continuing to be revised lower...
Figure 20: Weekly EPS revisions for key regions

Source: IBES
EPS revisions remain negative for all major markets, Japan being the notable exception, where we keep our key OW.
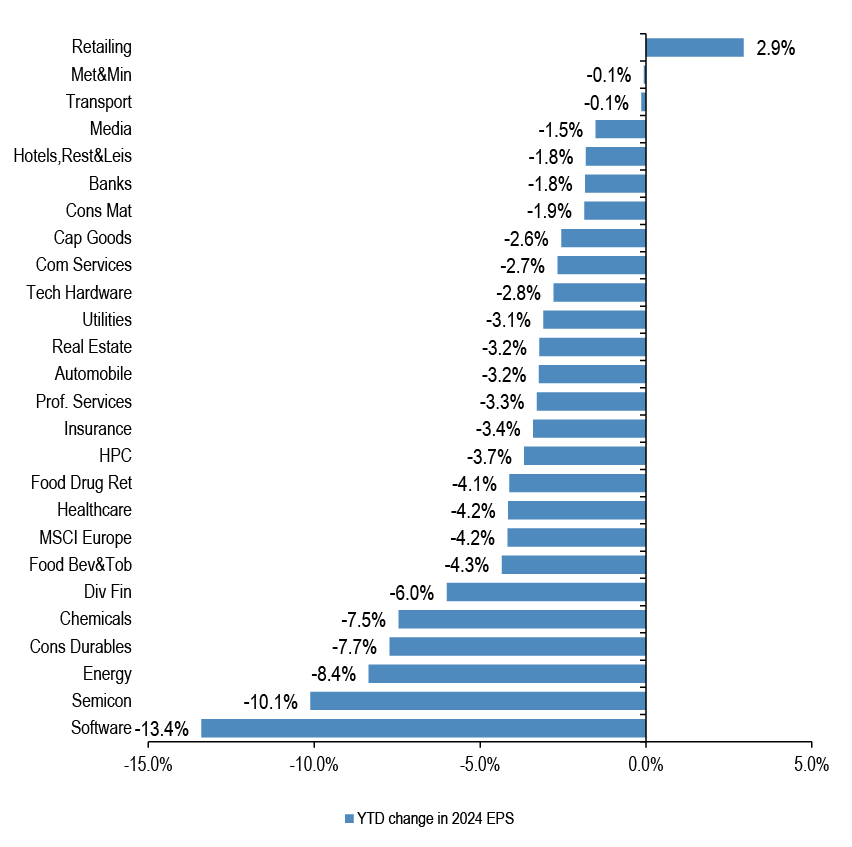
Figure 21: MSCI Europe sectors 2024 EPS - change ytd
Source: IBES
Except Retail, every European sector has seen cuts to its 2024 earnings projections in the last couple of months.
Figure 22: MSCI US sectors 2024 EPS change ytd

Source: IBES
Even in the US, which has delivered stronger EPS growth, most sectors have seen downgrades to 2024 earnings projections.
...all the EPS growth is still narrowly concentrated in the Magnificent 7...
Table 6: Q4 Earnings summary
| Q4 Earnings Summary | ||
| S&P500 | Stoxx600 | |
| % companies reported | 82% | 55% |
| % companies beating EPS | 77% | 52% |
| EPS %y/y | 7% | -11% |
| % companies beating Sales | 57% | 37% |
| Sales %y/y | 4% | -7% |
Source: J.P. Morgan, Bloomberg Finance L.P.
On the surface, S&P500 earnings delivery of 7% y/y in Q4 appears healthy.
Figure 23: S&P500 sector contribution to 4Q’23 earnings growth

Source: Bloomberg Finance L.P., J.P. Morgan
However, we note that ex the magnificent 7 (Apple, Microsoft, Amazon, Nvidia, Meta, Tesla and Alphabet), US earnings growth is actually negative at -4% y/y.
Table 7: Magnificent 7, SPX and SPX ex Mag 7 earnings growth
| 23e Net income growth | |
| APPLE | -2.8% |
| AMAZON.COM | - |
| MICROSOFT | 5.6% |
| NVIDIA | -25.7% |
| ALPHABET A | 21.9% |
| TESLA | -24.2% |
| META PLATFORMS A | 61.1% |
| Magnificent 7 | 18.2% |
| S&P ex Magnificent 7 | -4.1% |
| S&P500 | -1.0% |
Source: Datastream
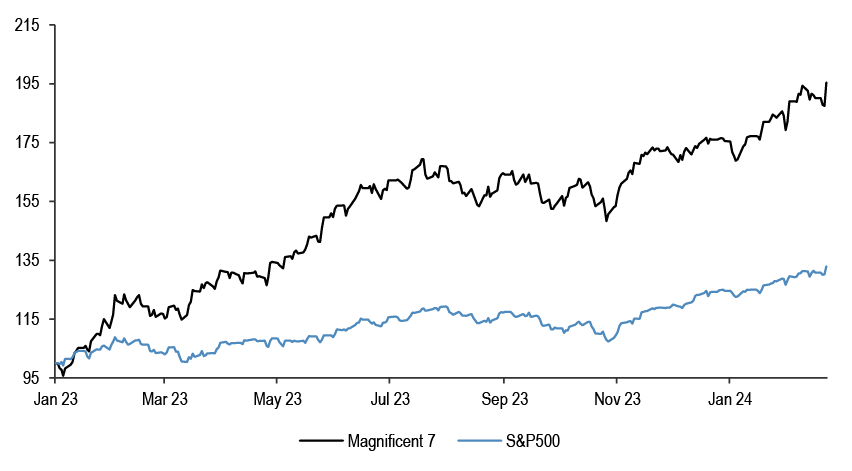
For the whole last year, Magnificent 7 earnings grew strongly, and the remaining 493 stocks recorded negative EPS growth.
Figure 24: Magnificent 7 and S&P500 performance
Source: Datastream
The divergence in earnings for the Magnificent 7 stocks and the rest of the market largely explains the wide divergence in relative performance over the last year.
...we maintain OW Growth vs Value stye...
Figure 25: MSCI World Growth vs Value 12m Fwd. EPS

Source: Datastream
Similarly, we note that Growth stocks have been delivering much better earnings compared to Value.
Figure 26: MSCI US and Europe Growth vs Value

Source: Datastream
This is behind our continued preference for Growth over Value style that we held through 2023, and are continuing this year.
...S&P500 earnings are more international than NIPA profits… if USD strengthens, S&P500 earnings might not be able to outperform NIPA
Figure 27: USD net positioning

Source: J.P. Morgan
The question is could S&P500 earnings perform better than NIPA profits. Perhaps not if USD strengthens, as S&P500 earnings are typically more international than NIPA profits. We note that USD positioning is not very stretched at present, and the interest rate differential could work in support of USD as we move through this year.
Equity Strategy Key Calls and Drivers
So far this year, US is ahead of International, Growth is outperforming Value, large caps are again beating small, and China continued struggling. We believe that this, ultimately unhealthy, high concentration and narrow leadership is set to continue until something breaks. To buy Value, beta and International stocks, one needs to see a reflationary backdrop, in our view, but we could have the exact opposite. The risk is of a disappointment on both sides of the Goldilocks narrative. Fed cuts might still be overdiscounted, despite the recent hawkish repricing, and the chances are that inflation picks up again, supply side driven, rather than due to stronger activity, freight rates have nearly tripled. We believe our long duration call made in October will have legs in 2024, but have argued at the start of this year that yields will likely consolidate near term, and the USD could be bottoming out. Regionally, we have preferred US to International stocks since May of last year, and don’t see that changing yet. We remain cautious on China, keep fading the bounces, and keep OW Japan – it remains our top regional pick. We are OW Growth vs Value, continuing our call from 2023, and continue to be UW Banks call started in Q4 of last year, after three years of Banks beating the market.
Table 8: J.P. Morgan Equity Strategy — Factors driving our medium-term views
| Driver | Impact | Our Core Working Assumptions | Recent Developments |
| Global Growth | Neutral | At risk of weakening as consumer strength wanes | Global composite PMI is at 51.8 |
| European Growth | Negative | Manufacturing and services are converging on the downside; industry data stays weak | |
| Monetary Policy | Neutral | Fed pivot could be accompanied by activity weakness | |
| Currency | Neutral | USD could strengthen again | |
| Earnings | Negative | Corporate pricing power is likely to weaken from here | 2024 EPS projections are continuing their downtrend |
| Valuations | Negative | At 21x, US forward P/E is still stretched, especially vs real yield | MSCI Europe on 13.5x Fwd P/E |
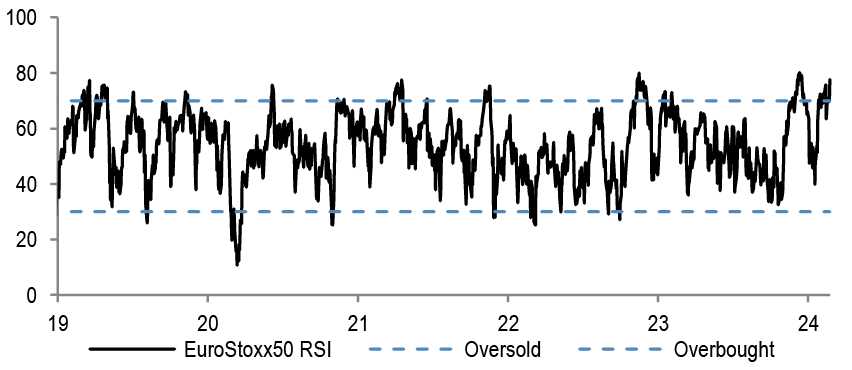
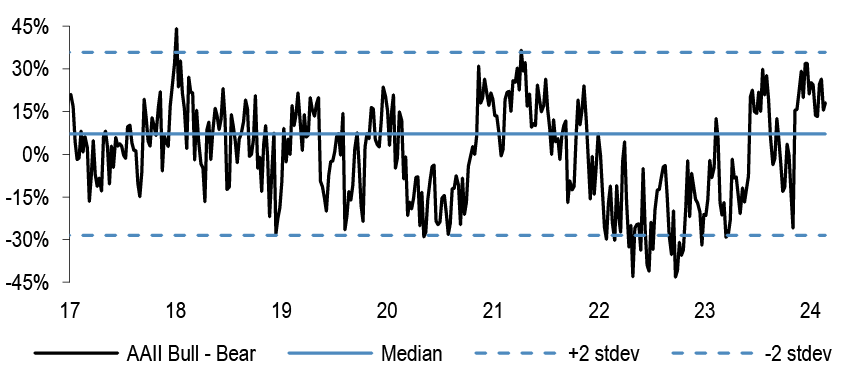
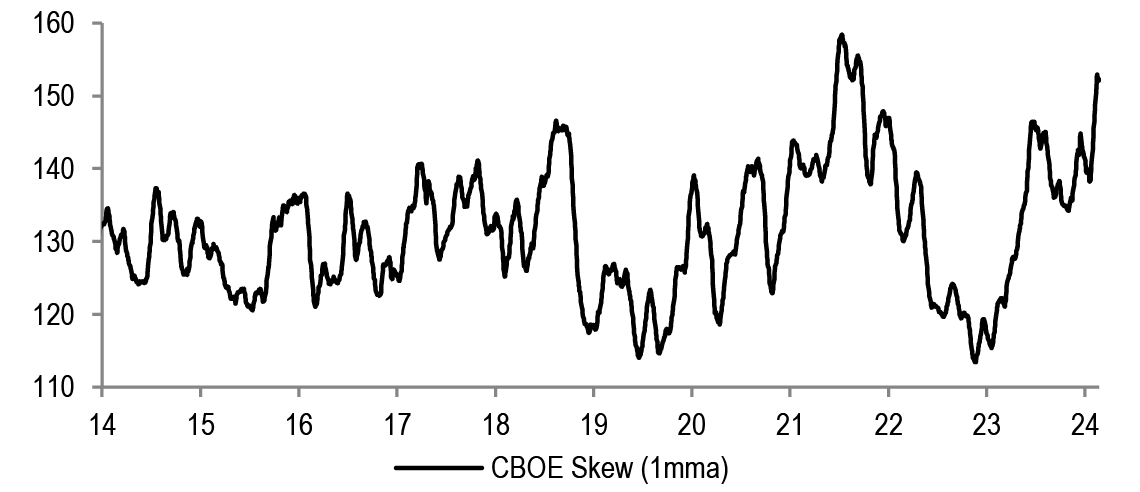
| Technicals | Negative | Sentiment and positioning are stretched post the Nov-Dec rally | RSIs are in overbought territory |
Source: J.P. Morgan estimates
Table 9: : Base Case and Risk
| Scenario | Assumption |
| Upside scenario | No further hawkish tilt by the Fed. No landing |
| Base-case scenario | Inflation to fall further, risk of downturn still elevated. Earnings downside from here |
| Downside scenario | Further Fed tightening and global recession to become a base case again |
Source: J.P. Morgan estimates.
Table 10: Index targets
| Dec '24 Target |
22-Feb-24 | % upside | |
| MSCI Eurozone | 256 | 286 | -11% |
| FTSE 100 | 7,700 | 7,684 | 0% |
| MSCI EUROPE | 1,850 | 1,986 | -7% |
| DJ EURO STOXX 50 | 4,250 | 4,855 | -12% |
| DJ STOXX 600 E | 460 | 495 | -7% |
Source: J.P. Morgan.
Table 11: Key Global sector calls
| Overweight | Neutral | Underweight |
| Healthcare | Technology | Capital Goods ex A&D |
| Telecoms | Discretionary | Food& Drug Retail |
| Food, Beverage & Tobacco | Mining | Autos |
| Real Estate | Transportation | Banks |
| Utilities |
Source: J.P. Morgan
Table 12: J.P. Morgan Equity Strategy — Key sector calls*
| Sector | Recommendations | Key Drivers |
| Healthcare | Overweight | Potential for lower yields and stronger dollar remain near term support, earnings are also holding up |
| Staples | Overweight | Sector is one of the best performers around the last Fed hike in the cycle, lower bond yields and better relative EPS momentum should further support |
| Banks | Underweight | Downgraded to UW in October after 3 years of strong performance. Bond yields and PMIs direction is the key for the potential P/E re-rating of the sector, we think both will move lower |
| Chemicals | Underweight | The sector trades at 70% premium to the market, well above historical norm. pricing continues to deteriorate, downside risks to current earnings and margin projections |
Source: J.P. Morgan estimates. * Please see the last page for the full list of our calls and sector allocation.
Table 13: J.P. Morgan Equity Strategy — Key regional calls
| Region | Recommendations | J.P. Morgan Views |
| EM | Neutral | China tactical chance for a bounce, but structural bearish call remains |
| DM | Neutral | |
| US | Neutral | Expensive, with earnings risk. However, if markets weaken in the first half, US could fare relatively better vs Eurozone |
| Japan | Overweight | Japan is attractively priced; diverging policy path and TSE reforms are tailwinds |
| Eurozone | Underweight | Growth-Policy trade-off likely to deteriorate further; Eurozone is typically a high beta on the way down |
| UK | Overweight | Valuations still look very attractive, low beta with the highest regional dividend yield |
Source: J.P. Morgan estimates.
Top Picks
Table 14: J.P. Morgan European Strategy: Top European picks
| Market Cap | EPS Growth | Dividend Yield | 12m Fwd P/E | Performance | |||||||||||
| Name | Ticker | Sector | Rating | Price | Currency | (€ Bn) | 23e | 24e | 25e | 24e | Current | 10Y Median | % Premium | -3m | -12m |
| ENI | ENI IM | Energy | OW | 14 | E | 48.0 | -35% | -8% | 2% | 6.5% | 6.3 | 12.7 | -51% | -3% | 1% |
| TOTALENERGIES | TTE FP | Energy | OW | 59 | E | 141.1 | -33% | -4% | 4% | 5.3% | 7.0 | 10.6 | -34% | -4% | 1% |
| SHELL | SHEL LN | Energy | OW | 30 | E | 189.6 | -23% | 0% | 5% | 4.0% | 7.7 | 11.2 | -32% | 0% | 6% |
| NOVOZYMES B | NZYMB DC | Materials | OW | 386 | DK | 24.2 | -18% | 17% | 10% | 1.1% | 29.8 | 29.2 | 2% | 7% | 10% |
| CRH PUBLIC LIMITED | CRH LN | Materials | OW | 78 | U$ | 49.7 | -11% | 10% | 9% | 1.8% | 15.5 | 15.1 | 3% | 28% | 69% |
| RIO TINTO | RIO LN | Materials | OW | 5170 | £ | 103.7 | -11% | 10% | -9% | 6.7% | 8.4 | 10.3 | -19% | -6% | -14% |
| NORSK HYDRO | NHY NO | Materials | OW | 57 | NK | 10.2 | -60% | 21% | 36% | 4.4% | 10.4 | 12.9 | -20% | -10% | -27% |
| ANGLO AMERICAN | AAL LN | Materials | OW | 1770 | £ | 25.4 | -52% | -5% | 5% | 4.1% | 10.0 | 9.5 | 4% | -21% | -43% |
| SCHNEIDER ELECTRIC | SU FP | Industrials | OW | 208 | E | 118.9 | 2% | 15% | 11% | 1.7% | 24.4 | 16.4 | 48% | 26% | 35% |
| ASHTEAD GROUP | AHT LN | Industrials | OW | 5524 | £ | 28.3 | 26% | 3% | 14% | 1.4% | 15.8 | 14.1 | 12% | 17% | 2% |
| RYANAIR HOLDINGS | RYA ID | Industrials | OW | 20 | E | 23.0 | - | 31% | 35% | 0.0% | 9.4 | 13.1 | -29% | 16% | 40% |
| AIRBUS | AIR FP | Industrials | OW | 147 | E | 116.4 | 10% | 3% | 25% | 1.7% | 21.6 | 18.4 | 18% | 10% | 20% |
| MTU AERO ENGINES HLDG. | MTX GR | Industrials | OW | 215 | E | 11.6 | 24% | 11% | 13% | 2.1% | 17.4 | 18.1 | -4% | 14% | -7% |
| STELLANTIS | STLAM IM | Discretionary | OW | 24 | E | 76.8 | 12% | -7% | 1% | 6.4% | 4.4 | 4.8 | -10% | 31% | 49% |
| BMW | BMW GR | Discretionary | OW | 105 | E | 66.6 | -34% | -10% | 2% | 5.3% | 6.4 | 7.7 | -17% | 11% | - |
| INDITEX | ITX SM | Discretionary | OW | 41 | E | 127.9 | 27% | 30% | 9% | 3.6% | 21.7 | 24.3 | -11% | 11% | 44% |
| ADIDAS | ADS GR | Discretionary | OW | 187 | E | 33.7 | -110% | - | 128% | 0.7% | 52.1 | 24.6 | 112% | 0% | 33% |
| RICHEMONT N | CFR SW | Discretionary | OW | 136 | SF | 84.2 | 78% | -2% | 11% | 1.8% | 20.1 | 20.4 | -2% | 19% | -6% |
| COMPASS GROUP | CPG LN | Discretionary | OW | 2203 | £ | 44.0 | 50% | 13% | 12% | 1.9% | 22.2 | 20.8 | 7% | 6% | 13% |
| COLRUYT GROUP | COLR BB | Staples | OW | 40 | E | 5.1 | -27% | 61% | 7% | 2.0% | 15.1 | 17.6 | -14% | 3% | 56% |
| ANHEUSER-BUSCH INBEV | ABI BB | Staples | OW | 58 | E | 118.1 | -7% | 15% | 14% | 2.1% | 18.0 | 19.5 | -8% | 1% | 3% |
| NOVO NORDISK 'B' | NOVOB DC | Health Care | OW | 853 | DK | 516.2 | 52% | 23% | 21% | 1.1% | 36.1 | 22.7 | 59% | 22% | 71% |
| ASTRAZENECA | AZN LN | Health Care | OW | 10036 | £ | 182.0 | 9% | 13% | 11% | 2.3% | 15.2 | 17.8 | -14% | -1% | -13% |
| SMITH & NEPHEW | SN/ LN | Health Care | OW | 1138 | £ | 11.6 | 12% | 12% | 8% | 2.8% | 13.7 | 18.4 | -26% | 10% | -7% |
| UBS GROUP | UBSG SW | Financials | OW | 25 | SF | 89.4 | -99% | 3670% | 99% | 2.5% | 21.1 | 10.4 | 104% | 6% | 23% |
| NATWEST GROUP | NWG LN | Financials | OW | 228 | £ | 23.3 | 38% | -27% | 12% | 7.4% | 5.9 | 10.4 | -43% | 12% | -20% |
| ING GROEP | INGA NA | Financials | OW | 13 | E | 44.3 | 106% | -12% | 11% | 8.7% | 6.7 | 9.1 | -27% | 0% | -1% |
| INTESA SANPAOLO | ISP IM | Financials | OW | 3 | E | 53.0 | 79% | 15% | 1% | 10.2% | 6.4 | 10.2 | -37% | 14% | 17% |
| LONDON STOCK EXCHANGE GROUP | LSEG LN | Financials | OW | 8844 | £ | 56.0 | 3% | 10% | 14% | 1.4% | 23.8 | 22.7 | 5% | 0% | 18% |
| AMUNDI (WI) | AMUN FP | Financials | OW | 62 | E | 12.6 | 4% | 4% | 7% | 6.7% | 9.7 | 12.7 | -23% | 11% | 1% |
| DASSAULT SYSTEMES | DSY FP | IT | OW | 43 | E | 57.9 | 6% | 7% | 11% | 0.6% | 33.0 | 31.5 | 5% | 1% | 15% |
| ASML HOLDING | ASML NA | IT | OW | 877 | E | 350.4 | 41% | -6% | 51% | 0.7% | 43.1 | 26.5 | 63% | 38% | 48% |
| ASM INTERNATIONAL | ASM NA | IT | OW | 558 | E | 27.6 | -3% | 8% | 29% | 0.6% | 39.7 | 16.2 | 146% | 22% | 78% |
| DEUTSCHE TELEKOM | DTE GR | Telecoms | OW | 22 | E | 111.5 | -10% | 10% | 13% | 3.8% | 12.1 | 14.3 | -15% | 3% | 6% |
| BT GROUP | BT/A LN | Telecoms | OW | 107 | £ | 12.5 | 9% | -11% | -1% | 7.2% | 5.7 | 8.9 | -35% | -12% | -24% |
| RELX | REL LN | Industrials | OW | 3475 | £ | 76.5 | 12% | 8% | 9% | 1.7% | 27.9 | 19.3 | 45% | 14% | 36% |
| HELLOFRESH | HFG GR | Staples | OW | 12 | E | 2.1 | -47% | 60% | 46% | 0.0% | 10.8 | 19.6 | -45% | -16% | -43% |
| RWE | RWE GR | Utilities | OW | 31 | E | 23.1 | 24% | -51% | -18% | 3.5% | 11.2 | 13.0 | -14% | -18% | -23% |
| ENEL | ENEL IM | Utilities | OW | 6 | E | 60.3 | 23% | 4% | 1% | 7.7% | 8.8 | 12.0 | -27% | -7% | 13% |
| SEGRO | SGRO LN | Real Estate | OW | 871 | £ | 12.5 | 6% | 7% | 7% | 3.2% | 24.7 | 25.3 | -2% | 6% | 5% |
Source: Datastream, MSCI, IBES, J.P. Morgan, Prices and Valuations as of COB 22nd Feb, 2024. Past performance is not indicative of future returns.
Please see the most recent company-specific research published by J.P. Morgan for an analysis of valuation methodology and risks on companies recommended in this report. Research is available at http://www.jpmorganmarkets.com, or you can contact the cover
Equity Flows Snapshot
Table 15: DM Equity Fund Flows Summary
| Regional equity fund flows | ||||||||||
| $mn | % AUM | |||||||||
| 1w | 1m | 3m | ytd | 12m | 1w | 1m | 3m | ytd | 12m | |
| Europe ex UK | -170 | -626 | -421 | -1,130 | -13,385 | 0.0% | 0.2% | -0.1% | 0.2% | 0.6% |
| UK | -204 | -1,291 | -5,453 | -1,706 | -27,686 | -0.1% | -0.2% | -0.1% | -0.3% | -4.3% |
| US | -15,608 | -5,327 | 85,647 | -10,252 | 98,959 | -0.1% | -0.5% | -2.2% | -0.6% | -9.8% |
| Japan | 1,066 | 4,555 | -3,691 | 4,236 | 11,862 | -0.2% | -0.1% | 1.0% | -0.1% | 1.2% |
Source: EPFR, as of 7th Feb, 2024
Figure 28: DM Equity Fund flows – last month

Source: EPFR, Japan includes BoJ purchases.
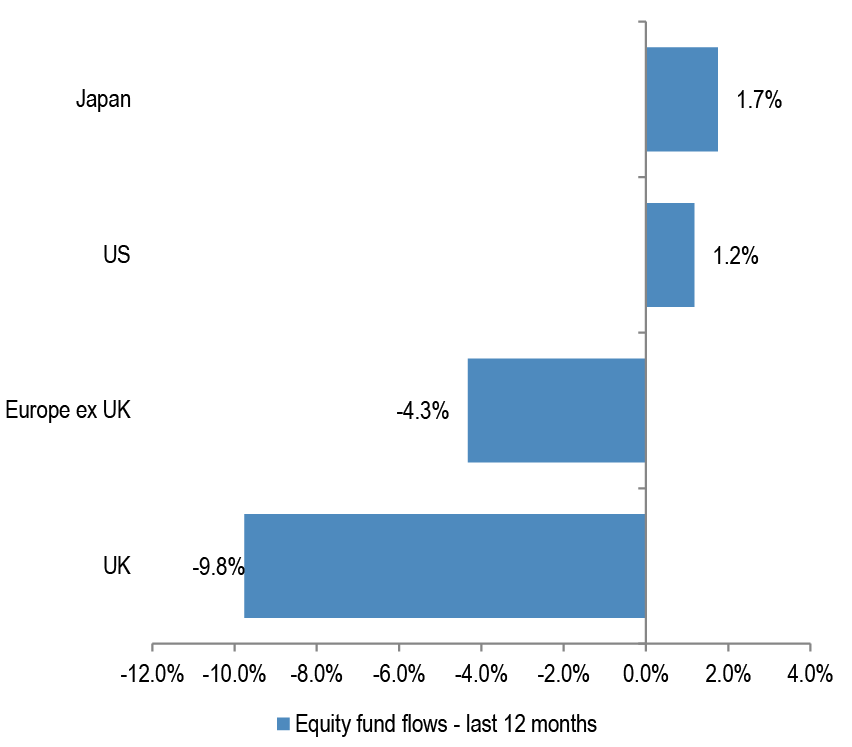
Figure 29: DM Equity Fund flows – last 12 months
Source: EPFR, Japan includes BoJ purchases.
Figure 30: Cumulative fund flows into regional funds as a percentage of AUM

Source: EPFR, as of 7th Feb, 2024. Japan includes Non-ETF purchases only.
Figure 31: Cumulative fund flows into regional equity ETFs as a percentage of AUM

Source: Bloomberg Finance L.P. *Based on the 25 biggest ETF's with a mandate to invest in that particular region. Japan includes BoJ purchases.
Technical Indicators
Figure 32: S&P500 RSI

Source: Bloomberg Finance L.P.
Figure 33: EuroStoxx50 RSI
Source: Bloomberg Finance L.P.
Figure 34: AAII Bull-Bear
Source: Bloomberg Finance L.P
Figure 35: Put-call ratio

Source: Bloomberg Finance L.P.
Figure 36: Sentix Sentiment Index vs SX5E

Source: Bloomberg Finance L.P.
Figure 37: Equity Skew
Source: Bloomberg Finance L.P.
Figure 38: Speculative positions in S&P500 futures contracts

Source: Bloomberg Finance L.P.
Figure 39: VIX

Source: Bloomberg Finance L.P.
Performance
Table 16: Sector Index Performances — MSCI Europe

Source: MSCI, Datastream, as at COB 22nd Feb, 2024.
Table 17: Country and Region Index Performances
| (%change) | Local Currency | US$ | |||||
| Country | Index | 4week | 12m | YTD | 4week | 12m | YTD |
| Austria | ATX | (0.7) | (1.3) | (0.6) | (0.9) | 0.4 | (2.8) |
| Belgium | BEL 20 | 1.8 | (5.0) | (0.3) | 1.6 | (3.3) | (2.4) |
| Denmark | KFX | 11.3 | 34.7 | 13.9 | 11.1 | 36.9 | 11.4 |
| Finland | HEX 20 | (2.6) | (12.0) | (2.0) | (2.8) | (10.5) | (4.1) |
| France | CAC 40 | 6.0 | 8.4 | 4.9 | 5.8 | 10.2 | 2.6 |
| Germany | DAX | 2.7 | 12.8 | 3.7 | 2.6 | 14.7 | 1.5 |
| Greece | ASE General | 4.9 | 28.9 | 9.8 | 4.7 | 31.1 | 7.4 |
| Ireland | ISEQ | 5.9 | 17.2 | 9.2 | 5.7 | 19.2 | 6.8 |
| Italy | FTSE MIB | 7.3 | 19.4 | 6.6 | 7.1 | 21.4 | 4.3 |
| Japan | Topix | 5.1 | 34.7 | 12.4 | 3.0 | 20.5 | 5.3 |
| Netherlands | AEX | 5.2 | 13.3 | 9.0 | 5.0 | 15.3 | 6.7 |
| Norway | OBX | (1.0) | (0.8) | (2.8) | (1.4) | (2.6) | (6.1) |
| Portugal | BVL GEN | (4.4) | (6.0) | (10.0) | (4.6) | (4.4) | (12.0) |
| Spain | IBEX 35 | 2.2 | 10.5 | 0.4 | 2.1 | 12.4 | (1.8) |
| Sweden | OMX | 2.7 | 9.1 | 1.3 | 3.8 | 9.8 | (1.3) |
| Switzerland | SMI | 1.6 | 0.8 | 2.2 | (0.0) | 6.2 | (2.4) |
| United States | S&P 500 | 3.9 | 27.5 | 6.7 | 3.9 | 27.5 | 6.7 |
| United States | NASDAQ | 3.4 | 39.4 | 6.9 | 3.4 | 39.4 | 6.9 |
| United Kingdom | FTSE 100 | 2.1 | (3.1) | (0.6) | 1.4 | 1.4 | (1.6) |
| EMU | MSCI EMU | 4.3 | 9.5 | 5.2 | 4.1 | 11.4 | 3.0 |
| Europe | MSCI Europe | 3.7 | 6.0 | 3.6 | 3.3 | 8.9 | 1.2 |
| Global | MSCI AC World | 3.9 | 22.3 | 6.1 | 3.7 | 21.9 | 5.1 |
Source: MSCI, Datastream, as at COB 22nd Feb, 2024.
Earnings
Table 18: IBES Consensus EPS Sector Forecasts — MSCI Europe
| EPS Growth (%yoy) | |||||
| 2023 | 2024E | 2025E | 2026E | ||
| Europe | (3.4) | 3.7 | 9.7 | 9.3 | |
| Energy | (32.1) | (3.3) | 3.3 | 12.2 | |
| Materials | (38.1) | 7.3 | 10.1 | 9.1 | |
| Chemicals | (34.7) | 18.0 | 17.8 | 12.8 | |
| Construction Materials | 10.9 | 6.2 | 8.9 | 0.1 | |
| Metals & Mining | (46.6) | 0.1 | 2.0 | 9.8 | |
| Industrials | (1.0) | 8.1 | 13.5 | 11.2 | |
| Capital Goods | 21.0 | 12.4 | 13.4 | 11.2 | |
| Transport | (56.1) | (20.7) | 18.5 | 11.9 | |
| Business Svs | 4.5 | 8.2 | 10.7 | 10.8 | |
| Discretionary | 7.1 | 2.4 | 10.2 | 9.4 | |
| Automobile | 1.2 | (3.5) | 5.1 | 6.4 | |
| Consumer Durables | (5.3) | 5.9 | 14.0 | 13.0 | |
| Media | (2.1) | 10.3 | 9.3 | 10.1 | |
| Retailing | 52.0 | 14.4 | 17.1 | 4.8 | |
| Hotels,Restaurants&Leisure | 90.2 | 17.8 | 20.4 | 19.5 | |
| Staples | 2.6 | 3.8 | 8.5 | 7.9 | |
| Food & Drug Retailing | 3.1 | 6.2 | 12.0 | 7.4 | |
| Food Beverage & Tobacco | 2.0 | 2.8 | 8.2 | 8.2 | |
| Household Products | 4.2 | 5.8 | 8.1 | 7.4 | |
| Healthcare | 2.6 | 5.9 | 14.0 | 11.0 | |
| Financials | 15.5 | 6.2 | 7.7 | 7.3 | |
| Banks | 29.0 | 0.9 | 4.4 | 4.6 | |
| Diversified Financials | (22.3) | 20.5 | 22.2 | 23.1 | |
| Insurance | 12.0 | 12.8 | 7.8 | 4.7 | |
| Real Estate | 12.2 | (4.2) | 4.5 | 3.3 | |
| IT | 22.2 | (10.8) | 27.8 | 15.3 | |
| Software and Services | 46.2 | (18.6) | 20.5 | 12.9 | |
| Technology Hardware | (20.8) | 11.5 | 8.2 | 9.4 | |
| Semicon & Semicon Equip | 28.1 | (12.0) | 40.2 | 18.5 | |
| Telecoms | (10.5) | 14.3 | 10.1 | 8.2 | |
| Utilities | 3.0 | (2.5) | 1.2 | 1.7 | |
Source: IBES, MSCI, Datastream. As at COB 22nd Feb, 2024.
Table 19: IBES Consensus EPS Country Forecasts
| EPS growth (%change) | |||||
| Country | Index | 2023 | 2024E | 2025E | 2026E |
| Austria | ATX | (14.7) | (6.0) | 3.7 | (2.2) |
| Belgium | BEL 20 | 15.7 | 2.9 | 11.1 | 13.1 |
| Denmark | Denmark KFX | (14.8) | 26.1 | 20.8 | 16.3 |
| Finland | MSCI Finland | (25.1) | 5.9 | 10.9 | 9.2 |
| France | CAC 40 | (1.9) | 2.3 | 8.6 | 9.4 |
| Germany | DAX | 3.6 | (0.5) | 11.7 | 9.5 |
| Greece | MSCI Greece | 8.4 | (2.5) | 5.3 | 22.0 |
| Ireland | MSCI Ireland | 35.3 | (3.2) | 1.7 | 8.9 |
| Italy | MSCI Italy | 9.8 | (0.4) | 2.0 | 4.3 |
| Netherlands | AEX | (1.9) | 0.8 | 13.2 | 11.0 |
| Norway | MSCI Norway | (40.0) | 4.9 | 5.2 | 2.2 |
| Portugal | MSCI Portugal | 33.4 | 3.4 | 6.0 | 7.9 |
| Spain | IBEX 35 | 6.2 | 2.2 | 4.5 | 5.4 |
| Sweden | OMX | 31.9 | 0.5 | 8.1 | 7.1 |
| Switzerland | SMI | (3.2) | 9.4 | 13.2 | 9.5 |
| United Kingdom | FTSE 100 | (12.1) | 3.1 | 7.7 | 10.1 |
| EMU | MSCI EMU | 4.3 | 2.8 | 9.8 | 8.5 |
| Europe ex UK | MSCI Europe ex UK | 0.9 | 4.0 | 10.6 | 8.9 |
| Europe | MSCI Europe | (3.4) | 3.7 | 9.7 | 9.3 |
| United States | S&P 500 | 2.2 | 9.6 | 13.5 | 11.5 |
| Japan | Topix | 3.0 | 14.4 | 8.5 | 8.9 |
| Emerging Market | MSCI EM | (4.0) | 16.2 | 15.3 | 12.2 |
| Global | MSCI AC World | 0.3 | 8.8 | 12.6 | 10.8 |
Source: IBES, MSCI, Datastream. As at COB 22nd Feb, 2024** Japan refers to the period from March in the year stated to March in the following year – EPS post-goodwill
Valuations
Table 20: IBES Consensus European Sector Valuations
| P/E | Dividend Yield | EV/EBITDA | Price to Book | |||||||||
| 2024e | 2025e | 2026e | 2024e | 2025e | 2026e | 2024e | 2025e | 2026e | 2024e | 2025e | 2026e | |
| Europe | 13.8 | 12.5 | 11.5 | 3.5% | 3.7% | 4.6% | 7.9 | 7.3 | 6.9 | 1.9 | 1.8 | 1.7 |
| Energy | 7.2 | 7.0 | 6.3 | 5.7% | 5.7% | 5.8% | 3.2 | 3.2 | 3.1 | 1.1 | 1.0 | 1.0 |
| Materials | 14.7 | 13.4 | 12.3 | 3.4% | 3.7% | 3.9% | 7.2 | 6.5 | 5.9 | 1.6 | 1.5 | 1.4 |
| Chemicals | 22.7 | 19.3 | 17.1 | 2.8% | 3.0% | 3.2% | 11.1 | 10.0 | 9.1 | 2.3 | 2.2 | 2.1 |
| Construction Materials | 13.2 | 12.1 | 12.1 | 3.0% | 3.1% | 3.2% | 6.8 | 6.3 | 4.3 | 1.5 | 1.4 | 0.8 |
| Metals & Mining | 9.1 | 8.9 | 8.1 | 4.6% | 4.9% | 5.3% | 4.5 | 4.1 | 3.6 | 1.1 | 1.0 | 1.0 |
| Industrials | 19.3 | 17.0 | 15.3 | 2.4% | 2.6% | 7.9% | 9.8 | 8.9 | 8.0 | 3.2 | 3.0 | 2.8 |
| Capital Goods | 19.0 | 16.8 | 15.1 | 2.3% | 2.6% | 9.3% | 10.1 | 9.0 | 8.1 | 3.3 | 3.1 | 2.9 |
| Transport | 17.8 | 15.0 | 13.1 | 3.2% | 3.4% | 3.4% | 7.2 | 6.8 | 5.8 | 1.7 | 1.7 | 1.6 |
| Business Svs | 22.4 | 20.2 | 18.2 | 2.3% | 2.5% | 2.7% | 13.0 | 11.8 | 10.8 | 6.2 | 5.6 | 4.9 |
| Discretionary | 13.8 | 12.5 | 11.4 | 2.7% | 3.0% | 3.1% | 5.3 | 4.7 | 4.8 | 1.9 | 1.8 | 1.8 |
| Automobile | 6.4 | 6.1 | 5.8 | 5.0% | 5.3% | 5.3% | 1.8 | 1.3 | 2.0 | 0.8 | 0.7 | 0.7 |
| Consumer Durables | 24.7 | 21.7 | 19.3 | 1.7% | 2.0% | 2.1% | 13.8 | 12.5 | 11.4 | 4.4 | 4.0 | 3.6 |
| Media & Entertainment | 16.8 | 15.4 | 13.4 | 2.3% | 2.5% | 2.6% | 11.6 | 9.6 | 8.6 | 1.9 | 1.8 | 4.0 |
| Retailing | 14.4 | 12.3 | 11.8 | 2.5% | 2.8% | 3.1% | 9.8 | 8.7 | 7.1 | 2.7 | 2.6 | 2.1 |
| Hotels,Restaurants&Leisure | 23.8 | 19.7 | 16.5 | 2.1% | 2.4% | 2.8% | 12.1 | 10.4 | 9.5 | 4.0 | 3.6 | 3.5 |
| Staples | 17.2 | 15.8 | 14.6 | 3.1% | 3.3% | 3.6% | 10.8 | 10.1 | 9.4 | 2.9 | 2.7 | 2.6 |
| Food & Drug Retailing | 12.0 | 10.7 | 10.0 | 3.9% | 4.3% | 4.7% | 6.1 | 5.7 | 5.8 | 1.6 | 1.5 | 1.3 |
| Food Beverage & Tobacco | 16.7 | 15.4 | 14.2 | 3.5% | 3.7% | 4.0% | 10.7 | 10.0 | 9.0 | 2.6 | 2.5 | 2.3 |
| Household Products | 20.5 | 19.0 | 17.7 | 2.3% | 2.5% | 2.7% | 14.0 | 13.0 | 12.5 | 4.2 | 3.9 | 3.9 |
| Healthcare | 17.5 | 15.3 | 13.8 | 2.5% | 2.7% | 2.8% | 12.2 | 10.8 | 9.9 | 3.4 | 3.1 | 3.0 |
| Financials | 8.6 | 8.0 | 7.4 | 5.8% | 6.0% | 6.5% | - | - | - | 1.0 | 1.0 | 0.9 |
| Banks | 6.5 | 6.2 | 6.0 | 8.0% | 8.0% | 8.5% | - | - | - | 0.7 | 0.7 | 0.6 |
| Diversified Financials | 14.3 | 11.7 | 9.7 | 2.5% | 2.8% | 3.1% | - | - | - | 1.3 | 1.4 | 1.3 |
| Insurance | 10.5 | 9.7 | 9.2 | 5.5% | 5.8% | 6.1% | - | - | - | 1.6 | 1.5 | 1.4 |
| Real Estate | 14.0 | 13.4 | 12.9 | 4.4% | 4.6% | 4.9% | - | - | - | 0.8 | 0.8 | 0.8 |
| IT | 30.0 | 23.5 | 20.3 | 1.2% | 1.3% | 1.4% | 17.7 | 14.1 | 12.1 | 5.1 | 4.6 | 4.0 |
| Software and Services | 30.2 | 25.1 | 22.2 | 1.3% | 1.4% | 1.5% | 19.0 | 15.5 | 13.4 | 4.5 | 4.2 | 3.7 |
| Technology Hardware | 15.5 | 14.3 | 13.1 | 2.7% | 2.7% | 2.9% | 8.8 | 8.0 | 6.8 | 1.9 | 1.7 | 1.6 |
| Semicon & Semicon Equip | 35.4 | 25.2 | 21.3 | 0.8% | 1.0% | 1.1% | 20.8 | 15.4 | 13.1 | 8.4 | 7.1 | 5.9 |
| Communication Services | 14.2 | 12.9 | 11.7 | 4.3% | 4.4% | 4.6% | 6.6 | 6.1 | 5.7 | 1.4 | 1.3 | 1.4 |
| Utilities | 11.8 | 11.7 | 11.5 | 5.4% | 5.6% | 5.6% | 7.9 | 7.9 | 8.2 | 1.5 | 1.4 | 1.4 |
Source: IBES, MSCI, Datastream. As at COB 22nd Feb, 2024.
Table 21: IBES Consensus P/E and 12-Month Forward Dividend Yields — Country Forecasts
| P/E | Dividend Yield | |||||
| Country | Index | 12mth Fwd | 2024E | 2025E | 2026E | 12mth Fwd |
| Austria | ATX | 7.5 | 7.5 | 7.3 | 7.1 | 6.1% |
| Belgium | BEL 20 | 15.4 | 15.7 | 14.1 | 12.3 | 3.1% |
| Denmark | Denmark KFX | 27.7 | 28.6 | 23.7 | 20.4 | 1.7% |
| Finland | MSCI Finland | 14.5 | 14.8 | 13.3 | 12.2 | 4.6% |
| France | CAC 40 | 13.1 | 13.3 | 12.2 | 11.2 | 3.3% |
| Germany | DAX | 11.8 | 12.1 | 10.8 | 9.9 | 3.5% |
| Greece | MSCI Greece | 30.9 | 31.2 | 29.6 | 20.6 | 1.7% |
| Ireland | MSCI Ireland | 10.6 | 10.7 | 10.5 | 9.6 | 3.7% |
| Italy | MSCI Italy | 8.7 | 8.8 | 8.6 | 8.2 | 5.7% |
| Netherlands | AEX | 15.0 | 15.3 | 13.5 | 12.4 | 2.5% |
| Norway | MSCI Norway | 10.1 | 10.2 | 9.7 | 9.5 | 6.8% |
| Portugal | MSCI Portugal | 13.8 | 14.0 | 13.2 | 12.2 | 4.1% |
| Spain | IBEX 35 | 10.5 | 10.6 | 10.2 | 9.6 | 5.1% |
| Sweden | OMX | 15.0 | 15.2 | 14.1 | 13.3 | 3.8% |
| Switzerland | SMI | 16.9 | 17.3 | 15.3 | 13.9 | 3.4% |
| United Kingdom | FTSE 100 | 10.8 | 11.0 | 10.2 | 9.2 | 4.3% |
| EMU | MSCI EMU | 13.0 | 13.2 | 12.0 | 11.1 | 3.5% |
| Europe ex UK | MSCI Europe ex UK | 14.5 | 14.8 | 13.4 | 12.3 | 3.3% |
| Europe | MSCI Europe | 13.5 | 13.8 | 12.5 | 11.5 | 3.6% |
| United States | S&P 500 | 20.7 | 21.4 | 18.8 | 16.8 | 1.5% |
| Japan | Topix | 15.0 | 16.2 | 14.9 | 13.7 | 2.3% |
| Emerging Market | MSCI EM | 11.6 | 11.9 | 10.6 | 9.3 | 3.1% |
| Global | MSCI AC World | 17.1 | 17.5 | 16.0 | 14.3 | 2.1% |
Source: IBES, MSCI, Datastream. As at COB 22nd Feb, 2024; ** Japan refers to the period from March in the year stated to March in the following year – P/E post goodwill.
Economic, Interest Rate and Exchange Rate Outlook
Table 22: Economic Outlook in Summary
| Real GDP | Real GDP | Consumer prices | |||||||||||
| % oya | % over previous period, saar | % oya | |||||||||||
| 2023E | 2024E | 2025E | 3Q23 | 4Q23 | 1Q24E | 2Q24E | 3Q24E | 4Q24E | 3Q23 | 1Q24E | 3Q24E | 1Q25E | |
| United States | 2.5 | 2.0 | 1.5 | 4.9 | 3.3 | 1.7 | 0.5 | 0.5 | 0.7 | 3.6 | 3.0 | 2.8 | 2.5 |
| Eurozone | 0.5 | 0.4 | 1.0 | -0.5 | 0.2 | 0.5 | 0.7 | 0.7 | 0.7 | 5.0 | 2.6 | 2.1 | 1.9 |
| United Kingdom | 0.1 | 0.0 | 0.1 | -0.5 | -1.4 | 1.0 | 0.8 | 0.0 | -0.5 | 6.7 | 3.6 | 1.7 | 2.3 |
| Japan | 1.9 | 0.5 | 0.7 | -3.3 | -0.4 | 1.3 | 1.6 | 0.7 | 0.7 | 3.1 | 2.6 | 2.3 | 2.1 |
| Emerging markets | 4.1 | 3.8 | 3.6 | 5.7 | 3.6 | 4.0 | 3.6 | 3.7 | 3.6 | 3.8 | 3.8 | 3.5 | 3.5 |
| Global | 2.7 | 2.3 | 2.2 | 3.5 | 2.5 | 2.4 | 1.9 | 1.9 | 2.0 | 4.0 | 3.3 | 2.9 | 2.8 |
Source: J.P. Morgan economic research J.P. Morgan estimates, as of COB 16th Feb, 2024
Table 23: Official Rates Outlook
| Forecast for | ||||||||
| Official interest rate | Current | Last change (bp) | Forecast next change (bp) | Mar 24 | Jun 24 | Sep 24 | Dec 24 | |
| United States | Federal funds rate | 5.50 | 26 Jul 23 (+25bp) | Jun 24 (-25bp) | 5.50 | 5.25 | 4.75 | 4.25 |
| Eurozone | Depo rate | 4.00 | 14 Sep 23 (+25bp) | Jun 24 (-25bp) | 4.00 | 3.75 | 3.50 | 3.00 |
| United Kingdom | Bank Rate | 5.25 | 03 Aug 23 (+25bp) | Aug 24 (-25bp) | 5.25 | 5.25 | 5.00 | 4.50 |
| Japan | Pol rate IOER | -0.10 | Jan 16 (-20bp) | 3Q24 (+10bp) | -0.10 | -0.10 | 0.00 | 0.00 |
Source: J.P. Morgan estimates, Datastream, as of COB 16th Feb, 2024
Table 24: 10-Year Government Bond Yield Forecasts
| 10 Yr Govt BY | Forecast for end of | ||||
| 23-Feb-24 | Mar 24 | Jun 24 | Sep 24 | Dec 24 | |
| US | 4.33 | 3.95 | 3.80 | 3.75 | 3.65 |
| Euro Area | 2.45 | 2.15 | 2.00 | 1.85 | 1.75 |
| United Kingdom | 4.11 | 3.80 | 3.65 | 3.55 | 3.45 |
| Japan | 0.72 | 0.60 | 0.65 | 0.80 | 0.80 |
Source: J.P. Morgan estimates, Datastream, forecasts as of COB 9th Feb, 2024
Table 25: Exchange Rate Forecasts vs. US Dollar
| Exchange rates vs US$ | Forecast for end of | ||||
| 22-Feb-24 | Mar 24 | Jun 24 | Sep 24 | Dec 24 | |
| EUR | 1.08 | 1.03 | 1.05 | 1.10 | 1.13 |
| GBP | 1.26 | 1.18 | 1.19 | 1.24 | 1.26 |
| CHF | 0.88 | 0.92 | 0.90 | 0.86 | 0.85 |
| JPY | 151 | 150 | 148 | 146 | 144 |
| DXY | 104.0 | 108.2 | 106.5 | 102.5 | 100.1 |
Source: J.P. Morgan estimates, Datastream, forecasts as of COB 9th Feb, 2024
Sector, Regional and Asset Class Allocations
Table 26: J.P. Morgan Equity Strategy — European Sector Allocation
| MSCI Europe Weights | Allocation | Deviation | Recommendation | ||
| Energy | 6.1% | 8.0% | 1.9% | OW | |
| Materials | 7.1% | 6.0% | -1.1% | N | |
| Chemicals | UW | ||||
| Construction Materials | N | ||||
| Metals & Mining | N | ||||
| Industrials | 15.3% | 14.0% | -1.3% | N | |
| Capital Goods ex Aerospace & Defence | UW | ||||
| Aerospace & Defence | OW | ||||
| Transport | N | ||||
| Business Services | N | ||||
| Consumer Discretionary | 9.4% | 7.0% | -2.4% | UW | |
| Automobile | UW | ||||
| Consumer Durables | N | ||||
| Consumer Srvcs | UW | ||||
| Speciality Retail | UW | ||||
| Internet Retail | UW | ||||
| Consumer Staples | 11.9% | 13.0% | 1.1% | OW | |
| Food & Drug Retailing | UW | ||||
| Beverages | OW | ||||
| Food & Tobacco | OW | ||||
| Household Products | OW | ||||
| Healthcare | 15.5% | 18.0% | 2.5% | OW | |
| Financials | 17.9% | 14.0% | -3.9% | UW | |
| Banks | UW | ||||
| Insurance | N | ||||
| Real Estate | 0.8% | 2.0% | 1.2% | OW | |
| Information Technology | 7.2% | 7.0% | -0.2% | N | |
| Software and Services | N | ||||
| Technology Hardware | N | ||||
| Semicon & Semicon Equip | UW | ||||
| Communication Services | 4.5% | 5.0% | 0.5% | OW | |
| Telecommunication Services | OW | ||||
| Media | N | ||||
| Utilities | 4.3% | 6.0% | 1.7% | OW | |
| 100.0% | 100.0% | 0.0% | Balanced |
Source: MSCI, Datastream, J.P. Morgan.
Table 27: J.P. Morgan Equity Strategy — Global Regional Allocation
| MSCI Weight | Allocation | Deviation | Recommendation | |
| EM | 10.6% | 10.0% | -0.6% | Neutral |
| DM | 89.4% | 90.0% | 0.6% | Neutral |
| US | 70.1% | 68.0% | -2.1% | Neutral |
| Japan | 6.1% | 8.0% | 1.9% | Overweight |
| Eurozone | 5.4% | 6.0% | 0.6% | Underweight |
| UK | 2.4% | 6.0% | 3.6% | Overweight |
| Others* | 16.0% | 12.0% | -4.0% | Overweight |
| 100.0% | 100.0% | 0.0% | Balanced |
Source: MSCI, J.P. Morgan *Other includes Denmark, Switzerland, Australia, Canada, Hong Kong SAR, Sweden, Singapore, New Zealand, Israel and Norway
Table 28: J.P. Morgan Equity Strategy — European Regional Allocation
| MSCI Weight | Allocation | Deviation | Recommendation | |
| Eurozone | 51.1% | 47.0% | -4.1% | Underweight |
| United Kingdom | 22.8% | 26.0% | 3.2% | Overweight |
| Others** | 26.2% | 27.0% | 0.8% | Overweight |
| 100.0% | 100.0% | Balanced |
Source: MSCI, J.P. Morgan **Other includes Denmark, Switzerland, Sweden and Norway
Table 29: J.P. Morgan Equity Strategy — Asset Class Allocation
| Benchmark weighting | Allocation | Deviation | Recommendation | |
| Equities | 60% | 55% | -5% | Underweight |
| Bonds | 30% | 35% | 5% | Overweight |
| Cash | 10% | 10% | 0% | Neutral |
| 100% | 100% | 0% | Balanced |
Source: MSCI, J.P. Morgan

Click here for our weekly podcast
Anamil Kochar (anamil.kochar@jpmchase.com) of J.P. Morgan India Private Limited is a co-author of this report.